Download Multi Data Viewer Light
Transcript
EQUO Series Multi Data Viewer Light ユーザーズマニュアル User’s Manual ASC-DE-121119-8 Rev.C Introduction Thank you for purchasing our EQUO Series product. This manual describes the information on the functions, performance and usage required to use Multi Data Viewer Light. Trademarks ・Microsoft and Windows are registered trademarks or trademarks of Microsoft Corporation in the United States and other countries. ・Other company names and product names are registered trademarks or trademarks of the respective company. i Software License Agreement This is a binding agreement between OMRON Corporation ("OMRON") and you (the "User") on the terms and conditions of the license of the Software. 1. In this Agreement, "Software" means the computer program and related documentation contained in this package. The "Software" shall include any derivative works thereto. Copyright of the Software remains the sole property of OMRON or the third party who has licensed the Software to OMRON and shall not be assigned to the User under this Agreement. 2. OMRON grants the User a non-exclusive, non-transferable and limited license to use the Software on one computer owned by the User. 3. The User shall not sub-license, assign nor lease the Software to any third party without prior written consent of OMRON. 4. The User may copy the Software for back-up purpose only. The User may not de-compile, reverse engineer nor otherwise attempt to discern the source code of the Software. 5. The User may modify the Software and the modified Software shall be subject to the terms and conditions of this Agreement, provided however that, OMRON shall not assume any liability for any modified Software. 6. The User shall treat any information contained in the Software as confidential and shall not disclose it to any third party. This obligation shall survive the termination of this Agreement. 7. OMRON warrants to the User that, for a period of one (1) year, the Software will perform substantially in accordance with the user manual provided. If the User discovers defect of the Software (substantial non-conformity with the manual), and return it to OMRON within the said one (1) year period, OMRON will replace the Software without charge. The User acknowledges that all errors or bugs of the Software may not be removed by such replacement. 8. THE ABOVE REPLACEMENT SHALL CONSTITUTE THE USER'S SOLE AND EXCLUSIVE REMEDIES AGAINST OMRON AND THERE ARE NO OTHER WARRANTIES, EXPRESSED OR IMPLIED, INCLUDING BUT NOT LIMITED TO, WARRANTY OF MERCHANTABILITY OR FITNESS FOR PARTICULAR PURPOSE. IN NO EVENT, OMRON WILL BE LIABLE FOR ANY LOST PROFITS OR OTHER INDIRECT, INCIDENTAL, SPECIAL OR CONSEQUENTIAL DAMAGES ARISING OUT OF THIS AGREEMENT OR USE OF THE SOFTWARE. (C)Copyright OMRON CORPORATION 2012-2013 All Rights Reserved ii How to Read This Manual ■Symbols Used in this Manual Menu items that are displayed on the screen, and windows, dialog boxes and other GUI elements displayed on the PC are indicated enclosed by brackets "[ ]". ■Marks Used in this Manual Important: Indicates essential information on the product operation and functions, which requires special attention or caution. Note: Shows operational tips or related useful information. iii Table of Contents Introduction ....................................................................................................................................... i Software License Agreement ............................................................................................................ ii How to Read This Manual ............................................................................................................... iii Table of Contents ............................................................................................................................. iv 1. 2. Overview of Multi Data Viewer ............................................................................................... 1-1 1.1 Features ................................................................................................................................ 1-1 1.2 Procedure to Use ................................................................................................................... 1-2 1.3 Operating Environment ....................................................................................................... 1-3 1.4 Installation ............................................................................................................................ 1-4 1.5 Startup .................................................................................................................................. 1-8 1.6 Uninstallation ....................................................................................................................... 1-8 Setting/Logging Tool: Setting Manager ....................................................................................... 2-1 2.1 Setting Manager ................................................................................................................... 2-1 2.1.1 Setting Manager System Configuration............................................................................ 2-2 2.2 Setting Manager Specifications ........................................................................................... 2-3 2.3 Setting Manager Basic Operation Flow .............................................................................. 2-4 2.4 Setting Manager Operation Quick Reference Guide .......................................................... 2-5 2.5 Starting/Exiting Setting Manager ....................................................................................... 2-7 2.5.1 Starting Setting Manager .................................................................................................. 2-7 2.5.2 Exiting Setting Manager .................................................................................................... 2-7 2.6 Setting Manager Window Configuration ............................................................................ 2-8 2.6.1 Setting Manager Toolbar Functions .................................................................................. 2-9 2.7 Acquiring Device Status ..................................................................................................... 2-10 2.8 Creating/Saving a Setting Manager Project ..................................................................... 2-11 2.8.1 Creating a New Project .................................................................................................... 2-11 2.8.2 Opening/Closing a Project ................................................................................................ 2-11 2.8.3 Saving a Project ................................................................................................................ 2-11 2.8.4 Exiting Setting Manager .................................................................................................. 2-11 iv 2.9 Settings (Setting Menu Area) ............................................................................................ 2-12 2.9.1 Functions in Setting Menu Area ...................................................................................... 2-12 2.9.2 Creating/Saving a Setting Manager Project Making Project Settings.......................... 2-13 2.9.3 Setting Devices ................................................................................................................. 2-14 (1) Adding a Device ............................................................................................................. 2-15 (2) Editing a Device ............................................................................................................. 2-18 (3) Deleting Devices ............................................................................................................ 2-21 2.9.4 Setting Channels .............................................................................................................. 2-22 (1) Adding a Channel .......................................................................................................... 2-23 (2) Deleting Channels ......................................................................................................... 2-23 (3) Editing a Channel.......................................................................................................... 2-23 2.9.5 Setting Connection Units (For Wireless Connection) ..................................................... 2-24 2.10 (1) Adding a Connection Unit ............................................................................................. 2-25 (2) Editing Connected Device Settings .............................................................................. 2-26 Logging (Logger Menu) ...................................................................................................... 2-27 2.10.1 Connecting Setting Manager Online ............................................................................. 2-27 2.10.2 Saving Settings in Loggers ............................................................................................ 2-27 2.10.3 Starting/Ending Connection Test .................................................................................. 2-27 2.10.4 Starting Logging ............................................................................................................. 2-28 2.10.5 Stopping Logging ............................................................................................................ 2-28 2.10.6 Reading Settings from Loggers ...................................................................................... 2-28 2.10.7 Disconnecting Setting Manager (Offline) ...................................................................... 2-28 2.11 Other Setting Manager Operation .................................................................................... 2-29 2.11.1 Displaying Setting Manager Version and Copyright Information (Help Menu) ...................... 2-29 3. Summary/Display Tool: Multi Data Viewer ............................................................................ 3-1 3.1 Multi Data Viewer ................................................................................................................ 3-1 3.2 Multi Data Viewer Specifications ........................................................................................ 3-2 3.3 Multi Data Viewer Basic Operation Flow ........................................................................... 3-3 3.4 Multi Data Viewer Operation Quick Reference Guide ....................................................... 3-4 3.5 Preparing Logging Data ....................................................................................................... 3-6 3.5.1 Logging Data Collected by Setting Manager Logger Function........................................ 3-6 3.5.2 Logging Data Collected by EQUO Devices ....................................................................... 3-6 3.6 Starting/Exiting Multi Data Viewer .................................................................................... 3-7 3.6.1 Starting Multi Data Viewer ............................................................................................... 3-7 3.6.2 Exiting Multi Data Viewer ................................................................................................. 3-7 3.7 Multi Data Viewer Main Window Configuration ............................................................... 3-8 3.7.1 Main Window Toolbar Functions ....................................................................................... 3-9 v 3.8 Creating/Saving "Summary Data" DB in PC .................................................................... 3-10 3.8.1 Creating "Summary Data" DB ......................................................................................... 3-10 3.8.2 Saving "Summary data" DB ............................................................................................. 3-10 3.8.3 Adding Imported/Summarized Logging Data to "Summary Data" DB (CSV Import) . 3-11 3.8.4 Opening "Summary Data" DB ......................................................................................... 3-13 3.9 Displaying Graph on Multi Data Viewer .......................................................................... 3-14 3.9.1 Multi Data Viewer Graph Display Area Functions ........................................................ 3-14 3.9.2 Setting Graph Display ...................................................................................................... 3-15 (1) Specifying Displayed Data Type (Vertical Axis Unit).................................................. 3-15 (2) Specifying Channels to Display .................................................................................... 3-15 (3) Changing Display Period .............................................................................................. 3-16 (4) Specifying Summary Unit (Time Unit to Display Summary in Graph) .................... 3-16 (5) Specifying Display Date and Time ............................................................................... 3-17 (6) Switching Bar Graph Type ........................................................................................... 3-17 (7) Switching to Detailed View ........................................................................................... 3-19 (8) Fixing Scales .................................................................................................................. 3-19 (9) Hiding Areas from Display............................................................................................ 3-19 (10) Checking Window History ............................................................................................ 3-20 (11) Mouse Operation of Graph Area ................................................................................... 3-20 3.9.3 Displaying Summary Note ............................................................................................... 3-21 3.10 Comparing with Data at Different Date/Time .................................................................. 3-22 3.10.1 Opening Comparison Window........................................................................................ 3-22 3.10.2 Closing Comparison Window ......................................................................................... 3-22 3.10.3 Comparison Window Configuration .............................................................................. 3-23 (1) Displaying Comparison Source ..................................................................................... 3-24 (2) Selecting Comparison Target ........................................................................................ 3-24 3.10.4 Comparison Window Toolbar Functions........................................................................ 3-24 3.11 Other Operating Features of Multi Data Viewer ............................................................. 3-25 3.11.1 Saving Data in "Favorites" ............................................................................................. 3-25 (1) Adding to Favorites ....................................................................................................... 3-25 (2) Organizing Favorites ..................................................................................................... 3-26 3.11.2 Outputting Summary Data in CSV Format .................................................................. 3-26 3.11.3 Outputting Graph Image to Clipboard .......................................................................... 3-28 3.11.4 Setting Multi Data Viewer ............................................................................................. 3-29 3.12 (1) Viewer Setting ............................................................................................................... 3-29 (2) Data Type Setting .......................................................................................................... 3-30 (3) Channel Setting ............................................................................................................. 3-31 Multi Data Viewer CSV Output Data Format .................................................................. 3-32 3.12.1 Report Type File Data Structure ................................................................................... 3-32 vi (1) Header Section ............................................................................................................... 3-32 (2) Data Section ................................................................................................................... 3-32 3.12.2 M2M Type File Data Structure ...................................................................................... 3-34 (1) Header Section ............................................................................................................... 3-34 (2) Data Section ................................................................................................................... 3-34 3.12.3 Comparison Window CSV Output File Data Structure ............................................... 3-35 (1) Header Section ............................................................................................................... 3-35 (2) Data Section ................................................................................................................... 3-35 vii 1. Overview of Multi Data Viewer 1. Overview of Multi Data Viewer 1.1 Features The EQUO system supports manufacturing facilities to achieve an optimal balance between the energy consumption and operation quality. The provided PC Software Utility is a useful tool package for EQUO system settings, logging, as well as data summation and display required to plan improvement solutions. The Utility comprises the following two tools: Summary/Display Tool: Multi Data Viewer Light Multi Data Viewer Light is a free tool used to summarize and display the logged measurement data of connected devices for analysis. Hereafter in the manual, it is referred to as "Multi Data Viewer". Setting/Logging Tool: Setting Manager Starting from the Windows Start menu or Multi Data Viewer, Setting Manager is the tool to make settings on individual devices and their measurement channels. It can also communicate with the devices to directly collect the measured data for logging. Provided PC Software EQUO® Utility Summary/Display Tool Multi Data Viewer Setting/Logging Tool Setting Manager Logging Setting Graph Display Collect Measured Data LAN(Ethernet) Via SD Card CSV file with measured data logged by Setting Manager or measured data logged by a device Device Device 1-1 1. Overview of Multi Data Viewer 1.2 Procedure to Use The following procedure is required to use Multi Data Viewer. ●Directly collecting data from devices and log it in PC via communications Make settings (as required) and send the logging start command using Setting Manager ↓ Summarize and display the data using Multi Data Viewer See " 2.Setting/Logging Tool: Setting Manager". See "3.Summary/Display Tool: Multi Data Viewer". ●Using data collected and logged by devices in SD memory card Specify parameters on EQUO devices using Setting Manager via communications (as required) ↓ EQUO devices log its data in SD memory card ↓ Insert the SD memory card in PC ↓ Summarize and display the data using Multi Data Viewer 1-2 See " 2.Setting/Logging Tool: Setting Manager". See "3.Summary/Display Tool: Multi Data Viewer". 1. Overview of Multi Data Viewer 1.3 Operating Environment The following table shows the operating environment for Multi Data Viewer. Compatible OS Windows XP 32-bit, Windows Vista 32-bit, Windows 7 32-bit/64-bit CPU CPU: Intel Core 2 Duo or equivalent Memory 2 GB (32-bit OS)/3 GB (64-bit OS) (Recommended: 3 GB or more) Display Resolution: 1024 x 768 or higher; 65535 colors (16-bit color display) or higher HDD 1 GB free space is required for installation CD-ROM Drive Required for installation .NET Framework .NET Framework 3.5 or higher LAN Port (10BASE-T or Required for network connection 100BASE-TX compatible) (e.g. Used by the logger in Setting Manager to collect the data for logging from devices via communications) Compatible Device ・Portable Power Monitor (ZN-CTX21) ・Power Sensor Station (ZN-KMX21) ・Precision Thermo-Humidity Logger (ZN-THX11-S) ・Thermo-Humidity Station (ZN-THX21-S) ・Differential Pressure Station (ZN-DPX21-S) ・Air Flow Sensor (D6FZ-FGX21) ・Air Particle Sensor (ZN-PD-S) ・Thermo-Humidity Sensor (WZ-STH01) ・Light Intensity Sensor (WZ-SL01) ・Thermo-Humidity Light Intensity Sensor (WZ-STHL01) ・CO2 Sensor (WZ-SCD01) ・Power Monitor (*) (KM20, KM50C, KM50E, KM100, KM1) SD Card Reader/Writer and SD Card Slot *: Connection through ZN-KMX21 KM20, KM50C, KM50E, KM100 *: Connection through CompoWay/F slave (wireless) (**) KM20, KM50C, KM50E, KM100, KM1-PMU2A KM1-PMU1A, KE1-CTD8E, KM1-EMU8A,ZN-PD-S **: Wireless Unit is available only in Japan. Used to read the logging data collected by devices 1-3 1. Overview of Multi Data Viewer 1.4 Installation (1) Insert the Utility Disk (provided with the EQUO series product) in the PC's CD-ROM drive. The following initial installation window appears. Or execute the Setup.exe in the CD-ROM drive if the window is not displayed. Click the "Next" button. 1-4 1. Overview of Multi Data Viewer (2) The license agreement window appears. Read through the displayed "Software License Agreement" and select "I agree". Then click the "Next" button. 1-5 1. Overview of Multi Data Viewer (3) The "Select Installation Folder" window is displayed. Check the installation destination folder and select "Everyone", then click "Next". To change the installation folder, type in the "Folder" box or click the "Browse" button to select the folder. (5) The "Confirm Installation" window appears. Click the "Next" button. 1-6 1. Overview of Multi Data Viewer (6) The message "Installing Multi Data Viewer Light" appears. (7) The "Installation Complete" window appears. Click "Close". The installation of Multi Data Viewer is now completed. 1-7 1. Overview of Multi Data Viewer 1.5 Startup To start up Multi Data Viewer, click the shortcut icon on the Windows desktop. Alternatively, click "Multi Data Viewer Ver.1.*.*" or "Setting Manager Ver.1.*.*" after selecting "All programs" - "OMRON" - "Multi Data Viewer" from the Windows start menu. 1.6 Uninstallation To uninstall Multi Data Viewer, click "Add or Remove Programs" (Windows XP) or "Uninstall or Change Program" (Windows Vista or 7) in the Windows Control Panel. 1-8 2. Setting/Logging Tool: Setting Manager 2. Setting/Logging Tool: Setting Manager 2.1 Setting Manager Setting Manager is a PC tool used for set and operate EQUO devices as well as collect/log measured values. The user can use the tool for the following procedures: Setting ・Device parameter settings ・Logging target channel setting in each device ・Data type setting ・ Connected Device Settings when a wireless unit is used(*) *: Wireless Unit is available only in Japan. Operation/Status ・Operation of certain devices Acquisition ・Device status acquisition Collection/Logging of ・Collecting/logging measured values from devices and outputting Measured Values them to CSV files from Devices Definition "EQUO devices": The generic name for OMRON's environmental sensing devices to measure/quantify energy data: electric power and air flow rate values as well as quality/ambient condition-related data: temperature/humidity, differential pressure, amount of foreign matter, light intensity and CO2 values. The devices are specifically designed to optimally balance between the energy consumption and quality, pertaining to facilities. The term "devices" in Setting Manager refers to EQUO devices. This manual also uses "devices" to designate the same in Setting Manager operation or other descriptions. 2-1 2. Setting/Logging Tool: Setting Manager 2.1.1 Setting Manager System Configuration The following figure shows the Setting Manager system configuration. Setting Manager LAN (Ethernet) ・Portable Power Monitor ZN-CTX21 ・ Power Measurement Station ZN-KMX21 ・Precision Thermo-Humidity Logger ZN-THX11-S ・Thermo-Humidity Station ZN-THX21-S ・ Differential Pressure Station ZN-DPX21-S ・Air Flow Station D6FZ-FGX21 Master (Wireless) WZ-MLAN01 ・Thermo-Humidity Sensor WZ-STH01 ・Light Intensity Sensor WZ-SL01 ・ Thermo-Humidity Light Intensity Sensor WZ-STHL01 ・CO2 Sensor WZ-SCD01 ・ Clamp-Type Portable Power Monitor ZN-CTC11 ・Power Monitor KM20, KM50C, KM50E, KM100 ・Thermo-Humidity Sensor Head ZN-THS1□□ -S ・Air Particle Sensor ZN-PD□□-S ・Air Flow Sensor D6FZ series * CompoWay/F (Wireless) * WZ-SRS01 Slave RS-485 Power Monitor KM20, KM50C, KM50E, KM100, KM1 *: Wireless Unit is available only in Japan. 2-2 2. Setting/Logging Tool: Setting Manager 2.2 Setting Manager Specifications The following shows the Setting Manager specifications. Item Description Logger Device Logging target device setting and recording interval setting setting Settings for each device Channel Setting each device's individual measurement channels as Settings logging targets and displaying each measurement channel setting status Connected Wireless device settings for wireless communications Device (when used) between the PC (running Setting Manager) Settings and devices Device parameter setting Parameter setting for devices Export of settings Device setting, device connection, sensor setting and data type setting can be exported individually in CSV format Import of settings Device connection, sensor setting and data type setting can be imported individually from CSV format Operation/Status acquisition ・Device operation (Logging start/stop on the device unit, SD memory card write, alarm/error cancel, clock adjustment and restart are possible) ・Device status monitoring (Logging in process, error, etc.) Logger Operation ・Test to check the connection to EQUO devices ・Project write to the logger ・Measured value acquisition from EQUO devices and start/stop logging Recording interval ZN series 1, 2, 5, 10, 20, 30 s 1, 2, 5, 10, 20, 30 min, 1 h WZ series 1, 5, 10 min CompoWay/F slave 1, 2, 5, 10, 20, 30 min, 1 h connection Output Logging data output to CSV files CSV files that can be saved ・Logging data ・Device unit settings ・Sensor settings (for data collection devices) ・Data type settings 2-3 2. Setting/Logging Tool: Setting Manager 2.3 Setting Manager Basic Operation Flow The following shows the basic flow of Setting Manager operation. Procedure Create a new project ↓ Specify CSV file save destination ↓ Make device settings Specify device parameters Make logging settings (e.g. logging interval) ↓ Register wireless communications units ↓ Specify measurement channels ↓ Specify data type ↓ Save the project ↓ Connect Setting Manager online ↓ Write the settings in the logger ↓ Test connection (as required) ↓ Start Logging ↓ Stop logging ↓ Reference 2.8.1 Creating a New Project 2.9.2 Making Project Settings 2.9.3 Setting Devices 2.9.5 Setting Connection Units (For Wireless Connection) 2.9.4 Setting Channels 2.9.4 Setting Channels 2.8.3 Saving a Project 2.10.1 Connecting Setting Manager Online 2.10.2 Writing Settings in Loggers 2.10.3 Starting/Ending Connection Test 2.10.4 Starting Logging 2.10.5 Stopping Logging 3.5.1 Using Logging Data Collected by Setting Manager Logger Use logging data 2-4 2. Setting/Logging Tool: Setting Manager 2.4 Setting Manager Operation Quick Reference Guide The following shows the operation procedure for individual Setting Manager functions. Function (What to do) Operation (How to do) Device Register a device Use the device list in ・Add a device offline: "Add Settings "Device Settings" in Device" button the setting menu area ・Search a device and add it online: "Searching device" "Add " button Specify the device name, 1. Click the "Add Device" connection unit and IP button address of each device 2. Specify "Name", "Device type", "Connecting to:", "IP address" and” Connected Numbers: ” in the "Add Device" dialog box Specify if each device is a Select the targets in the logging target "Logging" list Specify the logging interval 1. Click the "Add Device" for each device button 2. Select “Recording Interval” in the “Add Device” dialog box Specify device unit 1. Click the "Edit" button parameters 2. Use "Device Settings" in the “Edit Device” dialog box Change a device name, 1. Click the "Edit" button connection unit, IP 2. Use "Connecting address and recording Information" in the “Edit interval Device” dialog box Change the parameters of 1. Click the "Edit" button the sensor connected to a 2. Click the "Edit" button in data collection unit "Sensor Settings" in the “Edit Device” dialog box 3. Change the parameters in the "Sensor Settings" dialog box Read parameters from a Click the "Import Settings" CSV file button Connected Make necessary settings Use the Connected 1. Click the "Add Ch." button Device to connect the PC (with Device List in 2. Register "Wireless master" Settings Setting Manager) to "Connected Device or "Wireless CompoWay /F (When EQUO devices via Settings" in the slave" (RS-485 slave) wireless wireless unit (Specify the setting menu area connection unit configuration in the is used) communication path) Channel Add a measurement Use the channel list Click the " Add Ch." button Settings channel as a logging in "Channel Settings" target in the setting menu area Logging Test (Online connection Use the "Logger" 1. Click "Online Connection" test) menu in the setting 2. Click "Start Test" menu area 3. Check the result in "Status" in “Device Settings” in the setting menu area Start Logging Use the "Logger" 1. Click "Online Connection" menu 2. Click "Start Logging" 2-5 2. Setting/Logging Tool: Setting Manager Function (What to do) Device status acquisition Check the status of each device during connection test or logging process Device operation Operate a ZN series device e.g. to start/stop logging or eject the SD memory card Save device parameters in a CSV file Setting output in CSV format Save sensor parameters in a CSV file Operation (How to do) Note 1: Specify the logging targets by selecting "Valid" or "Invalid" for each device in the “Device Settings” device list. Note 2: Specify the logging interval by specifying “Recording Interval” in the "Add Device" dialog box. Use the device list in See the "Status" column “Device Settings” in the setting menu area Use the device list in 1. Click the "Edit" button “Device Settings” in 2. Use "Device operation" in the setting menu the “Edit Device” dialog box area Use the device list in 1. Click the "Edit" button “Device Settings” in 2. Click the "Export setting" the setting menu button in “Device Settings” in area the “Edit Device” dialog box 1. Click the "Edit" button 2. Click the "Edit" button in “Sensor Settings” in the “Edit Device” dialog box 3. Change the parameters in the “Sensor Settings” dialog box 4. Click the "Export setting" button 2-6 2. Setting/Logging Tool: Setting Manager 2.5 Starting/Exiting Setting Manager 2.5.1 Starting Setting Manager Select "Tool" - "Logging" on Multi Data Viewer or "All programs" - "OMRON" - "Multi Data Viewer" - "Setting Manager" from the Windows start button. The Setting Manager main window appears. 2.5.2 Exiting Setting Manager Click the "Exit" button ( ) in the File (F) menu to exit Setting Manager. A confirmation message appears if changes added to the project loaded on the PC has not been saved in the project file. 2-7 2. Setting/Logging Tool: Setting Manager 2.6 Setting Manager Window Configuration The following shows the Setting Manager window. Title Bar Toolbar Setting Menu Area Setting Data Display Area Status Bar Section name Title bar Toolbar Setting menu area Setting data display area Status bar Description Setting Manager - <Project file name> Shows the icons to access individual functions. Click the icon to execute the corresponding function. The followings are shown under the project name. ・Device Settings ・Channel Settings ・Connected Device Settings Select any of the setting items above to display the corresponding setting data. Shows the Setting Manager current status or process progress. 2-8 2. Setting/Logging Tool: Setting Manager 2.6.1 Setting Manager Toolbar Functions The Setting Manager toolbar comprises "File", "Logger" and "Help" items, which provides the following functions. Menu Item Function Description File Provides the functions to create, save or read a project as well as exit Setting Manager. New Project Creates a new project based on the settings. Open Reads a saved project to Setting Manager. Close Closes the project. Save as Saves a project after settings in a file. Exit Exits Setting Manager. Logger Provides logger operation functions. Online Connection Switches Setting Manager from the offline to online mode. The logger function and communications with connected devices are enabled. Offline Start Logging Stop Logging Start Test End Test Save Settings Read Settings Help Version Information Switches Setting Manager from the online to offline mode. The logger function and communications with connected devices are disabled. Starts logging by acquiring the measured values at the specified device channels. Stops logging. Starts the connection test between the logger and devices. The connection status is shown in "Status" in “Device Settings” in the setting menu area. Stops the connection test in progress. Saves the following settings made with Setting Manager: ・Logger settings to the logger ・Device parameter settings to the connected devices Via communications Reads logger settings to a project loaded on Setting Manager. Shows the version of Setting Manager. 2-9 2. Setting/Logging Tool: Setting Manager 2.7 Acquiring Device Status The following device status information can be acquired using Setting Manager: Status Logger function Communications Logging with device Online mode Enabled Enabled Stopped In progress Offline mode Disabled Disabled Disabled "Logger" - "Online Connection" Offline mode Online mode Logging stopped "Logger" - "Offline" Saving project setting file is enabled "Logger" - "Start Logging" "Logger" - "Stop Logging" Logging in progress 2-10 Writing project settings to the logger and devices is enabled Writing project settings to the logger and devices is disabled 2. Setting/Logging Tool: Setting Manager 2.8 Creating/Saving a Setting Manager Project Click the corresponding icon in the "File (F)" menu to create a new project, save or read a created project file. 2.8.1 Creating a New Project Click the "New Project(N)" icon in the "File (F)" menu on the toolbar to create a new project. 2.8.2 Opening/Closing a Project Click the "Open(O)" icon in the "File (F)" menu on the toolbar to read a saved project to Setting Manager. 2.8.3 Saving a Project Click the "Save as(S)" icon in the "File (F)" menu on the toolbar to save a project in a file. The save destination selection window appears. Specify the destination folder and file name, then click "OK". 2.8.4 Exiting Setting Manager Click the "Exit(X)" button ( ) in the File (F) menu on the toolbar to exit Setting Manager. The confirmation message appears if project file data is modified. 2-11 2. Setting/Logging Tool: Setting Manager 2.9 Settings (Setting Menu Area) Setting Manager allows the user to make EQUO system settings such as various device setting, logging and wireless connection settings from the setting menu area. *: Wireless Unit is available only in Japan. 2.9.1 Functions in Setting Menu Area The setting menu area provides the access to the following setting functions. The setting data display area shows the corresponding setting data when a menu item is selected. Project (Local PC Make project settings here. project) Specify the project name and setting data (CSV file) save destination. Device Make settings for the devices connected to the Setting Manager logger Settings function. Device list Lists the connected device information: device names, types, connection types, connection addresses, logging Valid/Invalid settings, connection statuses and logging intervals. The list can be edited. Sensor Use this to make the sensor parameter settings for setting devices or KM series units connected to the devices as well as operate the devices and units. Channel Register device measurement channels as the logging targets and Settings check their setting status. Channel list Lists the connected device channel information: channel names, device names, data types, and the logging target settings for individual channels of each connected device. The channel names can be edited. Connected Make settings for the connection units (i.e. wireless master and slaves) Device configured in the communication path from the PC (with Setting Settings Manager) to the devices, when using wireless connection. Connected Lists the connection unit names, unit types, connection Device List targets, and connection IP addresses. The list can be edited. 2-12 2. Setting/Logging Tool: Setting Manager 2.9.2 Creating/Saving a Setting Manager Project Making Project Settings Click a desired project name in the setting menu area to make settings for the project. The project setting window provides the settings of two items: "Project Name" and "Save to". Item Description Project Name: Enter the name for the currently open project. Setting Manager refers to this project name when writing data to the logger. Save to: Specify the CSV file save destination folder. The following data can be saved in CSV format: ・Logging data ・Data type settings ・Device unit settings ・Sensor settings (for data collection devices) Enter the data save destination folder name or click the [Setting] button to select the folder. 2-13 2. Setting/Logging Tool: Setting Manager 2.9.3 Setting Devices Click “Device Settings” in the setting menu area to make device settings. The settings for individual devices including those connected to the Setting Manager logger function are available with this menu item. Device List Device Search Button Add Button Delete Button "Device List" displays the connected device information as shown below: Item Description Select The devices with the corresponding checkboxes selected () can be deleted in batch. No. The number is assigned in the order the device is registered by the user. Device Name Shows the device label added by the user. Device Type Shows the device type name. Connected Device Shows the name of the unit the device is connected. Device address Shows the connection address of the connection unit the device is connected to. ・LAN (Ethernet) connection: IP address ・Wireless master connection: Slave unit ID ・Wireless/RS-485 connection: CompoWay/F unit ID ・LAN/RS-485 connection: CompoWay/F unit ID Logging Shows if logging is from the device is Valid/Invalid. Valid: Logging target Invalid: Not a logging target. Setting Manager does not log the data of the device with this setting. This setting cannot be changed during connection test or logging process. Status Shows the device connection status. Updates the status every minute while connection test or logging is in progress. The status is shown in any of the following indications: "--": The setting tool has not acquired the status from the logger. "OK": The device is ready for data acquisition. "Error": An error has occurred in the device unit. "Connection Error ": It is not connected with the device. Recording Interval Shows the interval in which measured values are collected from the 2-14 2. Setting/Logging Tool: Setting Manager Item Edit Description device. Use this to edit the device. Clicking the button displays the device editing window. Click the “Search” button to search devices to connect to the logger, among those connected to the connection units. Click the "Add Device" button to add a device to connect to the logger function. Click the "Delete" button to delete the connected devices selected in the list. (1) Adding a Device [1] Adding a Device Offline The user can add a device to the logger function by clicking the "Add Device" button. Click the "OK" button to add the device with the settings made in the dialog box. Clicking the "Cancel" button aborts the settings and closes the window. 2-15 2. Setting/Logging Tool: Setting Manager The “Add Device” dialog box provides the following setting items: Item Description Name Enter a user-defined name for the device. Device Type Select the type of the device in the device type list displayed in the window. Setting Items The settable items vary depending on the device type selected in the device type selection box. Simultaneous Select this checkbox to register the channels specified for the Channel device. Both the device and channels are registered at once. Registration The following table shows the setting items that can be specified for individual options in the device type selection box. Device type selection box Connection unit Setting items (Setting data selection box display area) ZN-PD03-S/ZN-PD50-S PC Connection device, IP address, ZN-THX21-S Recording interval, and the ZN-DPX21-S number of connections ZN-CTX21 (ZN-KMX21, D6FZ-FGX21) ZN-KMX21 With/Without ZN-TH11-S D6FZ-FGX21 (ZN-PD03-S/ZN-PD50-S) WZ-STH01 WZ-SL01 WZ-STHL01 WZ-SCD01 Wireless master name Connection device, Wireless unit ID, Recording interval, and Timeout KM20-B40 KM50-E KM50-C KM-100 KM1-PMU2A KM1-PMU1A KE1-CTD8E KM1-EMU8A ZN-PD03-S ZN-PD50-S Wireless slave name Connection CompoWay/F unit Recording interval CompoWay/F adapter name Connection unit, CompoWay/F unit ID, and Recording interval 2-16 device, ID, and 2. Setting/Logging Tool: Setting Manager [2] Searching Devices Online Setting Manager automatically searches devices to connect to the logger function at a click of the “Search” button. Currently, a search is only possible with sensors connected to the PC. Check the search target and click the "Start" button. The device search progress is shown at the progress bar. To cancel the search, click the "Cancel" button. The found devices are listed in the "Device search result" dialog box when a device search is completed. Add Target Checkbox Add Button Select the corresponding "Add Target" checkboxes () of the devices to add, and click the "Add" button. The selected devices are registered. Select the "Simultaneous Channel Registration" checkbox () to register the channels specified for the devices. Both the devices and channels are registered at once. 2-17 2. Setting/Logging Tool: Setting Manager (2) Editing a Device The user can edit a device by selecting the device in "Device List" and clicking the "Edit" button. The setting data of the device connected to the logger function can be modified. The “Edit Device” window provides different tab configuration depending on the device type. The following table shows the tab configurations for individual device types shown in the “Edit Device” window. Device Type Connecting Device Device Sensor information Operation Settings setting ZN-PD03-S ZN-PD50-S ZN-THX21-S ZN-DPX21-S ZN-CTX21 ZN-KMX21 ZN-FGX21 WZ-STH01 WZ-SL01 WZ-STHL01 WZ-SCD01 KM20-B40 KM50-E KM50-C KM-100 KM1-PMU2A KM1-PMU1A KE1-CTD8E KM1-EMU8A ZN-PD03-S ZN-PD50-S Yes Yes No No Yes Yes Yes × Yes Yes Yes Yes Yes No No No Yes No Yes No Yes No No No [1] Connecting Information Tab The tab displays the information on the connection between Setting Manager and devices. Click the "OK" button to register the device with the settings made in the tab. Clicking the "Cancel" button aborts the settings and closes the window. 2-18 2. Setting/Logging Tool: Setting Manager [2] Device Operation Tab Use this tab to send operation commands to the device. Select the command and click the "Send" button to send the command to the device. Refer to the device manual for the details of device operation commands. Important When saving the settings, stop recording the data by the connected device. If the device is in Recording, choose “Stop Recording” in the “Device Operating Tab” and stop recording. When failed to read / save settings, error message is displayed. In that case, make sure the following status: - Make sure the device is ON and the recording status. - Make sure the LAN connection status between PC and the connected devices - Make sure the LAN settings. [3] Device Settings Tab This tab provides the editing of the device unit parameters. 2-19 2. Setting/Logging Tool: Setting Manager button: Click this to update the parameters with the setting data read from a CSV file. button: Click this to output the settings to a CSV file. Click the "Read setting" button to read the set values to Setting Manager from the device to update them. Click the "Save setting" button to save the settings to the device. Click the "OK" button to register the device with the settings made in the tab. Clicking the "Cancel" button aborts the settings and closes the window. The device must not be in the recording process when writing the setting to the device. Stop the recording in "Device operation" if the device is in the process of recording. [4] Sensor Settings Tab The parameter editing for the connected sensors is available with some data devices. This tab allows the user to make settings for the sensor connected to the corresponding data collecting device. Click the "Unit List" button to display the sensor list for the setting. The Sensor setting tab provides the following setting items: Item Description No. The sensors are listed in the order from the smallest unit number (1, 2, 3…). Sensor Type Shows the sensor type or model. Settings The sensor setting dialog box appears when the "Edit" button is clicked. At a click of the "Sensor List" button, Setting Manager communicates with devices to check and display the connected sensors. The sensor setting dialog box appears when the "Edit" button is clicked. 2-20 
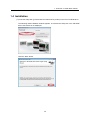
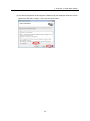
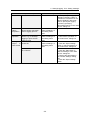
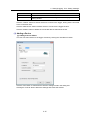
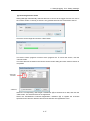
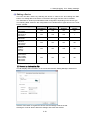
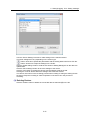
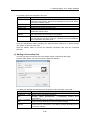
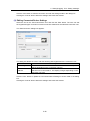
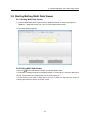
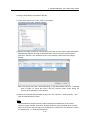
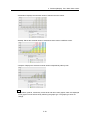
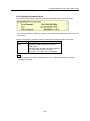
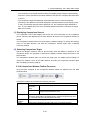
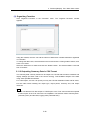
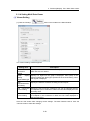
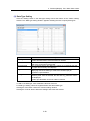
2. Setting/Logging Tool: Setting Manager Use the “Sensor Settings” window to make settings for the selected sensor. The lower setting items vary depending on the sensor type. button: Click this to update the parameters with the setting data read from a CSV file. button: Click this to output the settings to a CSV file. Click the "Read setting" button to read the set values to Setting Manager from the device to update them. Click the “Save settings” button to save the settings to the device. Click the "OK" button to register the device with the settings made in the tab. Clicking the "Cancel" button aborts the settings and closes the window. The device must not be in the recording process when reading or writing the setting from/to the device. Stop the recording in "Device operation" if the device is in the process of recording. (3) Deleting Devices Click the "Delete" button to delete the connected devices selected () in the list. 2-21 2. Setting/Logging Tool: Setting Manager 2.9.4 Setting Channels The user can add or delete individual device measurement channels to/from the logging target selection by clicking "Channel Settings" in the setting menu area. The displayed data also can be used to check the current settings made to each channel. Channel List Add Button Delete Button The Setting data display area shows the channel setting information. The following items are displayed in the area. Item Description Select Use the checkboxes to operate the selected devices in batch. No. The number is assigned in the order the channel is created by the user. Channel Name Shows the label given to the channel by the user. Device name Shows the label given to the device by the user. A channel without the device information (e.g. when using a local file) is displayed as "--". Data name Shows the data type of the physical quantity values measured by the device. Logging Either of the following settings is displayed depending on if the device containing the channel is specified as a logging target. "Valid": Logging target "Invalid": Not a logging target Specify the above setting for each device in the "Logging" column in “Device Settings”. Setting Shows the "Edit" button. Click this to edit the name of the corresponding channel. Click the "Add Ch." button to display the "Add Channel" dialog box and add a channel retained by the device but not registered yet. Click the "Delete" button to remove the selected channels from the logging target selection. 2-22 2. Setting/Logging Tool: Setting Manager (1) Adding a Channel At a click of the "Add Ch." button, the "Add Channel" dialog box appears. The dialog box allows the user to register a channel retained by the device but not yet registered to Setting Manager. The following shows the items available with the dialog box. Item Description Ch. Name Enter the name for the channel to register. Device Name Select the corresponding device in the pull-down list. The devices registered in “Device Settings” are shown in the list in the "Device name - Device address" format. Ch. Address Select the channel to register in the pull-down list. The channels contained in the device are shown in the list in the "CH number Data type" format. Click the "OK" button to register the channel with the settings made in the dialog box. Clicking the "Cancel" button aborts the settings and closes the window. (2) Deleting Channels Select the checkboxes () for the channels to delete in "Channel list" and click the "Delete" button. The selected channels are removed from the logging target selection. (3) Editing a Channel Click the "Edit" button shown in "Channel list". The "Edit channel" dialog box appears. The dialog box allows the user to edit the setting for a registered channel. The Edit channel dialog box can be operated in the same way as the "Add channel" dialog box. Refer to "(1) Adding a Channel" for details. 2-23 2. Setting/Logging Tool: Setting Manager 2.9.5 Setting Connection Units (For Wireless Connection) The "Connected Device Settings" is enabled if Setting Manager is connected to devices via wireless. Click this button to make settings for the connection units (Wireless master and CompoWay/F wireless slaves) configured in the communications path between the PC (Setting Manager) and devices. *: Wireless Unit is available only in Japan. Thermo-Humidity WZ-STH01 Thermo-Humidity & Light Intensity WZ-STHL01 For example, a wireless master and two CompoWay/F slave units must be registered in the system configuration above. The Setting data display area shows “Connected Device List”. The Connected Device List displays the settings related to the connection units. Connected Device List Add Button 2-24 Delete Button 2. Setting/Logging Tool: Setting Manager The following items are displayed in the area. Item Description Select The column displays the "Select" checkboxes used to delete multiple connection units in batch. Select the checkboxes for the units to delete and click the "Delete" button. No. The number is assigned in the order the unit is registered by the user. Device Name Shows the label given to the connection unit by the user. Device Type Shows the type of the connection unit. Connecting to Shows the unit name the connection unit is connected to. PC/Wireless master name Connection Shows the address of the upper connection unit each connection unit Address (in the Connection unit column) is connected to. Edit Clicking the "Edit" button displays the "Edit connection unit" dialog. The user can edit the unit name and type, connected unit and its address for the registered connection units. Click the "Add Device" button to display the “Add Connector” dialog box, in which the user can register a new connection unit. Click the "Delete" button to remove the selected connection units from the connection selection. (1) Adding a Connection Unit The user can add a connection unit to the EQUO system controlled by the logger. Click the "Add" button. The "Add Connector" dialog box appears. The dialog box provides the following items to specify for the connection unit to add: Item Description Name Enter a user-defined name for the connection device. Connection unit Shows a list of connection unit types. type Wireless master (WZ-MLAN01) / CompoWay/F wireless slave (WZ-SRS01) Upper connection Select the unit name the added connection unit is connected to. The unit options change depending on the connection unit type. Connector Enter the address the connection unit selected in the connection unit Address selection box is connected to. The display changes depending on the connection unit type. 2-25 2. Setting/Logging Tool: Setting Manager Click the "OK" button to add the connection unit with the settings made in the dialog box. Clicking the "Cancel" button aborts the settings and closes the window. (2) Editing Connected Device Settings Select the unit in the “Connected Device List” and click the "Edit" button. The user can edit the registered upper connection unit and connection address for the selected connection unit. The "Edit Connector" dialog box appears. The dialog box allows the user to edit the following data registered for the connection unit. Item Description Connecting to: Select the unit name the connection unit is connected to. The options change depending on the connection unit type. Connector Enter the address the connection unit selected in the connection unit Address selection box is connected to. The display changes depending on the connection unit type. Click the "OK" button to update the Connected Device Settings to those made in the dialog box. Clicking the "Cancel" button aborts the settings and closes the window. 2-26 2. Setting/Logging Tool: Setting Manager 2.10 Logging (Logger Menu) Setting Manager collects measured values from the registered devices and log them in a specified folder in CSV format. 2.10.1 Connecting Setting Manager Online Make sure that a project is open and more than one device is registered in the project, then click "Online Connection" in the "Logger (L)" menu. Setting Manager changes from offline to online mode. The logger function and communications with the connected devices are enabled once Setting Manager becomes online. When failed to “Online Connection”, the error message is displayed. In that case, restart the PC and Setting Manager. 2.10.2 Saving Settings in Loggers Click “Save Settings” in the "Logger (L)" menu in the toolbar while Setting Manager is online. The project settings made with Setting Manager are written to the connected devices through communications. Saving logger settings (device parameters) to the logger function (connected devices) through communications is required to enable the connection test based on the "logger settings" and logging. Setting Manager cannot start logging unless this process is completed. 2.10.3 Starting/Ending Connection Test Click "Start Test" in the "Logger (L)" menu in the toolbar while Setting Manager is online. Setting Manager starts connection test while showing the progress in the status bar. The test result is the following: "Status" row "--" "Normal" "Connection Error" "Error" shown at the "Status" row in “Device Settings” in the setting menu area as Status The setting tool has not acquired the status from the logger. The device is ready for data acquisition. The device is not ready for data acquisition. An error has occurred in the device unit or the unit is in either of through mode and FTP mode. Setting Manager exits connection test anytime when "Stop Test" in the "Logger (L)" menu is clicked. The progress display in the status bar disappears and "--" is shown at the "Status" row in “Device Settings”. 2-27 2. Setting/Logging Tool: Setting Manager 2.10.4 Starting Logging Click "Start Logging" in the "Logger (L)" menu in the toolbar while Setting Manager is online. Setting Manager starts logging by using the logger function to collect measured values from the connected devices. The logging data is saved in CSV files in the folder specified in "Save to" during the project setting procedure. Refer to "2.9.2 Creating/Saving a Setting Manager Project Making Project Settings" for the data save destination. If "Start Logging" is clicked during the process of connection test, Setting Manager stops the test. 2.10.5 Stopping Logging Click "Stop Logging" in the "Logger (L)" menu to stop logging. 2.10.6 Reading Settings from Loggers Click "Read Settings" in the "Logger (L)" menu while Setting Manager is online. The logger settings for the connected devices can be read to the project on Setting Manager. 2.10.7 Disconnecting Setting Manager (Offline) Click "Offline" in the "Logger (L)" menu while Setting Manager is online. The logger function and communications with connected devices are disabled. 2-28 2. Setting/Logging Tool: Setting Manager 2.11 Other Setting Manager Operation 2.11.1 Displaying Setting Manager Version and Copyright Information (Help Menu) Click "Version" in the "Help" menu. The Setting Manager version and copyright information is displayed. 2-29 3. Summary/Display Tool: Multi Data Viewer 3. Summary/Display Tool: Multi Data Viewer 3.1 Multi Data Viewer Multi Data Viewer is used to summarize and display the logged EQUO device measurement data for analysis. The tool can support optimal operation by balancing the energy consumption and product quality through the integrated quantification of environmental data such as power consumption, flow rate, temperature and amount of foreign matter. Multi Data Viewer provides the summary and integrated graph display of logging data collected at a specified period, summary unit and measurement time/date, which is obtained in either of the following methods: ・EQUO devices log the data, which is saved in a memory device (e.g. SD memory card) ・The logger function in Setting Manager directly collects the logging data from EQUO devices through communications Note ・Multi Data Viewer can display momentary values if summary by the summary unit is not required. Previous environmental data or the data from different measurement points also can be compared and displayed. Definition ・"Logging data" refers to any of the following data: (1) Logging data collected by EQUO devices at specified logging intervals (2) Logging data collected by the Setting Manager logger function directly from EQUO devices through communications at specified logging intervals All the data above is output in CSV files and the output files are referred to as "collected files". ・"Summary" is a process to e.g. average, integrate and obtain the maximum value using logging data. ・"Summary data" refers to the data obtained through the "summary" process. ・"Summary unit" refers to the unit of time used to display "summary data". ・A "summary file" is a file containing "summary data" output in CSV format for the use on spreadsheet software. ・"Summary data" DB is the database storing "summary data". 3-1 3. Summary/Display Tool: Multi Data Viewer 3.2 Multi Data Viewer Specifications The following shows the Multi Data Viewer specifications. Item Description Import data File type Collected files in CSV format containing logged device measurement values. Either of the following is applicable: ・EQUO type: The file type used for EQUO device or Setting Manager output data ・EQUO_VIEWER type: The file type used for Station Utility logging data and other data Data processing Graph display Graph type Number of vertical axes (data axes) Number of channels to display Vertical axis unit (Data type specification) Horizontal axis (time axis) unit Display period (horizontal axis span) Summary unit (time unit to display summary) Graph time/date Summary data comparison Numeric display Other Saved file Export file Create summary data DB (database) using the imported logging data by applying the following processes: Summary methods: Averaging, integration, selection of the maximum and minimum values Bar graph (*) or line graph * Energy data bar graphs: summation graph, stacked graph, or grouped graph can be specified Max. 2 Max. 25 for each vertical axis Varies depending on the type of the displayed data Up to two types can be displayed Any of second, minute, hour, day, month, and year Any of minute, hour, day, month, and year The following shows the summary unit for each display period: ・Minute: No summary (*) ・Hour: 1 minute ・Day: 1 minute/30 minutes/1 hour ・Month: 30 minutes/1 hour/1 day ・Year: 1 day/1 month * The momentary values are displayed when summary is not available Can be specified Two summary data items can be compared/displayed Summarized total sum, rate, CO2 emission, average, maximum, and minimum values are displayed ・Fixed vertical scale display ・Enlarged/reduced horizontal scale (time scale) display ・Favorite data registration ・Graph screen capture XDB file (file with .xdb extension containing "summary data" DB) Summary data file (CSV format file) for viewing on spreadsheet software 3-2 3. Summary/Display Tool: Multi Data Viewer 3.3 Multi Data Viewer Basic Operation Flow The following shows the basic flow of Multi Data Viewer operation. Procedure Prepare logging data ↓ Start Multi Data Viewer ↓ Create "summary data" DB or open an existing "summary data" DB ↓ Import¥summarize logging data from collected files Reference 3.5 Preparing Logging Data 3.6 Starting/Exiting Multi Data Viewer 3.8.1 Creating "Summary Data" DB 3.8.4 Opening "Summary Data" DB 3.8.3 Adding Imported/Summarized Logging Data to "Summary Data" DB (CSV Import) ↓ Select the displayed data type (vertical axis unit) 3.9.2 (1) Specifying Displayed Data Type (Vertical Axis Unit) ↓ Specify the channels to display 3.9.2 (2) Specifying Channels to Display ↓ Specify the display period ↓ 3.9.2 (3) Changing Display Period Specify the summary unit 3.9.2 (4) Specifying Summary Unit (Time Unit to Display Summary in Graph) ↓ Specify the display date and time ↓ Compare the data with previous data (as required) ↓ Save the data to "summary data" DB Specify the following as required: Auto connection setting, summary display item setting, and CSV export character code setting 3-3 3.9.2 (3) Changing Display Period 3.10 Comparing with Data at Different Date/Time 3.8.2 Saving "Summary data" DB 3.11.4 Setting Multi Data Viewer 3. Summary/Display Tool: Multi Data Viewer 3.4 Multi Data Viewer Operation Quick Reference Guide The following shows the operation procedure for individual Multi Data Viewer functions. Function (What to do) Description Operation (How to do) Opening Create "summary Create an empty "summary data" DB in [File] - [Create "summary data" DB the local PC and open it. New File] data" DB Open a saved Open a saved "summary data" DB in a [File] - [Open DB] "summary data" local PC. DB Automatically The last displayed data opens Auto connect open the same automatically next time Multi Data setting in data next time Viewer starts. [Setting] - [Viewer setting] Logging data Import and Summarize the logging data in a CSV [File] [CSV input summarize file in a specified folder and add the import] logging data summary data to the "summary data" DB currently opened. Graph area Select data type Select the data types individually for Specify in [Ver. operation vertical axes 1 and 2 to display in the Axis 1] and [Ver. graph area. Axis 2] * Use the Setting Tool to specify the data type for each channel data. Specify graph Select the type from the following bar Specify in [Graph type graph display options for energy data. type] (Only for energy (Summation/Stacked/Grouped) data) Change the Specify the period (horizontal axis (time Specify in display period axis)) to display in the graph area. [Display period] Change the Specify the time unit to summarize the Specify in summary unit data for graph display in the graph area. [Summary unit] Specify the date Specify the graph date and time to Specify in the and time display in the graph area. date/time setting area Fix the vertical Fix the vertical scales for the graph Select the [Fix scales displayed in the graph area. scale] checkbox Display summary information in numerals Comparative display of summary data on different days Compare with data on another day Specify the comparison target date/time General graph operation Switch display/hide mode Operate the graph Other Add the data to favorite selection Capture the graph screen image Save the data to Summary data Display the summary information for the graph such as the total sum and average values in numerals in the graph area. Compare/display the currently displayed data (comparison source) with specified data (comparison target). Specify the date/time of the comparison target data. Each screen area can be switched between display and hide. The displayed graph can be enlarged, reduced or moved. Favorite data (waveforms) can be registered, managed and displayed. Capture the displayed graph screen image and copy it to the clipboard. Save the displayed "summary data" DB 3-4 Summary display item setting in [Setting] - [Viewer setting] [Tool] - [Compare with DB] Specify in the comparison target date/time setting area [View] menu [Favorite] menu [Tool] - [Graph Capture] [File] - [Save to 3. Summary/Display Tool: Multi Data Viewer Function (What to do) output "summary data" DB Export summary data in CSV format Description in a local PC as a new DB or overwrite the existing one with the same. Output the displayed "summary data" DB in CSV format for viewing on spreadsheet software. The data can be output with the current display settings, or specified period, summary unit and channel settings. * The Main Window and Comparison Window provide CSV Export. 3-5 Operation (How to do) DB] Specify the character code for CSV export in [Setting] - [Viewer setting] [Tool] export] [CSV 3. Summary/Display Tool: Multi Data Viewer 3.5 Preparing Logging Data Multi Data Viewer can read and summarize either of the following "logging data". (1) Logging data collected by the Setting Manager logger function directly from devices through communications at specified logging intervals (2) Logging data collected by EQUO devices at specified logging intervals 3.5.1 Logging Data Collected by Setting Manager Logger Function (1) Specify the logging conditions with Setting Manager. (2) Start the logger function and collect the measured data at the specified interval from the devices connected via Ethernet. (3) Save the collected logging data in a CSV file in the PC's memory. 3.5.2 Logging Data Collected by EQUO Devices (1) Prepare an SD memory card storing the logging data collected by EQUO devices in a CSV file. (2) Insert the SD memory card in the memory card slot of the PC or connected SD card reader/writer. 3-6 3. Summary/Display Tool: Multi Data Viewer 3.6 Starting/Exiting Multi Data Viewer 3.6.1 Starting Multi Data Viewer (1) Click the Multi Data Viewer shortcut on the Windows desktop or select "All programs" "OMRON" - "Multi Data Viewer Ver.1.00" from the Windows start button. (2) The Main Window appears. 3.6.2 Exiting Multi Data Viewer Click "Exit" ( ) in the Main Window toolbar to exit Multi Data Viewer. A confirmation message appears if Multi Data Viewer is accessing the "summary data" DB in the PC, and the data being summarized has not been saved yet. If an SD memory card (used to write data to the PC) is still in the SD card slot, remove it following the instruction shown on the PC screen. 3-7 3. Summary/Display Tool: Multi Data Viewer 3.7 Multi Data Viewer Main Window Configuration The following shows the Multi Data Viewer Main Window configuration. The image below include the entire configuration. However, some menu items or controls (e.g. summary functions) may not be displayed depending on the setting. Title Bar Toolbar Graph Display Area Section name Title bar Toolbar Graph area display Description Multi Data Viewer - [Main Window] - <Connection target> <Connection target>: Displays the open XDB file name. "New data" is shown if the data is newly summarized and the file name is not defined yet. Shows the icons to access individual functions. Click the corresponding icon to execute each function. Shows the bar/line graphs of specified channels data included in the displayed "summary data" DB. The graph display can be changed by setting the parameters such as graph horizontal axis (time axis) span (display period), resolution (summary unit), vertical axis data type/unit, date/time of the data, and bar graph type. The numeric display of the total sum, average, and maximum value in the graph is also available. 3-8 3. Summary/Display Tool: Multi Data Viewer 3.7.1 Main Window Toolbar Functions The Main Window toolbar provides icons for various functions. Clicking the toolbar icons executes the following functions: Icon Function ← "Back": Returns to the previously displayed graph. → "Forward": Shows the originally displayed graph again. File The "File" menu includes the following menu items. Create New File Creates an empty "summary data" DB in the PC and opens it. Open DB Opens a "summary data" DB saved in the PC. Save to DB Overwrites the original "summary data" DB saved in the PC. Save as… CSV import Disp. Locates the relevant logging data among the CSV collected files saved in a specified folder, summarizes the data and add it to the currently open "summary data" DB. The "Disp." menu includes the following menu items. Disp. Summary Switches to display or hide the summary area. area Disp. Setting Favorites Tool Setting Help Switches to display or hide "Fix scale box" and "Display target selection area". The "Favorite" menu includes the following menu items. Add to Favorites The data is attached with a marking and can be viewed later at a single click. Organize Displays the "Favorites" control menu. Favorites Favorites list The data items added to "Favorites" are included in the menu item list. The "Tool" menu includes the following menu items. Logging Starts Setting Manager. Compare with Integrates data obtained under different conditions with the Previous DB currently open "summary data" DB into comparative graph representation. Graph Capture Copies the displayed graph image to the clipboard. CSV Export Use this to output the data (extracted from the currently open "summary data" DB) for specified period, channels, and summary unit, in a CSV file with the "summary data" structure. Displays the "Viewer setting" window for various Multi Data Viewer settings. The window provides the following settings: ・ Setting for the auto opening of the last displayed data when Multi Data Viewer starts next time ・ Setting for Graph display ・Summary area display item selection ・CSV export character code setting ・Data type setting ・Channel Settings Multi Data Viewer Help Displays the Multi Data Viewer Help files. Version Information Exit Displays the version information. Exits Multi Data Viewer. 3-9 3. Summary/Display Tool: Multi Data Viewer 3.8 Creating/Saving "Summary Data" DB in PC The user can use Multi Data Viewer to create a "summary data" DB in the PC and summarize data for reference and analysis. The created "summary data" DB can be saved as a file (XDB file), which can be opened on Multi Data Viewer for reference and analysis. 3.8.1 Creating "Summary Data" DB Create a "summary data" DB. Click "Create New File" in the "File" menu in the toolbar. Multi Data Viewer creates and opens a new "summary data" DB. On the created "summary data" DB, "summary data" in CSV files can be imported, which can be then summarized and displayed in graph for analysis. If graphs are displayed in the Main Window when a new DB is created, Multi Data Viewer closes the displayed "summary data" and opens the new "summary data" DB. The "Create New File" menu item only creates a DB on Multi Data Viewer and its file is not saved in the PC. To retain the DB for future use, save it before closing. 3.8.2 Saving "Summary data" DB A "summary data" DB created or opened on Multi Data Viewer using the "Create New File" or "Open DB" menu item can be saved in a file (XDB file). Saved "summary data" DB files can be opened on Multi Data Viewer. The following shows the steps to save a "summary data" DB. (1) Click the "Save to DB" button in the "File" menu in the toolbar. (2) Enter the file name and click the "Save" button. 3-10 3. Summary/Display Tool: Multi Data Viewer 3.8.3 Adding Imported/Summarized Logging Data to "Summary Data" DB (CSV Import) When using a newly created "summary data" DB, import/summarize "logging data" and feed it into the empty summary data area in the Main Window. After this, repeat the same procedure of importing and summarizing additional logging data to fill the summary data input area in the Main Window. Note ・Multi Data Viewer can combine multiple "logging data" items from different EQUO devices into a single "summary data" DB for simultaneous viewing. For example, different types of "logging data" (e.g. temperature and power consumption) can be summarized in a single graph display for analysis. Example: Integrated power consumption and temperature data combined in a single graph display Make sure that the relevant "summary data" DB in the PC is opened. Summarize the "logging data" in "collected data" CSV files and add the summarized data to the open "summary data" DB. 3-11 3. Summary/Display Tool: Multi Data Viewer Follow the steps below to add data to the DB: (1) Click "CSV Import" in the "File" menu in the toolbar. The "Browse For Folder" window appears. (2) Specify the folder containing "summary data" and click the "OK" button. Multi Data Viewer automatically searches through the specified folder or drive to locate "summary data" options for selection. The results are shown in the following "Select Summary Target" window. Note: The search may take a while depending on the data quantity stored in a specified drive or folder. To cancel the search, click the "Cancel" button shown during the process at the left bottom of the window. (3) Select the corresponding checkboxes () in the "Tar." column in " Start Summary: " and click the "Start Summary" button. Note ・To select/deselect multiple summary data checkboxes simultaneously in the "Select Summary Target" window, hold Ctrl or Shift key while left-clicking the data items to select. When the items are selected, right-click to display the context menu and select the "Check the selected line." or "Clear the selected line. 3-12 3. Summary/Display Tool: Multi Data Viewer 3.8.4 Opening "Summary Data" DB The user can open a saved "summary data" DB to review and analyze the summary results. Note: To open another "summary data" DB, close the currently open "summary data" DB before opening the other. Follow the steps below to open a saved "summary data" DB. (1) Click "Open DB" in the "File" menu in the toolbar. (2) Specify the DB file and click the "Open" button. (3) The selected "summary data" DB is read into the Main Window. 3-13 3. Summary/Display Tool: Multi Data Viewer 3.9 Displaying Graph on Multi Data Viewer Multi Data Viewer provides the graph display of summary results (data of specified channels) supporting operational efficiency analysis. Various functions are available with the Multi Data Viewer Main Window for efficient review and analysis of summary result graphs. 3.9.1 Multi Data Viewer Graph Display Area Functions The Multi Data Viewer graph display area shows summary data in "summary data" DB in graph display. The area comprises the following sections: Graph Type Displayed Period Summary Unit Setting Area Setting Area Setting Area Date/Time Setting Area Summary Area Graph Area Data Type Setting Area Fix Scale Box Display Target Setting Area Section name Graph type setting area Display period setting area Description Specify the graph type to plot in the graph area. Specify the graph period to plot in the graph area. Summary unit setting area Date/time setting area Summary area Graph area Specify the summary unit for the graph to plot in the graph area. Data type setting area Fix scale box Display target setting area Specify the date/time for the graph to plot in the graph area. Shows a summary note of the displayed data. Displays summary graphs according to the settings shown below the graph area. The horizontal axis (time axis) and the scale can be enlarged or reduced by mouse operation. The data types to plot in the graph area can be individually specified for vertical axes 1 and 2. The same type cannot be specified for axes 1 and 1. Specify if the scale intervals for vertical axes 1 and 2 automatically change according to the displayed data or remain unchanged (fixed). Displays a list of the channels in specific "summary data". Use this to specify the target channels to plot in the graph area. 3-14 3. Summary/Display Tool: Multi Data Viewer 3.9.2 Setting Graph Display Various functions are available with the Multi Data Viewer graph display area for efficient review and analysis of summary result graphs. This section describes the support functions available with graph operation. (1) Specifying Displayed Data Type (Vertical Axis Unit) Up to two data types can be displayed in a single graph display. Specify the graph data type for "Ver. axis 1" and "Ver. Axis 2" in the data type setting area. Graphs in the specified data types are displayed in the graph display area. These settings automatically determine the value units for the individual axes (*). * The "units" specified with Setting Manager ("Data type setting") beforehand are selected. The data type unit specified for "Ver. Axis 1" is shown at the left of the graph area, and the "Ver. Axis 2" data type unit, at the right of the graph area. The same data type cannot be specified for "Ver. Axis 1" and "Ver. Axis 2". (2) Specifying Channels to Display Specify the channels to display in a graph in the display target setting area. The channels of the data types specified in step (1) for "Ver. Axis 1" and "Ver. Axis 2" are displayed in individual lists. Select the "Display" checkboxes () for the channels to display. The "display target setting area" provides the following information. Item Description Checkbox A channel with the checkbox selected () is a summary target. Color sample The graph for the channel is displayed in this color. Name The name to identify each channel. By default, the string consisting of data type/serial No./Unit No./data ID is entered. The checkboxes can be hidden or displayed by switching the "Disp. Settings" selection in the “Disp.” menu in the toolbar. Changing the checkbox settings in the Display column updates the summary and shows the updated graph. 3-15 3. Summary/Display Tool: Multi Data Viewer (3) Changing Display Period Change the display period setting on the graph's horizontal axis (time axis) in the "Display period setting area". Five options: Minutely, Hourly, Daily, Monthly and Yearly are available. Upon selecting the option, the data summary is performed again. The horizontal axis range and summary unit vary depending on the display period as follows: Display period Axis range Summary unit Minutely 1 minute No summary Hourly 1 hour 1 minute Dayly 1 day 1 minute/30 minutes/60 minutes (Selectable) Monthly 1 month 30 minutes/60 minutes/1 day (Selectable) Yearly 1 year 1 day/1 month (Selectable) (4) Specifying Summary Unit (Time Unit to Display Summary in Graph) Specify the time unit (summary unit) for graph display in the summary unit setting area. The following summary unit options are available depending on the display period specified in step (3): Display period Summary unit setting Default setting Minutely No summary No summary Hourly 1 minute 1 minute Daily 1 minute/30 minutes/1 hour 1 hour Monthly 30 minutes/1 hour/1 day 1 day Yearly 1 day/1 month 1 month The following shows the summary procedure for each summary unit option: Summary Summary procedure for graph display unit No summary Plot all the momentary values 1 minute "00": Plot the sum of the momentary values starting from 00 min. 00 sec. to immediately before 01 min. 00 sec. 30 minutes "0": Plot the sum of the momentary values starting from 0 hour 00 min. 00 sec. to immediately before 0 hour 30 min. 00 sec. "30": Plot the sum of the momentary values starting from 0 hour 30 min. 00 sec. to immediately before 1 hour 00 min. 00 sec. 1 hour "0": Plot the sum of the momentary values starting from 0 hour 00 min. 00 sec. to immediately before 1 hour 00 min. 00 sec. 1 day "1": Plot the sum of the momentary values starting from 0 hour 00 min. 00 sec. of the day to immediately before 0 hour 00 min. 00 sec. of the next day. 1 month "1": Plot the sum of the momentary values starting from 0 hour 00 min. 00 sec. of the first day of the month to immediately before 0 hour 00 min. 00 sec. of the first day of the next month. 1 year "2011": Plot the sum of the momentary values starting from 0 hour 00 min. 00 sec. of the Jan. 1st of the year to immediately before 0 hour 00 min. 00 sec. of the Jan. 1st of 2012. 3-16 3. Summary/Display Tool: Multi Data Viewer (5) Specifying Display Date and Time To specify the date and time for the graph display, select "Date/time" in "Graph Setting". The shown button and combo box options vary depending on the selected display period. ・Minute: Select year, month, day, hour and minute values in the combo boxes. The previous minute and next minute can be selected by using the buttons. ・Hour: Select year, month, day and hour values in the combo boxes. The previous hour and next hour can be selected by using the buttons. ・Day: Select year, month and day in the combo boxes. The previous day and next day can be selected by using the buttons. ・Month: Select year and month in the combo boxes. The previous month and next month can be selected by using the buttons. ・Year: Select year in the combo box. The previous year and next year can be selected by using the buttons. (6) Switching Bar Graph Type The graph type can be changed for energy data displayed in a bar graph. Select the type from three types: summation, stacked, and grouped bar graphs in the "Graph Type" area. 3-17 3. Summary/Display Tool: Multi Data Viewer ・Summation: Displays the summed values of selected channel values. ・Buildup: Stacks the summed values of selected channel values in different colors. ・Compare: Displays the selected channel values independently side-by-side. Note ・Temperature, particle, momentary current level and other value graphs, which are displayed in line graphs are not influenced by switching the graph type. The graph type does not change. 3-18 3. Summary/Display Tool: Multi Data Viewer (7) Switching to Detailed View The graph display can be viewed in detail. Move the mouse over a specific measurement point on the displayed bar graph or line graph. The corresponding portion of the graph is highlighted and the value in the time range is shown in a tooltip. Double-clicking the selected portion (while it is highlighted) displays a detailed graph image of 1 the time range.* (Drill-down function) The original window (recorded in the window history) can be accessed by clicking the "Back" button from the drilled-down graph window. The drill-down function is only enabled when the default summary unit is specified for the selected display period. For example, since the default summary unit for the display period of "year" is "month", "month" must be selected to enable the drill-down function. *1: Not available for the "Hour" setting in "Display period". (8) Fixing Scales Specify whether the scale interval for each vertical axis automatically changes according to the displayed data, or fixed to the current representation. Select the "Fix Scale" checkbox to use the fixed scale. Select the checkbox () to fix the scale to intuitively check the amount of value variations when continuously changing the display date and time, or repeatedly displaying/hiding the channel display. (9) Hiding Areas from Display Hiding "Summary Area" Click the "Disp. Summary Area" in the “Disp.” menu. Hiding "Display Target Selection Area" Click the "Disp. Settings" in the “Disp.” menu. 3-19 3. Summary/Display Tool: Multi Data Viewer (10) Checking Window History Multi Data Viewer provides the history of up to 16 windows previously displayed. If any windows are recorded in the history, the "Previous" and "Next" buttons at the left end of the toolbar are enabled. Use these buttons to access previously displayed windows. (11) Mouse Operation of Graph Area The following shows the graph operation in the graph area available by using the mouse: Function Operation Description Data display in Point with the mouse The color of the pointed graph changes to tooltip its complementary color. The pointed graph data value is shown. Zoom in Drag the area The area is encircled in light gray. The area in the graph is magnified in the X-axis direction to include the points from the left drag start to the release, as well as their immediately preceding and following points in the view. Change the graph display setting to cancel the zoomed-in view. Zoom out Right-click on the Returns to the original magnification ratio zoomed-in view, or click before zoom-in. the left button on the scroll bar shown at the bottom of the graph area Scroll Scroll the scroll bar at the The graph area view shifts in the direction bottom of the graph area the scroll bar is moved. to the left or right 3-20 3. Summary/Display Tool: Multi Data Viewer 3.9.3 Displaying Summary Note The summary area shows a summary note of the displayed data in numerical values. The values specified in "Setting" are used as the coefficients to summarize "Rate" and "CO 2 emissions". Specify if the following summary values are displayed for data other than energy data. Display item Description Summary The value obtained by the "Summary method" value specified in "Data Type Setting" with the Setting Tool. Example: When the data summary method for the "Temperature" data type is set to "Average", the average value is displayed. Note ・Specify whether each data is "energy data" or not in "Data Type Setting" with Setting Manager beforehand. 3-21 3. Summary/Display Tool: Multi Data Viewer 3.10 Comparing with Data at Different Date/Time Multi Data Viewer provides data comparison display allowing the user to compare the currently displayed summary data with another data (comparison target) of different date/time included in the same DB. 3.10.1 Opening Comparison Window Follow the steps below to open the Comparison Window. (1) Click the "Compare With Previous Data" button in the "Tool" menu in the Main Window toolbar. (2) The "Comparison Window" appears to show the currently displayed "summary data" as the "comparison source" and specific previous data in the same DB as the "comparison target". The window uses the same display settings (display period, summary unit, data type, and scale fixing) as used by the Main Window at the time the " Compare With Previous Data " button is clicked. 3.10.2 Closing Comparison Window Follow the steps below to close the Comparison Window. (1) Click the "Close" button in the toolbar in the Comparison Window. The window closes and the Main Window returns. 3-22 3. Summary/Display Tool: Multi Data Viewer 3.10.3 Comparison Window Configuration Use this window to compare the displayed data (comparison source) with another data (comparison target) of different date and time. The window comprises the comparison source summary/data display area at the left and comparison target summary/display target setting area at the right, as shown below: Comparison Source Date/Time Area Comparison Source Summary Area Comparison Target Date/Time Area Comparison Target Summary Area Graph Area Data Type Setting Area Fix Scale Box Comparison Source Data Display Area Section name Comparison source date/time display area Comparison source summary area Comparison target date/time area Comparison target summary area Graph area Data type setting area Fix scale box Comparison source data display area Comparison target display target setting area Comparison Target Display Target Setting Area Description Shows the comparison source date/time to plot in the graph area. Shows the comparison source summary to plot in the graph area. Shows the comparison target date/time to plot in the graph area. Shows the comparison target summary to plot in the graph area. Displays comparison source and target summary graphs according to the settings shown below the graph area. ・The window does not display any comparison target graph if the target does not include the data type selected by using the Main Window data type selection function. ・The bar graphs in the Comparison Window are available only in the summation type. The data types to plot in the graph area can be individually specified for vertical axes 1 and 2. The same type cannot be specified for axes 1 and 1. Specify if the scale intervals for vertical axes 1 and 2 automatically change according to the displayed data or remain unchanged (fixed). Shows the setting to specify the comparison source data to plot in the graph area. Specify the comparison target data to plot in the graph area. 3-23 3. Summary/Display Tool: Multi Data Viewer ・The comparison source data date/time setting and display target setting are automatically fixed to the values specified for the Main Window at the time the "Compare with DB" button is clicked. ・The comparison target data date/time is automatically set to the value immediately preceding to the date/time of the data displayed in the Main Window. (If the display period is "Day" and the Main Window data is dated Dec. 20, the comparison target data date is Dec. 19; if the display period is "Hour" and Main Window shows the 13:00 data, the target data time is 12:00.) (1) Displaying Comparison Source The comparison source data display area shows the same information as the comparison source summary data displayed in the Main Window at the time the Comparison Window is started. The Comparison Window does not provide display condition settings. To change the settings, return to the Main Window, and start the Comparison Window again after completing necessary settings. (2) Selecting Comparison Target Specify the display conditions used to plot summary data with different conditions as the comparison target. The operation is similar as the display condition setting procedure in the Main Window. The Comparison Window does not provide the graph type and display period settings. To change the settings, return to the Main Window, and start the Comparison Window again after completing necessary settings. 3.10.4 Comparison Window Toolbar Functions Some functions assigned to the Comparison Window toolbar are different from the Main Window toolbar. Clicking the toolbar icons executes the following functions: Disp. The “Disp.” menu includes the following menu items. Disp. Switches to display or hide the summary area. Summary Area Disp. Settings Switches to display or hide "Fix scale box" and "Display target selection area". CSV Export Graph Capture Close Use this to output the data (extracted from the currently open "summary data" DB) for specified period, channels, and summary unit, in a CSV file with the "summary data" structure. Copies the displayed graph image to the clipboard. Closes the Comparison Window and return to the Main Window. 3-24 3. Summary/Display Tool: Multi Data Viewer 3.11 Other Operating Features of Multi Data Viewer 3.11.1 Saving Data in "Favorites" Clicking "Add to Favorites" attaches a mark to a channel or channel folder enabling the user to access the data later at one click. The channels added to "Favorites" are listed below the last "Favorites" menu item on the menu bar. The "Favorites" data is saved in the PC and cannot be shared. (1) Adding to Favorites Click "Add to Favorites" in the "Favorites" menu. Multi Data Viewer saves the channel being accessed and the display settings in the PC. Enter the name for the new "Favorites" data in the "Name" area. The data names already registered are shown in the list area below the "Name" box. Click the "OK" button to add the data to registration. The added data name is shown below the last item in the list. 3-25 3. Summary/Display Tool: Multi Data Viewer (2) Organizing Favorites Click "Organize Favorites" in the "Favorites" menu. The “Organize Favorites” window appears. Using this window, the user can edit the names of data items or delete data items registered in "Favorites". To change the data name, select the data in the list and click the "Change Name" button, then enter a new name. Select the data items to delete and click the "Delete" button. The selected data is removed from "Favorites". 3.11.2 Outputting Summary Data in CSV Format The summary data currently viewed can be output in a CSV file with the same conditions and display settings (as those used in the current viewing). This facilitates analysis of the data using other spreadsheet software. For "CSV Export", the user can specify not only the CSV file destination folder and file name, but also other items including the output type, output period, summary unit, and output channels. Note ・Please note that the CSV files output in "CSV Export" in the "Tool" menu and those imported in "CSV import" in the "File" menu are not compatible. The first files contain summary data ("summary files") and the latter, logging data ("collected files"). 3-26 3. Summary/Display Tool: Multi Data Viewer (1) Click the "CSV Export" button in the "Tool" menu in the toolbar. (2) The "CSV Export Setting" window appears. Item Output Format Output Period Aggregation setting Select Channel Description Select the data format used to output a CSV file. Refer to the format description in a later section for the output data format. Specify the data period for CSV Export. Click the calendar icons in the date boxes to specify the period. Specify the data summary unit for CSV Export. Select the channels for CSV Export using the checkboxes. All the checkboxes are selected () by default. (3) Select the data to output and the save destination, then click the "OK" button. The summary data is output in a CSV file. 3-27 3. Summary/Display Tool: Multi Data Viewer 3.11.3 Outputting Graph Image to Clipboard The user can copy the currently displayed graph image to the clipboard. (1) Display the graph image to capture. Click "Graph Capture" in the "Tool" menu in the toolbar. (2) Multi Data Viewer outputs the graph image to the clipboard and displays the confirmation window. (3) The image output to the clipboard can be pasted in other software. 3-28 3. Summary/Display Tool: Multi Data Viewer 3.11.4 Setting Multi Data Viewer (1) Viewer Setting (1) Click the "Setting" button in the toolbar in the Main Window. The "Viewer Setting" window appears. Setting item Description Automatic connection Setting Specify if Multi Data Viewer automatically opens the last displayed data next time it is started. Graph Setting Specify if a legend for the graph is displayed. Also specify if the legend includes the "Data type" specified in the channel setting, when the legend is displayed. display Legend/data type CSV Export/Character Set setting Specify the CSV file character encoding for CSV Export. Fee Conversion Factor Setting Specify the rate conversion coefficient. The sum of integrated powers is multiplied by this coefficient to obtain the rate value displayed in the summary area. CO2 Conversion Factor Setting Specify the CO2 conversion coefficient. The sum of integrated powers is multiplied by this coefficient to obtain the CO 2 value displayed in the summary area. Click the "OK" button after changing Viewer settings. The Main Window returns. Click the "Cancel" button to abort the settings. 3-29 3. Summary/Display Tool: Multi Data Viewer (2) Data Type Setting Click the "Setting" button in the data type setting area at the bottom of the "Viewer setting" window. The "Data type setting window" appears enabling the user to specify data types. Item Data Type Name Unit Decimal Digits Logarithm Energy Data Description Displays the data type description. System-defined names cannot be edited or deleted. The unit for the data type. The unit specified here is displayed at the side of the vertical axis of the graph. The significant digit for the data type. Values are rounded at this digit for graph and summary area displays. Specifies if the vertical axis is represented in logarithm when displaying data of the data type. Select the checkbox () for logarithmic representation. Specifies if the rate and CO2 emission level are displayed in the summary area. If this is selected, the rate and CO2 emissions values are displayed. System-provided data cannot be edited or deleted. To add a new data type, enter it below the last line of the list. For data type editing, select the registered item and edit its data type. Clicking the "OK" button returns the "Viewer setting" window. Clicking the "Cancel" button aborts the settings and closes the window. 3-30 3. Summary/Display Tool: Multi Data Viewer (3) Channel Setting Click the "Setting" button in the channel setting area at the bottom of the "Viewer setting" window. The "Channel setting window" appears enabling the user to specify channels. Item Device ID Description Displays the measurement device name. Channel Address Displays the address to identify the channel. Measurement Type Channel Name Displays the data type of the measured data. Data Type Displays the channel name. Edit this item to change the displayed channel name. Select the type of the channel data in the list. For channel editing, select the registered channel and edit its settings. Clicking the "OK" button returns the "Viewer Setting" window. Clicking the "Cancel" button aborts the settings and closes the window. 3-31 3. Summary/Display Tool: Multi Data Viewer 3.12 Multi Data Viewer CSV Output Data Format This section describes the data structure of CSV files output by executing "CSV Export" in the "Tool" menu in the Main Window. The following shows the summary data file (summary file) structure. Item Extension Character code Measurement Type Default file name Data type Description .csv (all files) Uses the character code specified in "CSV export setting" in the "Viewer setting" window. Displays the data type of the measured data. <Start date/time> - <End date/time>".csv" Select the type of the channel data in the list. 3.12.1 Report Type File Data Structure The following shows the "Report type" CSV data structure output by executing "CSV Export" in the "Tool" menu in the Main Window. The file uses a commonly-used CSV format. (1) Header Section DATE,TIME,MSEC, <Channel Name> (<Unit 1>)( <Data type name 1>),… Item <Channel Name {n}> <Unit {n}> Description The channel name specified by the user with the server. The unit of the data type (specified for each recording device) of the nth data displayed in the graph (The value specified for the "Unit row" in the data type setting window). * "-" is output if the data has no unit. Note that "All data" output uses a different structure. <Data type name {n}> The value specified in the "Data type" row in the channel setting window, output for the nth data. <SP> A half-width space used as a character. {n}: 1 to the number of repetitions multiplied by the number of recording devices. (2) Data Section <Year-Month-Day>","<Time>","<Millisecond>","<Value 1>,"… ….. Item <Year-Month-Day> <Time> <Millisecond> <Value {n}> Description The year, month and day of the displayed graph. Output in the YYYY/MM/DD format. The hour, minute and second of the displayed graph. Output in the hh:mm:ss format. "00" is output for a time value smaller than the non-displayed period. For example, if the display period is "Day" (summary unit: 30 minutes), only "00" or "30" are output for the minute value. The second value is fixed to "00". The millisecond value of the displayed graph. Output in the "000" format. "000" is fixed to the value if the graph does not display momentary values. The value corresponding to the header of the displayed graph. Any of the following values: 3-32 3. Summary/Display Tool: Multi Data Viewer PI…Integrated value, AVE…Average value, MAX…Maximum value, and MIN…Minimum value * "0" is output for PI, if SUMMARY_TYPE is other than INTEGRAL (Same as the graph area display). {n}: 1 to the number of repetitions multiplied by the number of recording devices. The following shows concrete examples: [Example 1] Display period is "Day" (Summary unit: 30 minutes) in the Main Window DATE,TIME,MSEC,Integrated power consumption1(kWh)(INTEGRAL_POWER_CONSUMPTION),Integrated power consumption2(kWh)( INTEGRAL_POWER_CONSUMPTION),Temperature (℃) (TEMP) 2011/06/06,00:00:00,000,22.43,12.01,18.4 2011/06/06,00:30:00,000,20.21,11.89,18.4 2011/06/06,01:00:00,000,22.12,10.73,18.3 2011/06/06,01:30:00,000,20.03,10.24,18.2 ... 2011/06/06,23:30:00,000,21.48,11.96,18.5 [Example 2] Display period is "Hour" in the Main Window DATE,TIME,MSEC, Integrated power consumption1(kWh)(INTEGRAL_POWER_CONSUMPTION), Integrated power consumption2(kWh)(INTEGRAL_POWER_CONSUMPTION),Temperature(℃)(TEMP) 2011/06/06,12:00:00,000,22.43,12.01,18.4 2011/06/06,12:01:00,000,20.21,11.89,18.4 2011/06/06,12:02:00,000,22.12,10.73,18.3 2011/06/06,12:03:00,000,20.03,10.24,18.2 ... 2011/06/06,12:59:00,000,21.48,11.96,18.5 3-33 3. Summary/Display Tool: Multi Data Viewer 3.12.2 M2M Type File Data Structure The following shows the CSV file data structure for "M2M type" output by executing "CSV Export" in the "Tool" menu in the Main Window. The M2M type is a standard data format used by OMRON's tools. Each line starts with a string representing the definition of the line. (1) Header Section The following shows the file data structure output in the "All data" mode: Header Section (Line 1) HEAD,DATE,TIME,"<Data type name1>(<Unit 1>)(<Recording device name 1>[_KM<Unit No. 1>]<SP>< Summary type 1><Measurement target channel ID 1>),"… The section enclosed by brackets ([ ]) is output only for the data recorded with KMX. Item <Data type name {n}> <Unit {n}> <Channel Name {n}> <Summary type {n}> <Measurement target channel ID{n}> <SP> Description The data type of the nth data. The unit for the nth data. The channel name from which the nth data is output. Outputs the summary method used to summarize the nth data. PI… Integrated Value, AVE… Average Value, MAX… Maximum Value, MIN… Minimum Value. * Integrated values are only used for integrated power consumption or pulse data outputs. Outputs the data ID the corresponding sensor outputs for the nth data. A half-width space used as a character. (2) Data Section Data Section (Line 2 and thereafter) DATA,<Year-Month-Day>,<Time>,<Value 1>,<Value 2>,… Item <Year-Month-Day> <Time> <Value {n}> Description The year, month and day of the displayed graph. Output in the YYYY/MM/DD format. The hour, minute and second of the displayed graph. Output in the hh:mm:ss format. The value recorded by the relevant sensor at a specified time. [Example 3] HEAD,DATE,TIME," Integrated power consumptionN(kWh)(X001010_4/8 PI8)", "Integrated power consumption(kWh)(X001010_3/6 PI6)", "Temperature(℃)(SYSTEM11_1 AI1)" DATA,2011/06/29,00:00:00,3125,4575,21.7 DATA,2011/06/29,01:00:00,3650,4500,21.4 DATA,2011/06/29,02:00:00,3450,4250,21.2 DATA,2011/06/29,03:00:00,3600,4050,21 DATA,2011/06/29,04:00:00,3900,4350,20.8 3-34 3. Summary/Display Tool: Multi Data Viewer 3.12.3 Comparison Window CSV Output File Data Structure The following shows the CSV file data structure output by executing "CSV Export" in the Comparison Window. The user can output the data at a specified period, channel and summary unit in a CSV file from the currently open "summary data" DB. (1) Header Section DATE,TIME,MSEC,<Data type name (1) 1>(<Unit (1) 1>)(<Channel Name (1) {n}>),… DATE,TIME,MSEC,<Data type name (2) 1>(<Unit (2) 1>)(<Channel Name (2) {n}>),… ….. (1): Comparison source; (2): Comparison target Item <Data type name {n}> Description The value specified in the "Data type" row in the channel setting window, output for the nth data. <Unit {n}> The unit of the data type (specified for each recording device) of the nth data displayed in the graph (The value specified for the "Unit row" in the data type setting window). * "-" is output if the data has no unit. Note that "All data" output uses a different structure. <Channel Name (1) {n}> The channel name specified by the user with the server. <SP> A half-width space used as a character. (1): Comparison source; (2): Comparison target {n}: 1 to the number of repetitions multiplied by the number of recording devices. (2) Data Section <Year-Month-Day>,<Time>,<Millisecond>,<Value (1) 1>,… <Year-Month-Day>,<Time>,<Millisecond>,<Value (2) 1>,… ….. Item <Year-Month-Day> Description The year, month and day of the displayed graph. Output in the YYYY/MM/DD format. <Time> The hour, minute and second of the displayed graph. Output in the hh:mm:ss format. "00" is output for a time value smaller than the non-displayed period. For example, if the display period is "Day" (summary unit: 30 minutes), only "00" or "30" are output for the minute value. The second value is fixed to "00". <Millisecond> The millisecond value of the displayed graph. Output in the "000" format. "000" is fixed to the value if the graph does not display momentary values. <Value {n}> The value corresponding to the header of the displayed graph. Any of the following values: PI…Integrated value, AVE…Average value, MAX…Maximum value, and MIN…Minimum value * "0" is output for PI, if SUMMARY_TYPE is other than INTEGRAL (Same as the graph area display). {n}: 1 to the number of repetitions multiplied by the number of recording devices. [Example 4] The display period is "Year" in the Comparison Window DATE,TIME,MSEC,Integrated power consumption(kWh)(1F, No.2 3-35 3. Summary/Display Tool: Multi Data Viewer Building),Temperature(℃)(2F, No.2 Building),DATE,TIME,MSEC, Integrated power consumption(kWh)(1F, No.2 Building Temperature),Temperature(℃)(2F, No.2 Building Temperature) 2011/01/01,00:00:00,000,22.43,18.4,2010/01/01,00:00:00,000,12.01,20.5 2011/02/01,00:00:00,000,20.21,18.4,2010/02/01,00:00:00,000,11.89,20.4 2011/03/01,00:00:00,000,22.12,18.3,2010/03/01,00:00:00,000,10.73,20.4 2011/04/01,00:00:00,000,20.03,18.2,2010/04/01,00:00:00,000,10.24,20.3 ... [Example 5] The display period is "Minute" in the Comparison Window DATE,TIME,MSEC,Integrated power consumption(kWh)(1F, No.2 Building),Temperature(℃)(2F, No.2 Building),DATE,TIME,MSEC, Integrated power consumption(kWh)(1F, No.2 Building Temperature),Temperature(℃)(2F, No.2 Building Temperature) 2011/06/06,12:04:00,000,22.43,18.4,2011/08/24,06:01:00,000,12.01,20.5 2011/06/06,12:04:01,000,20.21,18.4,2011/08/24,06:01:01,000,11.89,20.4 2011/06/06,12:04:02,000,22.12,18.3,2011/08/24,06:01:02,000,10.73,20.4 2011/06/06,12:04:03,000,20.03,18.2,2011/08/24,06:01:03,000,10.24,20.3 ... 2011/06/06,12:04:59,000,21.48,18.5,2011/08/24,06:01:59,000,11.96,20.7 3-36 Revision History The specifications of this product are subject to changes without prior notice due to the addition of new functions or modification for improvement. These changes will be reflected in relevant manuals whenever such changes are made. The revised manual contains the revision history with the manual revision codes and the revision descriptions. Manual Revision Code The manual revision code is provided at the lower right corner of the manual. Rev.□ Revision History Revision Code Revision Code Date Description Rev. A November 2012 First edition.(Japanese) Rev. B July 2013 Revised due to upgrade Multi Data Viewer Light software. Rev. C August 2013 First edition.(English) Revised due to correction of erroneous description. As of August 2013 (WEB Ver. 3)