1
4
Distance Process Monitoring using
LabVIEW Environment
Valentin Sgârciu and Grigore Stamatescu
University POLITEHNICA of Bucharest
Romania
1. Introduction
Technological process supervision assumes acquisition, processing and returning the
commands for a big number of parameters. At the same time, it is necessary to monitor the
investigated parameters, because the history is needed in guaranteeing the performances,
but also establishing the causes which lead to malfunctions.
Communication technologies and we refer here to Internet, which is mainly spread, allow
data, acquired from long distances, to be concentrated in high performance servers. In the
same time, following the temporal evolution of acquired parameters can be done from any
computer, connected to Internet. This issue is suited both in technological processes, but also
in education process, where a laboratory with high performance acquisition equipments and
an Internet connection can be used by other laboratories less equipped. We have focused on
a solution of data acquisition/distribution, using Lab VIEW framework, designated for
remote process control and long distance learning.
The chapter is organised as follows: Section 2 presents arguments in favor of remote data
aquisition and ways it can benefit the industrial operator. Section 3 shows our general view
on such a system and a laboratory implementation of a simulation environment. Section 4 is
dedicated to the client applications, each running on a dedicated network-connected
workstation. Section 5 describes the main server application, the communication
technologies we have used and an analysis of network performance in the current scenario.
Section 6 presents the conclusion we can draw from our work, further developments and
improvements.
2. Why remote data aquisition?
In many of industrial processes, the control at a distance of the equipments based on the
received parameters is preferred. Sometimes, this process is absolutely necessary because of
some high risk elements, or because of the conditions that do not allow the user to access it.
As an example, one can mention the atomic piles where because of the high degree of
radiations, the watch and control of the parameters must be done at a distance. Another
example can be the watch of the furnaces, especially in the foundry works where because of
the high temperatures, the user cannot physically stay in those areas.
More than this, an advantage of the watch/ control at a distance is the possibility to watch
more over than one equipment with a single acquisition server. This aspect allows the
www.intechopen.com
68
Modelling, Programming and Simulations Using LabVIEW™ Software
taking over of the data from more sensors connected to various industrial equipments and
also the transmission of the controls to them. The process can be developed from more than
one host in the same time. Thus, there can be a client host that commands through Internet
the parameters modification of an installation, relying on a pressure sensor, while another
client modifies the working characteristics of a thermal system, both sensors being
connected to the same server. To sum up, one can say that the advantages of control at a
distance of the industrial equipment, relying on the watch/control of the parameters are:
•
people should not have to work in the risk areas;
•
the possibility to control more than one equipment in the same time from different
hosts;
•
the possibility to watch from a larger number of stations, without extra investments.. It
should be mentioned that the control of a sensor can be done by a single terminal, while
the watch can be developed from many such terminals;
•
the possibility of making some statistics in real time of the functioning of the
equipment. This can be done even by the management department of a company.
3. Distributed system architecture
This section describes the distributed system, set up in an laboratory environment. It
includes the following components:
•
3 workstations: PCs running Windows XP Professional SP3 and different versions of
LabVIEW (higher than 8.2). Common hardware configuration Pentium 4 processor 3.06
GHz, 512MB RAM, 80GB HDD.
•
1 workstation acting as application server: PC running Windows XP Professional SP3
and LabVIEW 2009. Superior hardware configuration Pentium DualCore processor,
2GB RAM, 250GB HDD.
•
network infrastructure: network server, routers, ethernet cables;
•
always-on internet connection: required by the application server to share information
with the outside world.
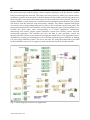
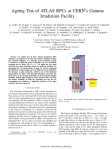
A diagram of the proposed system is shown in Figure 1.
In order to prove the feasability of the distance monitoring application, we have used
multiple processes - developed in LabVIEW and running on the corresponding
workstations. For this chapter, three applications have been chosen:
•
Temperature Monitoring and Control: based on the plug-in data aquisition board NI
PCI-6014E (produced by National Instruments), which focuses both on the continous
aquisition of analog temeperature samples and on the generation of digital commands
for a heating element with the possibility of dynamic adjusting of the temperature
limits (lower and upper limit) for the desired operation of the system;
•
Acquisition/Generation of Digital Signals: based on the plug-in KPCI-3102 (produced
by Keithley) board which targets mainly the acquisition of digital signals and the
generation of numeric commands to the exterior;
•
Environmental Monitoring throughWireless Sensor Networks: based on IRIS 2,4GHz
wireless sensor nodes (produced by Memsic Inc.) forming a self-organizing, self-healing
wireless mesh network and a MIB520 USB gateway as a data sink. The gateway is then
connected with LabVIEW thorugh appropiate drivers and the environment data
(temperature, humidity, pressure, light, acceleration) is passed on to the server for
processing, analyisis and storage.
www.intechopen.com
Distance Process Monitoring using LabVIEW Environment
69
Fig. 1. Proposed Diagram of the Distributed System
For the chosen applications, the data acquisition boards/serial gateway represent the core of
the local hardware system. The selection of hardware components was made in order to
demonstrate the good integration with LabVIEW and the remote communication in the local
network or Internet even if we are dealing with products from different manufacturers.
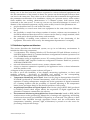
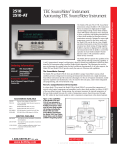
The principle scheme of the NI PCI-6014E is shown in Figure 2 and we then make short
comments on the different blocks:
•
I/O Connector: the connector to which the inputs and outputs from real world are
brought up; the connector is prolonged through a ribbon cable next to a connection
board where, through screw terminals, electrical links with real world are made;
•
Analog Input: analogical inputs block; its components are: the analogical multiplexer
MUX, the instrumental amplifier NI-PGIA with programmable amplification factor, the
numerical-analogical converter ADC, the temporary memory for numerical equivalents
of input signals AI FIFO and the trigger modes for input signals Analog Trigger;
•
Analog Output: the analogical outputs block; its components are: two numericalanalogical converters (DAC0 and DAC1) and a memory (AO FIFO) where the
numerical equivalents of analogical output signals are brought, as well as the necessary
controls for choosing the working domain and the polarity of the output tension;
www.intechopen.com
70
Modelling, Programming and Simulations Using LabVIEW™ Software
Fig. 2. Principle scheme of National Instruments PCI-6014E
•
Digital I/O: numerical inputs/outputs block composed of 8 pins for general usage that
can be individually configured, through software, as numerical inputs, respective
numerical outputs;
•
Counters: contains two counters of 24 bits, each one having two inputs (Source and
Gate), one output (Out) and two software registers capable of different operations;
•
PFI (Programmable Function Interface): contains 10 connections with the outside of the
board through which one can collect temporary signals from outside and can generate
different kinds of internal board signals, inclusively the signals in relation with the
operation mod for the two counters of 24 bits;
•
Digital Routing: contains all the circuits which manage the data flow between PCs
pipe-line and the acquisition subsystems (analog and digital inputs/outputs, counters).
The numeric routing circuits use FIFO memory in each subsystem to ensure an efficient
flow of data. Also, through these circuits pass temporal and control signals which
synchronize the acquisition;
•
RTSI (Real-Time System Integration Bus): an additional pipe-line through which you
can achieve synchronization for specific measuring functions, when there are more than
one acquisition board installed on the same PC, making use of the same time events;
•
Bus Interface: contains the hardware components through which the acquisition board
connects to the PCs pipe-line, also it requires a driver which is included with the
product.
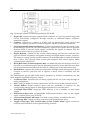
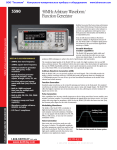
The multifunction plug-in KPCI-3102 board, produced by Keithley Instruments, has the
block diagram described in Figure 3, where:
•
16 Channel Mux: represents the 16 analog inputs fed into the Gain Amp through an
analog multiplexer;
•
ADC: analog to digital converter which allows for the control of the conversion clock;
•
Tristate Buffers: tristate memory units with the possibility of selection for the
corresponding analog inputs or their digital equivalents on two 8bit ports;
•
1 kSample Input FIFO: temporary FIFO memory of 1k of memory on each input
sample;
•
Bidirectional 8bit Latch: programmable bidirectional memory units for the digital
input/ outputs (DIO), ports A and B;
•
4 User Counter/Timers 16bit each: four 16bit counter/timers, available to the user;
•
Multiplying DAC: digital to analog converters with multiplication (two);
•
Trigger Clock Logic; A/D Counter 24bits; TScan Counter 24bits: logical circuits for
external synchronization of the acquired analog channels;
www.intechopen.com
Distance Process Monitoring using LabVIEW Environment
71
Fig. 3. Block Diagram of the Multifunction Digital Analog I/O Board KPCI-3102
•
CGL Reg., Channel Parameter Reg.: registries for external configuration;
•
PCI Bus Interface: connection to the computer PCI Bus.
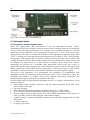
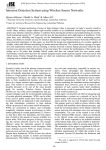
Connecting the workstation with the installed KPCI-3102 board to the physical process, a
wide ribbon cable is used 1:1 and a screw terminal board (see Figure 4).
Fig. 4. Connecting the Data Acquisition Boards through 1:1 Cable to the Screw Terminal
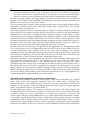
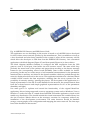
Finally, we use the MIB520CB USB Interface board for USB connectivity to the IRIS wireless
sensor network we have deployed throughout the laboratory. This provides communication
capabilities as well as in-system programming for the processor/radio boards of the nodes.
It is supplied with power via USB bus. Our model CB employs a female connector. The
board uses a FTDI FT2232C chip to use USB ports as virtual COM ports which are later used
for data acquisition. Therefore the appropiate drivers have to be installed on first use. It will
install two COM ports. The lower one is used for mote programming which we will not
handle in this paper and the higher number one for data communication via USB. A top
view photo of the MIB520CB is shown in Figure 5.
www.intechopen.com
72
Modelling, Programming and Simulations Using LabVIEW™ Software
Fig. 5. Photo of top view of an MIB520CB
4. Client applications
4.1 Temperature monitoring and control
Many real applications, often encountered in process automation practice, require
maintaining the process variables between certain limits, realising therefore a bipositional
control of the investigated parameters. For example, an air conditioning unit for a HVAC
application should maintain room temperature around 24ºC ± 0.1ºC. This means that,
during winter, the heater is switched on until the room temperature reaches the upper limit
of 24.1ºC, turning it off until the temperature reaches the lower limit of 23.9ºC and repeating
the sequence. This happens also in summer conditions (heat) when the system controls the
cooling element of the unit. This simple example can be accompanied by many others such
as: keeping the liquid level in a tank between certaing values using level sensors,
mantaining the pressure in a container using pressostats, which prove the variety of
applications which employ bipositional control. Electronic control units can use signal from
analog transducers with unified current output (4mA ÷ 20mA) and there are also models
which allow connection directly to the sensitive element for the investigated variable.
The goal of this application is to demonstrate the usefullness of multifunction data
acquisition boards for monitoting and bipositional control. This is achieved by using the
LabVIEW environment to acquire and process signals, generating commands and
displaying the progress of the process variables to the user.
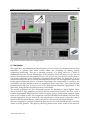
For the monitoring and bipositional temperature control, we employ the laboratory set-up
shown in Figure 6:
•
Thermostatic Bath: metallic enclosure with lid, thermoresistance Pt100 and water
heater, filled with water;
•
SA: power supply;
•
ATr: Pt100 thermoresistance adapter, calibrated for the 0ºC ÷ 100ºC range;
•
INTr: numeric measured temperature indicator (000 for 0ºC to 999 for 100ºC);
•
Heater control unit (top-right corner): relay block, REED intermediate relay and power
relay type RI33, used for controlling the water heater element;
•
Connector block: external connection terminal board CB-68LP shipped with the PCI6014 board;
•
C: 220μF capacitor;
•
K: single pole switch;
www.intechopen.com
Distance Process Monitoring using LabVIEW Environment
73
Fig. 6. Laboratory Set-Up for Temperature Monitoring and Control Application using NI
PCI- 6014E Board
•
PC: personal computer workstation with appropiate data aquisition board drivers for
the NI PCI-6014E and software for application development according to the
requirements: monitoiring and bipositional control of the temperature in a thermostatic
bath by aquiring the analog voltage value on a 250 Ω resistance inserted in the current
loop of a temperature transducer with thermoresistance and the numeric control of the
electric heater including the analysis of passive filtration (capacitive) and software
filtration on the quality of the control system.
Operating within the LabVIEW environment, we first have to install appropiate drivers for
the NI PCI-6014E board, following the procedure described by the user manual. This being
performed, we go on to the actual programming of the LabVIEW virtual instrument. This
application has been initially developed under LabVIEW 6.1 but has been kept up-to-date
and the current version is compatible with the LabVIEW 2009 version to accomodate the
reader with the benefits brought upon by newer versions of the software.
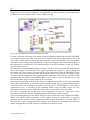
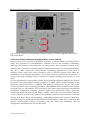
Figure 7 shows the block diagram and Figure 8 shows the front panel/user interface of the
monitoring and bipositional control application using the multifunction data aquisition
board NI PCI-6014E.
Before starting with deploying the LabVIEW code, the following clarfications have to be made:
•
the top section of the block diagram implements the data acquisition on the ai0 analog
input channel, using DIFF configuration mode of the NI PCI-6014E board and generating
the digital command on the 0 digital output port; It should be mentioned that the newest
versions of the DAQmx drivers for National Instruments hardware components include a
configuration wizard which reduces the complexity of the written code to a single block,
however the configuration steps decribed at this stage remain valid.
www.intechopen.com
74
Modelling, Programming and Simulations Using LabVIEW™ Software
Fig. 7. Block Diagram for Temperature Monitoring and Control Application using NI PCI6014E Board
•
•
the acquired values represent voltage samples in the 1 ± 5 V range, considering the fact
that we are measuring the voltage on a 250Ω resistance in a 4mA ÷ 20mA current loop,
we show this values to the user as voltage and as degrees on the front panel;
to better symbolize to the operator the state of the process (between or outside the
lower/upper limit interval) the dedicated temeperature indicator turns blue when the
temperature is between the limits and red when it is outside this interval; also when the
temperature value is detected to enter the interval a LED indicator signals the good
functioning of the installation;
www.intechopen.com
Distance Process Monitoring using LabVIEW Environment
75
Fig. 8. Front Panel for Temperature Monitoring and Control Application using NI PCI-6014E
Board
•
•
the limits, the current temperature value and the median temperature value are
illustrated on a Waveform Chart indicator; the median temperature value for the chart
representation is reduced by 2 units in order not to be overwritten on the current value
(the code implementing this is shown in the lower left corner of the block diagram);
the While loop in the lower right corner of the block diagram plays a double role: it
implements a logical hysteresis comparator, that means a LED indicator changes value
www.intechopen.com
76
Modelling, Programming and Simulations Using LabVIEW™ Software
when the temperature value is out of the interval set by the two limits, and calculates
the mean over the last 5 temperature values in a recursive way; the mean temperature
indicator will offer a correct reading only after the first 5 samples have been acquired.
In order to rapidly delpoy the block diagram and the front panel the user can reffer to
Figures 7 and 8 and also the LabVIEW User Manual can provide valuable references and
therefore we will not go into any more details.
The virtual instrument operates when pressing the Run control on the upper toolbar and the
application should be saved in the appropiate folder using a relevant name. The system
operation will be described next.
After deploying the laboratory set-up according to Figure 6, with the switch K opened, the
power supply SA is turned on and the heater control block is powered. We then launch the
application into execution by pressing the Run continuosly button on the toolbar. Correct
values for the lower and upper temperature limits should be entered on the front panel (with
regard to at least a 3°C difference between the two in order to insure a smooth operation of the
system) and the Waveform Chart indicator should be adapted to clearly notice the evolution of
the values on the chart. The sample rate and sample number should be set to a 1:1 relation. If
the Chart rate is too fast, the user should modify the Time scale of the chart.
Because, upon the first running of the application, the temperature in the thermostatic bath
is low (according to the room temperature), the ON/OFF and New State LEDs will be on
and the temperature color indicator will be red. Upon first reaching of the inferior
temperature value, the LED indicating the good operation of the system will be switched on,
the temperature indicator will become blue and the ON/OFF and New State LEDs will
continue to be on. They will switch off upon reaching the upper limit.
During the operation of the application, the influence on the reaching of the upper limit
with increasing temperature and on the reaching of the lower limit with decreasing
temperature of the time constant of the thermoresistance will be noticed. Also, when
modifiying the scale of the Y-Axis of theWaveform Chart in order to have a better view of
the signals, the user will be able to quantitatively determine the acquisition noise on the
analog channel and the impact of digital filtering through recursive software mediation.
While running the application, the K switch should be closed and one can notice the impact
of passive filtering on the analog signal. When the exepriments are over, the application is
stopped using the Abort Execution control on the toolbar.
4.2 Digital signal acquisition, processing and generation
Many real-world situation present us with signals, which carry information, in a digital
form. They come from physical measures with two stable states, indicating the
presence/absence of the studied measure. There are also many transducers which act as
detectors for the presence of the investigated measure, which supply an output signal in
binary logic (absence means 0, presence means 1).
Another important category of measures commonly associated with binary signals are
switches which offer two states (for example a push button closes a contact which can bring
a constant voltage to a circuit, equivalent to a "1" logic state and when it is left loose the
circuit is open and the corresponding state is "0"). Classic and modern automation systems
often employ digital signals because many applications require mantaining the controlled
parameters between certain limits and not their continuos measurement. There are also
situations when the transducers generate series of impulses proportional to the investigated
measure (for example, in the case of rotation speed transducers) which requires digital data
www.intechopen.com
Distance Process Monitoring using LabVIEW Environment
77
acquisition. In conclusion, the data acquisition systems are realized in such way that they
allow the acquisition of binary logic voltages, compatible to the standardized voltage levels
type TTL or CMOS.
Our application aims at acquiring digital TTL signals coming from a reversible counter,
processing them internally in the PC and generating numeric signals which are displayed on
a 7-segment display using functionality offered by the LabVIEW environment.
The laboratory set-up is described in Figure 9 which includes the following components:
•
GS: rectangular TTL signal generator;
•
PCL: logic circuit board which includes the counter, decoder for the 7 segments and the
7 segments display;
•
SA: power supply 5V, 1A;
•
K: monopolar switch for applying the TTL input to ND (direct counter) or NI (reverse
counter);
•
STP-68: external connector board, connected to the KPCI-3102 PCI Board through the
1:1 CAB-305 cable;
•
PC: workstation with software suite installed.
The producer of the plug-in board provides appropiate drivers for the use with Windows
and LabVIEW and by installing the drivers a additional user library shows up in the
Functions palette of the LabVIEW interface. This allows the developers to access the specific
blocks for programming application with this data acquisition board. It includes blocks such
as analog input/output, digital input/output etc. We will assume that all the steps
necessary for installing of the Keithley board have been followed according to the user
manual provided by the manufacturer.
The first step to be taken before writing the application is the configuration of the board
through the DriverLINX Configuration Panel (Start>Programs>DriverLINX). Here the user
has to create a new device, Device 0, and using the configuration option setting port0 as
digital input and port1 and port2 as digital outputs. The first use case is acquiring digital
signals from the SN74190 reversible counter on port A (0) of the KPCI-3102.
Fig. 9. Set-Up for Digital TTL Signals Acquisition, Processing and Generation using KPCI3102 Board
www.intechopen.com
78
Modelling, Programming and Simulations Using LabVIEW™ Software
Figure 10 shows the block diagram for the applicatin for direct/reverse counter and Figure
11 illustrates the front panel in the case of direct counting.
Fig. 10. Block Diagram for Direct/Reverse Counter
In order to quickly realize the front panel and block diagram, indications from the LabVIEW
user manual can be used. The most important element is this case is the Keithley "dio read
port" subVI which can be found in the Functions>User Libraries>Keithley DAQ VIs palette.
After the correct wiring of all the elements of the block diagram, the structural integrity of
the application is confirmed by the transformation of the Run indicator on the top toolbar
into a continuos arrow.
Performing the experiment takes place as follows. The K switch is set in the ND position and
the power supply SA and the GS TTL signal generator are turned on. After running the
application the user observes 7 binary signals on the Waveform Chart of amplitude 0V and
1V, which have been modified with the constant values shown before the Build Array
element in the block diagram. The signal generator frequency should be set at 10Hz and the
sampling rate, modified via the milliseconds to wait control, must be chosen such as the
Waveform Chart should clearly illustrate all waveforms.
Running the application will show that there is a relation between the counter input and the
state of the four bistables of which the counter consists of (Qa, Qb, Qc, Qd) and the transport
command CND. If K is switched, the chart will show plot 7 - CNI and plot 6 -CND will be
permanently set to "1" according to the operating mode of the reversible counter NT. The
application is aborted via the Stop button and can be saved under a relevant name.
In order to complete the second part of the experiment we have to realize the virtual
instrument as shown in Figure 12 (block diagram) and Figure 13 (front panel).
Upon the carefull analysis of the block diagram it can be seen that it uses standard LabVIEW
blocks, two subVI’s built specifically by the authors (a binary counter and a 7 segment
decoder) and an external control component built around the Keithley provided DAQ VI
dio write port. After wiring the blocks together and placing all the elements on the front
panel, the application should present no compile errors and be saved.
www.intechopen.com
Distance Process Monitoring using LabVIEW Environment
79
Fig. 11. Front Panel for Direct Counting Application
Having the set-up described in Figure 9, the user sets port B(1) for the digital output in the
digital channel front panel control by giving it the value 1. The power supply SA is then
switched on and the application is started and the single impulse operating mode is
selected. The binary counter is set to 0 by pushing the boolean controls Reset and J-K in 0
and then in 1. At this moment all the 4 LEDs corresponding to the NB outputs (Qa, Qb, Qc,
Qd) are inactive which represent an initial 0 stage as well as the segments of the SN7545
display. By each activation of the single impulse ("Monoimpuls") button the user can see
that one binary unit is added to the counter and in the display. The coherence between the
www.intechopen.com
80
Modelling, Programming and Simulations Using LabVIEW™ Software
simulated display in LabVIEW and the real 7 segment display SN7545 is checked. The
switch is then moved to the Generator position with an amplitude of 8 and a frequency of
around 0.0020. That will result in an automatic operation of the counter in one second
increments. The Waveform Chart will show small disruptions of the waveform
corresponding to the modification of the values of the NB counter. The application can be
aborted by pressing the Stop button on the front panel toolbar.
Fig. 12. Block Diagram for Controlling the Numeric Display SN7545 thorugh Port B(1) of the
KPCI-3102 Board
www.intechopen.com
Distance Process Monitoring using LabVIEW Environment
81
Fig. 13. Front Panel for Controlling the Numeric Display SN7545 thorugh Port B(1) of the
KPCI-3102 Board
4.3 Environmental monitoring through wireless sensor network
Wireless sensor networks have represented, especially in the last decade a booming field of
study and represent an interdisciplinary research area for the academic community.
Although that wireless sensor networks are facing slower than expected adoption in the
industry due to concerns regarding reliable communication protocols and standardization,
they are a viable solution for environmental monitoring applications. In this kind of
scenarios many small sized nodes should be able to provide accurate data about the
investigated environmental parameters. The nodes would be powered from batteries or
energy harvesting techniques and would have a lifespan ranging from months to even
years.
For our experiments, we have used wireless sensor nodes produced by Memsic Inc. (former
Crossbow). The experimental scenario consists of 3-4 IRIS 2.4GHz nodes deployed in the
laboratory which feed data to a MIB520 USB gateway connected to the PC. The nodes
consist of XM2110 radio/processing modules with MTS400 sensor boards and are battery
powered from 2 x AA batteries. They are able to offer data for the following environmental
parameters: temperature, humidity, pressure, light, 2-way acceleration along with health
information about the network and battery voltage. The nodes run a proprietary firmware
on top of TinyOS (a small scale open-source operating system for such resource constrained
devices) and they form a self-organizing, self-healing wireless mesh network. MoteView
and MoteConfig are the Windows applications with the help of which data is read from the
gateway which finally receives all packets from the nodes and commands such as
configuration information are send to the nodes.
www.intechopen.com
82
Modelling, Programming and Simulations Using LabVIEW™ Software
Fig. 14. MIB520 USB Gateway and IRIS Sensor Node
The application we are describing in this section is based on a LabVIEW driver developed
for this wireless sensor network product by the manufacturer. This is available at ni.com as
a free download and after being installed in the system it offers all the necessary subVIs
which allow the developer to read data from the MIB520 USB Gateway. Our customized
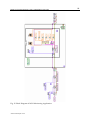
application with block diagram (Figure 15) and front panel (Figure 16) is shown below.
The block diagram includes elements to configure the data acquisition from the USB
gateway such as COM port, data buffer size and resource access. The main while loop
performs the actual read of the packets and parses them acording to the known message
format for the corresponding sensor board (MTS400). Data is then available for further
processing. In this case we create arrays of enivronmental measurements for the parameters
mentioned above and they are linked to the shared variables which are pushed through the
network, displayed and stored on the server. This application includes also a boolean shared
variable which controls the data acquisition, meaning that the server operator has the
possibility of remotely starting/ pausing the process. The front panel of this application is a
simple representation of the list of nodes identified in the network, the parsed numeric data
from the on-board sensors and simple graphical representations for two of the parameters
(humidity and light).
Our main goal is to replicate and extend the functionality of the original MoteView
application, this not being supported on newer operating systems such as Windows Vista or
Windows 7 under the form of a stand-alone LabVIEW executable application which would
enable easy distribution. This should include the virtual instrument and variable library but
also the Crossbow XMesh drivers an the necessary run-time for computers without any
installation of the development environment. The main functions should be database
storage, custom graphs, node configuration and mapping the sensor network. The first steps
have been described in this section.
www.intechopen.com
Distance Process Monitoring using LabVIEW Environment
Fig. 15. Block Diagram of WSN Monitoring Application
www.intechopen.com
83
84
Modelling, Programming and Simulations Using LabVIEW™ Software
Fig. 16. Front Panel of WSN Monitoring Application
5. Server application
5.1 Communication technologies
The applications described until now in this chapter were initially designed to function as
stand alone experiments on dedicated workstations. The main idea behind this chapter is to
link them together under the umbrella of a single network server which collects all the data.
The advantages of this distributed approach comes from the fact that the system can use
dedicated workstations, each with their on specific hardware and software which are
connected by a network. The server represents a more capable hardware configuration for
data processing, storage and can also act as a gateway between the process and the Internet.
The technology chosen to implement this concept of sharing data between tasks running on
different systems is that of LabVIEW Shared Variables. The shared variables are a feature
which appeared in LabVIEW since version 8 was released and have been steadily improving
since. The shared variable abstracts network communication from the LabVIEW block
diagram and makes it easy to share data between networked systems. The type of shared
variables we are using for our deployment is networked-published shared variables of
different types such as double, arrays of doubles, booleans or integers. After being added to
the project library of a certain LabVIEW application, the shared variables take the form of a
terminal which can be dropped onto the block diagram to be written or read from. They also
offer error input and output terminals to notify the user of communication errors and a
timestamp output that informs about when the value read was written. Behind all this is a
custom UDP protocol to send data to a server called the shared variable engine, which then
publishes the data to all clients on the network reading the shared variable. Because a
www.intechopen.com
Distance Process Monitoring using LabVIEW Environment
85
publish-subscribe architecture is used to transfer data, many clients can read and write to
the same variable without writing additional code. An important feature is buffering, which
can be used for accounting for temporary fluctuations between read/write rates of a
variable. Readers that occasionally read a variable slower than the writer can miss some
updates. If the application can tolerate missing data points occasionally, the slower read rate
does not affect the application and you do not need to enable buffering. However, if the
reader must receive every update, enable buffering. The SVE (Shared Variable Engine) can
be hosted on Windows PCs and real time targets. In our practical experiments we found out
that the custom UDP protocol needed specific ports to be opened (depeding on the
implementation of the Logos architecture of LabVIEW) in order for the data to pass through
the Windows firewall.
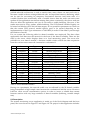
For our system the following table for shared variables was employed. The three client
applications feed data into the network in the form of the shared variables. These are the
read by the server which displays them on a local monitoring panel. The server also
publishes its own shared variable, a boolean variable which controls the data acquisition
from the wireless sensor network connected to workstation 3.
No.
1
2
3
4
5
6
7
8-15
16
17
18
19
20
21
22
23
Name
temp
tempmed
tempv
comanda
limsup
liminf
obiectiv
channel8_15
nodeid
voltage
therm_temp
humid
light
accx
accy
achizitie
Type
double
double
double
boolean
double
double
boolean
boolean
array of integer
array of double
array of double
array of double
array of double
array of double
array of double
boolean
Data
Current temperature
Median temperature
Acquired voltage value
Digital output state
Upper limit
Lower limit
Functioning between limits
Digital input states
List of detected nodes
Battery voltage
Thermistor temperatures
Humidity values
Ambiental light values
X Axis acceleration
Y Axis acceleration
Start/Pause WSN monitoring
Published By
Application 1
Application 1
Application 1
Application 1
Application 1
Application 1
Application 1
Application 2
Application 3
Application 3
Application 3
Application 3
Application 3
Application 3
Application 3
Server
Table 1. List of Shared Variables
During our experiments, the network traffic was not affected by the 23 shared variables
being transmitted at high sample rates between the workstations and the server. However
LabView offers several customization options in order to insure a reliable data stream
between stations with very large numbers of shared variables (buffering, variable sample
rate).
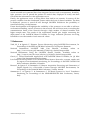
5.2 Description
The remote monitoring server application is made up of the block diagram and the front
panel, like it can be seen in Figure 17 and Figure 18. The project for this application includes
www.intechopen.com
86
Modelling, Programming and Simulations Using LabVIEW™ Software
the virtual instrumes and the library which contains references to all the shared variables
being read through the network. The values are being read in a while loop which ensures
continous operation fron the push of the Run button on the toolbar until the Stop button on
the front panel or the Abort execution button on the toolbar have been pressed. The loop is
timed at 200ms, a value which we considered insures maximum performance of the system
and doesn’t load the network with unnecessary samples. The shared variable read blocks
are wired to the corresponding indicators in order to show the data on the front panel. The
front panel represents the user interface and the most important part of this application. It is
divided into three parts, each corresponding to a certain application: temperature
monitoring and control, digital signal acqusition system and wireless sensor network
monitoring application. The operator can view the data in near real-time, control the
aqusition for the wireless sensor network through the switch button. The application can be
expanded by creating a local database to store the data, generate reports and also by linking
it to even more different systems. The server can also act, using the functionality provided
by the LabVIEW web server as a gateway between the local network and the internet.
Fig. 17. Block Diagram of the Server Application
www.intechopen.com
Distance Process Monitoring using LabVIEW Environment
87
Fig. 18. Front Panel of the Server Application
6. Conclusion
The application was designed and developed to prove a couple of concepts about the data
acquisition in general and some notions about the possibility of adding remote
controlling/monitoring. This has a teaching purpose: it is being used for a series of
experiments between several laboratories, at the moment. From one point of view one can
process the experimental data gathered from a real process, but one can also see the result of
one remote command sent to industrial equipment in the real time. The main part is, as we
mentioned earlier, the server with the data acquisition board. The first application presented
in this paper handled the process of remote controlling of the temperature of a precinct, the
workstation can deal with more than one application in the same time. Thus it can monitor
parameters provided by 16 sensors and it can lead till four industrial equipments in the
same time, using the data acquisition board NI PCI 6014E.
The second application we have described concerns the handling of digital signals which
can be found in large numbers in today’s discrete automation systems. We have used a
Keithley Instruments KPCI-3102 PCI board to acquire, process and generate numeric signal
from/to the outside world. The integration with the LabVIEW environment has been done
through appropiate drivers offered by the manufacturer which appear under the form of
blocks in the instrument library, ready to be placed and wired on the block diagram.
The third application realised connectivity between the PC (with LabVIEW) and a wireless
sensor network gateway. The gateway received packets from all the nodes of the network
www.intechopen.com
88
Modelling, Programming and Simulations Using LabVIEW™ Software
which included environmental data from integrated sensors such as temperature, humidity,
light, pressure. Our VI parsed the packets for useful data, displayed it locally and then
forwarded the information to the application server.
Finally, the application server is acting like a data sink in our scenario. It receives all the
process variables from the distributed system under the form of shared variables. The data
is displayed, process or stored all also through LabVIEW WebServer the possibility of
remote monitoring via the Internet.
Future developments will highlight the scalability of the system as we are able to add new
workstations handling various processes to the network. We will focus more on reaching the
communication limits of the network through a high number of shared variables with
higher sample rates. The results of the experiments should give insight concerning the
deployment of the LabVIEW Shared Variables for large industrial processes involving
hundreds or even thousands of such network values.
7. References
Vlad, M. S. & Sgârciu V. Distance Process Monitoring using LabVIEW Environment, In:
Proceedings of the IEEE AQTR 2006 Conference, Cluj-Napoca, Romania.
National Instruments LabVIEW 2009 User Manual, Available online at:
http://www.ni.com/pdf/manuals/371361f.zip, checked August 2010.
National Instruments Using the LabVIEW Shared Variable, Available online at:
http://zone.ni.com/devzone/cda/tut/p/id/4679, checked August 2010.
Garcia, G. Create Distributed Applications with LabVIEW Shared Variables, In: Q2 2006
issue of the Instrumentation Newsletter.
Luis Felipe Herrera-Quintero et al. Wireless Smart Sensors Networks, systems, trends and
its impact in environmental monitoring, In: Proceedings of the IEEE LATINCOM
2009 Conference, Medelin, Columbia.
Rancea I. & Sgârciu V. & Stamatescu G. Remote Acquisition Processing and Generation of
Digital Signals for a Reversible Counter through LabVIEW Environment, In:
Proceedings of the DAAAM 2009 Conference, Vienna, Austria.
Stamatescu G. & Sgârciu V. & Stamatescu S. PC-Based System for Level Transducer
Interfacing, In: Proceedings of the SENSORDEVICES 2010 Conference, Venice,
Italy.
www.intechopen.com
Modeling, Programming and Simulations Using LabVIEW™
Software
Edited by Dr Riccardo De Asmundis
ISBN 978-953-307-521-1
Hard cover, 306 pages
Publisher InTech
Published online 21, January, 2011
Published in print edition January, 2011
Born originally as a software for instrumentation control, LabVIEW became quickly a very powerful
programming language, having some characteristics which made it unique: simplicity in creating very effective
User Interfaces and the G programming mode. While the former allows for the design of very professional
control panels and whole applications, complete with features for distributing and installing them, the latter
represents an innovative way of programming: the graphical representation of the code. The surprising aspect
is that such a way of conceiving algorithms is extremely similar to the SADT method (Structured Analysis and
Design Technique) introduced by Douglas T. Ross and SofTech, Inc. (USA) in 1969 from an original idea by
MIT, and extensively used by the US Air Force for their projects. LabVIEW enables programming by
implementing directly the equivalent of an SADT "actigram". Apart from this academic aspect, LabVIEW can be
used in a variety of forms, creating projects that can spread over an enormous field of applications: from
control and monitoring software to data treatment and archiving; from modeling to instrument control; from real
time programming to advanced analysis tools with very powerful mathematical algorithms ready to use; from
full integration with native hardware (by National Instruments) to an easy implementation of drivers for third
party hardware. In this book a collection of applications covering a wide range of possibilities is presented. We
go from simple or distributed control software to modeling done in LabVIEW; from very specific applications to
usage in the educational environment.
How to reference
In order to correctly reference this scholarly work, feel free to copy and paste the following:
Valentin Sgârciu and Grigore Stamatescu (2011). Distance Process Monitoring Using LabVIEW Environment,
Modeling, Programming and Simulations Using LabVIEW™ Software, Dr Riccardo De Asmundis (Ed.), ISBN:
978-953-307-521-1, InTech, Available from: http://www.intechopen.com/books/modeling-programming-andsimulations-using-labview-software/distance-process-monitoring-using-labview-environment
InTech Europe
University Campus STeP Ri
Slavka Krautzeka 83/A
51000 Rijeka, Croatia
Phone: +385 (51) 770 447
www.intechopen.com
InTech China
Unit 405, Office Block, Hotel Equatorial Shanghai
No.65, Yan An Road (West), Shanghai, 200040, China
Phone: +86-21-62489820
Fax: +86-21-62489821
Fax: +385 (51) 686 166
www.intechopen.com
Fax: +86-21-62489821