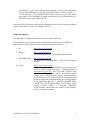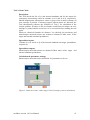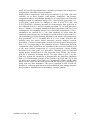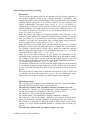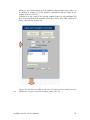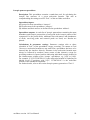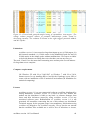
1
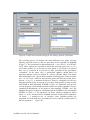
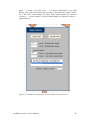
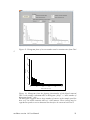
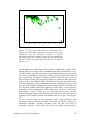
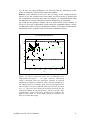
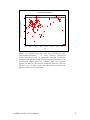
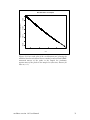
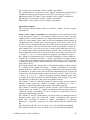
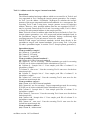
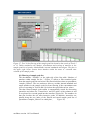
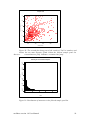
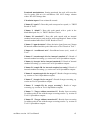
deviation'. Hereby, (a) internal standards are matched to peaks in the sample
peak list and (b) deviations in mass are calculated; corresponding entries to
columns M and N of the 'sample' spreadsheet are made. The tolerances in m/z
and retention time RT between internal standard and potential match in the
sample peak list are set in the text boxes below that button (Figure 16). Since
masses are not yet recalibrated at this step, a relatively wide mass tolerance
should be used. Finally, two plots are generated to help clarifying any trend in
mass deviations (cp. Figure 17 for details). In case these first two steps of the
recalibration procedure indicate no matches (or if no internal standards are
provided in the 'internal_standards' spreadsheet), the Tool can either be
skipped or a data set from spreadsheet 'known' can be used for recalibration.
Figure 16: User interface of the recalibration tool. The upper part of the
interface aids at detecting potential internal standards in the sample peak data
set. The lower part of the tool interface uses these matches to run the mass
recalibration of the sample peak data set.
enviMass version 1.0 User Manual
29