1
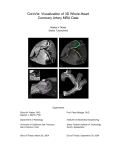
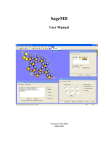
BraTumIA
A software tool for automatic Brain Tumor Image Analysis
Handbook
Version 1.2
30 October 2013
developed by
Stefan Bauer, Thomas Fejes, Raphael Meier, Mauricio Reyes
Institute for Surgical Technology and Biomechanics, University of Bern, Switzerland
[email protected]
in collaboration with
Johannes Slotboom, Nicole Porz, Alessia Pica, Roland Wiest
Departments of Neuroradiology and Radio-Oncology, Inselspital, Bern University Hospital, Switzerland
http://www.istb.unibe.ch/content/research/medical_image_analysis/software/index_eng.html
Contents
1
Overview............................................................................................................................................. 3
2
System Requirements and Installation............................................................................................... 3
3
User Manual ....................................................................................................................................... 4
3.1
The main window ....................................................................................................................... 4
3.2
Loading the data ......................................................................................................................... 4
3.3
Processing the data .................................................................................................................... 5
3.4
Visualizing and analyzing the results .......................................................................................... 6
3.5
Locating the data on disk for external use ................................................................................. 8
4
Known Issues ...................................................................................................................................... 9
5
Scientific Background ......................................................................................................................... 9
6
How to cite BraTumIA ...................................................................................................................... 10
7
Acknowledgements .......................................................................................................................... 10
8
References ........................................................................................................................................ 11
2
1 Overview
BraTumIA is a software tool for automatic brain tumor image analysis. It can segment the tumor
including its sub-compartments from magnetic resonance images (MRI) of glioma patients. For this, it
requires four different MRI sequences (T1, T1contrast, T2, FLAIR) as an input and it outputs volumetric
information about the tumor and its sub-compartments (necrotic tissue, active enhancing tumor
tissue, non-enhancing tumor tissue and edema). Additionally, the software can also segment healthy
subcortical structures surrounding the tumor. Label maps of the segmented tissues and structures are
available as an overlay on the original images.
The images are processed using a pipeline approach, where skull-stripping is performed first in order
to generate a brain mask. Subsequently, all images are co-registered to ensure voxel-to-voxel
correspondence between the different MRI sequences. Based on these registered images, a
segmentation of the patient images into healthy and tumor tissues is done based on combined
classification and regularization. This produces a label map and quantitative information about tissue
volumes. Healthy subcortical structures are segmented using a deformable registration of an atlas to
the patient image. Finally, the label maps can be transformed back into the original space of each
image sequence so that they can be shown as an overlay on the original images.
The computation time for the complete pipeline depends on the processor and the amount of
memory, on modern computers it should take around 5 minutes to process one patient.
Please be aware that BraTumIA is intended for scientific use only!
2 System Requirements and Installation
The program runs on Windows 7 or Windows 8 (64bit version) with a minimum of 16 GB of RAM
memory (more is recommended). Start the Windows installer program and choose a location to install
the program on your computer or extract the files which are in the zip folder into a directory of your
choice (approximately 2 GB of hard disk space are required).
3
3 User Manual
The core program is organized as a pipeline where skull-stripping, multi-modal registration, tissue
classification and segmentation of subcortical structures are carried out sequentially. From the main
window, the user has to load the image data first, then process it, before he can visualize and analyze
the results.
3.1 The main window
The main window of BraTumIA contains menu buttons for loading and unloading images at the top.
On the left panel, the user can find different options for processing and visualizing the data. This panel
also contains basic patient information, information about the currently ongoing actions and
quantitative information about the segmented tumor volumes.
The largest part of the main window contains four visualization sub-windows, where the image data
and the label overlay are shown. The different sub-windows can either show different MRI sequences
or one sequence in different viewing orientations.
3.2 Loading the data
The user can start to load the patient images by clicking on the Load button and add the sequences. He
has to choose the location of the T1, T1contrast, T2 and FLAIR images. BraTumIA supports volumetric
images in the meta image format (.mha), the Nifti format (.nii) and Dicom series (.dcm). If the format is
Dicom, the different modalities have to be located in different folders and the location of the folder for
4
each modality has to be selected. The directory tree has to be selected in the left sub-window and the
final folder/image in the right sub-window.
In addition to the four MRI sequences, it is possible to specify a template image, to which all other
images will be registered. This can be e.g. a CT of the same patient (so that the segmentation can be
overlaid on the patient CT image) or an MRI atlas image (for normalization in a standard space). In
longitudinal patient studies, it can also be useful to use the T1contrast image of the first baseline scan
of this patient as a reference template for all acquisition time points in order to ensure voxel-to-voxel
correspondence and allow for direct comparisons across different time points. If a template for spatial
normalization is not required, then this field can be left empty.
Finally, an output folder has to be selected where all the results will be stored.
3.3 Processing the data
For the processing, the user can call each module separately (skullstripping, multi-modal registration, classification) or he can press the
All@Once button for a completely automatic processing in the Do Seg tab,
located on the left panel. The classification button and also the All@Once
button will perform both segmentation of tissues and subcortical
structures. The progress can be seen in the command line window.
5
3.4 Visualizing and analyzing the results
The visualization sub-windows can be used in two ways: when all is ticked in the modality selection
panel on the left, then all four modalities are displayed in clock-wise direction, starting with T1 on the
top left, T1contrast top right, T2 bottom right and FLAIR bottom left. If only one specific modality is
ticked, then this modality is displayed in axial, coronal and sagittal view in 3 sub-windows and the
fourth sub-window shows the T1contrast image.
In the panel on the left, it is also possible to choose whether the registered version or the original
version of the images should be displayed. The Tissues option allows the user to choose if the
segmented label image should be shown as a color overlay over the grayscale images and the
Structures options will show the subcortical Structures as an overlay. In the Show Seg menu the user
can choose which modalities should be overlaid with the color label map. Finally, when the multi-scroll
box is ticked, it is possible to scroll through all modalities simultaneously (this makes only sense for the
registered images), otherwise only the sub-window under the cursor is active.
6
The segmentation table is a pop-up window that shows the volumes for each segmented tissue
compartment. From this window it is also possible to switch on and off certain layers of the color label
overlay by simply clicking on the respective tissue.
When the mouse cursor is located above a sub-window, additional activities are possible: Scrolling
through the slices can be achieved with the scrolling wheel of the mouse or the scroll-bar on the right.
When pressing the left mouse button and moving to the left and right or up and down, windowing and
contrast of the image can be adjusted. Zooming is possible by pressing the right mouse button and
moving up or down. The keyboard shortcut shift + r can be used to reset the current sub-window.
By pressing the Create Report File button, a .csv file is created that contains a longitudinal volumetric
analysis of the active patient. It is stored in the output folder of the first baseline scan.
7
If the show template window button is clicked, the template image is shown in a separate pop-up
window. The template image can also be overlaid with the segmentation results of tissues or
structures if the relevant buttons are ticked.
3.5 Locating the data on disk for external use
All the results are stored in a folder structure, which is located in the output directory that has been
chosen by the user when loading the data.
The classification folder and the structures folder contain the label image in the registered image
space, plus the label images which have been transformed back into the original space of each
modality (T1, T1contrast, T2, FLAIR, template) in .mha format. If the input images were in Dicom
format, this folder also contains all the label output images in Dicom format, so that they can be
uploaded to a PACS system for further use. Additionally, the classification folder contains a report file
in .txt format, listing the segmentation volumes for all the healthy and pathologic tissue subcompartments and also the convential 2D RANO diameter measurements, which are automatically
extracted from the segmentation result. The subcortical structures which have been segmented, can
be identified by the numbers they are assigned with. The subcorticalStructures.txt file in the structures
folder provides information which structure is represented by which number.
The originalFiles folder contains the original input files (T1, T1contrast, T2, FLAIR, template) in .mha
format. For research purposes this format can be handled more easily than Dicom stacks.
8
The Registration folder contains all image sequences after registration and skull-stripping in .mha
format. It also contains the transformation parameters, which have been used for each sequence in
the .tfm files.
The SkullStripped folder contains the brain mask of the T1contrast image, plus the skull-stripped
T1contrast image in .mha format.
4 Known Issues
•
•
•
•
•
•
Possible problems with tumors at the skull border (due to skull-stripping inaccuracies)
Possible problems with pediatric patients
Not optimized for post-operative images yet
In general, the algorithm tends to over-segment tumor (more false positives than false
negatives, especially edema in infratentorial regions)
Better performance on high-grade gliomas than low-grade gliomas
The accuracy of the subcortical structure segmentation has not been carefully evaluated yet.
5 Scientific Background
Brain tumor segmentation is a difficult task and despite a vast amount of scientific literature [1], there
are only very few tools that can be used in a clinical context. BraTumIA is a research tool that aims at
bridging this gap between science and clinics. For this, it builds on experience that was previously
gained with the Doctor-No suite [2]. It allows clinicians to perform tumor segmentation and volumetry
as suggested by the RANO group [3] in addition to segmentation of subcortical structures. BraTumIA
has recently been evaluated in a clinical study [4].
The complete functionality is integrated into a graphical user interface [5] that is easy to handle for
radiologists. All the computation and visualization algorithms are implemented in C++ using ITK [6],
VTK [7] and Qt [8]. The skull-stripping is based on [9], whereas the registration is a standard rigid
registration with mutual information similarity metric which can handle different modalities [10], [11].
The core of the program is the tissue segmentation method, which is based on a machine learning
approach for integrated classification and regularization [12], [13], [14]. The segmentation method
which is integrated in BraTumIA won a Kitware award at the MICCAI BraTS 2012 challenge 1 and an
award from the National Cancer Institute at the MICCAI BraTS 2013 challenge 2 for being among the
best performing methods for brain tumor segmentation [15]. The segmentation of subcortical
structures is based on a simplified version of [16], where an atlas [17] is non-rigidly registered to the
patient image (in contrast to [16] no tumor growth model is used here).
The definition of the four different tumor sub-compartments follows the the VASARI guidelines of the
National Cancer Institute of the American NIH [18].
1
2
http://www2.imm.dtu.dk/projects/BRATS2012/
http://martinos.org/qtim/miccai2013/
9
6 How to cite BraTumIA
If you use BraTumIA, please cite the following publication:
N. Porz, S. Bauer, A. Pica, P. Schucht, J. Beck, R. K. Verma, J. Slotboom, M. Reyes, and R. Wiest,
“Multi-Modal Glioblastoma Segmentation: Man versus Machine,” PLoS One, vol. 9, no. 5, p.
e96873, May 2014.
This handbook can be referred to as:
S. Bauer, T. Fejes, R. Meier, M. Reyes, J. Slotboom, N. Porz, A. Pica, and R. Wiest, “BraTumIA - A
software tool for automatic Brain Tumor Image Analysis,” 2013.
7 Acknowledgements
The development of BraTumIA was funded by grants from different institutions:
•
•
•
•
•
EU projects ContraCancrum and CHIC
Swiss Institute for Computer Assisted Surgery (SICAS)
Bernese Cancer League
Swiss Cancer League
Swiss National Science Foundation
10
8 References
[1]
S. Bauer, R. Wiest, L.-P. Nolte, and M. Reyes, “A survey of MRI-based medical image analysis for
brain tumor studies,” Phys. Med. Biol., vol. 58, no. 13, pp. R97–R129, Jul. 2013.
[2]
S. Bauer and M. Reyes, “Doctor-No: A Suite of DoctorEye Plugins by UniBe,” 2011.
[3]
P. Y. Wen, D. R. Macdonald, D. a Reardon, T. F. Cloughesy, a G. Sorensen, E. Galanis, J. Degroot,
W. Wick, M. R. Gilbert, A. B. Lassman, C. Tsien, T. Mikkelsen, E. T. Wong, M. C. Chamberlain, R.
Stupp, K. R. Lamborn, M. a Vogelbaum, M. J. van den Bent, and S. M. Chang, “Updated
response assessment criteria for high-grade gliomas: response assessment in neuro-oncology
working group.,” J. Clin. Oncol., vol. 28, no. 11, pp. 1963–72, Apr. 2010.
[4]
N. Porz, S. Bauer, A. Pica, P. Schucht, J. Beck, R. K. Verma, J. Slotboom, M. Reyes, and R. Wiest,
“Multi-Modal Glioblastoma Segmentation: Man versus Machine,” PLoS One, vol. 9, no. 5, p.
e96873, May 2014.
[5]
T. Fejes, S. Bauer, J. Slotboom, R. Wiest, and M. Reyes, “A Framework for Medical Image
Analysis of Brain Tumors,” in Annual Meeting of the Swiss Society for Biomedical Engineering,
2012.
[6]
L. Ibanez, W. Schroeder, L. Ng, J. Cates, and others, The ITK software guide, 2nd ed. Kitware,
2005.
[7]
Kitware, VTK User’s Guide, 11th editi. Kitware Inc., 2010.
[8]
“Qt.” [Online]. Available: http://qt-project.org/.
[9]
S. Bauer, T. Fejes, and M. Reyes, “A Skull-Stripping Filter for ITK,” 2012.
[10]
J. B. A. Maintz and M. A. Viergever, “A survey of medical image registration,” Med. Image Anal.,
vol. 2, no. 1, pp. 1–36, Mar. 1998.
[11]
J. P. W. Pluim, J. B. A. Maintz, and M. a Viergever, “Mutual-information-based registration of
medical images: a survey.,” IEEE Trans. Med. Imaging, vol. 22, no. 8, pp. 986–1004, Aug. 2003.
[12]
S. Bauer, L.-P. Nolte, and M. Reyes, “Fully automatic segmentation of brain tumor images using
support vector machine classification in combination with hierarchical conditional random field
regularization.,” in MICCAI ... International Conference on Medical Image Computing and
Computer-Assisted Intervention, 2011, vol. 14, no. Pt 3, pp. 354–61.
[13]
S. Bauer, T. Fejes, J. Slotboom, R. Wiest, L.-P. Nolte, and M. Reyes, “Segmentation of Brain
Tumor Images Based on Integrated Hierarchical Classification and Regularization,” in MICCAI
BraTS Workshop, 2012.
[14]
R. Meier, S. Bauer, J. Slotboom, R. Wiest, and M. Reyes, “A Hybrid Model for Multimodal Brain
Tumor Segmentation,” in MICCAI BraTS Workshop, 2013.
[15]
B. Menze, A. Jakab, S. Bauer, J. Kalpathy-Cramer, K. Farahani, J. Kirby, Y. Burren, N. Porz, J.
Slotboom, R. Wiest, L. Lanczi, E. Gerstner, M.-A. Weber, T. Arbel, B. Avants, N. Ayache, P.
Buendia, L. Collins, N. Cordier, J. Corso, A. Criminisi, T. Das, H. Delingette, C. Demiralp, C. Durst,
11
M. Dojat, S. Doyle, J. Festa, F. Forbes, E. Geremia, B. Glocker, P. Golland, X. Guo, A. Hamamci, K.
Iftekharuddin, R. Jena, N. John, E. Konukoglu, D. Lashkari, J. Antonio Mariz, R. Meier, S. Pereira,
D. Precup, S. Price, T. Riklin-Raviv, S. Reza, M. Ryan, L. Schwartz, H.-C. Shin, J. Shotton, C. Silva,
N. Sousa, N. Subbanna, G. Szekely, T. Taylor, O. Thomas, N. Tustison, G. Unal, F. Vasseur, M.
Wintermark, D. Hye Ye, L. Zhao, B. Zhao, D. Zikic, M. Prastawa, M. Reyes, and K. Van Leemput,
“The Multimodal Brain Tumor Image Segmentation Benchmark (BRATS).”
[16]
S. Bauer, H. Lu, C. P. May, L.-P. Nolte, P. Büchler, and M. Reyes, “Integrated segmentation of
brain tumor images for radiotherapy and neurosurgery,” Int. J. Imaging Syst. Technol., vol. 23,
no. 1, pp. 59–63, Mar. 2013.
[17]
T. Rohlfing, N. M. Zahr, E. V Sullivan, and A. Pfefferbaum, “The SRI24 multichannel atlas of
normal adult human brain structure.,” Hum. Brain Mapp., vol. 31, no. 5, pp. 798–819, May
2010.
[18]
D. a Gutman, L. a D. Cooper, S. N. Hwang, C. a Holder, J. Gao, T. D. Aurora, W. D. Dunn, L.
Scarpace, T. Mikkelsen, R. Jain, M. Wintermark, M. Jilwan, P. Raghavan, E. Huang, R. J. Clifford,
P. Mongkolwat, V. Kleper, J. Freymann, J. Kirby, P. O. Zinn, C. Moreno, C. Jaffe, R. Colen, D. L.
Rubin, J. Saltz, A. Flanders, and D. J. Brat, “MR Imaging Predictors of Molecular Profile and
Survival: Multi-institutional Study of the TCGA Glioblastoma Data Set.,” Radiology, pp. 1–10,
Feb. 2013.
12