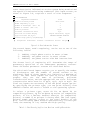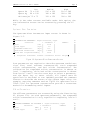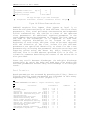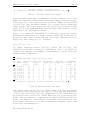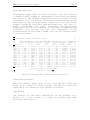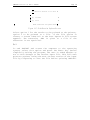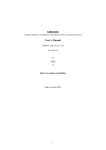
1
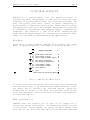
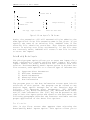
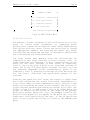
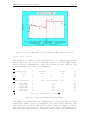
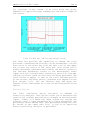
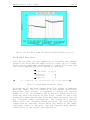
SIMPLIFIED METHOD PROGRAM VARIABLE COMPLEXITY
STREAM TOXICS MODEL (SMPTOX3)
VERSION 2.0
USER'S MANUAL
Prepared for:
U.S. Environmental Protection Agency
Region IV
Atlanta, GA
Supported by:
U.S. Environmental Protection Agency
Assessment and Watershed Protection Division
Washington, D.C.
Prepared by:
LTI, Limno-Tech, Inc.
2395 Huron Parkway
Ann Arbor, MI 48104
December 23, 1991
Updated: December, 1992
(Version 2.01, January, 1993)
SMPTOX3 version 2.0 User's Manual
Page i
TABLE OF CONTENTS
LIST OF FIGURES . . . . . . . . . . . . . . . . . . . . . ii
I. INTRODUCTION . . . . . . . . . . . . . . . . . . . . .
1
II. HARDWARE REQUIREMENTS/PROGRAM INSTALLATION
2
III. PROGRAM OPERATION . .
Main Menu
. . . . . . .
Read Inputs From File
.
Save Inputs To File
. .
Enter\Modify Model Inputs
Run Single Simulation
.
Run Multiple Simulations
View Tabular Output
. .
View Graphics Output . .
Print Results
. . . . .
Quit . . . . . . . . . .
IV. REFERENCES
.
.
.
.
.
.
.
.
.
.
.
.
.
.
.
.
.
.
.
.
.
.
.
.
.
.
.
.
.
.
.
.
.
.
.
.
.
.
.
.
.
.
.
.
.
.
.
.
.
.
.
.
.
.
.
.
.
.
.
.
.
.
.
.
.
.
.
.
.
.
.
.
.
.
.
.
.
.
.
.
.
.
.
.
.
.
.
.
.
.
.
.
.
.
.
.
.
.
. . . . .
.
.
.
.
.
.
.
.
.
.
.
.
.
.
.
.
.
.
.
.
.
.
.
.
.
.
.
.
.
.
.
.
.
.
.
.
.
.
.
.
.
.
.
.
.
.
.
.
.
.
.
.
.
.
.
. . . . . . . . . . . . . . . . . . . .
.
.
.
.
.
.
3
3
3
4
5
9
14
15
15
15
16
17
SMPTOX3 version 2.0 User's Manual
Page ii
LIST OF FIG U RES
3-1. SMPTOX3 Main Menu Screen . . . . . . . . . . . . . .
3
3-2. Read Inputs From File Screen . . . . . . . . . . . .
4
3-3. Save Inputs To File Screen . . . . . . . . . . . . .
5
3-4. Run Information Screen . . . . . . . . . . . . . . .
6
3-5. Upstream River Parameters Screen . . . . . . . . . .
7
3-6. Effluent Parameters Screen . . . . . . . . . . . . .
7
3-7. Reach Parameters Input Screen
. . . . . . . . . . .
8
3-8. Observed River Data Screen . . . . . . . . . . . . .
9
3-9. SMPTOX3 Run Menu . . . . . . . . . . . . . . . . .
10
3-10. First Calibration Plot, Total Toxicant in Water .
11
3-11. Waste Load Allocation Data Screen . . . . . . . .
11
3-12. WLA Plot, Total Toxicant in Water . . . . . . . .
12
3-13. Sensitivity Analysis Input Screen . . . . . . . .
13
3-14. + 25% Water Column Partition Coefficient Sensitivity14
3-15. Run Multiple Simulations Screen . . . . . . . . .
14
3-16. Example View Tabular Output Screen
. . . . . . .
15
. . . . . . . . . .
16
3-17. Print Results Options Screen
SMPTOX3 version 2.0 User's Manual
Page 1
I. INTRODUCTION
EPA Region IV and U.S. EPA Headquarters have sponsored the
development of an interactive computer program for
performing waste load allocations for toxics. This document
serves as the User's Manual for this program, the Simplified
Method Program - Variable Complexity Stream Toxics Model
(SMPTOX3). This program provides user-friendly access to an
EPA recommended technique for calculating water column and
stream bed toxic substance concentrations resulting from
point source discharges into streams and rivers. The model
predicts pollutant concentrations in dissolved and
particulate phases for both the water column and bed
sediments and total suspended solids.
SMPTOX3 is the fourth in a series of user-friendly, waste
load allocation models based upon EPA's Simplified Method
(EPA, 1980). The first computer model in the series is SMP,
a conventional pollutant model (LTI, 1986a). The remaining
models are toxic pollutant models (SMPTOX, SMPTOX2). SMPTOX3
is distinguished from its predecessors by allowing the user
to select from three levels of complexity. The highest level
of complexity includes the stream and bed concentrations
described above. An earlier release of SMPTOX3 included only
this highest level of complexity (LTI, 1990b). The medium
complexity level is equivalent to SMPTOX2, which calculates
toxic water column concentrations, but has no interactions
with bed sediments (LTI, 1986c). The lowest complexity level
is equivalent to SMPTOX, a total pollutant toxics model
(LTI, 1986b).
The Simplified Method Program - Variable Complexity Stream
Toxics Model (SMPTOX3) described in this manual provides a
user-friendly microcomputer program for performing toxics
modeling. The program contains a full screen editor to
facilitate the entry and modification of inputs. Separate
simulation routines are provided for model calibration,
waste load allocation and sensitivity analysis. Each of
these routines provides high resolution graphics of model
results during program operation. Model inputs and results
can also be routed to a printer.
This report serves solely as a user's manual for SMPTOX3,
and does not discuss model theory. For a rigorous discussion
of the background and model theory, the reader is referred
to the "Technical Guidance Manual for Performing Waste Load
Allocations, Book II: Streams and Rivers; Chapter 3: Toxic
Substances" (EPA, 1984).
SMPTOX3 version 2.0 User's Manual
Page 2
II. HARDW ARE REQ U IREM ENTS/PRO G RAM INSTALLATION
NOTE: Refer to the READ.ME file for the latest
supplemental information, changes, and/or
additions to the SMPTOX3 model and/or
documentation. The READ.ME file is included on
each distribution diskette set or can be down
loaded from the Center for Exposure Assessment
Modeling (CEAM) electronic bulletin board system
(BBS). It can be installed on a hard disk using
the appropriate installation program. It is an
ASCII (non-binary) text file that can be displayed
on the monitor screen by using the DOS TYPE
command (e.g., TYPE READ.ME) or printed using the
DOS PRINT command (e.g., PRINT READ.ME).
Ha rdw a re
SMPTOX3 is designed to run on any IBM-PC compatible computer
with 3.1 or higher DOS version. Although 512k of RAM is
sufficient, 640k is recommended. An EGA or VGA graphics
board and monitor is recommended; however, a Hercules or CGA
board and monitor will also suffice. SMPTOX3 will run with
or without a math coprocessor, but will run much faster with
one. SMPTOX3 is designed for use in conjunction with the
Hewlett Packard Laserjet, the Epson FX and LQ, and
compatible type printers. Specification of printer type is
discussed later in this document.
Ins ta lla tion
SMPTOX3 will run on a floppy disk or can be easily copied to
a hard drive. No additional files other than SMPTOX3.EXE are
necessary to run the program. To execute the program, type
SMPTOX3 at the DOS prompt. The operation for specific
aspects of SMPTOX3 is described in the following chapter.
SMPTOX3 version 2.0 User's Manual
Page 3
III. PRO G RAM OPERATION
SMPTOX3 is a user-friendly tool for modeling toxics in
streams. As such, the program is menu driven, with the main
features of the program divided into distinct sections. The
user can select from three levels of model complexity to
perform model calibration/verification, waste load allocation
and sensitivity analysis. This chapter describes the operation
of SMPTOX3 by discussing each program aspect, component by
component. The August 4-7, 1981 Flint River investigations
from EPA's guidance manual for stream toxics modeling (EPA,
1984) will be used to demonstrate model application.
M a inM enu
Upon entry to the program, SMPTOX3 will display the 'main
menu' of program options. This menu is shown in Figure 3-1.
))))))
64 4 4 4 4 4 4 4 4 7
5
5
5
K) ) ) ) ) ) ) ) ) M
5
5
K) ) ) ) ) ) ) ) ) M
5
5
5
K) ) ) ) ) ) ) ) ) M
5
94 4 4 4 4 4 4 4 4 8
64 4 4 4 4 4 4 4 7
5
94 4 4 4 4 4 4 4 8
SMPTOX3 MAIN MENU
5
[1]
[2]
[3]
Read Inputs From File
Save Inputs To File
Enter \ Modify Model Inputs
5
[4]
[5]
Run Single Simulation
Run Multiple Simulations
5
[6]
[7]
[8]
View Tabular Output
View Graphics Output
Print Results
5
[9]
Quit
5
5
5
5
5
5
Make selection and press Enter ) ) ) ) ) )
Fig u re 3-1: SM PTOX3 M a inM enu Screen
To select your desired option, move the cursor by using the up
and down arrow keys or by entering the number directly. Press
the Enter key to activate the selected option. Press the
Escape key to return to the main (or previous) menu at any
time. The remainder of this section will discuss the operation
of each menu option.
Rea d Inpu ts From File
SMPTOX3 does not require you to type in all inputs for a
simulation during each session. The capability exists to read
in previously stored inputs, by using the Read Inputs From
File option. By selecting this option from the main menu and
SMPTOX3 version 2.0 User's Manual
Page 4
pressing the Enter key, the screen shown in Figure 3-2 is
displayed.
SMPTOX3 version 2.0 User's Manual
+),
*
647
*
948
*
5
*
*
647
*
5
5
5
5
K)M
*
5
*
5
5
5
5
948
Use PgUp / PgDn to Move
*
5
5
*
5
5
948
Press F10 when done
.)-
*
*
5 ..
5
*
5
Change Directory
K)M
AUGCOP.ST3
*
*
*
647
File Name
*
*
*
5
647
*
*
*
Select File 5
*.st3
948
*
Page 5
*
5
*
*
*
*
Fig u re 3-2: Rea d Inpu ts From File Screen
The default file specification *.ST3 appears in the top
rectangle when first entering the Read Inputs From File
option. All files fitting this file specification are shown
below in the File Name box. By pressing the page down or tab
key, the desired file can be read in by using the arrow keys
to highlight the file and pressing F10. File names specified
by users must consist of up to eight alpha-numeric characters.
The extension .ST3 is automatically added to the file name to
identify the file as an input to SMPTOX3 if a file extension
is not specified. To change directories, press the tab or page
down key a second time to highlight the rectangle in the
Change Directory box and press the Enter key. Select the
desired directory in the same manner described above to select
a file. Repeat the process again to select the input file
desired from the new directory.
A new model input file can be created by first entering the
name of a file that does not currently exist. When this
occurs, SMPTOX3 will ask if you want to create a new file
using the name just specified. You have the option to answer
'no' if you do not wish to create a new file.
Sa ve Inpu ts To File
This program option allows you to store the current set of
inputs to a file for later use. The execution of this option
is exactly the same as the Read Inputs From File. This screen
is shown in Figure 3-3.
SMPTOX3 version 2.0 User's Manual
+),
*
647
*
948
*
5
*
*
647
*
5
5
*
5
5
*
5
5
5
5
948
Use PgUp / PgDn to Move
*
5
5
*
5
5
948
Press F10 when done
*
*
5 ..
5
*
5
Change Directory
K)M
AUGCOP.ST3
*
.)-
5
K)M
*
*
647
File Name
*
*
*
5
647
*
*
*
Select File 5
AUGCOP.ST3
948
*
Page 6
*
5
*
*
*
*
Fig u re 3-3: Sa ve Inpu ts To File Screen
Again, the extension .ST3 will automatically be added to the
name specified if the file extension name is not given. If you
specify the name of an existing file, SMPTOX3 asks if the
existing file should be rewritten. This feature minimizes
errors in writing over files accidentally. If the file does
not currently exist, SMPTOX3 will create a new file in which
to store the inputs.
Enter\M odify M odelInpu ts
The third program option allows you to enter new inputs for a
model simulation or modify existing model inputs. All model
inputs needed for model simulation are accessed from this
section. The Enter\Modify Model Inputs option is divided into
five screens, each specific to a certain type of information:
1)
2)
3)
4)
5)
Upstream River Parameters
Effluent Parameters
Reach Parameters
Observed River Data
Run Information
The program goes to the Run Information screen upon initial
selection of this option. The program can be routed to any
desired input option through use of the function keys as
follows: [F1] Upstream River Parameters; [F2] Effluent
Parameters; [F3] Reach Parameters; [F4] Observed River Data;
and [F5] Run Information. The [F10] key can be pressed at any
time to exit the input option and return to the main menu. The
following paragraphs describe the features available and the
proper application of the above five options.
Ru nInform a tion:
This is the first screen that appears when selecting the
Enter\Modify Model Inputs option. This option allows you to
SMPTOX3 version 2.0 User's Manual
Page 7
enter descriptive information on the system being modeled and
the specific simulation being conducted. This input screen, as
shown in Figure 3-4, requires a total of nine responses.
647
5
5
RUN INFORMATION
:4L<
5
*
Value
5
Requested Information
K)3M
5
Name of receiving stream
*
Flint River
5
5
Model Complexity (1,2,3)
*
3
5
5
Number of discharges
*
6
5
Number of reaches
*
9
5
Name of pollutant
5
Pollutant concentration units
5
Run title for screen display
5
Type of Printer (FX,LQ,LJ)
5
Printer Graph Quality (Low,Med,High) *
5
5
5
5
5
5
5
5
94N8
)
F1-Upstream
*
*
(max = 40)
(max = 40)
*
F2-Effluent
*
5
5
5
5
Copper
*
ug/L
*
August Calibration, Copper
*
HEWLETT PACKARD LASERJET
*
*
*
F3-Reach
5
*
*
5
5
5
F5-Info
5
5
5
5
5
5
LOW
F4-Observed
5
F10-Quit)
Fig u re 3-4: Ru nInform a tionScreen
The second input, model complexity, can be set at one of the
following levels:
1.
2.
3.
SMPTOX, single phase toxics in water column
SMPTOX2, two phase toxics in water column
SMPTOX3, two phase toxics with bed interactions
The chosen level of complexity will determine the range of
parameters specified in the subsequent parameter screens.
These different parameter screens are described below.
The third and fourth inputs require you to specify the number
of dischargers and the number of stream reaches to be
simulated. Both of these inputs are limited to a maximum of
forty. The next three inputs are used as titles for screen
graphs;
they
are
the
name
of
pollutant,
pollutant
concentration units, and the appropriate run title. Pollutant
concentration units must be in pg/L, ng/L, ug/L or mg/L. The
final two inputs are necessary to use the print output option.
By specifying the printer type, you can print directly from
SMPTOX3 without the need to return to the operating system.
To select a printer type, enter FX for an Epson FX (or
compatible) printer, LQ for an Epson LQ series (or compatible)
printer, LJ for a Hewlett Packard Laserjet (or compatible)
printer, or NONE if no printer is being used. The last input,
printer graph quality, refers to the pixel density of the
plot. The following table denotes quantitatively (in dots per
inch) the meaning of low, medium and high quality.
Ta ble 3-1: PixelDens ity (dpi) for Low , M ediu m a nd Hig h Res olu tion
SMPTOX3 version 2.0 User's Manual
Page 8
Low
Epson FX
72 x 120
Epson LQ
60 x 120
HP Laserjet 75 x 75
Medium
216 x 120
180 x 180
150 x 150
High
216 x 240
180 x 360
300 x 300
While in the other screens available under this option, the
run information screen can be accessed by pressing the F5
key.
Ups trea m River Pa ra m eters :
The Upstream River Parameters input screen is shown in
Figure 3-5.
647
5
UPSTREAM RIVER PARAMETERS:
:4L<
5
K)3M
5
August Calibration, Copper
*
Calibration
*
Parameters
5
Flow
(cfs)
93.94
*
5
5
Total Copper
(ug/L) *
2.9
*
5
5
Suspended Solids Conc.
(mg/L) *
13.5
5
Bed Solids Concentration
(mg/L) *
5
River mile of upstream boundary
5
5
5
5
94N8
)
F1-Upstream
*
5
Comments
*
*
*
F2-Effluent
*
5
*
5
*
5
*
5
*
5
2.000e5
*
*
F3-Reach
44.68
F4-Observed
*
5
*
5
F5-Info
F10-Quit)
Fig u re 3-5: Ups trea m River Pa ra m eters Screen
Four parameters are required to describe upstream conditions:
river flow, total toxicant concentration, total suspended
solids concentration, and bed solids concentration. The
calibration for suspended solids concentration is absent at
level 1 complexity, while bed solids concentration is absent
from levels 1 and 2. Use the arrow keys to select a parameter,
and the Enter key to enter values. All inputs must be
specified for the model to run. SMPTOX3 provides the comments
feature to describe the nature of the chosen input value. For
example, entering comments such as "7Q10" for upstream flow or
"95th %ile" for upstream concentration provide a convenient
method for documenting model inputs.
Efflu entPa ra m eters :
The effluent parameters are accessed by using the function key
F2 (Figure 3-6). As with upstream parameters, the suspended
solids concentration is only required in complexity levels 2
and 3.
5
647
EFFLUENT PARAMETERS FOR DISCHARGE 1:
:4L<
5
*
K)3M
Flow
(MGD)
5
Total Copper
(ug/L) *
5
5
*
*
5
August Calibration, Copper
Parameter *
Calibration
5
Comments
38.33
*
5
8.3
*
5
*
5
SMPTOX3 version 2.0 User's Manual
5
5
Suspended Solids Conc.
5
Beginning of Reach Number
5
Name of Discharger
5
5
94N8
Page 9
*
(mg/L) *
*
5
*
5
*
5
4.1
*
2
*
Flint WWTP *
*
*
*
5
*
5
5
Use PgUp and PgDn to get other Discharges
)
F1-Upstream
F2-Effluent
F3-Reach
F4-Observed
F5-Info
F10-Quit)
Fig u re 3-6: Efflu entPa ra m eters Screen
SMPTOX3 requires five inputs (four inputs at level 1) to
describe the characteristics of each effluent. The first three
parameters, flow, total pollutant concentration and suspended
solids concentration, are similar to those of the upstream
river parameters. An additional required parameter is the
reach number where the discharge is located. The last input is
the name of the discharger. It is important to note that
SMPTOX3 requires discharges to be located at the very
beginning of each reach, and that river miles must decrease
with the direction of the flow. Values for the effluent
parameters are specified identically to those for the river
parameters by selecting the parameter using the arrow keys and
entering values using the Enter key (note, however, that
effluent flow is in MGD whereas upstream flow is in cfs). A
column for comments describing the nature of the selection is
also provided.
Users may scroll between discharges (in multiple discharge
situations) by using the PgUp and PgDn keys from within the
effluent parameters screen. Only one discharge is allowed per
reach.
Rea ch Pa ra m eters :
Reach parameters are accessed by pressing the F3 key. Three to
fifteen specific reach parameters are included in this menu,
depending on complexity level (Figure 3-7).
5
647
REACH PARAMETERS FOR REACH 1:
5
*
Parameter *
*
0.75
1.48
0.59
0
0
0
0
0
0.25
0
0.05
0.05
0.37
0
0
Calibration
K)3M
5
Length
(mile)
Average Depth
(feet)
Velocity
(fps)
Water Col. Particulate Decay rate (1/day)
Water Col. Dissolved Decay rate
(1/day)
Volatilization
(1/day)
Bed Particulate Decay Rate
(1/day)
Bed Dissolved Decay Rate
(1/day)
Sus. Solids Settling Velocity
(m/day)
Bed Solids Resuspension Velocity (m/day)
Water Col. Partition Coefficient
(L/mg)
Bed Partition Coefficient
(L/mg)
Active Bed Depth
(feet)
Diffusive Exchange Coefficient
(m/day)
Atmospheric Deposition
(mg/mile/day)
94N8
5
5
5
5
5
5
5
5
5
5
5
5
5
5
5
August Calibration, Copper
:4L<
*
*
*
*
*
*
*
*
*
*
*
*
*
*
5
Comments
*
5
*
5
*
5
*
5
*
5
*
5
*
5
*
5
*
5
*
5
*
5
*
5
5
*
*
*
5
5
SMPTOX3 version 2.0 User's Manual
)
F1-Upstream
Page 10
Use PgUp and PgDn to get other Reaches
F2-Effluent F3-Reach F4-Observed F5-Info
F10-Quit)
Fig u re 3-7: Rea ch Pa ra m eters Inpu t Screen
They include geomorphic parameters (length, depth, etc.) and
physical/chemical coefficients and rates (decay, partitioning,
settling, etc.) The significance of these inputs is discussed
in the U.S. EPA Guidance Manual for Stream Toxics Modeling
(EPA, 1984). The arrow keys move the cursor up and down on the
page, while the PgUp and PgDn keys change from reach to reach
when there are multiple reaches.
There is a shortcut available for entering repetitive reach
parameters when there are many reaches. When the highlight is
placed on any entry, pressing the alt-R key combination will
duplicate that entry in all reaches.
Obs erved River Da ta :
To input observed water quality, press the F4 key. The
observed river data screen for complexity level 3 is shown in
Figure 3-8. Again, the number of parameters varies with the
chosen model complexity.
647
5
OBSERVED RIVER DATA:
:4L<
5
* River
5
*
5
* Diss. Water * Diss. Bed
* Copper
* Copper
* (ug/L)
* (ug/L)
* Total Water
*
*
* Mile
K)3M
5
1 *
2 *
3 *
4 *
5 *
6 *
7 *
8 *
9 *
10*
5
5
5
5
5
5
5
5
5
94N8
)
44.68
43.81
41.2
38.03
32.69
27.04
19.96
9.27
6.85
0
*
*
*
*
*
*
*
*
*
F1-Upstream
1.9
3.5
4
4.7
3.8
4.2
4
3.3
3.4
0
5
August Calibration, Copper
*
*
*
*
*
*
*
*
*
*
F2-Effluent
0
0
0
0
0
0
0
0
0
0
F3-Reach
*
*
*
*
*
*
*
*
*
* Total Bed
* Suspended5
* Copper (ug/L) * Copper (ug/L) * Solids
5
*
*
* (mg/L)
5
2.9
4.4
5.8
5.5
4.2
4.7
8.1
6.2
5.9
0
F4-Observed
*
*
*
*
*
*
*
*
*
*
F5-Info
0
0
0
0
0
0
0
0
0
0
*
*
*
*
*
*
*
*
*
*
13.1
10.9
10.7
8.4
6.3
5.3
11.2
12.5
11.1
0
5
5
5
5
5
5
5
5
5
5
F10-Quit)
Fig u re 3-8: Obs erved River Da ta Screen
The arrow keys allow you to enter data for the pollutant
concentrations observed in the water column and bed sediments
(total and dissolved) and the suspended solids concentration
at a particular river mile. These data are not required by the
model, but are used for comparison to model predictions during
model calibration. Particulate pollutant concentrations are
calculated internally as the difference between total and
dissolved concentration.
Ru nSing le Sim u la tion
SMPTOX3 version 2.0 User's Manual
Page 11
The fourth main menu option is to run a single simulation.
SMPTOX3 provides three separate simulation options as shown in
Figure 3-9. Each option performs identical model simulations
using the current input file; however, the output format is
specifically tailored for each option. This section will
detail the operation of each type of simulation.
SMPTOX3 version 2.0 User's Manual
647
Page 12
5
5
SMPTOX3 RUN MENU
948
647
5
[1]
Calibration \ Verification 5
5
[2]
Waste Load Allocation
5
[3]
Sensitivity Analysis
5
[4]
Exit to Main Menu
5
5
5
5
5
5
5
5
5
948
)
Make selection and press Enter )
Fig u re 3-9: SM PTOX3 Ru nM enu
Ca libra tion\Verifica tion:
The purpose of model calibration and verification is to allow
users to refine model parameters by comparing model
predictions to observed site-specific data. After highlighting
this option with the cursor (using the arrow keys or typing
the appropriate number) and pressing the Enter key, model
calculations are begun and the user is informed in which reach
the calculations are being performed.
The first screen that appears after the calculations are
completed is the total toxicant in water (Figure 3-10). It
shows predicted and observed (if any) concentrations in the
water for the total toxicant in each reach. At complexity
level 2, the F2 key gives a profile for dissolved toxicant in
water and F3 key for particulate toxicant in water. To view
the instream suspended solids concentration, press F7. At
complexity level 3, pressing F4 through F6 gives bed profiles
for the total, dissolved and particulate phases of the
toxicant.
Pressing the space bar will cause the screen to toggle back
and forth converting the x-axis from reach segmentation to
river miles. When in reach segmentation mode, vertical lines
denote the beginning and ends of the reaches. The F8 key will
toggle between removing and adding horizontal grid lines. The
F9 key allows for an additional title to be added below the
graph. To obtain a print screen of the graph on the printer
previously chosen, press the * key. The prompts viewed at the
bottom of the graph will not appear on the print out, only the
additional title specified by the user, if the F9 option was
used. To quit, press the F10 key to return to the SMPTOX3 Run
Menu.
SMPTOX3 version 2.0 User's Manual
Page 13
Fig u re 3-10 : Firs t Ca libra tionPlot, Tota lToxica ntinW a ter (Level3 s creen)
W a s te Loa d Alloca tion:
The purpose of waste load allocation is to compare projected
water quality for a given loading scenario to the applicable
water quality standard(s). Upon selection of this option, the
screen shown in Figure 3-11 appears.
64L7
5
*
From Mile
*
*
44.68
0
0
*
Standard (ug/L)
:4P<
5
10.5
0
0
5
5
*
*
94N8
64L7
5
*
Name of Discharge
5
Flint WWTP
Fly Ash Pond
Brent Run
Ragnone WWTP
Pine Run
Silver Creek
5
5
5
5
5
94N8
)
*
*
Total Copper Discharge
:4P<
*
*
*
*
*
*
5
To Mile
6.84
0
0
5
(ug/L)
5
8.3
80
3.8
28.5
3.8
3.8
5
5
5
5
5
5
5
5
Enter text and Press F10 to continue)
Fig u re 3-11: W a s te Loa d Alloca tionDa ta Screen
The upper box provides the capability to specify up to three
different water quality standards for the study system. Use
the arrow key to move the cursor from input to input to enter
the desired information. The model uses this information to
plot projected pollutant concentration versus the standard at
SMPTOX3 version 2.0 User's Manual
Page 14
all locations in the stream. If no river miles are given,
SMPTOX3 will apply the given standard for the entire length of
the system.
Fig u re 3-12: W LA Plot, Tota lToxica ntinW a ter (Level3)
The lower box provides the capability to change the total
pollutant concentrations from any of the dischargers. Use the
down arrow or the Enter key from the last line of the upper
box to move the cursor to the lower box. This allows you to
modify discharge concentrations without the need to return to
the effluent parameters screen in the Enter\Modify Model
Inputs section. To begin model simulation, press F10. A prompt
informs you which reach calculations are being performed. The
first screen to appear is that of the total toxicant profile
of the stream. The water quality standard also appears on the
plot (Figure 3-12). The ten function keys and space bar
operate in the same manner as in the Calibration\Verification
option.
Sens itivity Ana lys is :
The final simulation option available in SMPTOX3 is
sensitivity analysis. This option allows you to determine the
sensitivity of model projections to changes in selected model
inputs. Figure 3-13 shows the input screen for varying the
fourteen level 3 input parameters by a fixed percentage. The
percentage cannot exceed 100%. This percentage change will not
be stored in the input data file. It has to be specified
before sensitivity analysis is performed.
SMPTOX3 version 2.0 User's Manual
Page 15
After entering the desired information with the Enter or arrow
keys, press F10. Model calculations begin with baseline
conditions and then systematically evaluate the upper and
lower bounds for each parameter changed. For clarity's sake,
it is recommended that no more than two parameters be changed
in a single simulation. Use the Tab key to scroll through the
screens; each screen successively adds the new profile as
defined by the change in the parameters documented under the
plot. Figure 3-14 shows the baseline total instream toxicant
with a 25% increase and decrease in the water column partition
coefficient.
647
5
SENSITIVITY ANALYSIS:
5
*
Parameter
Velocity
Average Depth
Active Bed Depth
Water Column Decay Rates
Volatilization
Bed Decay Rates
Suspended Solids Settling Velocity
Suspended Solids Resuspension Velocity
Water Column Partition Coefficient
Bed Partition Coefficient
Diffusive Exchange Coefficient
Bed Solids Concentration
Upstream Toxicant Concentration
Upstream Suspended Solids Concentration
5
5
5
5
5
5
5
5
5
5
5
5
94N8
5
)
5
Change (%)
K)3M
5
5
August Calibration, Copper
:4L<
*
*
*
*
*
*
*
*
*
*
*
*
*
*
0
0
0
0
0
0
0
0
25
0
0
0
0
0
Enter text and Press F10 to continue)
Fig u re 3-13: Sens itivity Ana lys is Inpu t Screen(Level3)
5
5
5
5
5
5
5
5
5
5
5
5
5
5
SMPTOX3 version 2.0 User's Manual
Page 16
Fig u re 3-14: ± 25% W a ter Colu m nPa rtitionCoefficientSens itivity (Level3)
Ru nM u ltiple Sim u la tions
This option gives you the capability to simulate and compare
results for more than one input file at a time. Up to 11 input
decks can be simulated simultaneously. Figure 3-15 shows how
the screen appears when this option is selected.
647
5
FILES CHOSEN:
5
WLACOP.ST3
WLA2COP.ST3
WLA3COP.ST3
:4<
5
5
)
(11 max) 5
948
F1 - To Add File
F2 - To Delete File
5
5
5
F10 - To Run Simulation)
Fig u re 3-15: Ru nM u ltiple Sim u la tions Screen
By pressing F1, the Read Inputs From File screen is summoned
and the input file is selected in the manner previously
described. This process is repeated to select the desired
number of files (11 maximum). The F2 key will delete the files
starting from the bottom of the files listed in the Files
Chosen box. When the desired files have been selected, the F10
key initiates model calculations. The screen will display
which files are currently being analyzed. The profiles are
identified by separate colors which are keyed in the upper
left-hand corner of the plot. The ten function keys operate
identically to the single run simulation.
SMPTOX3 version 2.0 User's Manual
Page 17
View Ta bu la r Ou tpu t
An example output table is shown in Figure 3-16, and consists
of numeric model output at incremental river miles throughout
the length of the stream. Concentrations are listed at fixed
increments (e.g. 0.5 miles), along with concentrations at the
beginning or end of each reach. Users can view the entire
output listing by using the PgUp and PgDn keys. For level 3,
model calculations for total, dissolved and particulate
concentrations for the toxicant in the water column and bed
sediments
are
listed,
as
are
the
suspended
solids
concentration in the water column. The F10 key returns users
to the main menu.
647
5
OUTPUT DATA:
5
* Total Water* Total Bed* Dis Water* Dis Bed
* Copper ug/L* Copper
* Copper
* Copper
Mile *
* ug/L
* ug/L
* ug/L
:4L<
5
5
K)3M
5
44.68*
44.5 *
44
*
43.93*
43.93*
43.5 *
43.5 *
43
*
42.5 *
42
*
41.5 *
41
*
40.5 *
40.39 *
40.39 *
5
5
5
5
5
5
5
5
5
5
5
5
5
5
94N8
2.9
2.888
2.855
2.851
4.96
4.943
5.627
5.602
5.578
5.554
5.53
5.507
5.485
5.48
5.48
5
August Calibration, Copper
*
*
*
*
*
*
*
*
*
*
*
*
*
*
*
17315
17315
17315
17315
23154
23154
26187
26187
26187
26187
26187
26187
26187
26187
38424
*
*
*
*
*
*
*
*
*
*
*
*
*
*
*
1.731
1.731
1.731
1.731
3.858
3.858
4.364
4.364
4.364
4.364
4.364
4.364
4.364
4.364
3.842
*
*
*
*
*
*
*
*
*
*
*
*
*
*
*
1.731
1.731
1.731
1.731
3.858
3.858
4.364
4.364
4.364
4.364
4.364
4.364
4.364
4.364
3.842
* Suspend 5
* Solids
5
*
*
5
*
*
*
*
*
*
*
*
*
*
*
*
*
*
* Par Water* Par Bed
* Copper
* Copper
* ug/L
* ug/mg
1.169
1.157
1.124
1.119
1.101
1.085
1.263
1.238
1.214
1.19
1.167
1.144
1.121
1.116
1.638
*
*
*
*
*
*
*
*
*
*
*
*
*
*
*
0.0866
0.0866
0.0866
0.0866
0.116
0.116
0.131
0.131
0.131
0.131
0.131
0.131
0.131
0.131
0.192
* mg/L
*
*
*
*
*
*
*
*
*
*
*
*
*
*
13.5
13.36
12.98
12.93
9.514
9.373
9.647
9.458
9.272
9.09
8.911
8.736
8.564
8.527
8.527
5
5
5
5
5
5
5
5
5
5
5
5
5
5
5
Use PgUp and PgDn to see other data
Press F10 to continue)
)
Fig u re 3-16: Exa m ple View Ta bu la r Ou tpu t Screen(Level3)
View G ra phics O u tpu t
Once the current input deck is run, this option allows the
plots to be viewed on screen without the need to rerun the
input deck. All function keys operate as before.
Print Res u lts
The results of the model simulation can be printed to a
printer or a file. Figure 3-17 shows the screen used when
selecting this option.
SMPTOX3 version 2.0 User's Manual
647
Page 18
5
5
Write to Printer or to File
948
647
5
[1]
Printer
5
5
[2]
File
5
K)M
948
)
Make selection and press Enter )
Fig u re 3-17: PrintRes u lts O ptions Screen
Select option 1 for the results to be printed to the printer,
option 2 to be printed to a file. If the file option is
chosen, a screen identical to the Save Inputs To File screen
appears. The extension .PRN is given to a file if the
extension is not specified.
Q u it
To end SMPTOX3 and return the computer to the operating
system, select this option and press the Enter key. Before
completely exiting the program, the user is asked whether or
not to save changes to the current input file. This fail-safe
protects against losing the most current version of the input
file by forgetting to save the file before quitting SMPTOX3.
SMPTOX3 version 2.0 User's Manual
Page 19
IV. REFERENCES
Limno-Tech, Inc. (LTI), "Simplified Method Program (SMP)
User's Manual," prepared for U.S. EPA MDSD, Washington,
D.C., 1986a.
Limno-Tech, Inc. (LTI), "Simplified Method Program - Toxics
(SMPTOX) User's Manual," prepared for U.S. EPA MDSD,
Washington, D.C., 1986b.
Limno-Tech, Inc. (LTI), "Simplified Method Program - Two
Phase Toxics (SMPTOX2) User's Manual," prepared for
U.S. EPA MDSD, Washington, D.C., 1986c.
Limno-Tech, Inc. (LTI), "Toxics Modeling Handbook," prepared
for U.S. EPA Region IV, Atlanta, GA, 1990a.
Limno-Tech, Inc. (LTI), "Simplified Method Program - Two
Phase Toxics with Bed Interactions (SMPTOX3) User's
Manual," prepared for U.S. EPA Region IV, Atlanta, GA.,
Supported by U.S. EPA Assessment and Watershed
Protection Division, Washington, D.C., 1990b.
U.S. Environmental Protection Agency (U.S. EPA), "Simplified
Analytical Method for Determining NPDES Effluent
Limitations for POTWs Discharging into Low-Flow
Streams," Office of Water Regulations and Standards,
MDSD, Washington, D.C., 1980.
U.S. Environmental Protection Agency (U.S. EPA), "Technical
Guidance Manual for Performing Waste Load Allocations Book II, Streams and Rivers, Chapter 3 Toxic
Substances," Office of Water Regulations and Standards,
MDSD, Washington, D.C. 1984.