1
30
Using JoinMap
Chart node
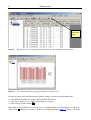
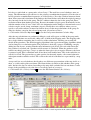
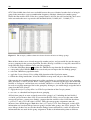
For all tabsheets where it is useful to study the data with a chart, the Create Chart button and the
Create Chart function in the Calculate menu are activated. Applying the function or clicking the
button will create a chart node with several options to set the chart to your preferences. The chart
will be shown using the current page setup. The options are self-explaining and will not be
described here, apart from the following note. When the map position is used for the X-axis the
width of bars in bar charts and stacked bar charts is based upon the closest distances where bars
should be drawn; the effect of this is that if some of the loci are in a cluster, the bar may be very
narrow or even invisible. In such cases removing the checkmark at the Use Position option or using
an XY chart will probably give a better picture. You can zoom into the chart by double clicking,
and zoom out by double clicking on the other mouse button; a zoomed-in chart can be dragged with
the mouse within its window to put it in another position.
Final remarks
A genetic map is as good as the data that were used to construct it. With real data you will discover
sooner or later that, depending on the quality of the raw data, maps produced by JoinMap may
slightly, or even seriously, vary with the parameter settings and the selection of subsets of loci and
individuals. No mapping program can ever produce the ultimate genetic map. Whenever data are
being added to existing data, maps will slightly change, if not with respect to order, then most likely
with respect to map distance. Essentially the calculation of a genetic linkage map is a statistical
estimation procedure leading to an answer with a definite amount of uncertainty. As such the
mapping algorithms of JoinMap reflect a balance between statistical rigour and computational
speed, and thus they bear the advantages and disadvantages of a compromise. JoinMap is designed
to allow the user a thorough exploration of his or her experimental data in order to let him or her
arrive at good quality maps.