1
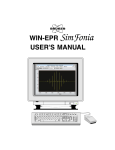
An EPR Primer
2
This chapter is an introduction to the basic theory and practice of
EPR spectroscopy. It gives you sufficient background to understand the following chapters. In addition, we strongly encourage
the new user to explore some of the texts and articles at the end
of this chapter. You can then fully benefit from your particular
EPR application or think of new ones.
Basic EPR Theory
2.1
Introduction to Spectroscopy
2.1.1
During the early part of this century, when scientists began to
apply the principles of quantum mechanics to describe atoms or
molecules, they found that a molecule or atom has discrete (or
separate) states, each with a corresponding energy. Spectroscopy
is the measurement and interpretation of the energy differences
between the atomic or molecular states. With knowledge of
these energy differences, you gain insight into the identity, structure, and dynamics of the sample under study.
We can measure these energy differences, ∆E, because of an
important relationship between ∆E and the absorption of electromagnetic radiation. According to Planck's law, electromagnetic
radiation will be absorbed if:
∆E = hν ,
[2-1]
where h is Planck's constant and ν is the frequency of the radiation.
EMX User’s Manual
Basic EPR Theory
∆E
Figure 2-1
hν
Transition associated with the absorption of
electromagnetic energy.
The absorption of energy causes a transition from the lower
energy state to the higher energy state. (See Figure 2-1.) In conventional spectroscopy, ν is varied or swept and the frequencies
at which absorption occurs correspond to the energy differences
of the states. (We shall see later that EPR differs slightly.) This
record is called a spectrum. (See Figure 2-2.) Typically, the frequencies vary from the megahertz range for NMR (Nuclear
Magnetic Resonance) (AM, FM, and TV transmissions use electromagnetic radiation at these frequencies), through visible light,
to ultraviolet light. Radiation in the gigahertz range (the same as
in your microwave oven) is used for EPR experiments.
hν1
hν2
Absorption
ν1
ν
Figure 2-2
2-2
A spectrum.
ν2
Basic EPR Theory
The Zeeman Effect
2.1.2
The energy differences we study in EPR spectroscopy are predominately due to the interaction of unpaired electrons in the
sample with a magnetic field produced by a magnet in the laboratory. This effect is called the Zeeman effect. Because the electron has a magnetic moment, it acts like a compass or a bar
magnet when you place it in a magnetic field, B0. It will have a
state of lowest energy when the moment of the electron, µ, is
aligned with the magnetic field and a state of highest energy
when µ is aligned against the magnetic field. (See Figure 2-3.)
The two states are labelled by the projection of the electron spin,
Ms, on the direction of the magnetic field. Because the electron
is a spin 1/2 particle, the parallel state is designated as Ms = - 1/2
and the antiparallel state is Ms = + 1/2.
B0
Figure 2-3
EMX User’s Manual
B0
Minimum and maximum energy orientations
of µ with respect to the magnetic field B0.
2-3
Basic EPR Theory
From quantum mechanics, we obtain the most basic equations of
EPR:
1
E = g µB B0 Ms = ± --- g µB B0
2
[2-2]
∆E = hν = g µBB0.
[2-3]
and
g is the g-factor, which is a proportionality constant approximately equal to 2 for most samples, but varies depending on the
electronic configuration of the radical or ion. µ B is the Bohr
magneton, which is the natural unit of electronic magnetic
moment.
Two facts are apparent from equations Equation [2-2] and Equation [2-3] and its graph in Equation Figure 2-4.
• The two spin states have the same energy in the absence of a
magnetic field.
• The energies of the spin states diverge linearly as the magnetic field increases.
These two facts have important consequences for spectroscopy.
• Without a magnetic field, there is no energy difference to
measure.
• The measured energy difference depends linearly on the
magnetic field.
2-4
Basic EPR Theory
Because we can change the energy differences between the two
spin states by varying the magnetic field strength, we have an
alternative means to obtain spectra. We could apply a constant
magnetic field and scan the frequency of the electromagnetic
radiation as in conventional spectroscopy. Alternatively, we
could keep the electromagnetic radiation frequency constant and
scan the magnetic field. (See Figure 2-4.) A peak in the absorption will occur when the magnetic field “tunes” the two spin
states so that their energy difference matches the energy of the
radiation. This field is called the “field for resonance”. Owing to
the limitations of microwave electronics, the latter method offers
superior performance. This technique is used in all Bruker EPR
spectrometers.
∆E
Absorption
B0
Figure 2-4
EMX User’s Manual
Variation of the spin state energies as a function of the applied magnetic field.
2-5
Basic EPR Theory
The field for resonance is not a unique “fingerprint” for identification of a compound because spectra can be acquired at several
different frequencies. The g-factor,
hν
g = -------------- ,
µ B B0
[2-4]
being independent of the microwave frequency, is much better
for that purpose. Notice that high values of g occur at low magnetic fields and vice versa. A list of fields for resonance for a
g = 2 signal at microwave frequencies commonly available in
EPR spectrometers is presented in Table 2-1.
Microwave
Band
Bres (G)
L
1.1
392
S
3.0
1070
X
9.75
3480
Q
34.0
12000
W
94.0
34000
Table 2-1
2-6
Frequency
(GHz)
Field for resonance, Bres, for a g = 2 signal at
selected microwave frequencies.
Basic EPR Theory
Hyperfine Interactions
2.1.3
Measurement of g-factors can give us some useful information;
however, it does not tell us much about the molecular structure
of our sample. Fortunately, the unpaired electron, which gives us
the EPR spectrum, is very sensitive to its local surroundings.
The nuclei of the atoms in a molecule or complex often have a
magnetic moment, which produces a local magnetic field at the
electron. The interaction between the electron and the nuclei is
called the hyperfine interaction. It gives us a wealth of information about our sample such as the identity and number of atoms
which make up a molecule or complex as well as their distances
from the unpaired electron.
B0
BI
Electron
Nucleus
B0
BI
Electron
Figure 2-5
EMX User’s Manual
Nucleus
Local magnetic field at the electron, BI, due
to a nearby nucleus.
2-7
Basic EPR Theory
Equation Figure 2-5 depicts the origin of the hyperfine interaction. The magnetic moment of the nucleus acts like a bar magnet
(albeit a weaker magnet than the electron) and produces a magnetic field at the electron, BI. This magnetic field opposes or
adds to the magnetic field from the laboratory magnet, depending on the alignment of the moment of the nucleus. When BI
adds to the magnetic field, we need less magnetic field from our
laboratory magnet and therefore the field for resonance is lowered by BI. The opposite is true when BI opposes the laboratory
field.
For a spin 1/2 nucleus such as a hydrogen nucleus, we observe
that our single EPR absorption signal splits into two signals
which are each B I away from the original signal. (See
Figure 2-6.)
BI
Figure 2-6
BI
Splitting in an EPR signal due to the local
magnetic field of a nearby nucleus.
If there is a second nucleus, each of the signals is further split
into a pair, resulting in four signals. For N spin 1/2 nuclei, we
will generally observe 2N EPR signals. As the number of nuclei
gets larger, the number of signals increases exponentially. Sometimes there are so many signals that they overlap and we only
observe one broad signal.
2-8
Basic EPR Theory
Signal Intensity
2.1.4
So far, we have concerned ourselves with where the EPR signal
is, but the size of the EPR signal is also important if we want to
measure the concentration of the EPR active species in our sample. In the language of spectroscopy, the size of a signal is
defined as the integrated intensity, i.e., the area beneath the
absorption curve. (See Figure 2-7.) The integrated intensity of
an EPR signal is proportional to the concentration.
Figure 2-7
Integrated intensity of absorption signals.
Both signals have the same intensity.
Signal intensities do not depend solely on concentrations. They
also depend on the microwave power. If you do not use too
much microwave power, the signal intensity grows as the square
root of the power. At higher power levels, the signal diminishes
as well as broadens with increasing microwave power levels.
This effect is called saturation. If you want to measure accurate
linewidths, lineshapes, and closely spaced hyperfine splittings,
you should avoid saturation by using low microwave power. A
quick means of checking for the absence of saturation is to
decrease the microwave power and verify that the signal intensity also decreases by the square root of the microwave power.
EMX User’s Manual
2-9
Basic EPR Practice
Basic EPR Practice
2.2
Introduction to Spectrometers
2.2.1
In the first half of this chapter, we discussed the theory of EPR
spectroscopy. Now we need to consider the practical aspects of
EPR spectroscopy. Theory and practice have always been
strongly interdependent in the development and growth of EPR.
A good example of this point is the first detection of an EPR signal by Zavoisky in 1945. The Zeeman effect had been known in
optical spectroscopy for many years, but the first direct detection
of EPR had to wait until the development of radar during World
War II. Only then, did scientists have the necessary components
to build sufficiently sensitive spectrometers (scientific instruments designed to acquire spectra). The same is true today with
the development of advanced techniques in EPR such as Fourier
Transform and high frequency EPR.
The simplest possible spectrometer has three essential components: a source of electromagnetic radiation, a sample, and a
detector. (See Figure 2-8.) To acquire a spectrum, we change
the frequency of the electromagnetic radiation and measure the
amount of radiation which passes through the sample with a
detector to observe the spectroscopic absorptions. Despite the
apparent complexities of any spectrometer you may encounter, it
can always be simplified to the block diagram shown in
Figure 2-8.
Source
Figure 2-8
2-10
Sample
The simplest spectrometer.
Detector
Basic EPR Practice
Figure 2-9 shows the general layout of a Bruker EPR spectrometer. The electromagnetic radiation source and the detector are in
a box called the “microwave bridge”. The sample is in a microwave cavity, which is a metal box that helps to amplify weak
signals from the sample. As mentioned in Section 2.1.2, there is
a magnet to “tune” the electronic energy levels. In addition, we
have a console, which contains signal processing and control
electronics and a computer. The computer is used for analyzing
data as well as coordinating all the units for acquiring a spectrum. In the following sections you will become acquainted with
how these different parts of the spectrometer function and interact.
Bridge
Cavity
and
Sample
Console
Magnet
Figure 2-9
The general outlay of an EPR spectrometer.
EMX User’s Manual
2-11
Basic EPR Practice
Signal
Out
G
Reference
Arm
Detector
Diode
E
F
Source
A
C
Attenuator
B
Circulator
D
Cavity
Figure 2-10
2-12
Block diagram of a microwave bridge.
Basic EPR Practice
The Microwave Bridge
2.2.2
The microwave bridge houses the microwave source and the
detector. There are more parts in a bridge than shown in
Figure 2-10, but most of them are control, power supply, and
security electronics and are not necessary for understanding the
basic operation of the bridge. We shall now follow the path of
the microwaves from the source to the detector.
We start our tour of the microwave bridge at point A, the microwave source. The output power of the microwave source cannot
be varied easily, however in our discussion of signal intensity,
we stressed the importance of changing the power level. Therefore, the next component, at point B, after the microwave source
is a variable attenuator, a device which blocks the flow of microwave radiation. With the attenuator, we can precisely and accurately control the microwave power which the sample sees.
Bruker EPR spectrometers operate slightly differently than the
simple spectrometer shown in the block diagram, Figure 2-8.
The diagram depicts a transmission spectrometer (It measures
the amount of radiation transmitted through the sample.) and
most EPR spectrometers are reflection spectrometers. They
measure the changes (due to spectroscopic transitions) in the
amount of radiation reflected back from the microwave cavity
containing the sample (point D in the figure). We therefore want
our detector to see only the microwave radiation coming back
from the cavity. The circulator at point C is a microwave device
which allows us to do this. Microwaves coming in port 1 of the
circulator only go to the cavity through port 2 and not directly to
the detector through port 3. Reflected microwaves are directed
only to the detector and not back to the microwave source.
We use a Schottky barrier diode to detect the reflected microwaves (point E in the figure). It converts the microwave power
to an electrical current. At low power levels, (less than 1 microwatt) the diode current is proportional to the microwave power
and the detector is called a square law detector. (Remember that
EMX User’s Manual
2-13
Basic EPR Practice
electrical power is proportional to the square of the voltage or
current.) At higher power levels, (greater than 1 milliwatt) the
diode current is proportional to the square root of the microwave
power and the detector is called a linear detector. The transition
between the two regions is very gradual.
For quantitative signal intensity measurements as well as optimal sensitivity, the diode should operate in the linear region. The
best results are attained with a detector current of approximately
200 microamperes. To insure that the detector operates at that
level, there is a reference arm (point F in the figure) which supplies the detector with some extra microwave power or “bias”.
Some of the source power is tapped off into the reference arm,
where a second attenuator controls the power level (and consequently the diode current) for optimal performance. There is also
a phase shifter to insure that the reference arm microwaves are in
phase with the reflected signal microwaves when the two signals
combine at the detector diode.
The detector diodes are very sensitive to damage from excessive
microwave power and will slowly lose their sensitivity. To prevent this from happening, there is protection circuitry in the
bridge which monitors the current from the diode. When the current exceeds 400 microamperes, the bridge automatically protects the diode by lowering the microwave power level. This
reduces the risk of damage due to accidents or improper operating procedures. However, it is good lab practice to follow correct procedures and not rely on the protection circuitry.
2-14
Basic EPR Practice
The EPR Cavity
2.2.3
In this section, we shall discuss the properties of microwave
(EPR) cavities and how changes in these properties due to
absorption result in an EPR signal. We use microwave cavities
to amplify weak signals from the sample. A microwave cavity is
simply a metal box with a rectangular or cylindrical shape which
resonates with microwaves much as an organ pipe resonates
with sound waves. Resonance means that the cavity stores the
microwave energy; therefore, at the resonance frequency of the
cavity, no microwaves will be reflected back, but will remain
inside the cavity. (See Figure 2-11.)
Reflected
Microwave
Power
ν
Figure 2-11
∆ν
νres
Reflected microwave power from a resonant
cavity.
Cavities are characterized by their Q or quality factor, which
indicates how efficiently the cavity stores microwave energy. As
Q increases, the sensitivity of the spectrometer increases. The Q
factor is defined as
2 π (energy stored)
Q = ----------------------------------------------------------------- ,
energy dissipated per cycle
[2-5]
where the energy dissipated per cycle is the amount of energy
lost during one microwave period. Energy can be lost to the side
walls of the cavity because the microwaves generate electrical
currents in the side walls of the cavity which in turn generates
EMX User’s Manual
2-15
Basic EPR Practice
heat. We can measure Q factors easily because there is another
way of expressing Q:
ν res
Q = --------- ,
∆ν
[2-6]
where νres is the resonant frequency of the cavity and ∆ν is the
width at half height of the resonance.
Sample
Stack
Sample
Stack
Microwave Magnetic Field
Figure 2-12
Microwave Electric Field
Magnetic and electric field patterns in a standard EPR cavity.
A consequence of resonance is that there will be a standing wave
inside the cavity. Standing electromagnetic waves have their
electric and magnetic field components exactly out of phase, i.e.
where the magnetic field is maximum, the electric field is minimum and vice versa. The spatial distribution of the amplitudes
of the electric and magnetic fields in the most commonly used
EPR cavity is shown in Figure 2-12. We can use the spatial separation of the electric and magnetic fields in a cavity to great
advantage. Most samples have non-resonant absorption of the
microwaves via the electric field (this is how a microwave oven
works) and the Q will be degraded by an increase in the dissipated energy. It is the magnetic field that drives the absorption in
2-16
Basic EPR Practice
EPR. Therefore, if we place our sample in the electric field minimum and the magnetic field maximum, we obtain the biggest
signals and the highest sensitivity. The cavities are designed for
optimal placement of the sample.
We couple the microwaves into the cavity via a hole called an
iris. The size of the iris controls the amount of microwaves
which will be reflected back from the cavity and how much will
enter the cavity. The iris accomplishes this by carefully matching or transforming the impedances (the resistance to the waves)
of the cavity and the waveguide (a rectangular pipe used to carry
microwaves). There is an iris screw in front of the iris which
allows us to adjust the “matching”. This adjustment can be visualized by noting that as the screw moves up and down, it effectively changes the size of the iris. (See Figure 2-13.)
Iris
Screw
Waveguide
Iris
Cavity
Figure 2-13
The matching of a microwave cavity to
waveguide.
How do all of these properties of a cavity give rise to an EPR
signal? When the sample absorbs the microwave energy, the Q is
lowered because of the increased losses and the coupling
EMX User’s Manual
2-17
Basic EPR Practice
changes because the absorbing sample changes the impedance of
the cavity. The cavity is therefore no longer critically coupled
and microwave will be reflected back to the bridge, resulting in
an EPR signal.
The Signal Channel
2.2.4
EPR spectroscopists use a technique known as phase sensitive
detection to enhance the sensitivity of the spectrometer. The
advantages include less noise from the detection diode and the
elimination of baseline instabilities due to the drift in DC electronics. A further advantage is that it encodes the EPR signals to
make it distinguishable from sources of noise or interference
which are almost always present in a laboratory. The signal
channel, a unit which fits in the spectrometer console, contains
the required electronics for the phase sensitive detection.
The detection scheme works as follows. The magnetic field
strength which the sample sees is modulated (varied) sinusoidally at the modulation frequency. If there is an EPR signal, the
field modulation quickly sweeps through part of the signal and
the microwaves reflected from the cavity are amplitude modulated at the same frequency. For an EPR signal which is approximately linear over an interval as wide as the modulation
amplitude, the EPR signal is transformed into a sine wave with
an amplitude proportional to the slope of the signal (See
Figure 2-14.)
First Derivative
Figure 2-14
2-18
Field modulation and phase sensitive detection.
Basic EPR Practice
The signal channel (more commonly known as a lock-in amplifier or phase sensitive detector) produces a DC signal proportional to the amplitude of the modulated EPR signal. It compares
the modulated signal with a reference signal having the same
frequency as the field modulation and it is only sensitive to signals which have the same frequency and phase as the field modulation. Any signals which do not fulfill these requirements (i.e.,
noise and electrical interference) are suppressed. To further
improve the sensitivity, a time constant is used to filter out more
of the noise.
Modulation Amplitude
Phase sensitive detection with magnetic field modulation can
increase our sensitivity by several orders of magnitude; however, we must be careful in choosing the appropriate modulation
amplitude, frequency, and time constant. All three variables can
distort our EPR signals and make interpretation of our results
difficult.
B0
Figure 2-15
EMX User’s Manual
Signal distortions due to excessive field
modulation.
2-19
Basic EPR Practice
As we apply more magnetic field modulation, the intensity of
the detected EPR signals increases; however, if the modulation
amplitude is too large (larger than the linewidths of the EPR signal), the detected EPR signal broadens and becomes distorted.
(See Figure 2-15.) A good compromise between signal intensity
and signal distortion occurs when the amplitude of the magnetic
field modulation is equal to the width of the EPR signal. Also, if
we use a modulation amplitude greater than the splitting
between two EPR signals, we can no longer resolve the two signals.
Time Constant
Time constants filter out noise by slowing down the response
time of the spectrometer. As the time constant is increased, the
noise levels will drop. If we choose a time constant which is too
long for the rate at which we scan the magnetic field, we can distort or even filter out the very signal which we are trying to
extract from the noise. Also, the apparent field for resonance
will shift. Figure 2-16 shows the distortion and disappearance
of a signal as the time constant is increased. If you need to use a
long time constant to see a weak signal, you must use a slower
scan rate. A safe rule of thumb is to make sure that the time
needed to scan through a single EPR signal should be ten times
greater than the length of the time constant.
B0
Figure 2-16
2-20
Signal distortion and shift due to excessive
time constants.
Basic EPR Practice
For samples with very narrow or closely spaced EPR signals,
(~ 50 milligauss. This usually only happens for organic radicals
in dilute solutions.) we can get a broadening of the signals if our
modulation frequency is too high (See Figure 2-17.) The broadening is a consequence of the Heisenberg uncertainty principle.
12.5 kHz
100 kHz
B0
Figure 2-17
Loss of resolution due to high modulation
frequency.
The Magnetic Field Controller
2.2.5
The magnetic field controller allows us to sweep the magnetic
field in a controlled and precise manner for our EPR experiment.
It consists of two parts; a part which sets the field values and the
timing of the field sweep and a part which regulates the current
in the windings of the magnet to attain the requested magnetic
field value.
The magnetic field values and the timing of the magnetic field
sweep are controlled by a microprocessor in the controller. A
field sweep is divided into a maximum of 4096 discrete steps
called sweep addresses. At each step, a reference voltage corresponding to the magnetic field value is sent to the part of the
controller that regulates the magnetic field. The sweep rate is
EMX User’s Manual
2-21
Basic EPR Practice
controlled by varying the waiting time between the individual
steps.
Hall
Probe
Power
Supply
Magnet
3475 G
Microprocessor
3476 G
Regulator
3477 G
Reference
Voltages
Figure 2-18
A block diagram of the field controller and
associated components.
The magnetic field regulation occurs via a Hall probe placed in
the gap of the magnet. It produces a voltage which is dependent
on the magnetic field perpendicular to the probe. The relationship is not linear and the voltage changes with temperature;
however, this is easily compensated for by keeping the probe at a
constant temperature slightly above room temperature and characterizing the nonlinearities so that the microprocessor in the
controller can make the appropriate corrections. Regulation is
accomplished by comparing the voltage from the Hall probe
with the reference voltage given by the other part of the controller. When there is a difference between the two voltages, a correction voltage is sent to the magnet power supply which
changes the amount of current flowing through the magnet
windings and hence the magnetic field. Eventually the error
2-22
Basic EPR Practice
voltage drops to zero and the field is “stable” or “locked”. This
occurs at each discrete step of a magnetic field scan.
The Spectrum
2.2.6
We have seen how the individual components of the spectrometer work. Figure 2-19 shows how they work together to produce
a spectrum.
Spectrum
Y-axis (Intensity)
X-axis (B0)
Bridge
Signal
Channel
Cavity
and
Sample
Figure 2-19
Field
Controller
Magnet
Block diagram of an EPR spectrometer.
EMX User’s Manual
2-23
Suggested Reading
Suggested Reading
2.3
This chapter is a brief overview of the basic theory and practice
of EPR spectroscopy. If you would like to learn more, there are
many good books and articles that have been written on these
subjects. We recommend the following:
Instrumentation:
Poole, C. Electron Spin Resonance a Comprehensive Treatise on
Experimental Techniques, Editions 1,2: Interscience
Publishers, New York, (1967), (1983).
Feher, G. Sensitivity Considerations in Microwave Paramagnetic Resonance Absorption Techniques: Bell System
Tech. J. 36, 449 (1957).
Theory:
Knowles, P.F., D. Marsh and H.W.E. Rattle. Magnetic Resonance of Biomolecules: J. Wiley, New York, (1976).
Weil, John A., J.R. Bolton, and Wertz, J.E., Electron Paramagnetic Resonance, Elementary Theory and Practical
Applications: Wiley-Interscience, New York, (1994).
A more extensive bibliography is found in last chapter of this
manual.
2-24