1
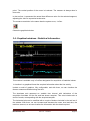
You must keep in mind that the values used in this representation are obtained from
the values in the samples, so it can be considered to an approximation to the reality,
and can have discrepancies with the same information shown in an oscilloscope.
The filters applied to the samples, affect also to this representation, hiding the no
representative samples.
This window can be shown or hidden at user needs.
Also, in this windows exists a toolbar, specially dedicated to manipulate this graphic.
The meaning for each button is:
Increase the Zoom level, decreasing the total amount of time in horizontal axis. Allows
several zoom levels, in sequence 1-2-5.
Opposite to the previous action. Decrease the Zoom level, increasing the total amount
of time in axis.
Synchronize the graphical with the samples acquisition. The last sample shown is the
last sample acquired, and from this instant, the samples are presented at the
acquisition rate.
If possible, center the selected sample in the graphical window. This selection of
sample can be done in the messages list or in this graphical window.
Allows the configuration of the options relevant to the sniffer used. The configuration
window for the sniffer is presented with the graphical page selected
Enables the measurement tool. This state is represented with the button pressed, and
is maintained until a new click in this button occur.
In measure mode it is impossible select any sample.
To measure, we must place the cursor over the start of the segment to measure, and
them with the left button pressed, move the mouse until the cursor is over the end
Management software for PLC Tools
Mod. SN3900 Ver.1
Rev 1.5 - 1/7/2012
Page 11