1
Scripting Guide Release 1 Tecplot, Inc. Bellevue, WA 2013 COPYRIGHT NOTICE Tecplot 360TM Scripting Guide is for use with Tecplot 360TM Version 2013 R1. Copyright © 1988-2013 Tecplot, Inc. All rights reserved worldwide. Except for personal use, this manual may not be reproduced, transmitted, transcribed, stored in a retrieval system, or translated in any form, in whole or in part, without the express written permission of Tecplot, Inc., 3535 Factoria Blvd, Ste. 550; Bellevue, WA 98006 U.S.A. The software discussed in this documentation and the documentation itself are furnished under license for utilization and duplication only according to the license terms. The copyright for the software is held by Tecplot, Inc. Documentation is provided for information only. It is subject to change without notice. It should not be interpreted as a commitment by Tecplot, Inc. Tecplot, Inc. assumes no liability or responsibility for documentation errors or inaccuracies. Tecplot, Inc. Post Office Box 52708 Bellevue, WA 98015-2708 U.S.A. Tel:1.800.763.7005 (within the U.S. or Canada), 00 1 (425)653-1200 (internationally) email: [email protected], [email protected] Questions, comments or concerns regarding this document: [email protected] For more information, visit http://www.tecplot.com THIRD PARTY SOFTWARE COPYRIGHT NOTICES LAPACK 1992-2007 LAPACK Copyright © 1992-2007 the University of Tennessee. All rights reserved. Redistribution and use in source and binary forms, with or without modification, are permitted provided that the following conditions are met: Redistributions of source code must retain the above copyright notice, this list of conditions and the following disclaimer. Redistributions in binary form must reproduce the above copyright notice, this list of conditions and the following disclaimer listed in this cense in the documentation and/or other materials provided with the distribution. Neither the name of the copyright holders nor the names of its contributors may be used to endorse or promote products derived from this software without pecific prior written permission. THIS SOFTWARE IS PROVIDED BY THE COPYRIGHT HOLDERS AND CONTRIBUTORS "AS IS" AND ANY EXPRESS OR IMPLIED WARRANTIES, INCLUDING, BUT NOT LIMITED TO, THE IMPLIED WARRANTIES OF MERCHANTABILITY AND FITNESS FOR A PARTICULAR PURPOSE ARE DISCLAIMED. IN NO EVENT SHALL THE COPYRIGHT OWNER OR CONTRIBUTORS BE LIABLE FOR ANY DIRECT, INDIRECT, INCIDENTAL, SPECIAL, EXEMPLARY, OR CONSEQUENTIAL DAMAGES (INCLUDING, BUT NOT LIMITED TO, PROCUREMENT OF SUBSTITUTE GOODS OR SERVICES; LOSS OF USE, DATA, OR PROFITS; OR BUSINESS INTERRUPTION) HOWEVER CAUSED AND ON ANY THEORY OF LIABILITY, WHETHER IN CONTRACT, STRICT LIABILITY, OR TORT (INCLUDING NEGLIGENCE OR OTHERWISE) ARISING IN ANY WAY OUT OF THE USE OF THIS SOFTWARE, EVEN IF ADVISED OF THE POSSIBILITY OF SUCH DAMAGE. The University of Tennessee. All Rights Reserved. SciPy 2001-2009 Enthought. Inc. All Rights Reserved. NumPy 2005 NumPy Developers. All Rights Reserved. VisTools and VdmTools 1992-2009 Visual Kinematics, Inc. All Rights Reserved. NCSA HDF & HDF5 (Hierarchical Data Format) Software Library and Utilities Contributors: National Center for Supercomputing Applications (NCSA) at the University of Illinois, Fortner Software, Unidata Program Center (netCDF), The Independent JPEG Group (JPEG), Jean-loup Gailly and Mark Adler (gzip), and Digital Equipment Corporation (DEC). Conditions of Redistribution: 1. Redistributions of source code must retain the above copyright notice, this list of conditions, and the following disclaimer. 2. Redistributions in binary form must reproduce the above copyright notice, this list of conditions, and the following disclaimer in the documentation and/or materials provided with the distribution. 3. In addition, redistributions of modified forms of the source or binary code must carry prominent notices stating that the original code was changed and the date of the change. 4. All publications or advertising materials mentioning features or use of this software are asked, but not required, to acknowledge that it was developed by The HDF Group and by the National Center for Supercomputing Applications at the University of Illinois at Urbana-Champaign and credit the contributors. 5. Neither the name of The HDF Group, the name of the University, nor the name of any Contributor may be used to endorse or promote products derived from this software without specific prior written permission from the University, THG, or the Contributor, respectively. DISCLAIMER: THIS SOFTWARE IS PROVIDED BY THE HDF GROUP (THG) AND THE CONTRIBUTORS "AS IS" WITH NO WARRANTY OF ANY KIND, EITHER EXPRESSED OR IMPLIED. In no event shall THG or the Contributors be liable for any damages suffered by the users arising out of the use of this software, even if advised of the possibility of such damage. Copyright © 1998-2006 The Board of Trustees of the University of Illinois, Copyright © 2006-2008 The HDF Group (THG). All Rights Reserved. PNG Reference Library Copyright © 1995, 1996 Guy Eric Schalnat, Group 42, Inc., Copyright © 1996, 1997 Andreas Dilger, Copyright © 1998, 1999 Glenn Randers-Pehrson. All Rights Reserved. Tcl 1989-1994 The Regents of the University of California. Copyright © 1994 The Australian National University. Copyright © 1994-1998 Sun Microsystems, Inc. Copyright © 1998-1999 Scriptics Corporation. All Rights Reserved. bmptopnm 1992 David W. Sanderson. All Rights Reserved. Netpbm 1988 Jef Poskanzer . All Rights Reserved. Mesa 1999-2003 Brian Paul. All Rights Reserved. W3C IPR 1995-1998 World Wide Web Consortium, (Massachusetts Institute of Technology, Institut National de Recherche en Informatique et en Automatique, Keio University). All Rights Reserved. Ppmtopict 1990 Ken Yap. All Rights Reserved. JPEG 1991-1998 Thomas G. Lane. All Rights Reserved. Dirent API for Microsoft Visual Studio (dirent.h) 2006-2006 Copyright © 2006 Toni Ronkko. Permission is hereby granted, free of charge, to any person obtaining a copy of this software and associated documentation files (the ``Software''), to deal in the Software without restriction, including without limitation the rights to use, copy, modify, merge, publish, distribute, sublicense, and/or sell copies of the Software, and to permit persons to whom the Software is furnished to do so. Toni Ronkko. All Rights Reserved. ICU 1995-2009 Copyright © 1995-2009 International Business Machines Corporation and others. All rights reserved. Permission is hereby granted, free of charge, to any person obtaining a copy of this software and associated documentation files (the "Software"), to deal in the Software without restriction, including without limitation the rights to use, copy, modify, merge, publish, distribute, and/or sell copies of the Software, and to permit persons to whom the Software is furnished to do so, provided that the above copyright notice(s) and this permission notice appear in all copies of the Software and that both the above copyright notice(s) and this permission notice appear in supporting documentation. International Business Machines Corporation and others. All Rights Reserved. QsLog 2010 Copyright © 2010, Razvan Petru. All rights reserved. QsLog Copyright (c) 2010, Razvan Petru. All rights reserved. Redistribution and use in source and binary forms, with or without modification, are permitted provided that the following onditions are met: Redistributions of source code must retain the above copyright notice, this list of conditions and the following disclaimer. Redistributions in binary form must reproduce the above copyright notice, this list of conditions and the following disclaimer in the documentation and/or other materials provided with the distribution. The name of the contributors may not be used to endorse or promote products derived from this software without specific prior written permission. THIS SOFTWARE IS PROVIDED BY THE COPYRIGHT HOLDERS AND CONTRIBUTORS "AS IS" AND ANY EXPRESS OR IMPLIED WARRANTIES, INCLUDING, BUT NOT LIMITED TO, THE IMPLIED WARRANTIES OF MERCHANTABILITY AND FITNESS FOR A PARTICULAR PURPOSE ARE DISCLAIMED. IN NO EVENT SHALL THE COPYRIGHT HOLDER OR CONTRIBUTORS BE LIABLE FOR ANY DIRECT, INDIRECT, INCIDENTAL, SPECIAL, EXEMPLARY, OR CONSEQUENTIAL DAMAGES (INCLUDING, BUT NOT LIMITED TO, PROCUREMENT OF SUBSTITUTE GOODS OR SERVICES; LOSS OF USE, DATA, OR PROFITS; OR BUSINESS INTERRUPTION) HOWEVER CAUSED AND ON ANY THEORY OF LIABILITY, WHETHER IN CONTRACT, STRICT LIABILITY, OR TORT (INCLUDING NEGLIGENCE OR OTHERWISE) ARISING IN ANY WAY OUT OF THE USE OF THIS SOFTWARE, EVEN IF ADVISED OF THE POSSIBILITY OF SUCH DAMAGE. Razvan Petru. All Rights Reserved. VTK 1993-2008 Copyright © 1993-2008 Ken Martin, Will Schroeder, Bill Lorenson. All rights reserved. Redistribution and use in source and binary forms, with or without modification, are permitted provided that the following conditions are met: Redistributions of source code must retain the above copyright notice, this list of conditions and the following disclaimer. Redistributions in binary form must reproduce the above copyright notice, this list of conditions and the following disclaimer in the documentation and/or other materials provided with the distribution. Neither name of Ken Martin, Will Schroeder, or Bill Lorensen nor the names of any contributors may be used to endorse or promote products derived from this software without specific prior written permission. THIS SOFTWARE IS PROVIDED BY THE COPYRIGHT HOLDERS AND CONTRIBUTORS ``AS IS'' AND ANY EXPRESS OR IMPLIED WARRANTIES, INCLUDING, BUT NOT LIMITED TO, THE IMPLIED WARRANTIES OF MERCHANTABILITY AND FITNESS FOR A PARTICULAR PURPOSE ARE DISCLAIMED. IN NO EVENT SHALL THE AUTHORS OR CONTRIBUTORS BE LIABLE FOR ANY DIRECT, INDIRECT, INCIDENTAL, SPECIAL, EXEMPLARY, OR CONSEQUENTIAL DAMAGES (INCLUDING, BUT NOT LIMITED TO, PROCUREMENT OF SUBSTITUTE GOODS OR SERVICES; LOSS OF USE, DATA, OR PROFITS; OR BUSINESS INTERRUPTION) HOWEVER CAUSED AND ON ANY THEORY OF LIABILITY, WHETHER IN CONTRACT, STRICT LIABILITY, OR TORT (INCLUDING NEGLIGENCE OR OTHERWISE) ARISING IN ANY WAY OUT OF THE USE OF THIS SOFTWARE, EVEN IF ADVISED OF THE POSSIBILITY OF SUCH DAMAGE. Ken Martin, Will Schroeder, Bill Lorenson. All Rights Reserved. TRADEMARKS Tecplot,® Tecplot 360,TM the Tecplot 360 logo, Preplot,TM Enjoy the View,TM Master the View,TM and FramerTM are registered trademarks or trademarks of Tecplot, Inc. in the United States and other countries. 3D Systems is a registered trademark or trademark of 3D Systems Corporation in the U.S. and/or other countries. Macintosh OS is a registered trademark or trademark of Apple, Incorporated in the U.S. and/or other countries. Reflection-X is a registered trademark or trademark of Attachmate Corporation in the U.S. and/or other countries. EnSight is a registered trademark or trademark of Computation Engineering Internation (CEI), Incorporated in the U.S. and/or other countries. EDEM is a registered trademark or trademark of DEM Solutions Ltd in the U.S. and/or other countries. Exceed 3D, Hummingbird, and Exceed are registered trademarks or trademarks of Hummingbird Limited in the U.S. and/or other countries. Konqueror is a registered trademark or trademark of KDE e.V. in the U.S. and/or other countries. VIP and VDB are registered trademarks or trademarks of Halliburton in the U.S. and/or other countries. ECLIPSE FrontSim is a registered trademark or trademark of Schlumberger Information Solutions (SIS) in the U.S. and/or other countries. Debian is a registered trademark or trademark of Software in the Public Interest, Incorporated in the U.S. and/or other countries. X3D is a registered trademark or trademark of Web3D Consortium in the U.S. and/or other countries. X Window System is a registered trademark or trademark of X Consortium, Incorporated in the U.S. and/or other countries. ANSYS, Fluent and any and all ANSYS, Inc. brand, product, service and feature names, logos and slogans are registered trademarks or trademarks of ANSYS Incorporated or its subsidiaries in the U.S. and/or other countries. PAM-CRASH is a registered trademark or trademark of ESI Group in the U.S. and/or other countries. LS-DYNA is a registered trademark or trademark of Livermore Software Technology Coroporation in the U.S. and/or other countries. MSC/NASTRAN is a registered trademark or trademark of MSC.Software Corporation in the U.S. and/or other countries. NASTRAN is a registered trademark or trademark of National Aeronautics Space Administration in the U.S. and/or other countries. 3DSL is a registered trademark or trademark of StreamSim Technologies, Incorporated in the U.S. and/or other countries. SDRC/IDEAS Universal is a registered trademark or trademark of UGS PLM Solutions Incorporated or its subsidiaries in the U.S. and/or other countries. Star-CCM+ is a registered trademark or trademark of CD-adapco in the U.S. and/or other countries. Reprise License Manager is a registered trademark or trademark of Reprise Software, Inc. in the U.S. and/or other countries. Python is a registered trademark or trademark of Python Software Foundation in the U.S. and/or other countries. Abaqus, the 3DS logo, SIMULIA and CATIA are registered trademarks or trademarks of Dassault Systèmes or its subsidiaries in the U.S. and/or other countries. The Abaqus runtime libraries are a product of Dassault Systèmes Simulia Corp., Providence, RI, USA. © Dassault Systèmes, 2007 FLOW-3D is a registered trademark or trademark of Flow Science, Incorporated in the U.S. and/or other countries. Adobe, Flash, Flash Player, Premier and PostScript are registered trademarks or trademarks of Adobe Systems, Incorporated in the U.S. and/or other countries. AutoCAD and DXF are registered trademarks or trademarks of Autodesk, Incorporated in the U.S. and/or other countries. Ubuntu is a registered trademark or trademark of Canonical Limited in the U.S. and/or other countries. HP, LaserJet and PaintJet are registered trademarks or trademarks of Hewlett-Packard Development Company, Limited Partnership in the U.S. and/or other countries. IBM, RS/6000 and AIX are registered trademarks or trademarks of International Business Machines Corporation in the U.S. and/or other countries. Helvetica Font Family and Times Font Family are registered trademarks or trademarks of Linotype GmbH in the U.S. and/or other countries. Linux is a registered trademark or trademark of Linus Torvalds in the U.S. and/or other countries. ActiveX, Excel, Microsoft, Visual C++, Visual Studio, Windows, Windows Metafile, Windows XP, Windows Vista, Windows 2000 and PowerPoint are registered trademarks or trademarks of Microsoft Corporation in the U.S. and/or other countries. Firefox is a registered trademark or trademark of The Mozilla Foundation in the U.S. and/or other countries. Netscape is a registered trademark or trademark of Netscape Communications Corporation in the U.S. and/or other countries. SUSE is a registered trademark or trademark of Novell, Incorporated in the U.S. and/or other countries. Red Hat is a registered trademark or trademark of Red Hat, Incorporated in the U.S. and/or other countries. SPARC is a registered trademark or trademark of SPARC International, Incorporated in the U.S. and/or other countries. Products bearing SPARC trademarks are based on an architecture developed by Sun Microsystems, Inc. Solaris, Sun and SunRaster are registered trademarks or trademarks of Sun MicroSystems, Incorporated in the U.S. and/or other countries. Courier is a registered trademark or trademark of Monotype Imaging Incorporated in the U.S. and/or other countries. UNIX and Motif are registered trademarks or trademarks of The Open Group in the U.S. and/or other countries. Qt is a registered trademark or trademark of Trolltech in the U.S. and/or other countries. Zlib is a registered trademark or trademark of Jean-loup Gailly and Mark Adler in the U.S. and/or other countries. OpenGL is a registered trademark or trademark of Silicon Graphics, Incorporated in the U.S. and/or other countries. JPEG is a registered trademark or trademark of Thomas G. Lane in the U.S. and/or other countries. SENSOR is a registered trademark or trademark of Coats Engineering in the U.S. and/or other countries. SENSOR is licensed and distributed only by Coats Engineering and by JOA Oil and Gas, a world-wide authorized reseller. MySQL is a registered trademark or trademark of Oracle in the U.S. and/or other countries. MySQL is a trademark of Oracle Corporation and/or its affiliates. All other product names mentioned herein are trademarks or registered trademarks of their respective owners. NOTICE TO U.S. GOVERNMENT END-USERS Use, duplication, or disclosure by the U.S. Government is subject to restrictions as set forth in subparagraphs (a) through (d) of the Commercial Computer-Restricted Rights clause at FAR 52.227-19 when applicable, or in subparagraph (c)(1)(ii) of the Rights in Technical Data and Computer Software clause at DFARS 252.227-7013, and/or in similar or successor clauses in the DOD or NASA FAR Supplement. Contractor/manufacturer is Tecplot, Inc., 3535 Factoria Blvd, Ste. 550; Bellevue, WA 98006 U.S.A. 13-360-07-1 Rev 1/2013 Table of Contents 1 Introduction ...................................................................................................... 5 Tecplot 360 Macro Commands 2 Introduction to Macro Commands ................................................... 9 3 Managing Macros ........................................................................................ 11 Macros vs. Macro Functions vs. Macro Commands.............................................11 Running Macros from the Command Line..............................................................11 Running Macros from the Tecplot 360 Interface ....................................................11 Running Macros from the Quick Macro Panel .......................................................12 4 Writing Forward Compatible Macros ............................................ 13 5 Debugging Macros................................................. 15 6 Macro Command Syntax ....................................................................... 17 7 Macro Variables ............................................................................................ 19 Internal Variables .............................................................................................................19 System Environment Variables ....................................................................................22 Assigning Values to Macro Variables ........................................................................22 Assigning a String to a Macro Variable.....................................................................23 Replacement Text Use .....................................................................................................23 Macro Function Variables ..............................................................................................23 3 Using Formats in Macro Variables .............................................................................24 8 Macro Command Summary ................................................................ 27 9 Macro Commands ....................................................................................... 57 10 Macro Commands for the Analyze Menu ................................ 219 Summary of Analyze Macro Commands...............................................................219 Macro Command Description ...................................................................................220 Parameter Assignment Values ...................................................................................234 11 Parameter Subcommands .................................................................. 235 12 Parameter Assignment Values, Expressions, and Operators ........................................................................................................ 257 Assignment Value Table...............................................................................................257 Assignment Value Expressions .................................................................................266 13 Raw Data ......................................................................................................... 269 14 Macro Language Limitations ............................................................ 273 Python Scripting 15 Using Tecplot 360’s Python Interpreter .................................. 277 Using Python Scripts with Tecplot 360 ...................................................................277 Installation and Setup ...................................................................................................277 16 Python Syntax Rules .............................................................................. 279 Import Modules ..............................................................................................................279 Basic Syntax Rules .........................................................................................................280 Input Types.......................................................................................................................281 Output Types ...................................................................................................................285 Exceptions to the Rules ................................................................................................286 Convenience Functions ................................................................................................286 Tecplot 360 Macro Commands for Python Modules ..........................................290 Notes for Novice Python Users .................................................................................291 Index 4 ...................................................................................................................................... 293 1 Introduction Tecplot 360 is a powerful tool for visualizing a wide range of technical data. It offers line plotting, 2D and 3D surface plots in a variety of formats, and 3D volumetric visualization. The user documentation for Tecplot 360 is divided into nine books: • Scripting Guide (this document) - Provides Macro and Python command syntax and information on working with Macro and Python files and commands. • User’s Manual - Provides a complete description of working with Tecplot 360 features. • Getting Started Manual - New Tecplot 360 users are encouraged to work through the tutorials provided in the Getting Started Manual. The tutorials highlight working with key features in Tecplot 360. • Quick Reference Guide - Provides syntax for zone header files, macro variables, keyboard shortcuts, and more. • Data Format Guide - Provides information on outputting your simulator data into Tecplot 360 file format. • Add-on Developer’s Kit - User’s Manual - Provides instructions and examples for creating add-ons for Tecplot 360. • Add-on Developer’s Kit - Reference Manual - Provides the syntax for the functions included in the kit. • Installation Instructions - Provides detailed instructions on how to install Tecplot 360 on your machine. • Release Notes - Provides information about new and/or updated Tecplot 360 features. 5 There are several methods available to extend or automate Tecplot 360 functionality, including: macros, scripting with Python and developing add-ons. Choose your method based upon your end goal and level of technical experience: ™ Method Macros Python scripting General Usage Common Use Case Limitations automate Tecplot 360 processes batch processing cannot add functionality to Tecplot 360 automate Tecplot 360 processes and extend capabilities fast-fourier transforms not all of Tecplot 360’s functionality is accessible extend Tecplot 360’s capability writing a new data loader requires a compiler and development experience Add-ons Macro processing capabilities are included in your Tecplot 360 distribution. Macro language syntax and usage are provided in Scripting Guide. Macros can be accessed loaded via the Scripting menu and from the Quick Macro Panel (also accessed via the Scripting menu). Your Tecplot 360 installation includes: a Python interpreter along with an interface connection, and a Python library (version 2.7.2), as well as supporting Python files. Information on working with Tecplot 360 and Python is provided in Chapter 30: “Working With Python Scripts” in the User’s Manual. The syntax for the Python commands can be found using the syntax rules provided in Chapter 16: “Python Syntax Rules” along with the ADK Reference Manual. To create add-ons for Tecplot 360, you need to have a compiler for C, C++ or FORTRAN. Refer to the ADK User’s Manual for instructions for creating add-ons, along with sample add-ons. 6 Part 1 Tecplot 360 Macro Commands 2 Introduction to Macro Commands A Tecplot 360 macro is a set of instructions, called macro commands, which perform actions in Tecplot 360. Macro commands can be used to accomplish virtually any task that can be done via the Tecplot 360 interface, offering an easy way to automate Tecplot 360 processes. The only things you can do interactively that cannot be done with macro commands are those actions that have no effect on a final, printed plot (such as resizing the Tecplot 360 process window). To augment this ability, there are macro commands which have no corresponding interactive control, such as looping and conditional commands. These commands typically go hand in hand with the execution of a macro. You can create macros by recording them from the Tecplot 360 interface using the Macro Recorder (accessed via the Scripting>Record Macro menu), or create them from scratch using any ASCII text editor. In most cases, the most effective approach to creating a macro is the following hybrid approach: 1. Run Tecplot 360 and choose to record a macro to a file. Perform tasks similar to those you are trying to capture in the final macro. 2. Close the recording session and examine the macro file. The commands generated by Tecplot 360 should be fairly readable and easy to understand. 3. Make minor modifications to the recorded macro. Typical modifications involve adding loops, adding variables, or adding commands that, for example, prompt the user to enter a file name. One of the main reasons for using the approach above is the large number of commands and permutations of parameters. This manual provides an exhaustive listing of the available macro commands. However, it is often easier to have Tecplot 360 perform the action and record the relevant command than look up individual commands and their required parameters. An important feature of Tecplot 360’s macro command language is its Viewer/Debugger. Often, you will have a well-developed macro that needs some modification. You can use the Debugger to step through the macro to the point where you want the change to be made and then start recording to a new file. Using a text editor, you can insert macro commands from a new file into an existing macro file. 9 10 3 Managing Macros Tecplot 360 macros are stored in files. These files are processed by loading them into Tecplot 360 and running them. 3-1 Macros vs. Macro Functions vs. Macro Commands A Tecplot 360 macro is a file containing one or more macro commands. These files start with the following special comment line to notify Tecplot 360 that what follows is a Tecplot 360 macro: #!MC 1120 Any number of macro commands or comments may follow. Tecplot 360 macro functions are defined in Tecplot 360 macros by using the $!MACROFUNCTION$!ENDMACROFUNCTION commands. Between the $!MACROFUNCTION and $!ENDMACROFUNCTION commands you may use any valid macro command (except $!MACROFUNCTION). When a Tecplot 360 macro is loaded, all macro functions are extracted and the attached commands are not executed until a $!RUNMACROFUNCTION command is encountered. Macro functions may be retained if desired. A retained macro function remains defined in Tecplot 360 even if the macro in which it was defined is replaced by another macro. Retained macro functions may be called by other macros that are loaded at a later time. 3-2 Running Macros from the Command Line A simple way to run a Tecplot 360 macro is to include it in the command line with the -p flag. The following command runs Tecplot 360 and plays a macro called a.mcr: tecplot -p a.mcr If you use the .mcr extension for the macro file name, then the -p flag is optional. If you want to debug the macro, include the -z flag as well. 3-3 Running Macros from the Tecplot 360 Interface You can run a macro file by going to Scripting>Play Macro/Script. A dialog appears; choose the macro to play. 11 If you want to debug a macro file, go to the Scripting menu and select the "View/Debug Macro" option. The Macro Viewer dialog appears so you can load in a macro. When the macro is loaded, Tecplot 360 waits at the first macro command for you to step through the commands. See Section 28 - 3 “Macro Debugging” in the User’s Manual for complete details on how to use the Macro Viewer. 3-4 Running Macros from the Quick Macro Panel Macros that you use frequently or want rapid access to may be defined as macro functions within a special file called tecplot.mcr in either the current directory, your home directory, or the Tecplot 360 home directory. When Tecplot 360 starts it looks for this file in each of those directories in turn. If Tecplot 360 finds the file, it loads the macro definitions and associates functions to buttons on the Quick Macro Panel dialog (in the Scripting menu). You can have Tecplot 360 load your own macro function file by using the qm flag on the command line. The following command runs Tecplot 360 and installs the macro functions in the file myteccmd.mcr into the Quick Macro Panel: tec360 -qm myteccmd.mcr You can have a macro function add a button to the Quick Macro Panel dialog. By default, all macro functions defined in the tecplot.mcr file will add a button to the Quick Macro Panel, those defined elsewhere will not. See the $!MACROFUNCTION...$!ENDMACROFUNCTION command for more information. If the macro file does not contain any function definitions, it will not be loaded into the Quick Macro Panel. If you want Tecplot 360 to display the Quick Macro Panel at starting include the -showpanel flag on the command line. To see an example of a macro function file, look at the file tecplot.mcr located in the examples/mcr subdirectory below the Tecplot 360 home directory. If this file is moved to the Tecplot 360 home directory, the Quick Macro Panel will have options that include 3D Rotation Animation and Reset Center of Rotation. 12 4 Writing Forward Compatible Macros In order to ensure forward compatibility of your macro commands, please keep the following guidelines in mind. These guidelines will allow you to create macros that will work for years, on many machines and platforms. 1. Begin your macro by opening a layout. This will ensure that the final plot is consistent between versions of Tecplot 360 (even if the default style settings for Tecplot 360 have changed). An alternative to using a layout is to load data and then paste a frame style file in each frame. If your macro will be used for more than one layout, you can ensure forward compatibility by: • Using the $!PromptForFileName command. This will allow the user to interactively specify the layout file. -or• Launching Tecplot 360 from the command line, specifying the layout and the macro: tecplot mylayout.lay mydatafile mymacro.mcr 2. Store associated files and graphics in the same folder as the macro file. If your macro loads files or inserts images without allowing the user to choose them, it is a good practice to store them in the same folder as the macro file that uses them. After recording, edit the macro, and replace the path to the file with the intrinsic macro variable |macrofilepath|. Example: $!OpenLayout "|macrofilepath|\Density.lpk" This allows the macro to work without editing in any location as long as the entire folder of files was copied there. 3. Avoid using a $!Pick command in your macro. 13 Changes to the aspect ratio can cause a recorded $!Pick command to fail when the macro is run on another machine or in another version of Tecplot 360. • In a plot with multiple frames, you cannot use $!Pick to change the active frame. Instead, give each frame a meaningful name such as “Full View” and “Zoom Frame” in the layout. Then use the command: $!FrameControl ActivateByName Name = “Full View” to access the frame you want. This will also simplify later changes to the macro. • If you must pick an item, make the pick as precise as possible. For example, clicking on the center, not the edge, of a zone or slice will increase the chances that the pick will be successful when the macro is replayed. When selecting text or geometries while recording a macro, click and drag in the widest possible area around the objects to select. The command will be recorded as $!PICK ADDALLINRECT SELECTTEXT = YES X1 = 1.56075949367 X2 = 3.97088607595 Y1 = 2.29556962025 Y2 = 3.91582278481 The x and y ranges can be expanded if needed. 4. Use plenty of comments in your macro. 14 5 Debugging Macros In general, the best way to debug a macro is to use the Macro Viewer, and find which command is causing the problem. Here are some tips for specific problems: Problem: The macro was created with a previous version of Tecplot 360 to make the plot needed. With a newer version of Tecplot 360, the macro will run without error, but the plot looks different. Solution: Run the macro with the old version of Tecplot 360, then save a frame style to a file. Begin your macro by loading the data, then pasting the frame style from a file. This will ensure that the final plot will be consistent from one version of Tecplot 360 to the next, even if the default style settings for Tecplot 360 have been changed. Problem: The macro gives you errors such as “File does not exist” or “Cannot open file”, but you can locate the file. Solution: Copy the file to the same folder as the macro file that uses the file. Edit the macro, and replace the path to the file with the intrinsic macro variable |macrofilepath|. Example: $!Openlayout "|macrofilepath|\Density.lpk" This allows the macro to work without editing in any location as long as the entire folder of files was copied there. Problem: Running the macro causes unusual error messages, such as: “No objects to cut or the objects selected not allowed to be cut” or “Not allowed to adjust zones or mappings when the mouse mode is set to SELECTOR”. When you run the macro in the Macro Viewer, you see that the problem occurs with when a $!Pick command is run. Solution: Avoid using a $!Pick command in your macro. Changes to the aspect ratio can cause a recorded $!Pick command to fail when the macro is run on another machine or in another version of Tecplot 360. To fix the problem in an existing macro, follow these steps to make the coordinates more precise: 1. Run the macro on the machine where the error message is generated. 15 2. Via the macro viewer or editor, identify the preceding $!PICK CHECKTOADD or similar select type pick command. Note the X,Y coordinates of the command. A good way to do this is: a. Run the macro until you get the “No Objects to Shift” error message. b. Click Ok on the dialog. c. Bring up the macro viewer: Scripting>View/Debug Macro. d. Find the nearest $!PICK CHECKTOADD command above the current command and put a break point on that command. e. Press “Reset” to reset the macro and then run the macro. If the problem only occurs when running in batch mode then try to determine the macro command by examining the batch.log file. f. Insert a $!Pause command in your macro just before the $!Pick Add command that precedes the offending command. Now run Tecplot 360 interactively from the macro viewer. You can then see the line number where you need to put the break. 3. Back in Tecplot 360, select the zoom tool. 4. Hold the shift key down and notice that the running coordinates in the lower right corner now show “PX = xxxxx PY = yyyyyy". xxxxxx and yyyyyy are the paper coordinates of the hot spot of the zoom tool. (If you see X and Y for grid coordinates, or FX and FY for frame coordinates, you need to hold down the Shift key. Pick commands always use paper coordinates.) 5. Move the zoom tool until xxxxx and yyyyy are close to the coordinates noted in step 2. 6. Note where the pick occurred. It is likely the pick occurred some distance away from the actual edge of the object to pick. Move the zoom tool to a “better” location for the pick and note the coordinates. Edit the macro file and replace the old X,Y pick coordinates with those determined in step 6. 16 6 Macro Command Syntax A macro file consists of one or more macro commands. Comments may be inserted anywhere in the file, except within a character string. Comments start with an “#” (octothorp) and extend to the end of the line. The first line of a macro file contains a special comment that identifies the version number of the macro file. For Tecplot 360, this line is: #!MC 1120. A Tecplot 360 macro file has the form: #!MC 1120 <macrocommand> <macrocommand> ... Each macrocommand, in turn, has the form: $!commandname [commandspecificmodifiers] [mandatoryparameters] [optionalparameters] where commandspecificmodifiers These are optional command-specific modifiers. An example of a command that uses this is the $!FIELDMAP command. The $!FIELDMAP command can be followed by a “set.” If it is not followed by a set, the $!FIELDMAP command applies to all enabled zones. A supplied set in this case is used to limit the zones to which the $!FIELDMAP command applies. mandatoryparameters commandparameter commandparameter... optionalparameters commandparameter commandparameter... commandparameter parameterassignment or parametersubcommand. parameterassignment parametername op value. op = or -= or += or *= or /=. parametersubcommand parametername {optionalparameters}. commandname The name of a major command, such as REDRAW. 17 parametername The name of a valid parameter for the previously named major command. For example, the $!REDRAW major command has an optional parameter called DOFULLDRAWING. value number, expression, or enumeratedvalue. number Any valid integer or double value representation. expression Any valid infix notation expression. The entire expression must itself be enclosed in parenthesis. For example (3+5). enumeratedvalue A key word that is unique to the variable being assigned a value. For example, if the variable being assigned a value is a basic color then the enumerated value can be one of the following: BLACK, RED, GREEN, BLUE, CYAN, YELLOW, PURPLE, WHITE, CUSTOM1 through CUSTOM56. Spacing and capitalization for macro commands are, for the most part, not important. The following examples show different ways to enter the same macro command to set the width and height for the custom1 paper: Example 1: $!PAGE PAPERSIZEINFO { CUSTOM1 { WIDTH = 3 } } Example 2: $!PAGE PAPERSIZEINFO {CUSTOM1 {WIDTH = 3} } Example 3: $!PAGE papersizeinfo {custom1 {width = 3}} 18 7 Macro Variables Macro variables are identified by a sequence of characters surrounded by vertical bars (“|”). Some examples are: |myvariable| |loop| |1| |$HOME| Macro variables can be placed anywhere within a macro command. Upper case and lower case characters are treated the same. For example |ABC| and |aBc| represent the same variable. Macro variables will be expanded to their value at the time the macro statement is processed. Example: The following macro commands will result in a rotation of the data about the X-axis by 10 degrees: $!VARSET |a1| = 10 $!ROTATE X ANGLE = |a1| 7-1 Internal Variables The following table lists variables maintained by Tecplot 360 that may be referenced by macro commands. Since these variables are maintaned by Tecplot 360, you cannot assign values to them. For internal variables that represent an attribute of a Tecplot 360 object of which Tecplot 360 supports multiple instances (such as a frame, a dataset, or a zone), the variable by default refers to the current or active instance: for example, to the active frame if the variable refers to an attribute of frames. If there is no obvious default instance, the variable name by itself usually refers to the first instance. For such variables, you may specify the desired instance of the referenced type of object by enclosing an index in square brackets immediately following the variable name. For example, |AUXZONE[3]:BC| refers to the zone auxiliary data named BC in the third zone. 19 In most cases, the index may also be written as ACTIVEOFFSET=n to specify the nth active instance of an object type. For example, |ENDSLICEPOS[ACTIVEOFFSET=2]| refers to the end position of the second active slice group. Variables Notes |AUXDATASET:Auxname| Retrieves auxiliary data named Auxname from a dataset For example, |AUXDATASET:Reynolds| retrieves auxiliary data “Reynolds”. |AUXFRAME:Auxname| Retrieves auxiliary data named Auxname from a frame. For example, |AUXFRAME:MyFrame| retrieves auxiliary data “MyFrame” from the active frame. |AUXZONE:Auxname| Retrieves auxiliary data named Auxname from a specific zone. For example, |AUXZONE[3]:BC| retrieves auxiliary data "BC" from zone 3. |AXISMAXn| Maximum value of the n-axis range, where n is one of: Aa, R, X, Y or Z. |AXISMINn| Minimum value of the n-axis range, where n is one of: Aa, R, X, Y or Z. |BYTEORDERING| Returns the byte ordering (INTEL or MOTOROLA). |DATASETFNAME| Returns the dataset file name. |DATASETTITLE| Returns the title of the dataset, or “No Data Set” if a dataset does not exist. |DATE| Returns the date in the form of dd Mmm yyyy. |ENDSLICEPOS| Returns the position of the end slice. |EXPORTISRECORDING| Returns YES/NO to help macros complete record commands in the proper order. |FRAMENAME| Returns the name of the active frame. |INBATCHMODE| Returns 1 if in batch mode, 0 if in interactive mode. |ISDATASETAVAILABLE| Returns 1 if a dataset exists, and 0 otherwise. |ISOSURFACELEVEL| Returns the current iso-surface’s iso-value. |LAYOUTFNAME| Returns the current layout file name. |LOOP| Innermost loop counter. |MACROFILEPATH| Returns the path to the directory containing the most recently opened macro file. |MAXB| Maximum value of the blanking variable. |MAXC| Maximum value of the contour variable. |MAXI|, |MAXJ|, |MAXK| [I, J or K]-dimension of the first active zone (2D or 3D Cartesian plots only). For finite element zones, MAXI returns the total number of nodes, MAXJ returns the total number of elements and MAXK returns the number of nodes per face (cell-based) or total number of faces (face-based). |MAXn| Maximum value of the variable assigned to the n-axis, where n is one of: Aa, R, X, Y, or Z. |MAXS| Maximum value of the scatter sizing variable in the active zones. |MAXU|, |MAXV|, |MAXW| Maximum value of the variable assigned to the [X, Y, Z]-vector component of the active zones. |MAXVAR[nnn]| Maximum value of the variable nnn. 20 Internal Variables Variables Notes |MINB| Minimum value of the blanking variable. |MINC| Minimum value of the contour variable. |MINS| Minimum value of the scatter sizing variable for the active zones. |MINU|, |MINV|, |MINW| Minimum value of the variable assigned to the [X, Y, Z]-vector component for the active zones. |MINVAR[nnn]| Minimum value of the variable nnn. |MINn| Minimum value of the variable assigned to the n-axis, where n is one of: Aa, R, X, Y, or Z. |NUMFRAMES| Number of frames. |NUMFIELDMAPS| Number of fieldmaps assigned to the active frame. |NUMLINEMAPS| Number of linemaps assigned to the active frame. |NUMPROCESSORSUSED| Number of processors that Tecplot 360 uses. This may differ from the total number in the machine if the $!Limits MaxAvailableProcessors configures usage differently. By default, Tecplot 360 uses all available processors in the machine. |NUMVARS| Number of variables in the current dataset. |NUMZONES| Number of zones in the current dataset. |OPSYS| Returns 1=UNIX/Linux/Macintosh, 2=Windows. |PAPERHEIGHT| The height of the paper (in inches). |PAPERSIZE| The size of the paper (e.g. Letter or A4). |PAPERWIDTH| The width of the paper (in inches). |PLATFORMNAME| Returns the type of platform (e.g. SGI or Windows). |PLOTTYPE| Returns the plot type of a frame. 0 = Sketch, 1 = XY Line, 2 = 2D, 3 = 3D, 4 = Polar Line. |PRINTFNAME| Returns the file name of the last file sent for printing. |SLICEPLANETYPE| Plane type to which slices are assigned. |SOLUTIONTIME| The current solution time for the specified zone, fieldmap, or linemap. |STARTSLICEPOS| Position of the first slice in a group. |STREAMSTARTPOS|[nnn] Indicates the starting position in X, Y, Z coordinates of streamtrace number nnn. For example, to indicate the starting position of the first streamtrace, use |STREAMSTARTPOS[1]|. |STREAMTYPE| Returns streamtrace type, such as “Surface Line” or “Surface Ribbon”. |TECHOME| Path to the home directory. |TECPLOTVERSION| The version number of the Tecplot product. |TIME| The current time in the form of hh:mm:ss. |VARNAME| The name of a variable specified by index. 21 Variables Notes |ZONEMESHCOLOR[nnn] | Returns the color of the mesh for zone nnn. |ZONENAME[nnn]| Returns the name of zone nnn. a. where A represents the theta (or angle) axis variable in Polar Line plots. 7-2 System Environment Variables System environment variables can be accessed directly from within Tecplot 360 by preceding an environment variable name with a “$” and surrounding it with vertical bars (“|”). Using environment variables within Tecplot 360 adds another degree of flexibility to macros by taking advantage of each user’s customized environment. If an environment variable is missing, an error is generated and macro processing is terminated. 7 - 2.1 Example 1 To compare a macro variable with an environment variable: $!IF |SESSION_COEFF| == |$DEFAULT_COEFF| # (perform some default processing here) $!ENDIF Where the DEFAULT_COEFF environment variable was set to some specified value of type double before starting Tecplot 360. 7 - 2.2 Example 2 To create a string from an environment variable: User Defined Variables $!VARSET |AUTHOR| = "Author: |$LOGNAME|" User-defined variables are written using the macro variable name surrounded by vertical bars (“|”). The variable name can be up to 32 characters in length. If a macro variable is defined (using the $!VARSET command) and it is named the same as an existing internal macro variable, then the user-defined variable takes precedence and the internal value is not effected. The internal macro variable can be recovered if you remove the user-defined variable using $!REMOVEVAR. 7-3 Assigning Values to Macro Variables The $!VARSET command is used to assign a value to a macro variable. The $!VARSET command has the following syntax: $!VARSET <macrovar> <op> <double> where <op> can be one of =, -=, +=, *=, or /=. 22 Assigning a String to a Macro Variable Examples: Example 1: Add 2 to the macro variable |ABC|: $!VARSET |ABC| += 2 Example 2: Set |ABC| to be equal to 37: $!VARSET |ABC| = 37 Example 3: Multiply |ABC| by 1.5: $!VARSET |ABC| *= 1.5 7-4 Assigning a String to a Macro Variable Macro variables can be assigned to strings as well as to values. When using strings, only the “=” operator may be used. Example: Assign the string “myfile.plt” to the variable |FNAME|. Use |FNAME| in the $!READDATASET command: $!VARSET |FNAME| = "myfile.plt" $!READDATASET "|FNAME|" Note that double quotes (") had to be used in the $!READDATASET command even though |FNAME| represents a string. 7-5 Replacement Text Use You can assign replacement text to a macro variable. This is useful for handling cases where a macro variable may not be initialized. A macro variable with |AAAA:=XXXXX| will produce XXXXX if AAAA is not defined. This does not work with intrinsic variables. Example: Read in a data file assigned to the variable FNAME. If FNAME is unassigned, read in "t.dat": $!READDATASET "|FNAME:=t.dat|" "|FNAME:=t.dat|" 7-6 Macro Function Variables Macro function variables are written using a number n, surrounded by vertical bars (“|”). The number represents the nth parameter from the $!RUNMACROFUNCTION command. 23 Examples: Example 1: The following commands define a macro function that uses two parameters and a command to run the macro function. The first parameter to the macro function is the amount to rotate about the X-axis and the second parameter is the amount to rotate about the Y-axis: The command to run the macro function will cause a rotation of 10 degrees about the X-axis and 20 degrees about the Y-axis. #!MC 1120 $!MACROFUNCTION NAME = "3D Rotation Animation" $!EXPORTSETUP EXPORTFORMAT = AVI $!EXPORTSETUP IMAGEWIDTH = 546 $!EXPORTSETUP EXPORTFNAME = "|1|AxisRotation.avi" $!EXPORTSTART $!LOOP |2| $!ROTATE3DVIEW PSI ANGLE = |3| $!REDRAW $!EXPORTNEXTFRAME $!ENDLOOP $!EXPORTFINISH $!ENDMACROFUNCTION $!RUNMACROFUNCTION "3D Rotation Animation" ("Theta", 6, 30) Example 2: The following commands define a macro function that opens two layout files: $!MACROFUNCTION NAME = "OL2" $!OPENLAYOUT "|1|" $!OPENLAYOUT "|2|" APPEND = TRUE $!ENDMACROFUNCTION . . . $!RUNMACROFUNCTION "OL2" ("g1.lay","g2.lay") 7-7 Using Formats in Macro Variables When a macro variable is expanded and the macro variable is a numeric value, it is expanded using a “best float” format. It tries to make the number look as simple as possible while still retaining as much accuracy as possible. If you want the number to be formatted in a specific way then you can include C-style number formatting strings in the macro variable specification. The syntax for including a format string is: |macrovariable%formatstring| The following formats are available: • s - string of characters • d - signed integer • e - scientific notation with a lowercase “e” • E - scientific notation with an uppercase “E” 24 Using Formats in Macro Variables • f - floating point • g - use %e or %f, whichever is shorter • G - use %E or %f, whichever is shorter • u - unsigned integer, written out in decimal format • o - unsigned integer, written out in octal format • x - unsigned integer, written out in hexadecimal (where a - f are lowercase) • X- unsigned integer, written out in hexadecimal (where A - F are uppercase) Example 1: Suppose you want to pause a macro and display the message "Maximum contour value is: where xxxxxx only has two digits to the right of the decimal place. You would use: xxxxxx" $!Pause "Maximum contour value is: |MAXC%.2f|" If |MAXC| currently has a value of 356.84206 then the dialog would show: "Maximum contour value is: 356.84" Example 2: If, in the above example, you wanted to use exponential format you could use: $!Pause "Maximum contour value is: |MAXC%12.6e|" Here the result would be: "Maximum contour value is: 3.568421e+02" 25 26 8 Macro Command Summary This chapter presents a brief list of the major macro commands in Tecplot 360. All major macro commands are preceded by “$!” (dollar sign, exclamation mark). $!ACTIVEFIELDMAPS.........................................................................................................................................57 A SetValue command that changes the set of active field maps (thus changing the active zones) considered for plotting. $!ACTIVELINEMAPS ...........................................................................................................................................58 A SetValue command that changes the set of line mappings considered for plotting. $!ADDMACROPANELTITLE..............................................................................................................................58 Add a title to the Quick Macro Panel. $!ALTERDATA........................................................................................................................................................58 The ALTERDATA function operates on a data set within Tecplot 360 using FORTRAN-like equations. See Section 21 - 1 “Data Alteration through Equations” in the User’s Manual for more information on using equations in Tecplot 360. The <zonelist> parameter specifies the set of zones on which to operate, where zonelist is a list of zones or zone ranges separated by a comma (“,”). Zone ranges are separated by a hyphen (“-”). If <zonelist> is omitted, all zones are affected. NOTE: the values for the <zonelist> parameter must be enclosed in square brackets. (For example, use $!ALTERDATA [1,3] to apply ALTERDATA to zones 1 and 3). $!ANIMATECONTOURLEVELS........................................................................................................................60 Produce an animation of a contour line plot by showing a single level at a time. The animation varies according to the currently defined contour levels and is limited by the values in the START, END, and SKIP parameters. To create a movie file, add $!EXPORTSETUP commands before this command. 27 $!ANIMATEIJKBLANKING................................................................................................................................ 61 Produce an animation of different IJK-blankings in your plot. The animation starts at one IJK-blanking setting and marches through intermediate steps to a second setting. To create a movie file, add $!EXPORTSETUP commands before this command. $!ANIMATEIJKPLANES ...................................................................................................................................... 62 Produce an animation that cycles through I-, J-, or K-planes in an IJK-ordered data set. To create a movie file, add $!EXPORTSETUP commands before this command. $!ANIMATEISOSURFACES................................................................................................................................ 63 The macro command $!ANIMATEISOSURFACES produces an animation of a series of iso-surfaces beginning with the iso-surface defined by STARTVALUE and ending with the iso-surface defined by ENDVALUE. To create a movie file, add $!EXPORTSETUP commands before this command. $!ANIMATELINEMAPS....................................................................................................................................... 64 Produce an animation of one Line-mapping at a time. To create a movie file, add $!EXPORTSETUP commands before this command. $!ANIMATESLICES .............................................................................................................................................. 65 The macro command $!ANIMATESLICES uses the currently defined start and end slice position. Use $!SLICEATTRIBUTES to set these positions; $!ANIMATESLICES then redefines how many intermediate slices are to be used, then animates a sub-set of those slices. To create a movie file, add $!EXPORTSETUP commands before this command. $!ANIMATESTREAM ........................................................................................................................................... 66 Produce an animation of stream markers or dashes, moving along the currently defined streamtrace paths. To create a movie file, add $!EXPORTSETUP commands before this command. $!ANIMATETIME.................................................................................................................................................. 66 Produce an animation of transient data. To create a movie file, add $!EXPORTSETUP commands before this command. $!ANIMATEZONES .............................................................................................................................................. 67 Produce an animation showing one zone at a time. To create a movie file, add $!EXPORTSETUP commands before this command. This command will not work if the active frame contains a transient data set. $!ATTACHDATASET ............................................................................................................................................ 68 Attach the active frame to the data set of another frame. Use PAGENUM, if the other frame is on a difference page. This command is usually found only in layout files generated by Tecplot 360. Note that the $!PLOTTYPE command automatically executes an $!ATTACHDATASET command if a frame mode is requested in a frame that does not have an attached data set. Tecplot 360 attaches the data set from the closest frame (in drawing order) having an attached data set. $!ATTACHGEOM .................................................................................................................................................. 69 Attach a geometry to the active frame. 28 $!ATTACHTEXT .....................................................................................................................................................71 Attach text to the active frame $!BASICCOLOR .....................................................................................................................................................73 A SetValue command that sets the red, green and blue components for any of the basic colors in Tecplot 360. $!BASICCOLORLEGEND....................................................................................................................................74 A SetValue command that allows you to create and set the style of a legend for the basic colors in Tecplot 360. The legend can be used to display any attribute of the plot represented by a basic color (for example, materials). Each frame maintains a mapping of basic colors to names. Each basic color actually used in selected layers of the plot appears in the legend unless it is excluded. $!BASICSIZE...........................................................................................................................................................76 A SetValue command that sets sizes of various objects like line thicknesses, line pattern length, font height, and so forth. Sizes can be assigned when interacting with Tecplot 360 by either entering an exact value or by choosing from a preset list of values. The $!BASICSIZE command allows you to change the values in the preset lists. $!BLANKING..........................................................................................................................................................77 A SetValue command that changes settings for IJK- or value-blanking. $!BRANCHCONNECTIVITY..............................................................................................................................79 For zones where connectivity is shared, this command allows for branching of connectivity information from the specified zone. $!BRANCHFIELDDATAVAR...............................................................................................................................80 Allows for branching of specified variable in the specified zone for zones that share variables. $!BREAK ..................................................................................................................................................................80 Jump out of the current $!LOOP-ENDLOOP or $!WHILE-$!ENDWHILE. $!COLORMAPCONTROL [<groupnumber>] [Required-Control Option] ................................................80 The different commands in the COLORMAPCONTROL compound function family are described separately in the following sections. Group number is an optional parameter ranging from 1 to 8, which defaults to 1 when omitted. $!COLORMAPCONTROL [<groupnumber>] REDISTRIBUTECONTROLPOINTS ..............................81 Redistribute the control points for the currently active color map so they are evenly spaced across the color map. This is equivalent to clicking Redistribute Control Points in the Color Map dialog. This does not change the RGB values assigned at each control point. Group number is an optional parameter ranging from 1 to 8, which defaults to 1 when omitted. 29 $!COLORMAPCONTROL [<groupnumber>] COPYSTANDARD .............................................................. 81 Preset either the user-defined color map or the raw user-defined color map to be a copy of one of the standard color maps. Tecplot 360 must currently be using either the user-defined color map or the raw userdefined color map in order to use this function. Group number is an optional parameter ranging from 1 to 8, which defaults to 1 when omitted. $!COLORMAPCONTROL [<groupnumber>] RESETTOFACTORY ........................................................... 81 Redistribute the control points and reset the RGB values for the currently active color map. This is equivalent to clicking Reset on the Color Map dialog. Group number is an optional parameter ranging from 1 to 8, which defaults to 1 when omitted. $!COMPATIBILITY ............................................................................................................................................... 81 Allow datasharing access and setting, without warning. $!CONTINUE.......................................................................................................................................................... 82 Transfer control back to nearest $!LOOP or $!WHILE. $!CONTOURLABELS [Required-Control Option] ......................................................................................... 82 The different commands in the CONTOURLABELS compound function family are described separately in the following sections. $!CONTOURLABELS ADD................................................................................................................................. 82 Add contour labels to your plot. $!CONTOURLABELS DELETEALL................................................................................................................... 83 Delete all currently defined contour labels. $!CONTOURLEVELS [Required-Control Option] ......................................................................................... 83 The different commands in the CONTOURLEVELS compound function family are described separately in the following sections. $!CONTOURLEVELS ADD................................................................................................................................. 84 Add a new set of contour levels to the existing set of contour levels. $!CONTOURLEVELS DELETENEAREST........................................................................................................ 84 Delete the contour level whose value is nearest the value supplied in the RANGEMIN parameter. $!CONTOURLEVELS DELETERANGE............................................................................................................ 85 Delete all contour levels between a minimum and maximum contour value (inclusive). $!CONTOURLEVELS NEW................................................................................................................................. 85 Replace the current set of contour levels with a new set. 30 $!CONTOURLEVELS RESET..............................................................................................................................86 Reset the contour levels to a set of evenly distributed values spanning the entire range of the currently selected contouring variable. $!CONTOURLEVELS RESETTONICE..............................................................................................................86 Reset the contour levels to a set of evenly distributed, nice values spanning the entire range of the currently selected contouring variable, with a specified number of entries. $!CREATECIRCULARZONE ...............................................................................................................................87 Create a circular (or cylindrical) IJ- or IJK-ordered zone. $!CREATEBOUNDARYZONES ..........................................................................................................................87 When YES, boundary zones are created. Use this command when working with StarCCM data to preserve backward compatibility. (StarCCM Loader ONLY) $!CREATECONTOURLINEZONES ...................................................................................................................88 Create zones from the currently-defined contour lines. One zone can be created from each contour level in that plot, or one zone for every polyline can be generated. $!CREATEFEBOUNDARY....................................................................................................................................89 Zone edges for finite element data cannot be turned on or off using the edge plot layer in Tecplot 360. You can, however, create a separate zone which is the boundary of a finite element zone. This new zone can then be turned on or off. $!CREATEFESURFACEFROMIORDERED ......................................................................................................89 A FE-Surface zone can be generated from two or more I-Ordered zones. To get the best possible output, it is recommended that the source zones should have their nodes arranged in a similar manner so that the connecting lines between points are as straightforward as possible. For this reason, indices from source zones should increase in the same direction. $!CREATEISOZONES ...........................................................................................................................................90 Create zones from the currently defined iso-surfaces. One zone will be created from each defined iso-surface. The iso-surfaces must be active and you must have at least one active volume zone. $!CREATELINEMAP .............................................................................................................................................90 Create a new Line-mapping. $!CREATEMIRRORZONES.................................................................................................................................90 Create new zones that are mirror images of the source zones $!CREATENEWFRAME ........................................................................................................................................91 Creates a new frame. 31 $!CREATERECTANGULARZONE..................................................................................................................... 91 Create a rectangular zone. If no data set exists when this command is executed, a data set is created with variables X, Y (and Z, if KMax > 1). If a data set exists prior to this command, the non-coordinate variables for the zone created are initialized to zero. $!CREATESIMPLEZONE ..................................................................................................................................... 92 Create a new zone by specifying only a list of XY-pairs of data. If other zones exist prior to using this function and there are more than 2 variables, then the additional variables are also created and set to zero. $!CREATESLICEZONEFROMPLANE............................................................................................................... 93 Create a new zone as a slice through existing 3D volume zones. Use $!GLOBALTHREED to define the slicing plane orientation. $!CREATESLICEZONES ...................................................................................................................................... 94 Create a new zone for each slice defined on the Slice Details dialog. Only creates slices from volume zones. $!CREATESPHERICALZONE ............................................................................................................................. 94 Create a spherical IJK-ordered zone. $!CREATESTREAMZONES................................................................................................................................. 95 Create one or more zones out of the currently defined streamtraces. The new zones have the same number of variables per data point as the other zones in the data set with all non-coordinate variables interpolated at the positions along the streamtrace. $!DATASETUP........................................................................................................................................................ 95 A SetValue command that sets miscellaneous parameters related to data. $!DEFAULTGEOM ................................................................................................................................................ 96 A SetValue command that sets the attributes for the default geometry. When a geometry is created interactively, its color, line thickness, and so forth, are preset based on the default geometry. This command is usually used only in the Tecplot 360 configuration file. $!DEFAULTTEXT ................................................................................................................................................... 97 A SetValue command that sets the attributes for the default text. When text is added to a plot interactively, its font, color, size, and so forth, are based on the default text. This command is usually used only in the Tecplot 360 configuration file. $!DELAY................................................................................................................................................................... 98 Delay Tecplot 360 execution for <integer> seconds. $!DELETEAUXDATA ............................................................................................................................................ 98 Delete Auxiliary Data in the form of name/value pairs from zones, frames or datasets. 32 $!DELETELINEMAPS ...........................................................................................................................................99 Delete one or more Line-mappings. If <set> is omitted then all Line-mappings are deleted. $!DELETEVARS......................................................................................................................................................99 Delete one or more variables. $!DELETEZONES...................................................................................................................................................99 Delete one or more zones. $!DOUBLEBUFFER [Required-Control Option] ...........................................................................................100 The different commands in the DOUBLEBUFFER compound function family are described separately in the following sections. $!DOUBLEBUFFER OFF.....................................................................................................................................100 Turn off double buffering; use this command once at the end of a sequence of using the double buffer. $!DOUBLEBUFFER ON ......................................................................................................................................100 Turn on double buffering; use this command once at the beginning of a sequence of using the double buffer. While double buffering is turned on all drawing is sent to the back buffer. $!DOUBLEBUFFER SWAP .................................................................................................................................100 Swap the back buffer to the front. In other words, copy the image in the back buffer to the front. $!DRAWGRAPHICS............................................................................................................................................101 Turn on or off all graphics drawing. Turning off all graphics during preliminary portions of a macro file can greatly increase the efficiency of the macro. $!DROPDIALOG .................................................................................................................................................101 Drop a Tecplot 360 interface dialog. This command is mainly useful for the Tecplot 360 demo. To launch a dialog use $!LAUNCHDIALOG. $!DUPLICATELINEMAP....................................................................................................................................101 Copy attributes from an existing Line-mapping to another. $!DUPLICATEZONE ...........................................................................................................................................101 Make a copy of an existing zone. You can assign index ranges to create a new zone which is a subset of the source zone. $!ELSE.....................................................................................................................................................................102 Conditionally handle macro commands. Used when an $!IF statement is FALSE. $!ELSEIF .................................................................................................................................................................103 Conditionally handle macro commands. Used to create multiple options for statements should an $!IF statement be FALSE. 33 $!EXPORT .............................................................................................................................................................. 104 Export an image file from Tecplot 360. See the $!EXPORTSETUP command for details on setting up the exported image type. The $!EXPORT command is not valid for animation formats. $!EXPORTCANCEL ............................................................................................................................................. 104 Cancel out of the current export animation sequence. The animation file being generated is removed. $!EXPORTFINISH................................................................................................................................................ 104 Signals the completion of an animation sequence and causes the animation file to be created. You must call $!EXPORTSTART prior to using $!EXPORTFINISH. This command is only valid for animation formats. You may use the |EXPORTISRECORDING| intrinsic variable to make sure that an animation sequence has been initiated. $!EXPORTNEXTFRAME .................................................................................................................................... 105 Records the next frame of an animation. You must call $!EXPORTSTART prior to calling $!EXPORTNEXTFRAME. This command is only valid for animation formats. You may use the |EXPORTISRECORDING| intrinsic variable to make sure that an animation sequence has been initiated.) $!EXPORTSETUP ................................................................................................................................................. 105 A SetValue command that sets the attributes for exporting image files from Tecplot 360. Exporting is usually intended as a means to transfer images from Tecplot 360 to be imported by other applications. See $!PRINTSETUP and $!PRINT for generating output intended for printers and plotters. $!EXPORTSTART ................................................................................................................................................. 106 Signals the start of an animation sequence and records the first frame of the animation. This command is only valid for animation formats. $!EXTENDEDCOMMAND................................................................................................................................ 107 Send a command to an add-on. The add-on registers the name of a function that will be called when an $!EXTENDEDCOMMAND is processed. Tecplot 360 knows which registered function to call based on the COMMANDPROCESSORID string. See the function TecUtilMacroExtCommandCallback in the ADK Reference Manual. $!EXTRACTFROMGEOM.................................................................................................................................. 107 Extract data from a 2- or 3D field plot. The locations at which to extract the data come from a polyline geometry that must be picked prior to issuing this command. $!EXTRACTFROMPOLYLINE .......................................................................................................................... 108 Extract data from a 2- or 3D field plot. The locations of where to extract the data from come from a supplied polyline in the form of <xyzrawdata>. $!FIELDLAYERS ................................................................................................................................................... 109 A SetValue command that turns field plot layers on or off, or sets the 2D draw order. 34 $!FIELDMAP .........................................................................................................................................................109 A SetValue command that assigns zone attributes for field plots. The <set> parameter immediately following the $!FIELDMAP command is optional. If <set> is omitted then the assignment is applied to all zones. Otherwise the assignment is applied only to the zones specified in <set>. $!FILECONFIG .....................................................................................................................................................112 A SetValue command that sets file path information in Tecplot 360. $!FONTADJUST ...................................................................................................................................................115 A SetValue command that sets character spacing and sizing for fonts in Tecplot 360. These parameters rarely change. $!FOURIERTRANSFORM .................................................................................................................................115 Performs a Fourier transform for each dependent variable for each source zone. A new zone containing the resulting frequency, amplitude, and phase variables (three for each dependent variable) is created for each source zone. If the independent variable is non-uniform, the resulting frequency is a modification of the original data (see discussion below for the INDEPENDENTVAR and OBEYSOURCEZONEBLANKING parameters). Resulting zones are assigned new time strands using the same groupings as the source zones if they belong to time stands; otherwise, the resulting zones are static. Fourier transform result zones are named "Fourier Transform" followed by a mixture of text indicating the source zone, independent variable, and window function used. Similarly, the three variables created are given the names "Frequency", "Amplitude", and "Phase" followed by the dependent variable used. Newlycreated zones are assigned passive variables for all variables that previously existed in the data set, and all previously-existing zones are assigned passive variables for all new variables created by the Fourier transform. Perform a Fourier transform on variables 2 through 11 of zones 1 through 10 obeying source zone blanking, applying the Hann window function and excluding conjugates from the output. $!FRAMECONTROL [Required Control Option] .........................................................................................116 The different commands in the FRAMECONTROL compound function family are described separately in the following sections. When working with the FRAMECONTROL commands, it may help to realize that a command containing "Activate" changes the active frame; a command containing "MoveTo" changes the frame drawing order. $!FRAMECONTROL ACTIVATETOP.............................................................................................................117 Changes the active frame to the frame that is topmost in the frame drawing order. $!FRAMECONTROL ACTIVATENEXT ..........................................................................................................117 Changes the active frame to the next one up in the frame drawing order, or to the bottom frame if the active frame is at the top. $!FRAMECONTROL ACTIVATEPREVIOUS ................................................................................................117 Changes the active frame to the next one down in the frame drawing order, or to the top frame if the active frame is at the bottom. 35 $!FRAMECONTROL ACTIVATEATPOSITION ........................................................................................... 117 Activates the topmost frame at the specified position. X and Y are in paper coordinates. $!FRAMECONTROL ACTIVATEBYNAME ................................................................................................... 118 Changes the active frame to the specified frame. If no frame name is given, this will activate the bottom frame. $!FRAMECONTROL ACTIVATEBYNUMBER.............................................................................................. 118 Changes the active frame to the specified frame. $!FRAMECONTROL MOVETOTOPACTIVE ............................................................................................... 118 Moves the active frame to the top of the drawing order. $!FRAMECONTROL MOVETOTOPBYNAME ............................................................................................ 119 Moves the frame specified by name to the top of the frame drawing order. $!FRAMECONTROL MOVETOTOPBYNUMBER ....................................................................................... 119 Moves the frame specified by number to the top of the frame drawing order. If no frame number is specified, this command will move the bottom frame to the top of the frame drawing order. $!FRAMECONTROL MOVETOBOTTOMACTIVE..................................................................................... 119 Moves the active frame to the top of the frame drawing order. $!FRAMECONTROL MOVETOBOTTOMBYNAME .................................................................................. 119 Moves the frame specified by name to the bottom of the frame drawing order. $!FRAMECONTROL MOVETOBOTTOMBYNUMBER............................................................................. 120 Moves the frame specified by number to the bottom of the frame drawing order. $!FRAMECONTROL DELETEACTIVE .......................................................................................................... 120 Delete the active frame. $!FRAMECONTROL FITALLTOPAPER ......................................................................................................... 120 Resize all frames so that they fit inside the hardclip limits of the paper. $!FRAMELAYOUT............................................................................................................................................... 120 A SetValue command that sets the position, border, and background attributes for the active frame. Use the $!FRAMECONTROL action command to push and pop frames if you want to change the settings for a frame other than the active frame. $!FRAMENAME................................................................................................................................................... 121 Set the name for the active frame (Default = "Frame001"). 36 $!FRAMESETUP...................................................................................................................................................121 A SetValue command that sets parameters used to preset dynamic frame attributes when a frame is initialized. $!GETAUXDATA ..................................................................................................................................................123 Retrieve Auxiliary Data in the form of name/value pairs and save it to the macro variable. $!GETCONNECTIVITYREFCOUNT...............................................................................................................123 Fetch the count of how many zones share connectivity with the specified zone. Count includes specified zone. $!GETCURFRAMENAME..................................................................................................................................124 Query Tecplot 360 for the name of the active frame. The <macrovar> represents the macro variable to receive the results. $!GETFIELDVALUE ............................................................................................................................................124 Fetch the field value (data set value) at the specified point index and assign the value to <macrovar>. If the zone referenced is IJ- or IJK-ordered, then the point index is calculated by treating the 2- or 3Dimensional array as a 1-D array. $!GETFIELDVALUEREFCOUNT......................................................................................................................124 Get the count of how many zones share the indicated variable with the specified zone. Count includes the specified zone. $!GETNODEINDEX ............................................................................................................................................125 This function only works for finite-element zones. Query for the node index in the specified location as described by the ZONE, ELEMENT, and CORNER parameters. $!GETVARLOCATION .......................................................................................................................................126 Returns the location of the variable in the zone as either CELLCENTERED or NODAL and saves in the macro variable. $!GETVARNUMBYNAME.................................................................................................................................126 Given a variable name, get the number for that variable. This variable number can then be used to assign attributes, such as what variable to use for contouring. $!GETZONETYPE ................................................................................................................................................126 Query for the zone type of the specified zone. The zone type will be assigned to <macrovar>. $!GLOBALCOLORMAP.....................................................................................................................................127 A SetValue command that changes the settings for the global contour color map and the global light source shading color map in Tecplot 360. Changes here affect all frames using these color maps. See $!GLOBALCONTOUR COLORMAPFILTER for additional settings that can be applied on a frame-byframe basis. 37 $!GLOBALCONTOUR........................................................................................................................................ 128 A SetValue command that changes global attributes associated with contour plots or contour levels. The optional parameter <contourgroup> refers to the defined contour groups, 1-8, allowed in Tecplot 360, and takes an integer value of one through eight. The <contourgroup> parameter is optional, and if omitted, Tecplot 360 will use contour group 1. If you would like the settings in these commands to persist, add them to your tecplot.cfg file, located in your installation directory. The NUMBERFORMAT setting for LABELS also controls the number format in the legend. $!GLOBALEDGE.................................................................................................................................................. 131 A SetValue command that sets attributes which sets the minimum crease angle for edges. $!GLOBALFRAME .............................................................................................................................................. 131 A SetValue command that sets attributes which apply to all frames. If you would like the settings in this command to persist, add it to your tecplot.cfg file, located in your installation directory. $!GLOBALLINEPLOT ........................................................................................................................................ 132 A SetValue command that changes global attributes associated with Line-plots. If you would like the settings in these commands to persist, add it to your tecplot.cfg file, located in your installation directory. $!GLOBALLINKING .......................................................................................................................................... 133 Set to YES to tie all colormaps together. If you would like the settings in this command to persist, add it to your tecplot.cfg file, located in your installation directory. $!GLOBALPAPER ................................................................................................................................................ 133 A SetValue command that sets the paper size characteristics. If you would like the settings in this command to persist, add it to your tecplot.cfg file, located in your installation directory. $!GLOBALPOLAR ............................................................................................................................................... 134 Allows polar plots to have curved lines that are interpolated along the R-Axis between data points. $!GLOBALRGB .................................................................................................................................................... 135 Allows RGB coloring for plots which have RGB values specified at each vertex. This coloring option is valuable for plots with entities such as Gas, Oil and Water. RGB Coloring can be assigned to field plot objects such as zones, iso-surfaces and slices $!GLOBALSCATTER .......................................................................................................................................... 136 A SetValue command that changes global attributes associated with scatter plots. $!GLOBALTHREED ............................................................................................................................................ 138 A SetValue command that changes global attributes associated with 3D plots. $!GLOBALTHREEDVECTOR ........................................................................................................................... 139 A SetValue command that changes global attributes associated with 3D vector plots. 38 $!GLOBALTIME...................................................................................................................................................140 A SetValue command for frames (2D and 3D ONLY). Different frames can have different values of $!GLOBALTIME. If you would like the settings in this command to persist, add them to your tecplot.cfg file (located in your installation directory). $!GLOBALTWODVECTOR...............................................................................................................................141 A SetValue command that changes global attributes associated with 2D vector plots. $!IF...$!ENDIF ........................................................................................................................................................142 Conditionally process macro commands. $!INCLUDEMACRO ...........................................................................................................................................142 Insert the commands from another macro file. Because the $!INCLUDEMACRO command is processed when the macro is loaded and not when the macro is executed, you are not allowed to reference macro variables within the <string> parameter. $!INTERFACE .......................................................................................................................................................142 A SetValue command that sets attributes related to the Tecplot 360 interface. $!INVERSEDISTINTERPOLATE .....................................................................................................................151 Interpolate selected variables from one or more zones onto a destination zone using the inverse distance method. $!ISOSURFACEATTRIBUTES ..........................................................................................................................152 A SetValue command which changes attributes associated with iso-surfaces.The optional group parameter can range from 1-8 and defaults to 1 when absent. $!ISOSURFACELAYERS.....................................................................................................................................154 Turn iso-surfaces on or off. $!KRIG....................................................................................................................................................................154 Interpolate selected variables from a set of source zones to a destination zone using the kriging method. $!LAUNCHDIALOG ...........................................................................................................................................155 Launch a Tecplot 360 interface dialog; This command is mainly useful for the Tecplot 360 demo. $!LIMITS................................................................................................................................................................155 A SetValue command that sets some of the internal limits in Tecplot 360. See Chapter F: “Limits of Tecplot Focus” in the User’s Manual for additional information. The $!LIMITS command can only be used in the Tecplot 360 configuration file. 39 $!LINEARINTERPOLATE.................................................................................................................................. 156 Interpolate selected variables from a set of source zones to a destination zone using linear interpolation. The source zones cannot be I-ordered. Values assigned to the destination zone are equivalent to the results of using the probe tool in Tecplot 360. $!LINEMAP ........................................................................................................................................................... 157 A SetValue command that assigns attributes for individual Line-mappings. The <set> parameter immediately following the $!LINEMAP command is optional. If <set> is omitted then the assignment is applied to all Line-mappings, otherwise the assignment is applied only to the Line-mappings specified in <set>. $!LINEPLOTLAYERS .......................................................................................................................................... 160 A SetValue command that turns on or off Line-plot layers. $!LINKING............................................................................................................................................................ 160 Link attributes in two or more frames so that changes to attributes of one frame effect all linked frames. $!LOADADDON.................................................................................................................................................. 161 Load an add-on into Tecplot 360. The <string> is the name of the add-on to load. See Section 33 - 1 “Add-on Loading” in the User’s Manual for instructions on how to specify the add-on. $!LOADCOLORMAP.......................................................................................................................................... 162 Load a color map file. The <string> is the name of the file to load. $!LOOP...$!ENDLOOP......................................................................................................................................... 162 Process macro commands in a loop. Within the loop you may access the current loop counter using the internal macro variable |Loop|. Loops may be nested up to 10 levels deep. $!MACROFUNCTION...$!ENDMACROFUNCTION.................................................................................. 162 Define a macro function. All commands between a $!MACROFUNCTION and the $!ENDMACROFUNCTION are associated with the macro function NAME. These commands are not executed when they are defined but are executed when a $!RUNMACROFUNCTION command is processed. Parameters can be passed to a macro function. Use |n| to reference the nth parameter. (See $!RUNMACROFUNCTION). In the user-interface, [Crtl]-M must be pressed, before using the keyboard shortcut specified by the KEYSTROKE option. For example, if the KEYSTROKE option is set to "P", the user must press [CTRL]-M-P. $!NEWLAYOUT.................................................................................................................................................... 163 Clear the current layout and start again. $!OPENLAYOUT .................................................................................................................................................. 163 Open and read in a new layout file. The <string> is the name of the file to open. $!PAGE ................................................................................................................................................................... 164 A SetValue command that sets the paper characteristics. 40 $!PAGECONTROL [Required-Control Option] ............................................................................................165 The different commands in the PAGECONTROL compound function family are described separately in the following sections. $!PAGECONTROL CREATE..............................................................................................................................166 Create a new page. The created page will include an initial frame. $!PAGECONTROL SETCURRENTTONEXT.................................................................................................166 Set the next page to be the current page. $!PAGECONTROL SETCURRENTTOPREVIOUS.......................................................................................166 Set the previous page to be the current page. $!PAGECONTROL SETCURRENTBYNAME................................................................................................166 Set the current page to the page specified. $!PAGECONTROL DELETE..............................................................................................................................166 Delete the current page. If the command is operated on the only page, then an initial page is created with an initial frame. $!PAGECONTROL CLEAR................................................................................................................................166 Clears all frames in the current page and creates a default initial frame. $!PAGEGETNAME ..............................................................................................................................................167 Action command to get the name of the current page. $!PAGENAME.......................................................................................................................................................167 Set the name of the page. $!PAUSE .................................................................................................................................................................167 Stop execution of a macro and optionally display a dialog with a message. If <string> is set to "" then no dialog is displayed and the user must click in the work area to continue. Pause and display the message This is the first example plot: $!PICK [Required-Control Option] ..................................................................................................................167 The different commands in the PICK compound function family are described separately in the following sections. $!PICK ADDATPOSITION................................................................................................................................167 Attempt to pick an object at a specific location on the paper. Does not pop or activate frames. $!PICK ADDALL..................................................................................................................................................168 Add all objects of a certain type to the list of picked objects. 41 $!PICK ADDALLINRECT .................................................................................................................................. 168 Add objects defined within a specified region to the list of picked objects. The region is defined in terms of the paper coordinate system. Optional filters can be used to restrict the objects selected. The region is defined by the two corner points (X1, Y1) and (X2, Y2). $!PICK CLEAR...................................................................................................................................................... 170 Delete all objects that are currently picked. (These objects cannot be retrieved.) $!PICK COPY ........................................................................................................................................................ 170 Copy all objects that are currently picked to the paste buffer. $!PICK CUT........................................................................................................................................................... 170 Copy all objects that are currently picked to the paste buffer and then delete them. $!PICK EDIT ......................................................................................................................................................... 170 Perform a global edit operation on the currently picked objects. Only one edit operation is allowed per $!PICK EDIT command. Objects are edited only if the supplied parameter is relevant. Actions taken using the Quick Edit dialog in Tecplot 360 generate these commands. $!PICK MAGNIFY ............................................................................................................................................... 172 Magnify all picked objects. The objects will also be translated proportional to the distance between their anchor position and the anchor position of the first object picked. $!PICK PASTE....................................................................................................................................................... 173 Paste the currently picked objects from the paste buffer to the work area. $!PICK POP ........................................................................................................................................................... 173 Change the order in which objects are drawn by popping the currently picked objects to the front. Only frames, text, geometries, and the grid area for 2D plots are allowed. $!PICK PUSH ........................................................................................................................................................ 173 Change the order in which objects are drawn by pushing the currently picked objects back. Only frames, text, geometries, and the grid area for 2D plots are allowed. $!PICK SETMOUSEMODE ............................................................................................................................... 173 Prepare to pick objects by setting the mouse mode to SELECT, ADJUST, or ADVANCEADJUST. ADVANCEADJUST is a combination of SELECT and ADJUST that allows an object’s control points to be adjusted by dragging, or the entire object to be selected by clicking away from the control points. This command also clears the list of picked objects (that is, unpicks all picked objects). $!PICK SHIFT ....................................................................................................................................................... 174 Shift the currently picked objects. Objects are shifted relative to their starting position. X and Y shift amounts are in paper units (inches). If snapping is in effect then it is applied after shifting in X and Y. (See the SetValue commands $!GLOBALFRAME SNAPTOGRID and $!GLOBALFRAME SNAPTOPAPER.) 42 $!PLOTOPTIONS ................................................................................................................................................174 Change the plot option between subdividing all cells, or using a quicker algorithm. $!PLOTTYPE .........................................................................................................................................................174 Changes plot types between valid Tecplot 360 modes such as XYLine and Cartesian2D. Valid options shown below. $!POLARAXIS ......................................................................................................................................................175 A SetValue command that assigns attributes for axes in a polar frame. $!POLARTORECTANGULAR...........................................................................................................................175 Treat the variables currently assigned to X and Y as referring to R and q and convert them to X and Y. In 3D, X, Y and Z refer to R, q, and y. Tecplot 360 has addition capabilities for transforming coordinates, please see $!TRANSFORMCOORDINATES. $!POLARVIEW .....................................................................................................................................................176 Sets the viewing style for polar plots in a layout. $!PRINT..................................................................................................................................................................176 Print the current layout to a printer or send the print instructions to a file. Use the $!PRINTSETUP SetValue command to configure printing. $!PRINTSETUP ....................................................................................................................................................176 A SetValue command that sets the attributes for printing. Use $!PRINT to do the actual printing. See $!EXPORTSETUP and $!EXPORT if you intend to create image files destined for desktop publishing programs. $!PROMPTFORFILENAME...............................................................................................................................178 Instruct Tecplot 360 to launch a file selection dialog. The resulting file name will be placed in <macrovar>. If the user cancels out of the dialog then <macrovar> will be empty (see the example below). $!PROMPTFORTEXTSTRING ..........................................................................................................................178 Instruct Tecplot 360 to launch a dialog containing a single line text field and optional instructions. The user enters text into the text field and the resulting string is assigned to <macrovar>. $!PROMPTFORYESNO ......................................................................................................................................179 Instruct Tecplot 360 to launch a dialog containing two buttons, one labeled Yes and the other No. The <macrovar> is assigned the string Yes or No depending on the selection. $!PROPAGATELINKING...................................................................................................................................179 Link multiple frames, either within frame or between frames. 43 $!PUBLISH ............................................................................................................................................................ 179 Create an HTML file displaying one or more images. A linked layout with packaged data may be included. You must provide the file name. $!QUIT.................................................................................................................................................................... 180 Terminate the execution of the Tecplot 360 program. $!RAWCOLORMAP ............................................................................................................................................ 180 Assign the RGB values that define the Raw user-defined color map. This does not set the color map to use the Raw user-defined color map. Use $!COLORMAP to set the current color map. $!READDATASET................................................................................................................................................ 181 The $!READDATASET macro command has two separate uses. The parameters available for the command are dependent upon the intended use. It may either be used to load data in Tecplot 360’s file format (*.plt or *.dat) or in a foreign data file format. To load data in Tecplot 360’s file format, use the parameters listed in Table 9 - 2. To load data in a foreign file format, use the parameters listed in Table 9 - 1 along with a set of name/value pairs. The name/value pairs are specific to the data loader and described in Chapter 4: “Data Loaders” in the User’s Manual. $!READSTYLESHEET......................................................................................................................................... 183 Read in a stylesheet file. The <string> is the name of the file to read. $!REDRAW ............................................................................................................................................................ 183 Redraw the active frame. $!REDRAWALL..................................................................................................................................................... 184 Redraw all frames. $!REMOVEVAR.................................................................................................................................................... 184 Remove a user-defined macro variable. This frees up space so another user-defined macro variable can be defined. $!RENAMEDATASETVAR................................................................................................................................. 184 Rename a data set variable in Tecplot 360. $!RENAMEDATASETZONE ............................................................................................................................. 185 Rename a data set zone in Tecplot 360. $!RESET3DAXES.................................................................................................................................................. 185 Reset the ranges on the 3D axes. $!RESET3DORIGIN ............................................................................................................................................ 185 Reposition the rotation origin in 3D to be at the specified location. 44 $!RESET3DSCALEFACTORS............................................................................................................................186 Recalculate the scale factors for the 3D axes. Aspect ratio limits are taken into account. $!RESETVECTORLENGTH...............................................................................................................................186 Reset the length of the vectors. Tecplot 360 will find the vector with the largest magnitude and set the scaling factor so it will appear on the screen using the length specified by $!FRAMESETUP VECTDEFLEN. $!ROTATE2DDATA .............................................................................................................................................186 Rotate field data in 2D about any point. $!ROTATE3DVIEW..............................................................................................................................................187 Do a 3D rotation about a given axis. The <rotateaxis> must be supplied. $!RUNMACROFUNCTION ..............................................................................................................................187 Execute commands defined in a macro function. The <string> references the name of the macro function to run. If the macro command requires parameters, then include them (within parentheses) after the macro command name. $!SAVELAYOUT ...................................................................................................................................................188 Save the current layout to a file. You must supply the file name. $!SET3DEYEDISTANCE.....................................................................................................................................188 Sets the distance from the viewer to the plane of the current center of rotation. $!SETAUXDATA ...................................................................................................................................................188 Add Auxiliary Data in the form of name/value pairs to zones, frames or datasets. The name must begin with an underscore or letter, and may be followed by one or more underscore, period, letter, or digit characters. $!SETDATASETTITLE ........................................................................................................................................189 Set the title for the current data set. $!SETFIELDVALUE .............................................................................................................................................189 Specify a field value (data set value) at a specified point index. If the zone referenced is IJ- or IJK-ordered then the point index is calculated by treating the 2- or 3D array as a 1-D array. Note that the INDEX value was calculated using: $!SETFRAMEBACKGROUNDCOLOR ..........................................................................................................190 Sets the frame background to the specified color and surveys all basic color assignments in Tecplot 360, converting the all basic colors using the following rules to achieve the best contrast: 45 $!SETSTYLEBASE................................................................................................................................................ 190 Instruct Tecplot 360 on how to initialize frame style values when a new frame is created. During normal operation, Tecplot 360 bases the style of a new frame on the factory defaults plus any changes assigned in the Tecplot 360 configuration file. Layout files and stylesheet files, however, rely on Tecplot 360 basing new frames only on the factory defaults. This command is typically not used by the casual user. $!SHARECONNECTIVITY................................................................................................................................ 191 Share the nodemap between the source and destination zones, presuming that the zones are FE and have the same element type and number of nodes. $!SHAREFIELDDATAVAR................................................................................................................................. 191 Allows sharing of the specified variable from the source zone to the destination zone. Zone must be of the same type (ordered or FE) and dimensions. Cell centered variables in FE must have the same number of cells. Sharing is not allowed if either zone has global face neighbors. $!SHIFTLINEMAPSTOBOTTOM.................................................................................................................... 192 Shift a list of Line-mappings to the bottom of the Line-mapping list. This in effect causes the selected Linemappings to be drawn last. $!SHIFTLINEMAPSTOTOP .............................................................................................................................. 192 Shift a list of Line-maps to the top of the Line-map list. This in effect causes the selected Line-maps to be drawn first. $!SHOWMOUSEPOINTER ............................................................................................................................... 192 The mouse icon may be deactivated within a macro to enhance the on-screen animation. It must be reactivated before exiting the macro. $!SKETCHAXIS.................................................................................................................................................... 192 A SetValue command that assigns attributes for axes in a sketch mode frame. Axes are rarely used in sketch frames. $!SLICEATTRIBUTES......................................................................................................................................... 193 A SetValue command that changes global attributes associated with slices. $!SLICELAYERS ................................................................................................................................................... 196 Turn slicing on or off. $!SMOOTH ........................................................................................................................................................... 197 Smooth data (reduce the spikes) for selected variables in selected zones. $!STREAMATTRIBUTES ................................................................................................................................... 197 A SetValue command that changes global attributes associated with streamtraces. 46 $!STREAMTRACE [Required-Control Option].............................................................................................199 The different commands in the STREAMTRACE compound function family are described separately in the following sections. $!STREAMTRACE ADD ....................................................................................................................................199 Add a single streamtrace or a rake of streamtraces to the active frame. The frame must be a 2D or 3D field plot. $!STREAMTRACE DELETEALL ......................................................................................................................201 Deletes all streamtraces in the active frame. If the frame mode is 2D, all 2D streamtraces are deleted. If the frame mode is 3D, all 3D streamtraces are deleted. $!STREAMTRACE DELETERANGE ...............................................................................................................201 Delete a range of streamtraces. Streamtraces are numbered sequentially in the order they were created. $!STREAMTRACE RESETDELTATIME..........................................................................................................201 Reset the time delta for dashed streamtraces. The delta time is reset such that a stream dash in the vicinity of the maximum vector magnitude will have a length approximately equal to 10 percent of the frame width. $!STREAMTRACE SETTERMINATIONLINE ..............................................................................................202 Set the position of the termination line for streamtraces. $!STREAMTRACELAYERS ...............................................................................................................................202 Turn streamtraces on or off. $!SYSTEM..............................................................................................................................................................202 Instruct Tecplot 360 to submit a command to the operating system. For security reasons, execution of the $!SYSTEM command can be disabled to prevent unauthorized execution of system commands via macros. Use the OKTOEXECUTESYSTEMCOMMAND option to the $!INTERFACE macro command. $!THREEDAXIS....................................................................................................................................................203 A SetValue command that assigns attributes for axes in a 3D frame. $!THREEDVIEW ..................................................................................................................................................204 A SetValue command that changes global attributes associated with the 3D view. $!TRANSFORMCOORDINATES.....................................................................................................................205 Transforms all points in one or more zones from one coordinate system to another. $!TRIANGULATE ................................................................................................................................................206 Create a new zone by forming triangles from data points in existing zones. 47 $!TWODAXIS ....................................................................................................................................................... 207 A SetValue command that assigns attributes for axes in a 2D frame. $!VARSET .............................................................................................................................................................. 208 Assign a value to a macro variable. If the macro variable did not exist prior to this command, then it is defined here. A macro variable can be assigned a value or a string. $!VIEW [Required-Control Option] ................................................................................................................. 208 The different commands in the VIEW compound function family are described separately in the following sections. $!VIEW AXISFIT .................................................................................................................................................. 209 Reset the range on a specific axis so that it equals the minimum and maximum of the data being plotted. If the axis dependency is not independent then this action may also affect the range on another axis. $!VIEW AXISMAKECURRENTAXISVALUESNICE .................................................................................... 209 Reset the axis-line label values such that all currently displayed values are set to have the smallest number of significant digits possible. $!VIEW AXISNICEFIT........................................................................................................................................ 209 Reset the range on a specific axis so that it equals the minimum and maximum of the data being plotted, but makes the axis values “nice” by setting labels to have the smallest number of significant digits possible. If the axis dependency is not independent then this action may also affect the range on another axis. $!VIEW CENTER.................................................................................................................................................. 210 Center the data within the axis grid area. $!VIEW COPY ....................................................................................................................................................... 210 Copy the current view to the view paste buffer. See also $!VIEW PASTE. $!VIEW DATAFIT ................................................................................................................................................ 210 Fit the current set of data zones or line mappings being plotted within the grid area. This does not take into consideration text or geometries. $!VIEW FIT............................................................................................................................................................ 210 Fit the entire plot to the grid area. This also takes into consideration text and geometries that are plotted using the grid coordinate system. In 3D, this also includes the axes. $!VIEW FITSURFACES....................................................................................................................................... 211 Fits active plot surfaces to the grid area. 3D volume zones are excluded when surfaces to plot are set to none. See $!FIELDMAP for more information on setting surfaces to plot. 48 $!VIEW LAST........................................................................................................................................................211 Retrieve the previous view from the view stack. Each frame mode within each frame maintains its own view stack. $!VIEW LAST will not reverse alterations to data. $!VIEW MAKECURRENTVIEWNICE ............................................................................................................211 Shifts axis to make axis-line values nice without changing the extents of the window. Only works in Sketch/XY/2D. $!VIEW NICEFIT..................................................................................................................................................211 Change view to make the extents of the frame neatly hold the plot with integer values for axis labels. Only works in Sketch/XY/2D. $!VIEW PASTE......................................................................................................................................................211 Retrieve the view from the view paste buffer and assign it to the active frame. $!VIEW PUSH .......................................................................................................................................................211 Instruct Tecplot 360 to push the current view onto the view stack. A view will not be pushed if the current view is the same as the top view on the stack. Note that commands VIEW AXISFIT, VIEW CENTER, VIEW DATAFIT, VIEW FIT, and VIEW ZOOM automatically push a view onto the stack. Tecplot 360 automatically pushes the current view onto the stack when a $!REDRAW command is issued and the current view is different from the top view on the view stack. $!VIEW RESETTOENTIRECIRCLE .................................................................................................................212 Reset the Theta-R Axis to initial settings. For Polar plots only. $!VIEW SETMAGNIFICATION .......................................................................................................................212 Set the magnification for the data being plotted. A magnification of 1 will size the plot so it can fit within the grid area. $!VIEW TRANSLATE..........................................................................................................................................212 Shift the data being plotted in the X- and/or Y-direction. The amount translated is in frame units. $!VIEW ZOOM .....................................................................................................................................................212 Change the view by “zooming” into the data. In Sketch, XY, and 2D frame mode plots, Tecplot 360 will adjust the ranges on the axis to view the region defined by the rectangle with corners at (X1, Y1) and (X2, Y2). For 3D orthographic plots, the view is translated and scaled to fit the region. For 3D perspective plots, the view is rotated about the viewer and scaled to fit the region. X1 and so forth are measured in grid coordinates. $!WHILE...$!ENDWHILE....................................................................................................................................213 Continue to execute a set of commands until a conditional expression is NO. $!WORKSPACEVIEW [Required-Control Option].......................................................................................213 The different commands in the WORKSPACEVIEW compound function family are described separately in the following sections. 49 $!WORKSPACEVIEW FITALLFRAMES......................................................................................................... 214 Change the view in the workspace so all frames are fit just inside the edges of the workspace. $!WORKSPACEVIEW FITPAPER..................................................................................................................... 214 Change the view in the workspace so the entire paper is fit just inside the edges of the workspace. $!WORKSPACEVIEW FITSELECTEDFRAMES ........................................................................................... 214 Change the view in the workspace so the currently selected frames (that is, the frames with pick handles) are fit just inside the edges of the workspace. $!WORKSPACEVIEW LASTVIEW .................................................................................................................. 214 Return to the previous workspace view. $!WORKSPACEVIEW MAXIMIZE .................................................................................................................. 214 Temporarily expand the work area as large as possible. The maximized work area occupies the entire Tecplot 360 process window. $!WORKSPACEVIEW TRANSLATE ............................................................................................................... 214 Shift the view of the workspace. This has no effect on the local view within any frame in your layout. $!WORKSPACEVIEW UNMAXIMIZE............................................................................................................ 215 Returns the workspace to its normal size after it has been expanded after $!WORKSPACE MAXIMIZE has been used. $!WORKSPACEVIEW ZOOM........................................................................................................................... 215 Change the view into the work area. This has no effect on the local view within any frame in your layout. $!WRITECOLORMAP ........................................................................................................................................ 216 Write the current color map to a file. The <string> is the name of the file to write to. $!WRITECURVEINFO ........................................................................................................................................ 216 Write out the curve details or the calculated data points for the equation(s) used to draw the curve for a selected line mapping. The <string> is the name of the file to write to. $!WRITEDATASET.............................................................................................................................................. 216 Write the data set attached to the active frame to a file. The <string> is the name of the file to write to. $!WRITESTYLESHEET ....................................................................................................................................... 217 Write the style for the active frame to a file. The <string> is the name of the file to write to. $!XYLINEAXIS ..................................................................................................................................................... 218 A SetValue command that assigns attributes for axes in an XY Line plot. Set the axis mode to be independent for the XY-axes (note that this affects only X1 versus Y1): 50 ANIMATESTREAKLINES .................................................................................................................................220 Animates previously calculated streaklines to the screen or to a file. ATTACHINTEGRATIONRESULTS.................................................................................................................221 Attach the text results of the previous integration as a text field in the active frame. CALCPARTICLEPATH .......................................................................................................................................221 Calculate particle paths or streaklines, starting from existing Tecplot 360 streamtraces. CALCTURBULENCEFUNCTION....................................................................................................................224 Calculate a turbulence-related function from two variables in the current data set. Add the result to the data set as a new variable using the function’s name, or overwrite the variable if it already exists. CALCULATE.........................................................................................................................................................224 Calculate a Tecplot 360 variable using the specified function and add it to the current data set. If the variable already exists in the current data set, it will be recalculated. CALCULATEACCURACY .................................................................................................................................225 Calculate the order accuracy of the solution contained in the listed zones. Optionally, plot the overall accuracy versus grid spacing and plot the accuracy at each grid node. DISPLAYBOUNDARIES....................................................................................................................................226 Displays boundaries corresponding to a geometry and boundaries specification without actually setting the geometry and boundaries. This macro is generally not useful for those writing macro files, but is recorded when the user clicks the Display Boundaries button in the Geometry and Boundaries dialog in order to duplicate the actions of Tecplot 360 that happen in response to that action. See Section “SETGEOMETRYANDBOUNDARIES” on page 232 for a description of the parameters for this macro. EXTRACTFLOWFEATURE................................................................................................................................226 Extract and display shock surfaces, vortex cores, or separation and attachment lines. Shock surfaces are displayed as iso-surfaces of a new variable, ShockSurface, while vortex cores and separation and attachment lines are displayed as new zones. EXTRAPOLATESOLUTION..............................................................................................................................227 Perform Richardson extrapolation to estimate the true solution from three input solutions on grids of successively finer resolution. Two new zones are added to the current data set. The first contains the extrapolated solution, while the second contains the estimated error. INTEGRATE..........................................................................................................................................................227 Perform an integration over the specified zones (or time strands, if INTEGRATEBY is set to TIMESTRANDS). If <set> is not specified, the integration will be performed over all zones (or time strands). If PLOTAS is set to TRUE, the integration results will be plotted in a new frame. SAVEINTEGRATIONRESULTS .......................................................................................................................229 Saves the most recently calculated integration results to a text file. 51 SETFIELDVARIABLES....................................................................................................................................... 230 Identifies variables in your data, such as velocity, pressure and temperature, for use in analysis. SETFLUIDPROPERTIES .................................................................................................................................... 230 Set the fluid properties for use by other commands. SETGEOMETRYANDBOUNDARIES............................................................................................................. 232 Specify whether the data represent an axisymmetric flow solution (2D Cartesian plots only), whether adjacent zones should be considered to be connected at coincident faces, and specify zone boundaries and their corresponding boundary conditions. Each line of the RAWDATA describes one boundary, and appears in the same format as on the Geometry and Boundaries dialog. For all boundaries, list the boundary condition and the set of zones, separated by a comma. The index range-type boundary follows this with the boundary face, the first starting index, the first ending index, the second starting index and the second ending index. All entries are separated by commas. The boundary condition is one of INFLOW, OUTFLOW, WALL, SLIPWALL, SYMMETRY, EXTRAPOLATED. The boundary face is one of I=1, I=IMAX, J=1, J=JMAX, K=1, and K=KMAX. Refer to Section 22 - 4 “Setting Geometry and Boundary Options” in the User’s Manual for more information on boundaries. SETREFERENCEVALUES .................................................................................................................................. 232 Specify the reference (free-stream) properties of the solution, identify two variables in the current data set for use with other commands. SETUNSTEADYFLOWOPTIONS.................................................................................................................... 233 Identifies time levels for unsteady flow, or specifies that the solution is steady-state. If the flow is unsteady, the solution time levels are specified in the RAWDATA section. The first line of the RAWDATA section must consist of a single integer indicating the number of solution time levels. This must be followed by the time levels themselves. Each time level must be on a separate line and must consist of a floating-point number (the solution time), as well as one or more integers (the zone numbers for that solution time). <<anchorpos>>....................................................................................................................................................... 235 Assign attributes for positioning of objects. <<areastyle>> ......................................................................................................................................................... 236 Change settings for the axis grid area. <<axisdetail>> ........................................................................................................................................................ 236 Assign attributes for axes. <<axisline>> ........................................................................................................................................................... 237 Assign attributes for axis lines. <<axistitle>> ........................................................................................................................................................... 238 Assign attributes for titles. 52 <<basiccolorcontrol>> ..........................................................................................................................................239 Assign name to a basic color . <<basicsizelist>> ...................................................................................................................................................239 Assign basic sizes. The units for the values assigned here are dependent on the parent command. Assignments here do not affect the plot. These assignments are used only to configure drop-down menus in the interface so the user can make quick selections. <<colormapcontrolpoints>> ................................................................................................................................240 All contour color maps except the Raw user-defined color map make use of control points to determine the color distribution. Each control point has a position and a left and right color. The <<colormapcontrolpoints>> subcommand can contain more than one CONTROLPOINT subcommand. <<colormapoverride>> .........................................................................................................................................240 Change settings for a color map override. Color map overrides are used to replace a specific band in a contour color map with one of the 16 basic colors. <<continuouscolor>> ............................................................................................................................................241 Change settings for continuous color. <<dialogplacement>> ...........................................................................................................................................242 Describes the placement for a dialog. <<gridarea>> ..........................................................................................................................................................242 Change settings for the axis grid area. <<gridlinedetail>> ................................................................................................................................................243 Change settings for axis gridlines. <<ijk>> ....................................................................................................................................................................244 Set an I-, J-, or K-index. <<indexrange>> .....................................................................................................................................................244 Set an index range. <<numberformat>>...............................................................................................................................................245 Set the format used to draw a number. <<papersize>> ........................................................................................................................................................246 Change dimensions or hardclip offsets for LETTER, DOUBLE, A3, A4, CUSTOM1 and CUSTOM2 paper sizes. <<precisegrid>> .....................................................................................................................................................246 Change settings for the precise dot grid. 53 <<rect>>................................................................................................................................................................... 246 Change settings for a rectangle. The rectangle is defined using two points (X1,Y1) and (X2,Y2). <<refscatsymbol>> ................................................................................................................................................ 247 Set the attributes for the reference scatter symbol. <<renderconfig>> .................................................................................................................................................. 248 Set the attributes for OpenGL rendering. <<rgb>> ................................................................................................................................................................... 249 Set a color value by assigning values to its red, green, and blue components. <<shademap>>....................................................................................................................................................... 249 Map colors on the screen to shades of gray for monochrome hardcopy output. <<symbolshape>> ................................................................................................................................................. 250 Set a symbol shape. Symbols can be a geometric shape (circle, square, and so forth) or an ASCII character. <<textbox>> ............................................................................................................................................................ 251 Change settings for the optional box around a text label. <<textshape>> ........................................................................................................................................................ 251 Change settings related to text font and character height. <<ticklabeldetail>> ............................................................................................................................................... 252 Change settings for the text used to label axis tick marks. <<tickmarkdetail>>............................................................................................................................................... 253 Assign attributes for axis tick marks. <<volumeobjectstoplot>> .................................................................................................................................... 254 Specifies what volume objects are to be displayed. <<xy>> ..................................................................................................................................................................... 255 Change settings for an (X,Y) position. <<xyz>> ................................................................................................................................................................... 255 Change settings for an (X, Y, Z) triplet. <<zebrashade>>..................................................................................................................................................... 255 Change zebra shading attributes. 54 LOADPYFILE NAME..........................................................................................................................................290 Use this function to load a Python module via a macro file. MODIFYPYPATH ................................................................................................................................................290 Use this command to temporarily modify your PYTHONPATH variable. The variable will be set for the duration of the Tecplot 360 session using the macro command/file. RUNPYFUNCTION.............................................................................................................................................291 Use this command to execute a Python function via a macro file. NOTE: Before executing a Python function, you must first load the module that contains it via the LOADPYFILE NAME command. 55 56 9 Macro Commands This chapter lists Tecplot 360’s macro commands alphabetically. Optional parameters are enclosed within square brackets ( [ ] ). Items within double angle brackets (<< >>) represent parameter sub-commands listed and described in Chapter 11: “Parameter Subcommands”. A $!ACTIVEFIELDMAPS Syntax: $!ACTIVEFIELDMAPS <op> <set> [no optional parameters] Description:A SetValue command that changes the set of active field maps (thus changing the active zones) considered for plotting. Examples: Example 1: Make only field maps 1, 3, 4 and 5 active for plotting: $!ACTIVEFIELDMAPS = [1,3-5] Example 2: Add zones 33, 34, 35, and 36 to the set of active field maps: $!ACTIVEFIELDMAPS += [33-36] 57 Example 3: Remove zones 1, 2, 3, 9, 10 and 11 from the set of active field maps: $!ACTIVEFIELDMAPS -= [1-3,9-11] $!ACTIVELINEMAPS Syntax: $!ACTIVELINEMAPS <op> <set> [no optional parameters] Description:A SetValue command that changes the set of line mappings considered for plotting. Examples: Example 1: Make only line-mappings 1, 3, 4 and 5 active for plotting: $!ACTIVELINEMAPS = [1,3-5] Example 2: Add line-maps 33, 34, 35 and 36 to the set of active line-mappings: $!ACTIVELINEMAPS += [33-36] Example 3: Remove line-maps 1, 2, 3, 9, 10 and 11 from the set of active line-mappings: $!ACTIVELINEMAPS -= [1-3,9-11] $!ADDMACROPANELTITLE Syntax: $!ADDMACROPANELTITLE <string> [no optional parameters] Description:Add a title to the Quick Macro Panel. Example: The following example adds the title “Bar Charts” to the Quick Macro Panel. $!ADDMACROPANELTITLE "Bar Charts" $!ALTERDATA Syntax: $!ALTERDATA [zonelist] EQUATION = <string> [optional parameters] Description:The ALTERDATA function operates on a data set within Tecplot 360 using FORTRAN-like equations. See Section 21 - 1 “Data Alteration through Equations” in the User’s Manual for more information on using equations in Tecplot 360. The <zonelist> parameter specifies the set of zones 58 on which to operate, where zonelist is a list of zones or zone ranges separated by a comma (“,”). Zone ranges are separated by a hyphen (“-”). If <zonelist> is omitted, all zones are affected. NOTE: the values for the <zonelist> parameter must be enclosed in square brackets. (For example, use $!ALTERDATA [1,3] to apply ALTERDATA to zones 1 and 3). Required Parameters Parameter EQUATION Syntax Default = <string> Notes This assigns the equation to use to operate on the data. Optional Parameters Parameter Syntax Default Notes DATATYPE = <datatype> SINGLE Assign the precision given to the destination variable (that is, the variable on the left hand side of the equation). This only applies if the equation creates a new variable. (See Example 2:) IGNOREDIVIDEBYZERO = <boolean> NO If YES, the equation will be processed even if it includes a division by zero. 0/0 will result in 0, while other divisions will return the largest or smallest possible result depending on the sign of the dividend. If NO, an equation with a division by zero will not be processed at all. IRANGE See Range Parameters, following, for information on specifying range index values. { MIN = <integer> 1 MAX = <integer> 0 SKIP = <integer> 1 } JRANGE See Range Parameters, following, for information on specifying range index values. { MIN = <integer> 1 MAX = <integer> 0 SKIP = <integer> 1 } KRANGE See Range Parameters, following, for information on specifying range index values. { MIN = <integer> 1 MAX = <integer> 0 SKIP = <integer> 1 = <valuelocation> AUTO } VALUELOCATION Assign the location to destination variable. Range Parameters The IRANGE, JRANGE, and KRANGE parameters limit the data altered by the equation. The specification of range indices follow these rules: • All indices start with 1 and go to some maximum index m. • The number 0 can be used to represent the maximum index m. If the maximum index m = 15, specifying 0 sets the range index to 15. • Negative values represent the offset from the maximum index. If a value of -2 is specified, and the maximum index m is 14, the value used is 14-2, or 12. 59 Examples: Example 1: The following example adds one to X for zones 1 and 3 for every data point: $!ALTERDATA [1,3] EQUATION = "x = x+1" Example 2: The following example creates a new, double precision variable called DIST: $!ALTERDATA EQUATION = "{DIST} = SQRT(X**2 + Y**2)" DATATYPE = DOUBLE Example 3: The following equations set a variable called P to zero along the boundary of an IJ-ordered zone: $!ALTERDATA EQUATION = "{P} = IRANGE {MAX = 1} $!ALTERDATA EQUATION = "{P} = IRANGE {MIN = 0} $!ALTERDATA EQUATION = "{P} = JRANGE {MAX = 1} $!ALTERDATA EQUATION = "{P} = JRANGE {MIN = 0} 0" 0" 0" 0" Example 4: By following a variable reference with brackets “[” and “]” you may designate a specific zone from which to get the variable value. For example: V3 = V3 -V3[1] X = (X[1] + X[2] + X[3]) / 3 {TempAdj} = {Temp}[7] - {Adj} V7 = V1[19] - 2*C[21] + {R/T}[18] The zone number must be a positive integer constant less than or equal to the number of zones. The zone designated must have the same structure (finite-element, I-, IJ-, or IJK-ordered) and dimensions (number of nodes and so forth) $!ANIMATECONTOURLEVELS Syntax: $!ANIMATECONTOURLEVELS START = <integer> END = <integer> [optional parameters] Description:Produce an animation of a contour line plot by showing a single level at a time. The animation varies according to the currently defined contour levels and is limited by the values in the START, END, and SKIP parameters. To create a movie file, add $!EXPORTSETUP commands before this 60 command. Required Parameters Parameter Syntax Default Notes START = <integer> Starting contour level number to animate. END = <integer> Ending contour level number to animate. Optional Parameters Parameter Syntax Default Notes CREATEMOVIEFILE = <boolean> NO If YES, must be preceded by $!EXPORTSETUP commands. SKIP = <integer> 1 Level skip. Example: The following command animates the first four contour levels to an AVI file: $!EXPORTSETUP EXPORTFORMAT = AVI $!EXPORTSETUP EXPORTFNAME = "contourlevels.avi" $!ANIMATECONTOURLEVELS START = 1 END = 4 CREATEMOVIEFILE = YES $!ANIMATEIJKBLANKING Syntax: $!ANIMATEIJKBLANKING NUMSTEPS = <integer> [optional parameters] Description:Produce an animation of different IJK-blankings in your plot. The animation starts at one IJKblanking setting and marches through intermediate steps to a second setting. To create a movie file, add $!EXPORTSETUP commands before this command. 61 Required Parameter Parameter NUMSTEPS Syntax Default = <integer> Notes Number of intermediate steps for the animation. Optional Parameters Parameter Syntax Default Notes IMINFRACT = <dexp> 0.1 Minimum fraction for blanking at the start of animation for the I-index. Actual I-index is equal to IMINFRACT*IMAX. JMINFRACT = <dexp> 0.1 Minimum fraction for blanking at the start of animation for the J-index. Actual J-index is equal to JMINFRACT*JMAX. KMINFRACT = <dexp> 0.1 Minimum fraction for blanking at the start of animation for the K-index. Actual K-index is equal to KMINFRACT*KMAX. IMAXFRACT = <dexp> 1.0 Maximum fraction for blanking at the start of animation for the I-index. Actual I-index is equal to IMAXFRACT*IMAX. JMAXFRACT = <dexp> 1.0 Maximum fraction for blanking at the start of animation for the J-index. Actual J-index is equal to JMAXFRACT*JMAX. KMAXFRACT = <dexp> 1.0 Maximum fraction for blanking at the start of animation for the K-index. Actual K-index is equal to KMAXFRACT*KMAX. IMINFRACT2 = <dexp> 0.8 Minimum fraction for blanking at the end of animation for the I-index. Actual I-index is equal to IMINFRACT*IMAX. JMINFRACT2 = <dexp> 0.8 Minimum fraction for blanking at the end of animation for the J-index. Actual J-index is equal to JMINFRACT*JMAX. KMINFRACT2 = <dexp> 0.8 Minimum fraction for blanking at the end of animation for the K-index. Actual K-index is equal to KMINFRACT*KMAX. IMAXFRACT2 = <dexp> 1.0 Maximum fraction for blanking at the end of animation for the I-index. Actual I-index is equal to IMAXFRACT*IMAX. JMAXFRACT2 = <dexp> 1.0 Maximum fraction for blanking at the end of animation for the J-index. Actual J-index is equal to JMAXFRACT*JMAX. KMAXFRACT2 = <dexp> 1.0 Maximum fraction for blanking at the end of animation for the K-index. Actual K-index is equal to KMAXFRACT*KMAX. CREATEMOVIEFILE = <boolean> NO If YES, must be preceded by $!EXPORTSETUP commands. Example: The following example produces an animation showing a band of I-planes traversing the entire data field: $!ANIMATEIJKBLANKING NUMSTEPS = 6 IMINFRACT = 0.1 JMINFRACT = 0.0 KMINFRACT = 0.0 IMAXFRACT = 1.0 JMAXFRACT = 1.0 KMAXFRACT = 1.0 IMINFRACT2 = 1.0 JMINFRACT2 = 0.0 KMINFRACT2 = 0.0 IMAXFRACT2 = 1.0 JMAXFRACT2 = 1.0 KMAXFRACT2 = 1.0 $!ANIMATEIJKPLANES Syntax: 62 $!ANIMATEIJKPLANES START = <integer> END = <integer> [optional parameters] Description:Produce an animation that cycles through I-, J-, or K-planes in an IJK-ordered data set. To create a movie file, add $!EXPORTSETUP commands before this command. Required Parameters Parameter Syntax Default Notes START = <integer> Starting plane index END = <integer> Ending plane index Optional Parameters Parameter Syntax Default Notes CREATEMOVIEFILE = <boolean> NO If YES, must be preceded by $!EXPORTSETUP commands PLANES = <ijkplane> I Specify I, J or K SKIP = <integer> 1 Index skip Example: The following example generates an animation of the I-planes 1, 3, 5, 7, and 9: $!ANIMATEIJKPLANES PLANES = I START = 1 END = 9 SKIP = 2 $!ANIMATEISOSURFACES Syntax: $!ANIMATEISOSURFACES STARTVALUE = <double> ENDVALUE = <double> [optional parameters] Description:The macro command $!ANIMATEISOSURFACES produces an animation of a series of iso-surfaces beginning with the iso-surface defined by STARTVALUE and ending with the iso-surface defined by ENDVALUE. To create a movie file, add $!EXPORTSETUP commands before this command. 63 Required Parameters Parameter Syntax ENDVALUE = <integer> NUMSTEPS = <integer> STARTVALUE = <integer> Default Notes ENDVALUE is the value of the contour variable for the last isosurface in the animation. 2 Number of iso-surfaces to distribute between the start and end iso-surfaces values. STARTVALUE is the value of the contour variable for the first iso-surface in the animation. Optional Parameters Parameter Syntax Default Notes CREATEMOVIEFILE = <boolean> NO If YES, must be preceded by $!EXPORTSETUP commands. GROUP = <integer> 1 values 1- 8 LIMITSCREENSPEED = <boolean> No MAXSCREENSPEED = <double> You may need to reduce the value to correlate with the speed of your computer. Go To, Loop, Bounce, Forward, and Backward are only used by the interface. Forward and Backward can be simulated using appropriate values STARTVALUE and ENDVALUE. If ENDVALUE < STARTVALUE, the animation goes 'backward'. If ENDVALUE > STARTVALUE, the animation goes 'forward'. Goto can be simulated if ENDVALUE == STARTVALUE. That is, it can be simulated if the animation goes 'one step'. Loop and Bounce can be accomplished by calling the file multiple times. When recording, the macro recorded contains exactly the animation done in the interface. So if you bounce three times through the data, you will record three sets of forward and backwards commands. Similarly, if you use the "one step" options a lot, you will record a lot of individual macro commands. If you interrupt part way through an animation, you will record a partial animation macro of those steps you did animate through. Example: The following example creates an animation of iso-surfaces: $!ANIMATEISOSURFACES STARTVALUE = 1 ENDVALUE = 30 NUMSTEPS = 30 $!ANIMATELINEMAPS Syntax: $!ANIMATELINEMAPS START = <integer> END = <integer> [optional parameters] Description:Produce an animation of one Line-mapping at a time. To create a movie file, add $!EXPORTSETUP commands before this command. 64 Required Parameters Parameter Syntax Default Notes START = <integer> Starting Line-map number END = <integer> Ending Line-map number Optional Parameters Parameter Syntax Default Notes SKIP = <integer> 1 Line-map skip CREATEMOVIEFILE = <boolean> NO If YES, must be preceded by $!EXPORTSETUP commands Example: The following example creates an animation showing plots of Line-maps 2, 4, 6, 8 and 10: $!ANIMATELINEMAPS START = 2 END = 10 SKIP = 2 $!ANIMATESLICES Syntax: $!ANIMATESLICES [Group] START = <integer> END = <integer> [optional parameters] Description:The macro command $!ANIMATESLICES uses the currently defined start and end slice position. Use $!SLICEATTRIBUTES to set these positions; $!ANIMATESLICES then redefines how many intermediate slices are to be used, then animates a sub-set of those slices. To create a movie file, add $!EXPORTSETUP commands before this command. Required Parameters Parameter Syntax Default Notes START = <integer> START and END are measured in steps based on NUMSLICES between the slice group's start slice value (at step=1) and end slice values (at step = NumSlices). END = <integer> START and END are measured in steps based on NUMSLICES between the slice group's start slice value (at step=1) and end slice values (at step = NumSlices). NUMSLICES = <integer> Number of slices to distribute between the start and end slice locations as defined by START and END in $!SLICEATTRIBUTES. Optional Parameters Parameter Syntax Default Notes GROUP = <integer> 1 values 1- 8 CREATEMOVIEFILE = <boolean> NO If YES, must be preceded by $!EXPORTSETUP commands. LIMITSCREENSPEED = <boolean> MAXSCREENSPEED = <double> Go To, Loop, Bounce, Forward, and Backward are only used by the interface. Forward and Backward can be simulated using appropriate values STARTVALUE and ENDVALUE. If ENDVALUE < STARTVALUE, the animation goes 'backward'. If ENDVALUE > STARTVALUE, the animation goes 'forward'. Goto can be 65 simulated if ENDVALUE == STARTVALUE, i.e. the animation goes 'one step'. Loop and Bounce can be accomplished by calling the file multiple times. When recording, the macro recorded contains exactly the animation done in the interface. So if you bounce three times through the data, you will record three sets of forward and backwards commands. Similarly, if you use the "one step" options a lot, you will record a lot of individual macro commands. If you interrupt part way through an animation, you will record a partial animation macro of those steps you did animate through. Example: The following example creates an animation of 3D slices: $!ANIMATESLICES START = 1 END = 30 NUMSLICES = 30 $!ANIMATESTREAM Syntax: $!ANIMATESTREAM [optional parameters] Description:Produce an animation of stream markers or dashes, moving along the currently defined streamtrace paths. To create a movie file, add $!EXPORTSETUP commands before this command. Optional Parameters Parameter STEPSPERCYCLE Syntax Default Notes = <integer> 20 Number of steps to use for each cycle of the animation. Increase this number to produce a smoother animation. CREATEMOVIEFILE = <boolean> NO If YES, must be preceded by $!EXPORTSETUP commands NUMCYCLES = <integer> 3 Number of cycles in the animation. Each cycle shows stream markers or dashes, moving along a streamtrace path. If DT is the streamtrace delta time, then at the end of the cycle, the markers or dashes will have moved (2*DT*(STEPSPERCYCLE-1))/(STEPSPERCYCLE) in time. Example: The following example animates streamtraces for five cycles with each cycle using ten steps: $!ANIMATESTREAM STEPSPERCYCLE = 10 NUMCYCLES = 5 $!ANIMATETIME Syntax: $!ANIMATETIME [optional parameters] Description:Produce an animation of transient data. To create a movie file, add $!EXPORTSETUP commands before this command. 66 Optional Parameters: Parameter Syntax Default Notes CREATEMOVIEFILE = <boolean> NO If YES, must be preceded by $!EXPORTSETUP commands. ENDTIME = <double> The last timestep as defined by the currently active strands If the SolutionTime entered does not exist, the nearest SolutionTime less than the entered time is used. LIMITSCREENSPEED = <boolean> NO MAXSCREENSPEED = <double> 12 SKIP = <integer> 1 STARTTIME = <double> first time step as defined by the currently active strands only works if LIMITSCREENSPEED is YES If the SolutionTime entered does not exist, the nearest SolutionTime less than the entered time is used. Go To, Loop, Bounce, Forward, and Backward are only used by the interface. Forward and Backward can be simulated using appropriate values STARTVALUE and ENDVALUE. If ENDVALUE < STARTVALUE, the animation goes 'backward'. If ENDVALUE > STARTVALUE, the animation goes 'forward'. Goto can be simulated if ENDVALUE == STARTVALUE, i.e. the animation goes 'one step'. Loop and Bounce can be accomplished by calling the file multiple times. When recording a macro, that macro animates exactly as done in the interface. So if you bounce three times through the data, you will record three sets of forward and backwards commands. Similarly, if you use the "one step" options a lot, you will record a lot of individual macro commands. If you interrupt part way through an animation, you will record a partial animation macro of those steps you did animate through. $!ANIMATEZONES Syntax: $!ANIMATEZONES START = <integer> END = <integer> [optional parameters] Description:Produce an animation showing one zone at a time. To create a movie file, add $!EXPORTSETUP commands before this command. This command will not work if the active frame contains a transient data set. 67 Required Parameters Parameter Syntax Default Notes START = <integer> Starting zone number END = <integer> Ending zone number Optional Parameters Parameter Syntax Default Notes ZONEANIMATIONMODE = [STEPBYNUMB ER, GROUPSTEPBY NUMBER, STEPBYTIME] STEPBYNUMBE R CREATEMOVIEFILE = <boolean> NO If YES, must be preceded by $!EXPORTSETUP commands. SKIP = <integer> 1 Zone skip. Example: The following example animates just the first five zones: $!ANIMATEZONES START = 1 END = 5 $!ATTACHDATASET Syntax: $!ATTACHDATASET [optional parameter] Description:Attach the active frame to the data set of another frame. Use PAGENUM, if the other frame is on a difference page. This command is usually found only in layout files generated by Tecplot 360. Note that the $!PLOTTYPE command automatically executes an $!ATTACHDATASET command if a frame mode is requested in a frame that does not have an attached data set. Tecplot 360 attaches the data set from the closest frame (in drawing order) having an attached data set. Optional Parameter Parameter Syntax Default Notes FRAME = <integer> First frame with a data set Within the page specified or implied, if FRAME is not supplied, Tecplot 360 searches for a data set in a frame below the topmost frame of the page to attach. PAGENUM = <integer> current page If PAGENUM is not supplied the current page is used. Examples: Example 1: The following example attaches to the active frame the data set from the second frame drawn when doing a Redraw All: $!ATTACHDATASET FRAME = 2 68 Example 2: The following example attaches to the active frame the data set from the frame drawn next-to-last when doing a Redraw All: $!ATTACHDATASET $!ATTACHGEOM Syntax: $!ATTACHGEOM [optional parameters] <geometryrawdata> Description:Attach a geometry to the active frame. 69 Required Parameter Parameter Syntax Default Notes <geometryrawdata> This is the data which defines the size and relative shape of the geometry. This must be at the end of the command after any other parameters. Optional Parameters Parameter Syntax Default Notes ANCHORPOS <<anchorpos>> ARROWHEADANGLE = <dexp> = <arrowheadattachment> 12 = <dexp> = <arrowheadstyle> 5% ARROWHEADSTYLE ATTACHTOZONE = <boolean> NO CLIPPING = <clipping> CLIPTTOVIEWPORT COLOR = <color> BLACK DATATYPE = <fielddatatype> FLOAT DRAWORDER = <draworder> AFTERDATA FILLCOLOR = <color> WHITE GEOMTYPE = <geomtype> LINESEGS IMAGEFILENAME = <string> ISFILLED = <boolean> LINEPATTERN = <linepattern> SOLID LINETHICKNESS = <dexp> 0.1% Set the line thickness in Y-frame units (0-100). MACROFUNCTIONCOMMAND = <string> Null Set the macro command to execute when you hover over the geometry and press Ctrl-rightclick. For security reasons this command can only be used in the Tecplot 360 configuration file. MAINTAINASPECTRATIO = <boolean> YES NUMELLIPSEPTS = <integer> 72 Numbers of points to use when drawing ellipses and circles. PATTERNLENGTH = <dexp> 2% Set the pattern length in Y-frame units (0-100). POSITIONCOORDSYS = <coordsys> GRID RESIZEFILTER = <resizefilter> SCOPE = <scope> ARROWHEADATTACHMENT ARROWHEADSIZE TEXTUREFILTER ZONE This assigns the anchor position of the geometry. Set the angle for arrowheads (in degrees). NONE Set the arrowhead size in Y-frame units (0-100). PLAIN LOCAL If YES, must include ZONE. Set the scope to GLOBAL to draw this geometry in all “like” frames. CUBIC = <integer> 1 This is only used if ATTACHTOZONE = YES. This geometry is disabled if the zone assigned here is inactive. Examples: Example 1: The following example creates a red circle, with a radius equal to 25 percent of the height of the frame, in the center of the frame: $!ATTACHGEOM POSITIONCOORDSYS = FRAME ANCHORPOS { X = 50 Y = 50 70 } GEOMTYPE = CIRCLE COLOR = RED RAWDATA 25 Example 2: The following example creates an L-shaped polyline with an arrowhead at the end: $!ATTACHGEOM POSITIONCOORDSYS = FRAME ANCHORPOS { X = 20 Y = 80 } GEOMTYPE = LINESEGS ARROWHEADATTACHMENT = ATEND RAWDATA 1 3 0 0 0 -60 40 0 $!ATTACHTEXT Syntax: $!ATTACHTEXT TEXT = <string> [optional parameters] Description:Attach text to the active frame 71 Required Parameter Parameter TEXT Syntax Default = <string> Notes Text string to draw. Optional Parameters Parameter ANCHOR ANCHORPOS Syntax = <textanchor> <<anchorpos>> Default LEFT Notes Specifies what part of the text to anchor to the frame. This assigns the anchor position for the text. Units are dependent on POSITIONCOORDSYS. ANGLE = <dexp> 0.0 Text angle (in degrees). ATTACHTOZONE = <boolean> NO If YES, must include ZONE. BOX { BOXTYPE = <boxtype> NONE COLOR = <color> BLACK FILLCOLOR = <color> WHITE LINETHICKNESS = <dexp> 0.1% MARGIN = <dexp> 20 CLIPPING = <clipping> CLIPTOVIEWP ORT COLOR = <color> BLACK LINESPACING = <dexp> 1.0 Line spacing to use if text contains multiple lines. MACROFUNCTION = <string> NULL Set the macro command to execute when you hover over the geometry and press Ctrl-right-click. = <coordsys> FRAME values = FRAME, GRID or GRID3D The margin is the space between the text and box. The margin is measured in terms of the percentage of the text height. } COMMAND POSITIONCOORDSYS TEXTSHAPE { FONTFAMILY = <string> "Helvetica" ISBOLD = <boolean> YES ISITALIC = <boolean> NO HEIGHT = <dexp> 14 SIZEUNITS = <sizeunits> POINT The following combinations of SIZEUNITS and POSITIONCOORDSYS are allowed: FRAME/FRAME, POINT SCOPE = <scope> LOCAL Set the scope to GLOBAL to include this text in all “like” frames. ZONE = <integer> 1 This is only used if ATTACHZONE = YES. This text is disabled if the zone assigned here is inactive. } Examples: Example 1: The following example creates the text ABC and positions it in the lower left corner of the frame: $!ATTACHTEXT TEXT = "ABC" 72 Example 2: The following example creates the text TEXT AT AN ANGLE and places it in the center of the frame. The text is drawn at an angle of 45 degrees: $!ATTACHTEXT TEXT = "TEXT AT AN ANGLE" ANGLE = 45 ANCHORPOS {X=50 Y=50} Example 3: The following example creates the text TIMES-ROMAN using the Times Roman font. This text includes a text box: $!ATTACHTEXT TEXT = "TIMES-ROMAN" TEXTSHAPE { FONTFAMILY = "Times" ISBOLD = NO ISITALIC = NO } BOX { BOXTYPE = PLAIN MARGIN = 20 } ANCHORPOS {X=20 Y=20} B $!BASICCOLOR Syntax:$!BASICCOLOR [optional parameters] Description:A SetValue command that sets the red, green and blue components for any of the basic colors in Tecplot 360. 73 Optional Parameters Parameter Syntax Default BLACK <<rgb>> See Notes BLUE <<rgb>> See Notes CUSTOM1... <<rgb>> Notes R=0, G=0, B=0 R=45, G=45, B=255 The default varies. CUSTOM56 CYAN <<rgb>> See Notes R=0, G=255, B=255 GREEN <<rgb>> See Notes R=0, G=210, B=0 PURPLE <<rgb>> See Notes R=255, G=0, B=0 RED <<rgb>> See Notes R=210, G=0, B=0 WHITE <<rgb>> See Notes R=255, G=255, B=255 YELLOW <<rgb>> See Notes R=255, G=255, B=45 Example: Set the CUSTOM8 color to be brown: $!BASICCOLOR CUSTOM8 { R = 165 G = 42 B = 42 } $!BASICCOLORLEGEND Syntax: $!BASICCOLORLEGEND [optional parameters] Description:A SetValue command that allows you to create and set the style of a legend for the basic colors in Tecplot 360. The legend can be used to display any attribute of the plot represented by a basic color (for example, materials). Each frame maintains a mapping of basic colors to names. Each basic color actually used in selected layers of the plot appears in the legend unless it is excluded. 74 Optional Parameters Parameter ANCHORALIGNMENT Syntax Default Notes = TOPRIGHT <anchoralignment > BASICCOLORCONTROL Name may include dynamic text variables (for example, to incoproate auxiliary data) { BLACK <<basiccolorcontrol See notes >> NAME = ’’, SHOW = YES BLUE <<basiccolorcontrol See notes >> NAME = ’’, SHOW = YES CUSTOM1... CUSTOM56 <<basiccolorcontrol See notes >> NAME = ’’, SHOW = YES CYAN <<basiccolorcontrol See notes >> NAME = ’’, SHOW = YES GREEN <<basiccolorcontrol See notes >> NAME = ’’, SHOW = YES PURPLE <<basiccolorcontrol See notes >> NAME = ’’, SHOW = YES RED <<basiccolorcontrol See notes >> NAME = ’’, SHOW = YES WHITE <<basiccolorcontrol See notes >> NAME = ’’, SHOW = YES YELLOW <<basiccolorcontrol See notes >> NAME = ’’, SHOW = YES } BOX <<textbox>> See notes FIELDLAYERCONTROL BOXTYPE = HOLLOW, MARGIN = 10, LINETHICKNESS = 0.1, COLOR = BLACK, FILLCOLOR = WHITE Determines which field layers’ colors are included in legend { USEMESH = <boolean> NO USECONTOUR = <boolean> NO USEVECTOR = <boolean> NO USESCATTER = <boolean> NO USESHADE = <boolean> NO USEEDGE = <boolean> NO } HEADERTEXT = <string> HEADERTEXTCOLOR = <color> BLACK HEADERTEXTSHAPE <<textshape>> See notes LABELTEXTCOLOR = <color> BLACK LABELTEXTSHAPE <<textshape>> See notes May include dynamic text variables LINELAYERCONTROL FONTFAMILY = ’Helvetica’, ISBOLD = YES, ISITALIC = NO, SIZEUNITS = FRAME, HEIGHT = 2.5 FONTFAMILY = ’Helvetica’, ISBOLD = NO, ISITALIC = NO, SIZEUNITS = FRAME, HEIGHT =2.5 Determines which line layers’ colors are included in legend { USELINES = <boolean> NO USESYMBOLS = <boolean> NO USEBARS = <boolean> NO USEERRORBARS = <boolean> NO } ROWSPACING <op> <dexp> = 1.2 SHOW = <boolean> NO SHOWSYMBOLOUTLINE = <boolean> YES SORTBYLABELTEXT = <boolean> YES SYMBOLHEIGHT = <dexp> 2.5 75 Parameter Syntax Default SYMBOLLINETHICKNESS = <dexp> 0.1 SYMBOLWIDTH = <dexp> 2.5 XYPOS <<xy>> X = 95, Y = 75 Notes Example: Create a basic color legend for a fruity plot: $!BASICCOLORLEGEND SHOW = YES LINELAYERCONTROL { USELINES = YES } XYPOS { X = 70 Y = 80 } HEADERTEXT = '&(ZoneName[1])' BOX { BOXTYPE = FILLED } BASICCOLORCONTROL { BLACK { SHOW = NO } RED { NAME = 'Apple' } GREEN { NAME = 'Bean' } BLUE { NAME = 'Blueberry' } CYAN { NAME = 'Kiwi' } YELLOW { NAME = 'Banana' } PURPLE { NAME = 'Grape' } } $!BASICSIZE Syntax: $!BASICSIZE [optional parameters] Description:A SetValue command that sets sizes of various objects like line thicknesses, line pattern length, 76 font height, and so forth. Sizes can be assigned when interacting with Tecplot 360 by either entering an exact value or by choosing from a preset list of values. The $!BASICSIZE command allows you to change the values in the preset lists. Optional Parameters Parameter Syntax Default Notes ARROWHEADSIZES <<basicsizelist>> See Notes FRAMETEXTSIZES <<basicsizelist>> See Notes Tiny=1.5, Small=2.0, Medium=3.0, Large=6.0, Huge=10.0 LINEPATLENGTHS <<basicsizelist>> See Notes Tiny=0.5, Small=0.8, Medium=2.0, Large=3.0, Huge=5.0 LINETHICKNESSES <<basicsizelist>> See Notes Tiny=0.02, Small=0.1, Medium=0.4, Large=0.8, Huge=1.5 POINTTEXTSIZES <<basicsizelist>> See Notes Tiny=8, Small=11, Medium=14, Large=28, Huge=50 SYMBOLSIZES <<basicsizelist>> See Notes Tiny=0.5, Small=1.0, Medium=2.5, Large=4.0, Huge=8.0 TICKLENGTHS <<basicsizelist>> See Notes Tiny=0.5, Small=1.2, Medium=2.0, Large=3.0, Huge=5.0 Tiny=1.0, Small=3.0, Medium=5.0, Large=8.0, Huge=12.0 Example: Change the medium line pattern length to be 2.5 percent: $!BASICSIZE LINEPATLENGTHS { MEDIUM = 2.5 } $!BLANKING Syntax: $!BLANKING [optional parameters] Description:A SetValue command that changes settings for IJK- or value-blanking. 77 Optional Parameters Parameter Syntax Default Notes DEPTH { INCLUDE = <boolean> NO If YES, draws only those portions at the plot with depth values within the FROMFRONT and FROMBACK limits. FROMFRONT = <double> 0 FROMFRONT and FROMBACK are expressed as percentages of the overall 3D depth. FROMBACK = <double> 0 FROMFRONT and FROMBACK are expressed as percentages of the overall 3D depth. NO } IJK { INCLUDE = <boolean> IJKBLANKMODE <op> <boolean> IMINFRACT = <ijkblankmode> 0 JMINFRACT <op> <dexp> =0 KMINFRACT <op> <dexp> =0 IMAXFRACT <op> <dexp> = 50 JMAXFRACT <op> <dexp> = 50 KMAXFRACT <op> <dexp> = 50 ZONE = <integer> 0 Only one zone can be assigned to use IJK-blanking. BLANKENTIRECELL = <boolean> YES Set to NO to get precision-blanking. CONSTRAINT nnn nnn = <integer> 1 Use <integer> to specify which constraint to modify. COLOR = <color> BLACK CONSTRAIN TOP2MODE = <constrainintop2 mode> USECONSTAN T INCLUDE = <boolean> NO LINEPATTERN = <linepattern> SOLID LINETHICKNESS = <double> 0.4 PATTERNLENGTH = <dexp> 2 RELOP = <valueblankrelo p> LESSTHANORE QUAL SHOW = <boolean> NO VALUECUTOFF = <double> 0 VARA = <integer> None VARB = <integer> None INCLUDE = <boolean> NO VALUEBLANKCELLMO DE = <valueblankcell mode> ANY CORNER Minimum and maximum fractions are in terms of percentages (0-100). Zero represents an index of one and 100 the maximum index. } VALUE { { } } Examples: 78 Set to NO to turn off all value-blanking. Example 1: Set IJK-blanking to cut away the minimum index corner: $!BLANKING IJK { INCLUDE IMINFRACT JMINFRACT KMINFRACT IMAXFRACT JMAXFRACT KMAXFRACT } = = = = = = = YES 0 0 0 50 50 50 Example 2: Use value blanking to cut away all cells that have at least one node where variable 3 is less than or equal to 7.5: $!BLANKING VALUE { INCLUDE = YES CONSTRAINT 1 { INCLUDE = YES VARA = 3 RELOP = LESSTHANOREQUAL VALUECUTOFF = 7.5 } } $!BRANCHCONNECTIVITY Syntax: $!BRANCHCONNECTIVITY ZONE = <integer> [no optional parameters] Description:For zones where connectivity is shared, this command allows for branching of connectivity information from the specified zone. Required Parameters Parameter ZONE Syntax Default Notes = <integer> Example: Suppose Zones 2, 3 and 4 share connectivity. This command branches the connectivity of the second zone. Zones 3 and 4 will still share connectivity. $!BRANCHCONNECTIVITY ZONE = 2 79 $!BRANCHFIELDDATAVAR Syntax: $!BRANCHFIELDDATAVAR ZONE = <integer> VAR = <integer> [no optional parameters] Description:Allows for branching of specified variable in the specified zone for zones that share variables. Required Parameters Parameter Syntax VAR = <integer> ZONE = <integer> Default Syntax Example: Assume Zones 1, 2 and 4 share variables 3 and 5. This command branches the third variable from the second zone. Variable 3 will still be shared by zones 1 and 4, while variable 5 will still be shared by all three zones.: $!BRANCHFIELDDATAVAR ZONE = 2 VAR = 3 $!BREAK Syntax: $!BREAK [no parameters] Description:Jump out of the current $!LOOP-ENDLOOP or $!WHILE-$!ENDWHILE. Example: $!LOOP 5 $!BREAK $!ENDLOOP C $!COLORMAPCONTROL [<groupnumber>] [Required-Control Option] Description:The different commands in the COLORMAPCONTROL compound function family are described separately in the following sections. Group number is an optional parameter ranging from 1 to 8, which defaults to 1 when omitted. The COLORMAPCONTROL compound functions are: $!COLORMAPCONTROL [<groupnumber>] REDISTRIBUTECONTROLPOINTS $!COLORMAPCONTROL [<groupnumber>] COPYSTANDARD $!COLORMAPCONTROL [<groupnumber>] RESETTOFACTORY 80 $!COLORMAPCONTROL [<groupnumber>] REDISTRIBUTECONTROLPOINTS Syntax: $!COLORMAPCONTROL [<groupnumber>] REDISTRIBUTECONTROLPOINTS [no parameters] Description:Redistribute the control points for the currently active color map so they are evenly spaced across the color map. This is equivalent to clicking Redistribute Control Points in the Color Map dialog. This does not change the RGB values assigned at each control point. Group number is an optional parameter ranging from 1 to 8, which defaults to 1 when omitted. Example: $!COLORMAPCONTROL REDISTRIBUTECONTROLPOINTS $!COLORMAPCONTROL [<groupnumber>] COPYSTANDARD Syntax: $!COLORMAPCONTROL [<groupnumber>] COPYSTANDARD CONTOURCOLORMAP = <standardcolormap> Description:Preset either the user-defined color map or the raw user-defined color map to be a copy of one of the standard color maps. Tecplot 360 must currently be using either the user-defined color map or the raw user-defined color map in order to use this function. Group number is an optional parameter ranging from 1 to 8, which defaults to 1 when omitted. Required Parameter Parameter CONTOURCOLORMAP Syntax = Default LGRAINBOW Notes The color map to copy. <standardcolormap> Example: The following example sets the current color map to be a copy of the small rainbow color map: $!COLORMAPCONTROL COPYSTANDARD CONTOURCOLORMAP = SMRAINBOW $!COLORMAPCONTROL [<groupnumber>] RESETTOFACTORY Syntax: $!COLORMAPCONTROL [<groupnumber>] RESETTOFACTORY [no parameters] Description:Redistribute the control points and reset the RGB values for the currently active color map. This is equivalent to clicking Reset on the Color Map dialog. Group number is an optional parameter ranging from 1 to 8, which defaults to 1 when omitted. Example: $!COLORMAPCONTROL RESETTOFACTORY $!COMPATIBILITY Syntax: $!COMPATIBILITY [optional parameters] 81 Description:Allow datasharing access and setting, without warning. Optional Parameters Parameter Syntax Default Notes ALLOWDATASHARING = <boolean> YES If NO, Tecplot 360 will not allow data sharing. This may be necessary to use older add-ons that cannot handle shared data. ALLOWOLDTEXT = <boolean> NO If NO, allows Tecplot 360 to display text subscripts and superscripts created with older Tecplot 360 versions without automatically converting the text to the new formatting. FORMATTING Example: The following commands turn on datasharing: $!COMPATIBILITY ALLOWDATASHARING=YES $!CONTINUE Syntax: $!CONTINUE Description:Transfer control back to nearest $!LOOP or $!WHILE. Example: $!LOOP 10 $!CONTINUE $!ENDLOOP $!CONTOURLABELS [Required-Control Option] Description:The different commands in the CONTOURLABELS compound function family are described separately in the following sections. The CONTOURLABELS compound functions are: $!CONTOURLABELS ADD $!CONTOURLABELS DELETEALL $!CONTOURLABELS ADD Syntax: $!CONTOURLABELS ADD [optional parameters] Description:Add contour labels to your plot. 82 Optional Parameters Parameter Syntax Default Notes CONTOURGROUP = <integer> 1 Defines which contour group is changed. ISALIGNED = <boolean> YES If YES then align the contour label along the contour line; if NO, draw the label horizontally. X-position for contour label. XYZPOS { X = <dexp> 0.0 Y = <dexp> 0.0 Y-position for contour label. Z = <dexp> 0.0 Z-position for contour label (use Z only for 3D plots). } Example: The following commands add labels at (0.5, 0.25) and (0.73, 0.17) in a 2-D field plot. ## The labels will be aligned: $!CONTOURLABELS ADD CONTOURGROUP = 2 XYZPOS { X = 0.5 Y = 0.25 } $!CONTOURLABELS ADD XYZPOS { X = 0.73 Y = 0.17 } $!CONTOURLABELS DELETEALL Syntax: $!CONTOURLABELS DELETEALL [optional parameters] Description:Delete all currently defined contour labels. Optional Parameters Parameter CONTOURGROUP Syntax = <integer> Default 1 Notes Defines which contour group is changed. Example: $!CONTOURLABELS DELETEALL CONTOURGROUP = 3 $!CONTOURLEVELS [Required-Control Option] Description:The different commands in the CONTOURLEVELS compound function family are described separately in the following sections. The CONTOURLEVELS compound functions are: 83 $!CONTOURLEVELS $!CONTOURLEVELS $!CONTOURLEVELS $!CONTOURLEVELS $!CONTOURLEVELS $!CONTOURLEVELS ADD NEW DELETENEAREST DELETERANGE RESET RESETTONICE $!CONTOURLEVELS ADD Syntax: $!CONTOURLEVELS ADD <contourlevelrawdata> [optional parameters] Description:Add a new set of contour levels to the existing set of contour levels. Required Parameter Parameter Syntax Default <contourlevelrawdata > Notes Supply a list of contour levels to add. Optional Parameters Parameter CONTOURGROUP Syntax = <integer> Default 1 Notes Defines which contour group is changed. Example: Add contour levels 1.7, 3.4 and 2.9 to the plot: $!CONTOURLEVELS ADD RAWDATA 3 1.7 3.4 2.9 $!CONTOURLEVELS DELETENEAREST Syntax: $!CONTOURLEVELS DELETENEAREST RANGEMIN = <dexp> [optional parameters] Description:Delete the contour level whose value is nearest the value supplied in the RANGEMIN parameter. 84 Required Parameter Parameter RANGEMIN Syntax Default = <dexp> Notes Delete the contour level whose value is nearest to this value. Optional Parameters Parameter CONTOURGROUP Syntax = <integer> Default 1 Notes Defines which contour group is changed. Example: Delete the contour level whose value is nearest to 3.4: $!CONTOURLEVELS DELETENEAREST RANGEMIN = 3.4 $!CONTOURLEVELS DELETERANGE Syntax: $!CONTOURLEVELS DELETERANGE RANGEMIN = <dexp> RANGEMAX = <dexp> [optional parameters] Description:Delete all contour levels between a minimum and maximum contour value (inclusive). Required Parameters Parameter Syntax Default Notes RANGEMIN = <dexp> Minimum contour level to delete. RANGEMAX = <dexp> Maximum contour level to delete. Optional Parameters Parameter CONTOURGROUP Syntax = <integer> Default 1 Notes Defines which contour group is changed. Example: Delete all contour levels between 0.1 and 0.7: $!CONTOURLEVELS DELETERANGE RANGEMIN = 0.1 RANGEMAX = 0.7 $!CONTOURLEVELS NEW Syntax: $!CONTOURLEVELS NEW <contourlevelrawdata> [optional parameters] Description:Replace the current set of contour levels with a new set. 85 Required Parameter Parameter Syntax Default <contourlevelrawdata > Notes Supply a list of contour levels to add. Optional Parameters Parameter CONTOURGROUP Syntax = <integer> Default 1 Notes Defines which contour group is changed. Example: Replace the current set of contour levels with the levels 0.5, 0.75 and 1.0: $!CONTOURLEVELS NEW RAWDATA 3 0.5 0.75 1.0 $!CONTOURLEVELS RESET Syntax: $!CONTOURLEVELS RESET NUMVALUES = <integer> [optional parameters] Description:Reset the contour levels to a set of evenly distributed values spanning the entire range of the currently selected contouring variable. Required Parameter Parameter NUMVALUES Syntax Default = <integer> Notes New number of contour levels. Optional Parameters Parameter CONTOURGROUP Syntax = <integer> Default 1 Notes Defines which contour group is changed. Example: Reset the contour levels to use 150 levels: $!CONTOURLEVELS RESET NUMVALUES = 150 $!CONTOURLEVELS RESETTONICE Syntax: $!CONTOURLEVELS RESETTONICE APPROXNUMVALUES = <integer> [optional parameters] Description:Reset the contour levels to a set of evenly distributed, nice values spanning the entire range of the currently selected contouring variable, with a specified number of entries. 86 Required Parameter Parameter APPROXNUMVALUES Syntax Default = <integer> Notes Approximate number of contour levels desired. Actual value may be different. Optional Parameters Parameter CONTOURGROUP Syntax = <integer> Default 1 Notes Defines which contour group is changed. Example: Reset the contour levels to use 150 levels: $!CONTOURLEVELS RESETTONICE APPROXNUMVALUES = 10 $!CREATECIRCULARZONE Syntax: $!CREATECIRCULARZONE IMAX = <integer> JMAX = <integer> [optional parameters] Description:Create a circular (or cylindrical) IJ- or IJK-ordered zone. $!CREATEBOUNDARYZONES Syntax: $!CREATEBOUNDARYZONES <boolean> [optional parameters] Description:When YES, boundary zones are created. Use this command when working with StarCCM data to preserve backward compatibility. (StarCCM Loader ONLY) 87 Required Parameters Parameter Syntax Default Notes IMax = <integer> Radial direction. JMax = <integer> Circumferential direction, must be greater than 3. Optional Parameters Parameter Syntax Default Notes DATATYPE = <datatype> SINGLE KMax = <integer> 1 RADIUS = <dexp> 1 X = <dexp> 0 X-coordinate for center. XVAR = <integer> Auto Only needed when processing journal instructions. Y = <dexp> 0 Y-coordinate for center. YVAR = <integer> Auto Only needed when processing journal instructions. Z1 = <dexp> 0 Z-minimum if a cylinder is created. Z2 = <dexp> 1 Z-maximum if a cylinder is created. ZVAR = <integer> Auto Only needed when processing journal instructions. Bottom to top direction Examples: Example 1: Create a circular 10 by 20 IJ-ordered zone centered at (5, 5) with a radius of 2: $!CREATECIRCULARZONE IMax = 10 JMax = 20 X = 5 Y = 5 RADIUS = 2 Example 2: Create a cylindrical 5 by 6 by 8 IJK-ordered zone with the bottom centered at (4, 4, 0) and the top centered at (4, 4, 7) and a radius of 3: $!CREATECIRCULARZONE IMax = 5 JMax = 6 KMax = 8 X = 4 Y = 4 Z1 = 0 Z2 = 7 RADIUS = 3 $!CREATECONTOURLINEZONES Syntax: $!CREATECONTOURLINEZONES [group] [optional parameters] Description:Create zones from the currently-defined contour lines. One zone can be created from each contour level in that plot, or one zone for every polyline can be generated. 88 Optional Parameters Parameter Syntax Default AUTOSTRANDTRANSIENTDATA = <boolean> CONTLINECREATEMODE = [ONEZONEPERCONTOURLEVEL or ONEZONEPERINDEPENDENTPOLYLINE Notes YES If set to YES, time strands are automatically created for transient data in the new zone. Select whether one zone per contour lever will be created or whether there will be a zone for each polyline. Example: Create a new zone for each contour line on an existing contour plot. $!CREATECONTOURLINEZONES CONTLINECREATEMODE = ONEZONEPERCONTOURLEVEL $!CREATEFEBOUNDARY Syntax: $!CREATEFEBOUNDARY SOURCEZONE = <integer> [optional parameters] Description:Zone edges for finite element data cannot be turned on or off using the edge plot layer in Tecplot 360. You can, however, create a separate zone which is the boundary of a finite element zone. This new zone can then be turned on or off. Required Parameter Parameter Syntax SOURCEZONE Default = <integer> Notes Zone to extract the boundary from. Optional Parameters Parameter Syntax AUTOSTRANDTRANSIENTDATA = <boolean> YES Default If set to YES, time strands are automatically created for transient data in the new zone. Notes REMOVEBLANKEDSURFACES = <boolean> NO Set to YES if you want the resulting zone to include only the boundary adjacent to non-blanked cells. Example: Create an FE-boundary zone from zone 3: $!CREATEFEBOUNDARY SOURCEZONE = 3 $!CREATEFESURFACEFROMIORDERED Syntax: $!CREATEFESURFACEFROMIORDERED SOURCEZONES = <set> [optional parameters] Description:A FE-Surface zone can be generated from two or more I-Ordered zones. To get the best possible output, it is recommended that the source zones should have their nodes arranged in a similar manner so that the connecting lines between points are as straightforward as possible. For this reason, indices from source zones should increase in the same direction. 89 Required Parameter Parameter Syntax SOURCEZONES Default = <set> Notes Zones whose points will be used to create the new surface. Optional Parameters Parameter Syntax Default Notes AUTOSTRANDTRANSIENTDATA = <boolean> YES If set to YES, time strands are automatically created for transient data in the new zone. CONNECTSTARTTOEND = <boolean> NO YES allows for closed surfaces. Example: Create an FE-Surface zone from zones 3 and 4: $!CREATEFESURFACEFROMIORDERED SOURCEZONES = [3-4] $!CREATEISOZONES Syntax: $!CREATEISOZONES [optional parameters] Description:Create zones from the currently defined iso-surfaces. One zone will be created from each defined iso-surface. The iso-surfaces must be active and you must have at least one active volume zone. Optional Parameter Parameter Syntax AUTOSTRANDTRANSIENTDATA = <boolean> Default YES Notes If set to YES, time strands are automatically created for transient data in the new zone. Example: $!CREATEISOZONES $!CREATELINEMAP Syntax: $!CREATELINEMAP [no parameters] Description:Create a new Line-mapping. Example: $!CREATELINEMAP $!CREATEMIRRORZONES Syntax: $!CREATEMIRRORZONES SOURCEZONES = <set> [optional parameters] Description:Create new zones that are mirror images of the source zones 90 Required Parameter Parameter SOURCEZONES Syntax Default = <set> Notes Zone(s) to create mirror zone(s) from. Optional Parameter Parameter Syntax MIRRORVAR = <mirrorvar> MIRRORVARS = <set> Default ‘X’ Notes This variable in the new zone is multiplied by -1 after the zone is copied. (Mutually exclusive with MIRRORVARS.) Set of variables in the new zone to be multiplied by -1 after the zone is copied. (Mutually exclusive with MIRRORVAR.) Example: Create a mirror of zones 2-4 across the Y-axis (that is, mirror the X-variable) in 2D frame mode: $!CREATEMIRRORZONES SOURCEZONES = [2-4] MIRRORVAR = ’X’ $!CREATENEWFRAME Syntax: $!CREATENEWFRAME [optional parameters] Description:Creates a new frame. Optional Parameters Parameter Syntax Default Notes HEIGHT = <dexp> 8 Units are in inches. XYPOS <<xy>> X = 1.02 Y = 0.25 Units are in inches; relative to the top left edge of the paper WIDTH = <dexp> 9 Units are in inches. The default position and size of the initial frame created when Tecplot 360 starts up can be changed in the Tecplot 360 configuration file. Example: The following example creates a 5- by 5-inch frame with the upper left hand corner of the frame positioned 2 inches from the left edge of the paper and 1 inch from the top: $!CREATENEWFRAME XYPOS { X = 2 Y = 1 } WIDTH = 5 HEIGHT = 5 $!CREATERECTANGULARZONE Syntax: $!CREATERECTANGULARZONE [optional parameters] 91 Description:Create a rectangular zone. If no data set exists when this command is executed, a data set is created with variables X, Y (and Z, if KMax > 1). If a data set exists prior to this command, the noncoordinate variables for the zone created are initialized to zero. Optional Parameters Parameter Syntax Default Notes IMax = <integer> 1 JMax = <integer> 1 J-dimension. KMax = <integer> 1 K-dimension. X1 = <dexp> 0 X-minimum. Y1 = <dexp> 0 Y-minimum. Z1 = <dexp> 0 Z-minimum. X2 = <dexp> 1 X-maximum. Y2 = <dexp> 1 Y-maximum. Z2 = <dexp> 1 Z-maximum. XVAR = <integer> Auto Only needed when processing journal instructions. YVAR = <integer> Auto Only needed when processing journal instructions. ZVAR = <integer> Auto Only needed when processing journal instructions. DATATYPE = <datatype> SINGLE I-dimension. Example: Create a rectangular IJ-ordered zone dimensioned 20 by 30 where X ranges from 0 to 3 and Y from 3 to 9: $!CREATERECTANGULARZONE IMax = 20 JMax = 30 X1 = 0 Y1 = 3 X2 = 3 Y2 = 9 $!CREATESIMPLEZONE Syntax: $!CREATESIMPLEZONE <xyrawdata> [optional parameters] Description:Create a new zone by specifying only a list of XY-pairs of data. If other zones exist prior to using this function and there are more than 2 variables, then the additional variables are also created and set to zero. 92 Required Parameter Parameter Syntax Default <xyrawdata> Notes See Chapter 13: “Raw Data” for details. Optional Parameter Parameter Syntax DATATYPE = <datatype> Default Notes SINGLE Example: Create a simple XY-zone that has the XY-pairs (1, 0), (2, 1), (3, 7) and (5 9): $!CREATESIMPLEZONE RAWDATA 4 1 0 2 1 3 7 5 9 $!CREATESLICEZONEFROMPLANE Syntax: $!CREATESLICEZONEFROMPLANE [optional parameters] Description:Create a new zone as a slice through existing 3D volume zones. Use $!GLOBALTHREED to define the slicing plane orientation. Optional Parameters Parameter Syntax Default AUTOSTRANDTRANSIENTDATA = <boolean> YES FORCEEXTRACTIONTO = <boolean> YES = <slicesource> VOLUMEZONES Notes If set to YES, time strands are automatically created for transient data in the new zone. SINGLEZONE SLICESOURCE Example: Create a slice zone at X=0: $!GLOBALTHREED SLICE { ORIGIN {X=0} NORMAL { X=1 Y=0 Z=0 } } $!CREATESLICEZONEFROMPLANE SLICESOURCE=VOLUMEZONES 93 $!CREATESLICEZONES Syntax: $!CREATESLICEZONES [optional parameter] Description:Create a new zone for each slice defined on the Slice Details dialog. Only creates slices from volume zones. Optional Parameter Parameter Syntax AUTOSTRANDTRANSIENTDATA = <boolean> Default YES Notes If set to YES, time strands are automatically created for transient data in the new zone. Example: $!GLOBALCONTOUR VAR = 4 $!SLICEATTRIBUTES ENDPOSITION {X = 1} $!SLICEATTRIBUTES STARTPOSITION {X = 6} $!SLICEATTRIBUTES NUMITERMEDIATESLICES = 6 $!SLICEATTRIBUTES SHOWBEGINENDSLICE = YES $!SLICEATTRIBUTES SHOWINTERMEDIATESLICES = YES $!REDRAW $!CREATESLICEZONES $!CREATESPHERICALZONE Syntax: $!CREATECIRCULARZONE IMAX = <integer> JMAX = <integer> [optional parameters] Description:Create a spherical IJK-ordered zone. Required Parameters Parameter Syntax Default Notes IMax = <integer> Psi direction. JMax = <integer> Theta direction. Optional Parameters Parameter Syntax Default Notes DATATYPE = <datatype> SINGLE RADIUS = <dexp> 1 X = <dexp> 0 X-coordinate for center. XVAR = <integer> Auto Only needed when processing journal instructions. Y = <dexp> 0 Y-coordinate for center. YVAR = <integer> Auto Only needed when processing journal instructions. Z = <dexp> 0 Z-coordinate for center. ZVAR = <integer> Auto Only needed when processing journal instructions. Examples: 94 Example 1: Create a spherical 10 by 20 IJ-ordered zone centered at (5, 5) with a radius of 2: $!CREATESPHERICALZONE IMax = 10 JMax = 20 X = 5 Y = 5 RADIUS = 2 $!CREATESTREAMZONES Syntax: $!CREATESTREAMZONES [optional parameters] Description:Create one or more zones out of the currently defined streamtraces. The new zones have the same number of variables per data point as the other zones in the data set with all non-coordinate variables interpolated at the positions along the streamtrace. Optional Parameters Parameter Syntax AUTOSTRANDTRANSIENTDATA = <boolean> YES Default If set to YES, time strands are automatically created for transient data in the new zone. Notes CONCATENATE = <boolean> NO Set to YES to create a single zone out of all common streamtraces. The cell that connects the end of one streamtrace with the beginning of the next can later be turned off using value-blanking. Example: Create a single zone out of all common streamzones: $!CREATESTREAMZONES CONCATENATE = YES D $!DATASETUP Syntax: $!DATASETUP [optional parameters] Description:A SetValue command that sets miscellaneous parameters related to data. 95 Optional Parameters Parameter Syntax Default Notes COMMANDLINE { AutoStrandDataFiles = <boolean> } YES This option allows you to autostrand data files in Tecplot 360. This can be set to NO or commented-out of the configuration file (tecplot.cfg) to retain the Tecplot 10 compatibility SCRATCHDATAFIELDTYPE = <datatype> Set the data type for scratch arrays used for geometries line segments and other lines. The default is SINGLE for Windows and DOUBLE for UNIX®. This parameter can only be used in the Tecplot 360 configuration file. PREPLOTARGS = <string> Arguments used to run the included Preplot executable. Preplot is used to convert ASCII datafiles when they are read directly into Tecplot 360. See Section B - 4 “Preplot” in the User’s Manual for more information on Preplot and its options. Example: Change the arguments used to Preplot ASCII files so only zones 1, 2, and 3 are processed: $!DATASETUP PREPLOTARGS = "-zonelist 1:3" $!DEFAULTGEOM Syntax: $!DEFAULTGEOM [optional parameters] Description:A SetValue command that sets the attributes for the default geometry. When a geometry is created interactively, its color, line thickness, and so forth, are preset based on the default geometry. This command is usually used only in the Tecplot 360 configuration file. 96 Optional Parameters Parameter Syntax ANCHORPOS <<xyz>> ARROWHEADANGLE ARROWHEADATTACHMENT <op> <dexp> <arrowheadattachment> ARROWHEADSIZE <op> <dexp> ARROWHEADSTYLE <arrowheadstyle> ATTACHTOZONE = <boolean> COLOR = <color> DATATYPE = <fielddatatype> Default DRAWORDER = <draworder> AFTERDATA DRAWORDER = <draworder> AFTERDATA FILLCOLOR = <color> ISFILLED = <boolean> LINEPATTERN = <linepattern> LINETHICKNESS <op> <dexp> MACROFUNCTIONCOMMAND = <string> MAINTAINASPECTRATIO = <boolean> NUMELLIPSEPTS <op> <integer> PATTERNLENGTH <op> <dexp> PIXELASPECTRATIO = <double> POSITIONCOORDSYS = <coordsys> SCOPE = <scope> ZONE = <integer> Notes Set the macro command to execute when you hover over the geometry and press Ctrl-right-click. YES 0 A value of 0 allows Tecplot 360 to select the aspect ratio.Use only if your circles or squares due to the aspect ratio of your monitor. Example: Make the default geometry line thickness 0.2 percent: $!DEFAULTGEOM LINETHICKNESS = 0.2 $!DEFAULTTEXT Syntax: $!DEFAULTTEXT [optional parameters] Description:A SetValue command that sets the attributes for the default text. When text is added to a plot interactively, its font, color, size, and so forth, are based on the default text. This command is usually used only in the Tecplot 360 configuration file. 97 Optional Parameters Parameter ANCHOR Syntax Default Notes = <textanchor> ANCHORPOS <<xy>> ANGLE <op><dexp> ATTACHTOZONE = <boolean> BOX <<textbox>> CLIPPING = <clipping> COLOR = <color> LINESPACING <op><dexp> MACROFUNCTION = <string> COMMAND POSITIONCOORDSYS = <coordsys> SCOPE = <scope> TEXTSHAPE <<textshape>> ZONE <op><integer> Set the macro command to execute when you hover over the geometry and press Ctrl-right-click. Example: Make the default text font Times bold with a character height of 14 points: $!DEFAULTTEXT TEXTSHAPE { FONTFAMILY = "Times" ISBOLD = YES ISITALIC = NO SIZEUNITS = POINT HEIGHT = 14 } $!DELAY Syntax: $!DELAY <integer> [no parameters] Description:Delay Tecplot 360 execution for <integer> seconds. Example: Pause Tecplot 360 for 3 seconds: $!DELAY 3 $!DELETEAUXDATA Syntax: $!DELETEAUXDATA AUXDATALOCATION = [zone/var/dataset/frame/linemap|page] [optional parameters] Description:Delete Auxiliary Data in the form of name/value pairs from zones, frames or datasets. 98 Required Parameters Parameter AUXDATALOCATION Syntax Default Notes Default Notes = [zone/var/ dataset/frame/ linemap|page] Optional Parameters Parameter Syntax NAME = <string> NUM = <integer> VAR = <integer> ZONE = <integer> Only required if AUXDATALOCATION = zone Example: Delete the selected Auxiliary Data from Zone 2.: $!DELETEAUXDATA AUXDATALOCATION = zone ZONE = 2 NAME = VARIABLE DATA $!DELETELINEMAPS Syntax: $!DELETEMAPS <set> [no parameters] Description:Delete one or more Line-mappings. If <set> is omitted then all Line-mappings are deleted. Example: Delete Line-mappings 2, 3, 4 and 8: $!DELETELINEMAPS [2-4,8] $!DELETEVARS Syntax: $!DELETEVARS <set> [no parameters] Description:Delete one or more variables. Example: Delete variables 4 and 10: $!DELETEVARS [4,10] $!DELETEZONES Syntax: $!DELETEZONES <set> [no parameters] Description:Delete one or more zones. 99 Example: Delete zones 3, 7, 8, 9 and 11: $!DELETEZONES [3,7-9,11] $!DOUBLEBUFFER [Required-Control Option] Description:The different commands in the DOUBLEBUFFER compound function family are described separately in the following sections. The DOUBLEBUFFER compound functions are: $!DOUBLEBUFFER OFF $!DOUBLEBUFFER ON $!DOUBLEBUFFER SWAP $!DOUBLEBUFFER OFF Syntax: $!DOUBLEBUFFER OFF [no parameters] Description:Turn off double buffering; use this command once at the end of a sequence of using the double buffer. Example: See $!DOUBLEBUFFER SWAP $!DOUBLEBUFFER ON Syntax: $!DOUBLEBUFFER ON [no parameters] Description:Turn on double buffering; use this command once at the beginning of a sequence of using the double buffer. While double buffering is turned on all drawing is sent to the back buffer. Example: See $!DOUBLEBUFFER SWAP $!DOUBLEBUFFER SWAP Syntax: $!DOUBLEBUFFER SWAP [no parameters] Description:Swap the back buffer to the front. In other words, copy the image in the back buffer to the front. Example: The following example uses the double buffer to show the rotation of a 3-D object: $!DOUBLEBUFFER $!LOOP 10 $!ROTATE3DVIEW ANGLE = 5 $!REDRAW $!DOUBLEBUFFER $!ENDLOOP $!DOUBLEBUFFER 100 ON X SWAP OFF $!DRAWGRAPHICS Syntax: $!DRAWGRAPHICS <boolean> [no parameters] Description:Turn on or off all graphics drawing. Turning off all graphics during preliminary portions of a macro file can greatly increase the efficiency of the macro. Example: Turn off all graphics drawing: $!DRAWGRAPHICS NO $!DROPDIALOG Syntax: $!DROPDIALOG <dialogname> [no parameters] Description:Drop a Tecplot 360 interface dialog. This command is mainly useful for the Tecplot 360 demo. To launch a dialog use $!LAUNCHDIALOG. Example: $!DROPDIALOG MACROVIEWER $!DUPLICATELINEMAP Syntax: $!DUPLICATELINEMAP SOURCEMAP = <integer> DESTINATIONMAP = <integer> [no optional parameters] Description:Copy attributes from an existing Line-mapping to another. Required Parameters Parameter Syntax Default Notes DESTINATIONMAP = <integer> The destination can either be the number of an existing map or 1 greater than the current number of maps. If you choose the latter, a new Line-mapping will be created. SOURCEMAP = <integer> Line-mapping from which to copy. Example: Copy attributes of Line-mapping 3 to Line-mapping 7: $!DUPLICATELINEMAP SOURCEMAP = 3 DESTINATIONMAP = 7 $!DUPLICATEZONE Syntax: $!DUPLICATEZONE SOURCEZONE = <integer> [optional parameters] Description:Make a copy of an existing zone. You can assign index ranges to create a new zone which is a subset of the source zone. 101 Required Parameter Parameters SOURCEZONE Syntax Default Notes = <integer> Zone to duplicate (the source zone). Optional Parameters Parameters Syntax Default Notes IRANGE See notes Range Parameters for $!ALTERDATA action command. { MIN = <integer> 1 MAX = <integer> 0 SKIP = <integer> 1 } JRANGE See notes Range Parameters for $!ALTERDATA action command. { MIN = <integer> 1 MAX = <integer> 0 SKIP = <integer> 1 } KRANGE See notes Range Parameters for $!ALTERDATA action command. { MIN = <integer> 1 MAX = <integer> 0 SKIP = <integer> 1 } Examples: Example 1: Make a complete copy of zone 2: $!DUPLICATEZONE SOURCEZONE = 2 Example 2: Duplicate zone 3 creating a zone which uses only the I-index range from 2 to 7 from the source zone: $!DUPLICATEZONE SOURCEZONE = 3 IRANGE { MIN = 2 MAX = 7 } E $!ELSE Syntax: 102 $!ELSE [no parameters] Description:Conditionally handle macro commands. Used when an $!IF statement is FALSE. Example: $!VARSET |C| = 2 $!IF |C| == 5 $!CREATENEWFRAME XYPOS { X = 2.5 Y = 1.5 } WIDTH = 4 HEIGHT = 4 $!ELSE $!CREATENEWFRAME XYPOS { X = 3 Y = 2 } WIDTH = 3 HEIGHT = 3 $!ENDIF $!ELSEIF Syntax: $!ELSEIF <conditionalexp> Description:Conditionally handle macro commands. Used to create multiple options for statements should an $!IF statement be FALSE. Example: $!VARSET |A| = 2 $!IF |A| < 5 $!CREATENEWFRAME XYPOS { X = 1 Y = 1 } WIDTH = 3 HEIGHT = 3 $!ELSEIF |A| > 5 $!CREATENEWFRAME XYPOS { X = 2 Y = 1 } WIDTH = 5 HEIGHT = 5 $!ELSE 103 $!CREATENEWFRAME XYPOS { X = 3 Y = 3 } WIDTH = 9 HEIGHT = 9 $!ENDIF $!EXPORT Syntax: $!EXPORT [no parameters] Description:Export an image file from Tecplot 360. See the $!EXPORTSETUP command for details on setting up the exported image type. The $!EXPORT command is not valid for animation formats. Example: $!EXPORTSETUP EXPORTFORMAT = PNG $!EXPORT $!EXPORTCANCEL Syntax: $!EXPORTCANCEL [no parameters] Description:Cancel out of the current export animation sequence. The animation file being generated is removed. Example: $!EXPORTCANCEL $!EXPORTFINISH Syntax: $!EXPORTFINISH [no parameters] Description:Signals the completion of an animation sequence and causes the animation file to be created. You must call $!EXPORTSTART prior to using $!EXPORTFINISH. This command is only valid for animation formats. You may use the |EXPORTISRECORDING| intrinsic variable to make sure that an animation sequence has been initiated. Example: $!EXPORTSETUP EXPORTFNAME="rotate.avi" EXPORTFORMAT=AVI $!EXPORTSTART $!LOOP 5 $!ROTATE3DVIEW X ANGLE=5 104 $!EXPORTNEXTFRAME $!ENDLOOP $!IF "|EXPORTISRECORDING|" =="YES" $!EXPORTFINISH $!ENDIF $!EXPORTNEXTFRAME Syntax: $!EXPORTNEXTFRAME [no parameters] Description:Records the next frame of an animation. You must call $!EXPORTSTART prior to calling $!EXPORTNEXTFRAME. This command is only valid for animation formats. You may use the |EXPORTISRECORDING| intrinsic variable to make sure that an animation sequence has been initiated.) Example: $!EXPORTSETUP EXPORTFNAME="rotate.avi" EXPORTFORMAT=AVI $!EXPORTSTART $!LOOP 5 $!ROTATE3DVIEW X ANGLE=5 $!EXPORTNEXTFRAME $!ENDLOOP $!EXPORTFINISH $!EXPORTSETUP Syntax: $!EXPORTSETUP [optional parameters] Description:A SetValue command that sets the attributes for exporting image files from Tecplot 360. Exporting is usually intended as a means to transfer images from Tecplot 360 to be imported by other applications. See $!PRINTSETUP and $!PRINT for generating output intended for printers and plotters. 105 Optional Parameters Parameter Syntax Default Notes ANIMATIONSPEED = <double> 10 Sets the animation speed in frames per second. AVICOMPRESSION = <string> COLOR PRESERVING Available values are LINEPRESERVING, COLORPRESERVING (Windows only), or LOSSLESSUNCOMPRESSED NO Used for TIFF, BMP, and PNG formats. CONVERTTO256COLORS = <boolean> EXPORTFNAME = <string> EXPORTFORMAT = <exportformat> WINDOWS METAFILE EXPORTREGION = <bitdumpregion> CURRENTFRAM E FLASHCOMPRESSION TYPE SMALLESTSIZE = <compressiontype > FLASHIMAGETYPE = <imagetype> LOSSLESS IMAGEWIDTH <op> <integer> = 512 JPEGENCODING = STANDARD or PROGRESSIVE STANDARD PRINTRENDERTYPE VECTOR = <printrendertype> QUALITY = <integer> SUNRASTERFORMAT STANDARD = <sunrasterformat> Only applies if EXPORTFORMAT is SUPERSAMPLEFACTOR = <integer> 3 This is the factor used in antialiasing while reducing the size of an exported image. A larger size can improve the quality of the image, but slows performance. TIFFBYTEORDER = <tiffbyteorder> INTEL USEMULTIPLE = <boolean> NO = <boolean> NO 75 Range is from 1-100 SUNRASTER®. Applies to AVI and Raster Metafile only. COLORTABLES USESUPERSAMPLE ANTIALIASING Example: Set up Tecplot 360 to export a Raster Metafile image to the file movie.rm: $!EXPORTSETUP EXPORTFNAME = "movie.rm" EXPORTFORMAT = RASTERMETAFILE $!EXPORTSTART Syntax: $!EXPORTSTART [optional parameter] Description:Signals the start of an animation sequence and records the first frame of the animation. This command is only valid for animation formats. Optional Parameters Parameter EXPORTREGION Syntax = <bitdumpregion> Example: $!EXPORTSETUP EXPORTFNAME="rotate.avi" EXPORTFORMAT=AVI EXPORTREGION = CURRENTFRAME 106 Default Notes $!EXPORTSTART $!LOOP 5 $!ROTATE3DVIEW X ANGLE=5 $!EXPORTNEXTFRAME $!ENDLOOP $!EXPORTFINISH $!EXTENDEDCOMMAND Syntax: $!EXTENDEDCOMMAND COMMANDPROCESSORID = <string> COMMAND = <string> [optional parameters] Description:Send a command to an add-on. The add-on registers the name of a function that will be called when an $!EXTENDEDCOMMAND is processed. Tecplot 360 knows which registered function to call based on the COMMANDPROCESSORID string. See the function TecUtilMacroExtCommandCallback in the ADK Reference Manual. Required Parameters Parameter Syntax COMMANDPROCESSOR Default String that identifies the add-on. This must match the published ID string for the add-on. = <string> The command to be sent to the add-on. ID COMMAND Notes = <string> Optional Parameters Parameter Syntax <extendedcommandr awdata> Default NULL Notes If the RAWDATA section is supplied then each line of the RAWDATA section is appended to the COMMAND string. A leading new line character is appended first, and each line in the RAWDATA section will also be terminated with a new line (except for the last line). Example: Send the command GO to the add-on that has registered a command processor with an COMMANDPROCESSORID of XPROC: $!EXTENDEDCOMMAND COMMANDPROCESSORID = "XPROC" COMMAND = "GO" $!EXTRACTFROMGEOM Syntax: $!EXTRACTFROMGEOM [optional parameters] Description: Extract data from a 2- or 3D field plot. The locations at which to extract the data come from a polyline geometry that must be picked prior to issuing this command. 107 Optional Parameters Parameters Syntax Default Notes EXTRACTLINEPOINTS ONLY = <boolean> NO If NO, must include NUMPTS. EXTRACTTOFILE = <boolean> NO If NO, a zone is created. If YES, must include FNAME. FNAME = <string> INCLUDEDISTANCE = <boolean> File name for extracted file. Required if EXTRACTTOFILE is YES. NO VAR NUMPTS If YES, then Tecplot 360 includes an extra variable in the result which is the distance along the line of points extracted and EXTRACTTOFILE must also be YES. Required if EXTRACTLINEPOINTSONLY is NO. = <integer> Example: Extract 20 points from along the currently picked geometry. Send the result to a file called extract.dat: $!EXTRACTFROMGEOM NUMPTS = 20 EXTRACTTOFILE = YES FNAME = "extract.dat" $!EXTRACTFROMPOLYLINE Syntax: $!EXTRACTFROMPOLYLINE [optional parameters] <xyrawdata> Description:Extract data from a 2- or 3D field plot. The locations of where to extract the data from come from a supplied polyline in the form of <xyzrawdata>. Optional Parameters Parameters Syntax Default Notes EXTRACTLINEPOINTS ONLY = <boolean> NO If NO, must include NUMPTS. EXTRACTTHROUGH = <boolean> NO If YES, data is extracted from XYZ-coordinates in the polyline. If NO, data is extracted from the surface. NO If NO, a zone is created. If YES, you must include FNAME. VOLUME EXTRACTTOFILE = <boolean> FNAME = <string> INCLUDEDISTANCE = <boolean> VAR NUMPTS = <integer> File name for extracted file. Required if EXTRACTTOFILE is YES. NO If YES, Tecplot 360 includes an extra variable in the result which is the distance along the line of points extracted and EXTRACTOFILE must also be YES. Required if EXTRACTLINEPOINTSONLY is NO. Example: Extract 10 points from specific locations in a field plot. Create a zone with the extracted data: $!EXTRACTFROMPOLYLINE EXTRACTLINEPOINTSONLY = YES RAWDATA 10 0 0 0 1 2 0 2 4 0 3 2 0 3 4 0 108 4 4 4 5 6 4 5 6 7 9 0 0 0 0 0 F $!FIELDLAYERS Syntax: $!FIELDLAYERS [optional parameters] Description:A SetValue command that turns field plot layers on or off, or sets the 2D draw order. Optional Parameters Parameter Syntax Default SHOWCONTOUR = <boolean> NO SHOWEDGE = <boolean> YES SHOWISOSURFACES = <boolean> NO SHOWMESH = <boolean> NO SHOWSCATTER = <boolean> NO SHOWSHADE = <boolean> YES SHOWSLICES = <boolean> NO SHOWVECTOR = <boolean> NO TWODDRAWORDER = <twoddraworde r> BYLAYER USELIGHTINGEFFECT = <boolean> YES USETRANSLUCENCY = <boolean> YES Notes Vector variables must be defined. See $!GLOBALTWODVECTOR or $!GLOBALTHREEDVECTOR. Example: Turn on the scatter layer: $!FIELDLAYERS SHOWSCATTER = YES $!FIELDMAP Syntax: $!FIELDMAP [<set>] [optional parameters] Description:A SetValue command that assigns zone attributes for field plots. The <set> parameter immediately following the $!FIELDMAP command is optional. If <set> is omitted then the assignment is applied to all zones. Otherwise the assignment is applied only to the zones specified in <set>. 109 Optional Parameters Parameter Syntax Default Notes CONTOUR { COLOR = <color> BLACK CONTOURTYPE = <contourtype> FLOOD FLOODCOLORING = <contourcoloring> GROUP1 LINECONTOURGROUP = <integer> 1 LINEPATTERN = <linepattern> SOLID LINETHICKNESS = 0.1 PATTERNLENGTH <op> <dexp> <op> <dexp> SHOW = <boolean> YES USELIGHTINGEFFECT = <boolean> YES COLOR = <color> BLACK EDGETYPE = <edgetype> BORDERSAND CREASES IEDGE = <borderlocation> BOTH Applies for IJ-, IK-, and IJK-ordered zones. JEDGE = <borderlocation> BOTH Applies for IJ-, IK-, and IJK-ordered zones. KEDGE = <borderlocation> BOTH Applies for IJ-, IK-, and IJK-ordered zones. LINETHICKNESS = <dexp> 0.1 SHOW = <boolean> YES USEBLANKING = <boolean> =2 } EDGELAYER { } EFFECTS { LIGHTINGEFFECT = <lightingeffect> GOURAUD SURFACETRANSLUCENCY <translucency> 50 USETRANSLUCENCY = <boolean> YES USEVALUEBLANKING = <boolean> YES Set to YES to include value blanking in the specified zones USECLIPPLANES = <set> [1-6] Use clipping planes specified to clip zones specified in set for FIELDMAP, or all zones if none specified. Possible values include [ ] (none), or any combination of the numbers 1 - 6, enclosed in brackets. COLOR = <color> BLACK LINEPATTERN = <linepattern> SOLID LINETHICKNESS <op> <dexp> = 0.1 MESHTYPE = <meshtype> OVERLAY PATTERNLENGTH <op> <dexp> =2 SHOW = <boolean> YES <<ijk>> I = 1, J = 1, K = 1 SURFACETRANSLUCENCY range is one to 99. } MESH { } POINTS { IJKSKIP 110 Limits the number of vectors or scatter symbols drawn. Parameter POINTSTOPLOT Syntax Default Notes <pointstoplot> SURFACENODES COLOR = <color> BLACK FILLCOLOR = <color> WHITE FILLMODE = <fillmode> NONE FRAMESIZE <op> <dexp> 2.5 LINETHICKNESS <op> <dexp> 0.1 SHOW = <boolean> YES SIZEBYVARIABLE = <boolean> NO Scatter sizing variable must be defined before this can be set to YES. See the $!GLOBALSCATTER command. SYMBOLSHAPE <<symbolshape>> See Notes ISASCII = NO, GEOMSHAPE = SQUARE COLOR = <color> WHITE SHOW = <boolean> YES USELIGHTINGEFFECT = <boolean> YES IRANGE <<indexrange>> See Notes MIN=1, Max=0, Skip=1 JRANGE <<indexrange>> See Notes MIN=1, Max=1, Skip=1 KRANGE <<indexrange>> See Notes MIN=1, Max=1, Skip=1 SURFACESTOPLOT = <surfacestoplot> NONE ARROWHEADSTYLE <arrowheadstyle> PLAIN COLOR = <color> BLACK ISTANGENT = <boolean> NO LINEPATTERN = <linepattern> SOLID LINETHICKNESS = <dexp> 0.1 PATTERNLENGTH = <dexp> 2 SHOW = <boolean> YES VECTORTYPE = <vectortype> TAILATPOINT } SCATTER { Size of symbols when SIZEBYVARIABLE is NO. } SHADE { } SURFACES { } VECTOR { } VOLUMEMODE { VOLUMEOBJECTSTOPLOT <<volumeobjectstoplot>> SHOWISOSURFACES=YE S, SHOWSLICES=YES, SHOWSTREAMTRACES= YES = <integer> 1 VOLUMEMODE applies to volume zones, with the exception that POINTSTOPLOT also applies to finite-element surface zones. } GROUP Assign a group number to the supplied set of zones. Examples: 111 Example 1: Change the contour plot type to flood for zones 1-12: $!FIELDMAP [1-12] CONTOUR { CONTOURTYPE = FLOOD } Example 2: Change the mesh color to red for all zones (default mesh color is black): $!FIELDMAP MESH { COLOR = RED } $!FILECONFIG Syntax: $!FILECONFIG [optional parameters] Description:A SetValue command that sets file path information in Tecplot 360. 112 Optional Parameters Parameter ADDZONESTOEXISTING Syntax Default Notes = <boolean> NO If YES, Tecplot 360 will add the zones from the appended data to any existing strands in the dataset. If NO, Tecplot 360 will append the strands from the new data to any existing strands in the dataset. ASSIGNSTRANDID = <boolean> YES If YES, Tecplot 360 will assign strand ID's to zones (if time is supplied for the zones but not strand ID's). If NO, Tecplot 360 will not associate these zones with any strands. DATAFILEVARLOADMODE = <varloadmode> BYNAME Set the default loading mode for variables. BYNAME loads variables based on their name. If set to BYNAME, then VARNAMELIST must be supplied as well. BYPOSITION loads variables based on their position in the file. To get Tecplot Version 7.0 behavior, use BYPOSITION. DOAUTOFNAMEEXTENSION = <boolean> DOAUTOFNAMEEXTENSIONW ARNING = <boolean> If YES a warning is displayed when attempting to save with an extension other than the default extension. COLORMAPFILE = <string> Default extension for color map files. EQUATIONFILE = <string> Default extension for equation files. IMPORTIMAGEFILE = <string> Default extension for image files. INPUTDATAFILE = <string> Default extension for Tecplot 360 input data files. INPUTLAYOUTFILE = <string> Default extension for loading layout files. MACROFILE = <string> Default extension for macro files. OUTPUTASCIIDATAFILE = <string> Default extension for ASCII output data files. OUTPUTBINARYDATAFILE = <string> Default extension for binary output data files. OUTPUTLAYOUTFILE = <string> Default extension for saving linked layout files. OUTPUTLAYOUTPACKAGEF ILE = <string> Default extension for saving layout package files. STYLEFILE = <string> Default extension for style files. STRANDS FNAMEFILTER { } LAYOUTCONFIG { INCLUDEDATA = <boolean> NO If YES, layout packages are the default format for layouts INCLUDEPREVIEW = <boolean> NO If YES, preview images are saved with layout packages. USERELATIVEPATHS = <boolean> YES If YES, files will be referenced using relative paths in layout files. = <boolean> YES If YES, Tecplot 360 will use it's loadon-demand features for loading and unloading variables. } LOADONDEMAND { ALLOW 113 Parameter Syntax Default Notes DATASTORESTATEGY = <dataloadstrategy> AUTO Set the data store strategy for loadon-demand. If set to AUTO, Tecplot 360 will use store large allocations in the temporary directory and use memory mapped I/O to read and write to the regions when possible otherwise it will use the memory heap (usually this provides better performance for large data). If set to HEAP Tecplot 360 will not use the temporary directory for large allocations (this option is usually slower when working with large data). UNLOADSTRATEGY = <unloadstrategy> AUTO Set the unload strategy for load-ondemand. If set to AUTO Tecplot 360 will unload unused variables when the amount needed RAM begins to reach the maximum amount of RAM. If set to NEVERUNLOAD Tecplot 360 will load variables on demand but will never attempt to unload them even if it is running low on memory. If set to MINIMIZEMEMORYUSE Tecplot 360 will aggressively unload variables as soon as they are not needed regardless of the amount of memory available or in use. } TEMPFILEPATH Set the directory where you want Tecplot 360 to store its temporary files. = <string> File Name Filters:Valid characters are upper or lowercase A-Z, and 0-9. Each filter should be preceded by (*), or it will not filter properly. On Windows operating systems, to allow more than one extension, separate them with a semicolon (;). On UNIX platforms multiple extensions will not filter correctly unless they follow the standard UNIX shell filter format. ® ® Windows Example:This example filters all four extensions when opening a layout file. $!FILECONFIG FNAMEFILTER {INPUTLAYOUTFILE = "*.wsf;*.dwr;*.lay;*.lpk"} Windows Example:This example filters both extensions when writing a layout file. The default extension is .wsf because it is the first extension presented in the list. $!FILECONFIG FNAMEFILTER {OUPUTLAYOUTFILE = ".wsf;*.lay"} Motif Example:This example filters .aek, .plt, and more. ® $!FILECONFIG FNAMEFILTER {INPUTDATAFILE = "*.[ae][el][kt]"} Motif Example:This example filters .dat, .cam, and more. The default extension is .dat because D and T are the first letters presented within the brackets. $!FILECONFIG FNAMEFILTER {OUTPUTASCIIDATAFILE = "*.[dc]a[tm]"} Example: Set the directory where Tecplot 360 stores temporary files to be /usr/tmp: $!FILECONFIG DATAFILEVARLOADMODE = BYPOSITION TEMPFILEPATH = "/usr/tmp" LAYOUTCONFIG {USERELATIVEPATHS = YES} FNAMEFILTER { INPUTDATAFILE = "*.[pd][la]t" COLORMAPFILE = "*.clr" } 114 $!FONTADJUST Syntax: $!FONTADJUST [optional parameters] Description:A SetValue command that sets character spacing and sizing for fonts in Tecplot 360. These parameters rarely change. Optional Parameters Parameter Syntax BOLDFACTOR Default Notes Thickness of bold characters relative to normal. INTERCHARSPACING <op> <double> <op> <integer> STROKEFONTLINE <op> <double> Thickness (in frame units) of lines used to draw stroke fonts. <op> <double> Size of subscript and superscript characters relative to the font height. Increase or decrease inter-character spacing. Units are in pixels on the screen. THICKNESS SUBSUPFRACTION Example: Make superscript and subscript characters 1/3 the font height: $!FONTADJUST SUBSUPFRACTION = 0.333 $!FOURIERTRANSFORM Syntax: $!FOURIERTRANSFORM INDEPENDENTVAR = <integer> WINDOWFUNCTION = <windowfunction> DEPENDENTVARS = <set> SOURCEZONES = <set> INCLUDECONJUGATES = <boolean> OBEYSOURCEZONEBLANKING = <boolean> [no optional parameters] Description:Performs a Fourier transform for each dependent variable for each source zone. A new zone containing the resulting frequency, amplitude, and phase variables (three for each dependent variable) is created for each source zone. If the independent variable is non-uniform, the resulting frequency is a modification of the original data (see discussion below for the INDEPENDENTVAR and OBEYSOURCEZONEBLANKING parameters). Resulting zones are assigned new time strands using the same groupings as the source zones if they belong to time stands; otherwise, the resulting zones are static. Fourier transform result zones are named "Fourier Transform" followed by a mixture of text indicating the source zone, independent variable, and window function used. Similarly, the three variables created are given the names "Frequency", "Amplitude", and "Phase" followed by the dependent variable used. Newly-created zones are assigned passive variables for all variables that previously existed in the data set, and all previously-existing zones are assigned passive variables for all new variables created by the Fourier transform. 115 Required Parameters Parameter Syntax Notes INDEPENDENTVAR = <integer> Independent variable used for the frequency domain. If the spacing is non-uniform, this variable is used in conjunction with each dependent variable for interpolation to create a uniform frequency domain for the transform. WINDOWFUNCTION = <windowfunction> Window function or tapering function applied to the dependent variables before performing the transform but after performing the non-uniform interpolation. For details, see http://en.wikipedia.org/wiki/ Window_function DEPENDENTVARS = <set> Set of dependent variables on which to perform a Fourier transform. The variables must not be the same as the independent variable. This must not be NULL or an empty set and must be a subset of the variables in the source zones. SOURCEZONES = <set> Set of source zones containing the dependent variables on which to perform the Fourier transform. This must not be NULL or an empty set and must be a subset of the data set’s available zones. INCLUDECONJUGATES = <boolean> For purely real numbers, the Fourier transform output satisfies the " Hermitian" redundancy where out[i] is the conjugate of out[n-i]. If this parameter is YES, the conjugates are included, otherwise they are not, and approximately half of the output values, n/2+1, are computed. OBEYSOURCEZONEBLANKING = <boolean> If value blanking is active and this value is YES, value blanking is applied to the data values of both the independent and dependent variables before the data is interpolated for non-uniformity. If data values eliminated from the independent or dependent variables cause the data to be non-uniform the values are interpolated appropriately. Additionally, all blanked data values up to the first non-blanked data value and all blanked data values after the last non-blanked data value are ignored, providing a mechanism to constrain the domain over which the Fourier transformation is performed. Optional Parameters Parameter Syntax Default Notes REPLACEMATCHINGRE SULTZONES = <boolean> NO If YES, any existing result zones for the specified combination of source zone, independent variable, and window function are re-used. If NO, new result zones are created. REPLACEMATCHINGRE SULTVARIABLES = <boolean> NO If YES, any existing result variables for the specified dependent variables are re-used. If NO, new result variables are created. Example: Perform a Fourier transform on variables 2 through 11 of zones 1 through 10 obeying source zone blanking, applying the Hann window function and excluding conjugates from the output. $!FOURIERTRANSFORM INDEPENDENTVAR = 1 WINDOWFUNCTION = HANN DEPENDENTVARS = [2-11] SOURCEZONES = [1-10] INCLUDECONJUGATES = NO OBEYSOURCEZONEBLANKING = YES $!FRAMECONTROL [Required Control Option] Description:The different commands in the FRAMECONTROL compound function family are described separately in the following sections. When working with the FRAMECONTROL commands, it may help to realize that a command containing "Activate" changes the active frame; a command containing "MoveTo" changes the frame drawing order. The FRAMECONTROL compound functions following are: $!FRAMECONTROL ActivateTop $!FRAMECONTROL ActivateNext 116 $!FRAMECONTROL $!FRAMECONTROL $!FRAMECONTROL $!FRAMECONTROL $!FRAMECONTROL $!FRAMECONTROL $!FRAMECONTROL $!FRAMECONTROL $!FRAMECONTROL $!FRAMECONTROL $!FRAMECONTROL $!FRAMECONTROL ActivatePrevious ActivateAtPosition ActivateByName ActivateByNumber MoveToTopActive MoveToTopByName MoveToTopByNumber MoveToBottomActive MoveToBottomByName MoveToBottomByNumber DeleteActive FitAllToPaper $!FRAMECONTROL ACTIVATETOP Syntax: $!FRAMECONTROL ACTIVATETOP [no parameters] Description:Changes the active frame to the frame that is topmost in the frame drawing order. Example: $!FRAMECONTROL ACTIVATETOP $!FRAMECONTROL ACTIVATENEXT Syntax: $!FRAMECONTROL ACTIVATENEXT [no parameters] Description:Changes the active frame to the next one up in the frame drawing order, or to the bottom frame if the active frame is at the top. Example: $!FRAMECONTROL ACTIVATENEXT $!FRAMECONTROL ACTIVATEPREVIOUS Syntax: $!FRAMECONTROL ACTIVATEPREVIOUS [no parameters] Description:Changes the active frame to the next one down in the frame drawing order, or to the top frame if the active frame is at the bottom. Example: $!FRAMECONTROL ACTIVATEPREVIOUS $!FRAMECONTROL ACTIVATEATPOSITION Syntax: $!FRAMECONTROL ACTIVATEATPOSITION X = <xpos> Y = <ypos> Description:Activates the topmost frame at the specified position. X and Y are in paper coordinates. 117 Required Parameters Parameter Syntax Default Notes xpos = <dexp> Specify X-coordinate of position. ypos = <dexp> Specify Y-coordinate of position. Example: $!FRAMECONTROL ACTIVATEATPOSITION X=0 Y=0 $!FRAMECONTROL ACTIVATEBYNAME Syntax: $!FRAMECONTROL ACTIVATEBYNAME Name = <name> Description:Changes the active frame to the specified frame. If no frame name is given, this will activate the bottom frame. Required Parameter Parameter Name Syntax Default Notes = <string> Specify name of the frame to activate. Example: Activate a frame named Topography. $!FRAMECONTROL ACTIVATEBYNAME NAME="Topography" $!FRAMECONTROL ACTIVATEBYNUMBER Syntax: $!FRAMECONTROL ACTIVATEBYNUMBER Frame = <number> Description:Changes the active frame to the specified frame. Required Parameter Parameter Frame Syntax = <integer> Default 1 Notes Specify number of the frame to activate. Example: Activate Frame 4. $!FRAMECONTROL ACTIVATEBYNUMBER FRAME=4 $!FRAMECONTROL MOVETOTOPACTIVE Syntax: $!FRAMECONTROL MOVETOTOPACTIVE [no parameters] Description:Moves the active frame to the top of the drawing order. Example: $!FRAMECONTROL MOVETOTOPACTIVE 118 $!FRAMECONTROL MOVETOTOPBYNAME Syntax: $!FRAMECONTROL MOVETOTOPBYNAME NAME=<name> Description:Moves the frame specified by name to the top of the frame drawing order. Required Parameter Parameter Name Syntax Default = <string> Notes Specify name of the frame to move to the top of the drawing order. Example: Moves the frame named Topography to the top of the drawing order. $!FRAMECONTROL MOVETOTOPBYNAME NAME="TOPOGRAPHY" $!FRAMECONTROL MOVETOTOPBYNUMBER Syntax: $!FRAMECONTROL MOVETOTOPBYNUMBER FRAME=<number> Description:Moves the frame specified by number to the top of the frame drawing order. If no frame number is specified, this command will move the bottom frame to the top of the frame drawing order. Required Parameter Parameter Frame Syntax Default = <integer> Notes Specify number of the frame to move to the top of the drawing order. Example:Moves frame 4 to the top of the drawing order. $!FRAMECONTROL MOVETOTOPBYNUMBER FRAME=4 $!FRAMECONTROL MOVETOBOTTOMACTIVE Syntax: $!FRAMECONTROL MOVETOBOTTOMACTIVE [no parameters] Description:Moves the active frame to the top of the frame drawing order. Example: $!FRAMECONTROL MOVETOBOTTOMACTIVE $!FRAMECONTROL MOVETOBOTTOMBYNAME Syntax: $!FRAMECONTROL MOVETOBOTTOMBYNAME FRAME=<name> Description:Moves the frame specified by name to the bottom of the frame drawing order. 119 Required Parameter Parameter Name Syntax Default = <string> Notes Specify name of the frame to move to the bottom. Example: $!FRAMECONTROL MOVETOBOTTOMBYNAME NAME=<name> $!FRAMECONTROL MOVETOBOTTOMBYNUMBER Syntax: $!FRAMECONTROL MOVETOBOTTOMBYNUMBER FRAME=<number> Description:Moves the frame specified by number to the bottom of the frame drawing order. Required Parameter Parameter Frame Syntax Default = <integer> Notes Specify number of the frame to move to the bottom. Example: Move Frame 003 to the bottom. $!FRAMECONTROL MOVETOBOTTOMBYNUMBER FRAME=003 $!FRAMECONTROL DELETEACTIVE Syntax: $!FRAMECONTROL DELETEACTIVE [no parameters] Description:Delete the active frame. Example: $!FRAMECONTROL DELETEACTIVE $!FRAMECONTROL FITALLTOPAPER Syntax: $!FRAMECONTROL FITALLTOPAPER [no parameters] Description:Resize all frames so that they fit inside the hardclip limits of the paper. Example: $!FRAMECONTROL FITALLTOPAPER $!FRAMELAYOUT Syntax: $!FRAMELAYOUT [optional parameters] Description:A SetValue command that sets the position, border, and background attributes for the active 120 frame. Use the $!FRAMECONTROL action command to push and pop frames if you want to change the settings for a frame other than the active frame. Optional Parameters Parameter Syntax BACKGROUNDCOLOR Default Notes = <color> WHITE Only applies if ISTRANSPARENT = NO. BORDERTHICKNESS <op> <dexp> = 0.1 Value is in Y-frame units. FRAMESIZEPOSUNITS = <framecoordmode> Whether frame sizes and positions are in absolute units (paper) or relative screen units from 0 to 1 (workspace) HEADERCOLOR = <color> RED HEADERFONTAMILY = <string> "Helvetica" HEIGHT <op> <dexp> =8 HEADERFONTISBOLD = <boolean> YES HEADERFONTIS = <boolean> NO ISTRANSPARENT = <boolean> NO SHOWBORDER = <boolean> YES SHOWHEADER = <boolean> NO WIDTH <op> <dexp> =9 Value is in inches. XYPOS <<xy>> X=1, Y=0.25 Position of upper left corner of the frame in inches from left and top edge of the paper. Only applies if SHOWHEADER = YES. Value is in inches. ITALIC Example: Place the active frame in the upper left corner of the paper (offset 0.5 inches from the top and left edges), make the frame dimensions 3 by 4 inches, and turn off the frame border: $!FRAMELAYOUT SHOWBORDER = NO XYPOS { X = 0.5 Y = 0.5 } WIDTH = 3 HEIGHT = 4 $!FRAMENAME Syntax: $!FRAMENAME = <string> [no parameters] Description:Set the name for the active frame (Default = "Frame001"). Example: $!FRAMENAME = "Pressure Contours for well 33" $!FRAMESETUP Syntax: $!FRAMESETUP [optional parameters] Description:A SetValue command that sets parameters used to preset dynamic frame attributes when a frame is initialized. 121 Optional Parameters Parameter ALIGNINGCONTOUR Syntax Default Notes = <boolean> YES If YES, the next interactively placed contour label is aligned to the contour line. = <boolean> NO If set to YES, the values set via $!FIELDMAP [nnn] MESHLAYER {COLOR = <color>} are used for default zone mesh colors (similarly for Edge colors). FITINITIALFRAMETO WORKSPACE = <boolean> YES If set to NO, the new layout is shown as in V10 with the entire paper fit to the work area. If set to YES, the new layout is shown with the active frame fit to the work area. This command changes the behavior of Tecplot 360 as it first appears during a session and as it appears after a new layout command. It has no effect on the current plot, but it can be used in a macro to set the value for future new plots. It is typically found in the tecplot.cfg file. INITIAL3DFITTO = <boolean> YES If YES, initial 3D plot shows a view equivalent to using “$!View FitSurfaces” or the View->Fit Surface menu item, and ignores the "$!FrameSetup Initial3DScale" parameter. If NO, initial 3D plot is equivalent to using the value of "$!FrameSetup Initial3DScale" in the View->Translate/Magnify dialog or using the "$!View Scale=<double>" command. This value defaults to YES for 360 and NO for Focus. <op> <dexp> <op> <integer> = 1.1 Initial scale for 3D plots. = 10 Number of points to place along streamtrace rakes. <op> <integer> =1 Number of points to place when seeding streamtraces on surfaces. LABELS ASSIGNSEQUENCED ZONECOLORS SURFACES INITIAL3DSCALE NUMSTREAMRAKE POINTS NUMSTREAMSURFACE POINTS RODRIBBONDEFLEN <op> <dexp> = 0.06 Default width (in frame units) of a streamtrace or ribbon SHOWAPPENDEDZONES = <boolean> YES If set to NO, zones added via an append data operation will be turned off initially. SHOWNONWALL = <boolean> NO If set to YES, any new zone that has a non-wall BOUNDARYCONDITION defined will be turned off initially. VECTDEFLEN <op> <dexp> = 0.06 When a vector plot is drawn for the first time the vector magnitude is adjusted so the longest vector is VECTDEFLEN units long. VECDEFLEN is in frame units. VECTMINLEN <op> <dexp> = 0.0005 Minimum length in centimeters. Vectors shorter than this length are not drawn. BOUNDARYZONES USECOMMON YES SORTSTACK DEFAULT2D BOTH STREAMTRACESTREAM DIRECTION DEFAULT3D BOTH STREAMTRACESTREAM DIRECTION Example: Make the default length for the longest vector five percent: $!FRAMESETUP VECTDEFLEN = 5 122 G $!GETAUXDATA Syntax: $!GETAUXDATA <macrovar> AUXDATALOCATION = [zone/var/dataset/frame/linemap|page] NAME = <string> [optional parameters] Description:Retrieve Auxiliary Data in the form of name/value pairs and save it to the macro variable. Required Parameters Parameter Syntax AUXDATALOCATION = [zone/var/ dataset/frame/ linemap|page] NAME = <string> Default Notes Name of existing auxiliary data Optional Parameters Parameter Syntax Default Notes MAP = <integer> Only required if AUXDATALOCATION = linemap VAR = <integer> Only required if AUXDATALOCATION = var ZONE = <integer> Only required if AUXDATALOCATION = zone Example: Get the Auxiliary Data from Zone 2, and store it in the macro variable |ABC|: $!GETAUXDATA |ABC| AUXDATALOCATION = zone NAME = ’ABC.Aux.Data’ ZONE = 2 $!GETCONNECTIVITYREFCOUNT Syntax: $!GETCONNECTIVITYREFCOUNT <macrovar> ZONE = <integer> [no optional parameters] Description:Fetch the count of how many zones share connectivity with the specified zone. Count includes specified zone. Required Parameters Parameter ZONE Syntax Default Notes = <integer> Example: Fetch the connectivity count from Zone 2, and store it in the macro variable |ABC|. If zones 2, 5 and 6 share connectivity, |ABC| = 3.: $!GETCONNECTIVITYREFCOUNT |ABC| ZONE = 2 123 $!GETCURFRAMENAME Syntax: $!GETCURFRAMENAME <macrovar> [no parameters] Description:Query Tecplot 360 for the name of the active frame. The <macrovar> represents the macro variable to receive the results. Example: Put the name of the active frame into the macro variable |CFRAME|. $!GETCURFRAMENAME |CFRAME| $!GETFIELDVALUE Syntax: $!GETFIELDVALUE <macrovar> ZONE = <integer> VAR = <integer> INDEX = <integer> Description:Fetch the field value (data set value) at the specified point index and assign the value to <macrovar>. If the zone referenced is IJ- or IJK-ordered, then the point index is calculated by treating the 2- or 3Dimensional array as a 1-D array. Required Parameters Parameter Syntax INDEX = <integer> VAR = <integer> ZONE = <integer> Default Notes Example: A data set contains 2 zones and 3 variables. Zone 2 is dimensioned 5 by 3. Fetch the value from variable 3 at IJ-location (2, 2), and store it in the macro variable |ABC|: $!GETFIELDVALUE |ABC| ZONE = 2 VAR = 3 INDEX = 7 Note: INDEX was calculated using: INDEX = I + (J-1)*|MAXI| + (K-1) * |MAXI| * |MAXJ| = 5*(2-1)+2 = 7 $!GETFIELDVALUEREFCOUNT Syntax: $!GETFIELDVALUEREFCOUNT <macrovar> ZONE = <integer> VAR = <integer> [no optional parameters] Description:Get the count of how many zones share the indicated variable with the specified zone. Count includes the specified zone. 124 Required Parameters Parameter Syntax VAR = <integer> ZONE = <integer> Default Notes Example: A data set contains 5 zones and 3 variables. Zones 1, 2 and 4 share variable 3, and zones 3 and 5 share variable 3. $!GETFIELDVALUEREFCOUNT |ABC| ZONE = 2 VAR = 3 This returns |ABC| = 3, while $!GETFIELDVALUEREFCOUNT |DEF| ZONE = 5 VAR = 3 returns |DEF| = 2 because the variable is not shared across all five zones. $!GETNODEINDEX Syntax: $!GETNODEINDEX = <macrovar> ZONE = <integer> ELEMENT = <integer> CORNER = <integer> [no optional parameters] Description:This function only works for finite-element zones. Query for the node index in the specified location as described by the ZONE, ELEMENT, and CORNER parameters. Required Parameter Parameter Syntax Default Notes ZONE = <integer> Zone must be greater than or equal to one. CORNER = <integer> Possible values are 1-3, 1-4, or 1-8, depending upon the element type. ELEMENT = <integer> Must be greater than or equal to one and less than or equal to |MAXJ|. Example: Get the index for the node at corner 3 of the last element in zone number 1. $!GETZONETYPE |ZONETYPE| ZONE = 1 $!IF "|ZONETYPE|" = "FE BRICK" $!GETNODEINDEX |INDEX| ZONE = 1 ELEMENT = |MAXJ| CORNER = 3 ... Do something with |INDEX|... $!ENDIF 125 $!GETVARLOCATION Syntax: $!GETVARLOCATION <macrovar> ZONE = <integer> VAR = <integer> Description:Returns the location of the variable in the zone as either CELLCENTERED or NODAL and saves in the macro variable. Required Parameter Parameter Syntax VAR = <integer> ZONE = <integer> Default Notes Example: Get the variable location for the third variable in zone 1. $!GETVARLOCATION |ABC| ZONE = 1 VAR = 3 $!GETVARNUMBYNAME Syntax: $!GETVARNUMBYNAME <macrovar> NAME = <string> Description:Given a variable name, get the number for that variable. This variable number can then be used to assign attributes, such as what variable to use for contouring. Required Parameter Parameter NAME Syntax = <string> Default Notes Name of the variable. If a variable has aliases, the name must correspond to one of the aliases. Example: Get the variable number for the variable named PRESSURE and make it the contouring variable. $!GETVARNUMBYNAME |PVARNUM| NAME = "PRESSURE" $!GLOBALCONTOUR VAR = |PVARNUM| $!GETZONETYPE Syntax: $!GETZONETYPE |<macrovar>| ZONE = <integer> [no optional parameters] Description:Query for the zone type of the specified zone. The zone type will be assigned to <macrovar>. The possible return values are: "ORDERED" "FELINESEG" "FETRIANGLE" "FEQUAD" 126 "FETETRA" "FEBRICK" "FEPOLYGON" "FEPOLYHEDRON" Required Parameter Parameter Syntax ZONE Default Notes = <integer> Zone must be greater than or equal to one. Example: $!GETZONETYPE |ZONETYPE| ZONE = 1 $!IF "|ZONETYPE|" == "FETRIANGLE" $!PAUSE "The zone is FE-Triangle." $!ENDIF $!GLOBALCOLORMAP Syntax: $!GLOBALCOLORMAP [<groupnumbers>] [optional parameters] Description:A SetValue command that changes the settings for the global contour color map and the global light source shading color map in Tecplot 360. Changes here affect all frames using these color maps. See $!GLOBALCONTOUR COLORMAPFILTER for additional settings that can be applied on a frame-by-frame basis. Optional Parameters If you would like the settings in these commands to persist, add them to your tecplot.cfg file (located in your installation directory).I Parameter CONTOURCOLORMAP Syntax Default SMRAINBOW GRAYSCALE = <colormap> <<colormapcontrolpoints>> GROUPNUMBER = <integer> 1 LGRAINBOW <<colormapcontrolpoints>> MODERN <<colormapcontrolpoints>> SMRAINBOW <<colormapcontrolpoints>> TWOCOLOR <<colormapcontrolpoints>> USERDEFINED <<colormapcontrolpoints>> USERDEFINED NUMCONTROLPOINTS = <integer> Notes Group number must be between 1 and 8. Example: Make the third control point for the small rainbow color map for the 4th Color Map group to be positioned 0.44 of the way across the color map. Set the leading and trailing RGB red value to 90: $!GLOBALCOLORMAP 4 SMRAINBOW { CONTROLPOINT 3 { COLORMAPFRACTION = 0.44 LEADRGB 127 {R = 90} TRAILRGB {R = 90} } } $!GLOBALCONTOUR Syntax:$!GLOBALCONTOUR <contourgroup> [optional parameters] Description:A SetValue command that changes global attributes associated with contour plots or contour levels. The optional parameter <contourgroup> refers to the defined contour groups, 1-8, allowed in Tecplot 360, and takes an integer value of one through eight. The <contourgroup> parameter is optional, and if omitted, Tecplot 360 will use contour group 1. If you would like the settings in these commands to persist, add them to your tecplot.cfg file, located in your installation directory. The NUMBERFORMAT setting for LABELS also controls the number format in the legend. Optional Parameters If you would like the settings in these commands to persist, add them to your tecplot.cfg file (located in your installation directory). Parameter Syntax Default CONTOURLINESTYLE Notes This is used to assign a special line pattern scheme for contour line plots. { CONTOURLINEMODE = <contourlinemode> LINESKIP <op> <integer> <op> <dexp> PATTERNLENGTH } COLORCUTOFF { INCLUDEMAX = <boolean> YES INCLUDEMIN = <boolean> YES RANGEMAX <op> <dexp> <op> <dexp> = 0.75 RANGEMIN = 0.25 } COLORMAPFILTER The global color map is defined using the $!COLORMAP command. COLORMAPFILTER allows each frame to make adjustments to the global color map that will only apply to the active frame. { COLORMAPCYCLES <op> <integer> COLORMAPDISTRIBUTION <colormapdistribution> COLORMAPOVERRIDE <integer> <<colormapoverride>> COLORMAPOVERRIDEACTIVE = <boolean> <<continuouscolor>> CONTINUOUSCOLOR REVERSECOLORMAP = <boolean> USEFASTAPPROXCONTINUOU = <boolean> SFLOOD <<zebrashade>> ZEBRA } 128 Use <integer> to choose which override to operate on. NO CMIN=0, CMAX=1 Parameter DEFNUMLEVELS Syntax Default Notes = <integer> 15 Sets the target number of contour levels for situations where contour levels are automatically reset. Tecplot 360 will attempt to create levels where the start, end and increment values are all clipped floating point values. ALIGNAUTOLABELS = <boolean> YES If YES, automatic labels are aligned with the contour lines, otherwise they are horizontal. AUTOLABELSPACING <op> <dexp> <op> <integer> = 30 AUTOLEVELSKIP COLOR = <color> BLACK FILLCOLOR = <color> WHITE GENERATEAUTOLABELS = <boolean> YES ISFILLED = <boolean> YES LABELWITHVALUE = <boolean> YES MARGIN <op> <dexp> =5 NUMFORMAT <<numberformat>> See Notes SHOW = <boolean> NO TEXTSHAPE <<textshape>> FONTFAMILY= "Helevetica", ISBOLD=NO, ISITALIC=NO SIZEUNITS=FRAME, HEIGHT=1.5 ANCHORALIGNMENT <anchoralignment> TOPRIGHT AUTORESIZE = <boolean> NO AUTOSIZEMAXLIMIT = <double> 0.5 BOX <<textbox>> See Notes HEADERTEXTSHAPE <<textshape>> FONTFAMILY= "Helvetica", ISBOLD=NO, ISITALIC=NO, SIZEUNITS=FRAME, HEIGHT=2.5 INCLUDECUTOFFLEVELS = <boolean> NO ISVERTICAL = <boolean> YES LABELINCREMENT = <double> 1 LABELLOCATION = <contourlabellocation> CONTOURLEVELS NUMBERTEXTSHAPE <<textshape>> FONTFAMILY= "Helvetica", ISBOLD=NO, ISITALIC=NO, SIZEUNITS=FRAME, HEIGHT=2.5 OVERLAYBARGRID = <boolean> YES ROWSPACING <op> <dexp> = 1.2 LABELS { =1 Value is in Y-frame units. If YES, automatic labels are repositioned on each redraw. If YES, automatic labels show the contour value otherwise they show the contour level number. FORMATTING= BESTFLOAT, CUSTOMLABEL=1, PRECISION=4, SHOWDECIMALSON WHOLENUMBERS=NO, REMOVELEADINGZEROS=NO, SHOWNEGATIVESIGN= YES, TIMEDATEFORMAT= ’yyyy-mm-dd hh:mm:ss.00’ Not allowed to change size units parameter. } LEGEND { BOXTYPE=HOLLOW, MARGIN=10, LINETHICKNESS=0.1, COLOR=BLACK, FILLCOLOR=WHITE Thin line around each band in the color bar. 129 Parameter Syntax Default SHOW = <boolean> NO SHOWHEADER = <boolean> YES TEXTCOLOR = <color> BLACK XYPOS <<xy>> X = 95, Y = 80 = <integer> 3 RANGEMIN = <double> -1 x 10150 RANGEMAX = <double> -1 x 10150 INCLUDEMIN = <boolean> NO INCLUDEMAX = <boolean> NO INVERTCUTOFF = <boolean> NO = <integer> 1 Notes } VAR Variable used for contour levels. COLORCUTOFF { } COLORMAPFILTER { GROUP COLORMAPDISTRIBUTION BANDED CONTINUOUSCOLOR { CMIN = <integer> 0 CMAX = <integer> 1 = <boolean> NO INCLUDE = <boolean> NO ISTRANSPARENT = <boolean> NO COLOR = <color> BLACK = <integer> 1 } REVERSECOLORMAP ZEBRA { } COLORMAPCYCLES USEFASTAPPROXCONTINUOU = <boolean> SFLOOD NO COLORMAPOVERRIDEACTIVE = <boolean> NO COLORMAPOVERRIDE = <boolean> NO } CONTOURLINESTYLE { CONTOURLINEMODE = <contourlinemode> USEZONELINETYPE LINESKIP = <integer> 4 PATTERNLENGTH = <dexp> 2 } Example: This example does the following: Turns on the contour legend; Sets the flood cutoff to go from 3 to 5; Reverses the color map; Inserts a color map override of yellow between contour level number 7 and level number 9. $!GLOBALCONTOUR 1 LEGEND { SHOW = YES } 130 COLORCUTOFF { RANGEMIN = 3 RANGEMAX = 5 INCLUDEMIN = YES INCLUDEMAX = YES } COLORMAPFILTER { REVERSECOLORMAP = YES COLORMAPOVERRIDEACTIVE = YES COLORMAPOVERRIDE 1 { INCLUDE = YES COLOR = YELLOW STARTLEVEL = 7 ENDLEVEL = 9 } } $!GLOBALEDGE Syntax: $!GLOBALEDGE Description:A SetValue command that sets attributes which sets the minimum crease angle for edges. Optional Parameters If you would like the settings in this command to persist, add them to your tecplot.cfg file (located in your installation directory). Parameter Syntax MINCREASEANGLE = <double> Default Notes 135 $!GLOBALFRAME Syntax: $!GLOBALFRAME [optional parameters] Description:A SetValue command that sets attributes which apply to all frames. If you would like the settings in this command to persist, add it to your tecplot.cfg file, located in your installation directory. Optional Parameters If you would like the settings in this command to persist, add them to your tecplot.cfg file (located in your installation directory). Parameter FRAMEHEADERFORMAT Syntax Default = <string> Notes The <string> contains the text that appears in each of Tecplot 360’s frame headers. This string typically contains dynamic text. See also Section 18 - 1.5 “Dynamic Text” in the User’s Manual. The default string is: "&(FRAMENAME)|&(DATE)|&(DATASETTITLE)." FRAMEHEADERHEIGHT <op> <dexp> = 0.2 Value is in inches. SNAPTOGRID = <boolean> NO Even if set to YES, Tecplot 360 may not allow snapping in some situations. 131 Parameter Syntax Default Notes SNAPTOPAPER = <boolean> NO Even if set to YES, Tecplot 360 may not allow snapping in some situations. USETHICKERACTIVE- = <boolean> YES When set to YES (which is the default behavior), the active frame displays in the work area with a border one pixel wider than specified, to make the active frame more visible. Set this to NO to keep the active frame the same size as specified (but still black while inactive frames are gray). This will not affect printed or exported material unless the image is exported directly from the workspace. FRAMEBORDERON SREEN Example: Customize the frame header text, and set the frame header height to be 0.25 inches: $!GLOBALFRAME FRAMEHEADERFORMAT = "My frame, the current date is &(Date), &(Time)" FRAMEHEADERHEIGHT = 0.25 $!GLOBALLINEPLOT Syntax: $!GLOBALLINEPLOT [optional parameters] Description:A SetValue command that changes global attributes associated with Line-plots. If you would like the settings in these commands to persist, add it to your tecplot.cfg file, located in your installation directory. Optional Parameters If you would like the settings in these commands to persist, add them to your tecplot.cfg file (located in your installation directory). Parameter Syntax Default DATALABELS Notes These are text values that can be added to a plot to show the indices or values for the data points. { COLOR = <color> BLACK COLORBYZONEMAP = <boolean> NO DISTANCESKIP <op> <dexp> =5 INCLUDEBOX = <boolean> YES INDEXSKIP <op> <integer> =1 NODELABELTYPE = <labeltype> INDEX NUMFORMAT <<numberformat >> SHOWNODELABELS = <boolean> NO SKIPMODE = <skipmode> BYINDEX TEXTSHAPE <<textshape>> See Notes CELLLABELTYPE = <labeltype> INDEX Not allowed to change size units parameter. FONTFAMILY="Helvetica", ISBOLD=NO, ISITALIC=NO, SIZEUNITS=FRAME, HEIGHT=3 } LEGEND Attributes for an optional legend added to a Line-plot. Entries in the legend are determined dynamically by Tecplot 360 depending on which mappings are turned on. { ANCHORALIGNMENT 132 = <anchoralignme nt> TOPRIGHT Parameter BOX Syntax Default <<textbox>> See Notes ROWSPACING <op> <dexp> = 1.2 SHOW = <boolean> NO SHOWTEXT = <boolean> YES TEXTCOLOR BLACK TEXTSHAPE = <color> <<textshape>> XYPOS <<xy>> X=95, Y=80 See Notes Notes BOXTYPE=HOLLOW, MARGIN=10, LINETHICKNESS=0.1, COLOR=BLACK, FILLCOLOR=WHITE Not allowed to change size units. FONTFAMILY="Helvetica", ISBOLD=YES, ISITALIC=NO, SIZEUNITS=FRAME, HEIGHT=3 } Example: Turn on the data labels and show the Line-legend. Use boldface Times font in the legend: $!GLOBALLINEPLOT DATALABELS { SHOWNODELABELS = YES } LEGEND { SHOW = YES TEXTSHAPE { FONTFAMILY = "Times" ISBOLD = YES ISITALIC = NO } } } $!GLOBALLINKING Syntax:$!GLOBALLINKG LINKCOLORMAPS = <boolean> Description:Set to YES to tie all colormaps together. If you would like the settings in this command to persist, add it to your tecplot.cfg file, located in your installation directory. Required Parameters If you would like the settings in this command to persist, add them to your tecplot.cfg file (located in your installation directory). Parameter LINKCOLORMAPS Syntax = <boolean> Default Notes YES $!GLOBALPAPER Syntax: $!GLOBALPAPER [optional parameters] Description:A SetValue command that sets the paper size characteristics. If you would like the settings in this command to persist, add it to your tecplot.cfg file, located in your installation directory. 133 Optional Parameters If you would like the settings in these commands to persist, add them to your tecplot.cfg file (located in your installation directory). Parameter Syntax Default Notes PAPERSIZEINFO { LETTER <<papersize>> DOUBLE <<papersize>> A3 <<papersize>> WIDTH=11.693, HEIGHT=16.535, LEFTHARDCLIPOFFSET=0.125, RIGHTHARDCLIPOFFSET=0.125, TOPHARDCLIPOFFSET=0.125, BOTTOMHARDCLIPOFFSET=0.125 A4 <<papersize>> WIDTH=8.2677, HEIGHT=11.693, LEFTHARDCLIPOFFSET=0.125, RIGHTHARDCLIPOFFSET=0.125, TOPHARDCLIPOFFSET=0.125, BOTTOMHARDCLIPOFFSET=0.125 CUSTOM1 <<papersize>> CUSTOM2 <<papersize>> WIDTH=8.5, HEIGHT=11, LEFTHARDCLIPOFFSET=0.125, RIGHTHARDCLIPOFFSET=0.125, TOPHARDCLIPOFFSET=0.125, BOTTOMHARDCLIPOFFSET=0.125 } See also: Section “$!PAGE” on page 164. $!GLOBALPOLAR Syntax: $!GLOBALPOLAR [optional parameters] Description:Allows polar plots to have curved lines that are interpolated along the R-Axis between data points. Optional Parameters If you would like the settings in this command to persist, add them to your tecplot.cfg file (located in your installation directory). Parameter Syntax Default Notes ANGLE = <double> 5 Determines the angle for which lines will be approximated as curves. DRAWSTRAIGHTLINES = <boolean> YES Alternates between straight and curved interpolated lines for polar plots. Example: This example turns on curved lines and defines the maximum angle to be approximated as a curved line to be 2.0 degrees. $!GLOBALPOLAR DRAWSTRAIGHTLINES = NO ANGLE = 2.0 134 $!GLOBALRGB Syntax: $!GLOBALRGB RGBMode = <rgbmode> [optional parameters] Description:Allows RGB coloring for plots which have RGB values specified at each vertex. This coloring option is valuable for plots with entities such as Gas, Oil and Water. RGB Coloring can be assigned to field plot objects such as zones, iso-surfaces and slices Required Parameter Parameter RGBMODE Syntax Default = <specifyrgb> Notes SPECIFY RGB Sets whether the user specifies all three color variables for RGB Coloring, or if Tecplot 360 calculates one variable while the user specifies two. Optional Parameters If you would like the settings in these commands to persist, add them to your tecplot.cfg file (located in your installation directory). Parameter Syntax Default Notes REDCHANNELVAR = <integer> Sets variable for the red channel. GREENCHANNELVAR = <integer> Sets variable for the green channel. BLUECHANNELVAR = <integer> RANGEMIN = <double> 0.0 RANGEMAX = <double> 1.0 TOPCENTER Sets variable for the blue channel. LEGEND { ANCHORALIGNMENT = <anchoralignment> BLUECHANNELLABEL = <string> BOX <<textbox>> GREENCHANNELLABEL = <string> HEIGHT = <double> REDCHANNELLABEL = <string> RGBLEGENDORIENTATION = <rgblegendorientation> RGB SHOW = <boolean> NO SHOWLABELS = <boolean> YES TEXTCOLOR = <color> BLACK TEXTSHAPE <<textshape>> See Notes USEBLUEVARNAME = <boolean> YES USEGREENVARNAME = <boolean> YES USEREDVARNAME = <boolean> YES XYPOS <<xy>> X = 80, Y = 80 See Notes BOXTYPE=NONE, MARGIN=10, LINETHICKNESS=0.1, COLOR=BLACK, FILLCOLOR=WHITE 10 FONTFAMILY="Helvetica", ISBOLD=NO, ISITALIC=NO, SIZEUNITS=FRAME, HEIGHT=2.5 } Example: 135 This example turns on RGB Coloring and defines variables for the Red and Green Channel, leaving Tecplot 360 to calculate the Blue Channel values. $!GLOBALRGB RGBMODE = SPECIFYRG REDCHANNELVAR = 1 GREENCHANNELVAR = 4 $!GLOBALSCATTER Syntax: $!GLOBALSCATTER [optional parameters] Description:A SetValue command that changes global attributes associated with scatter plots. Optional Parameters If you would like the settings in these commands to persist, add them to your tecplot.cfg file (located in your installation directory). Parameter BASEFONTFAMILY Syntax = <string> Default Notes "Helvetica" DATALABELS These are text labels that can be added to a plot to show node or cell values. { CELLLABELTYPE = <labeltype> CELLLABELVAR = <integer> COLOR = <color> BLACK COLORBYZONEMAP = <boolean> NO DISTANCESKIP <op> <dexp> INDEX INCLUDEBOX = <boolean> YES INDEXSKIP <op> <integer> 1 NODELABELTYPE = <labeltype> INDEX NODELABELVAR <op> <integer> NUMFORMAT <<numberformat>> See Notes SHOWCELLLABELS = <boolean> NO SHOWNODELABELS = <boolean> NO SKIPMODE = <skipmode> <<textshape>> TEXTSHAPE FONTFAMILY= "Helvetica", ISBOLD=NO, ISITALIC=NO, SIZEUNITS=FRAME, HEIGHT=3 } ISBOLD = <boolean> YES ISITALIC = <boolean> NO <<anchorpos>> TOPRIGHT LEGEND { ANCHORALIGNMENT 136 FORMATTING=BESTFLOAT, CUSTOMLABEL=1, PRECISION=4, SHOWDECIMALSONWHOLENUMBE RS=NO, REMOVELEADINGZEROS=NO, SHOWNEGATIVESIGN=YES, TIMEDATEFORMAT=’yyyy-mm-dd hh:mm:ss.00’ Not allowed to change size units parameter Parameter Syntax Default BOX <<textbox>> See Notes ROWSPACING <op> <dexp> = 1.2 SHOW = <boolean> NO SHOWTEXT = <boolean> YES TEXTCOLOR = <color> BLACK TEXTSHAPE <<textshape>> FONTFAMILY= "Helvetica", ISBOLD=YES, ISITALIC=NO, SIZEUNITS=FRAME, HEIGHT=3 XYPOS <<xy>> X=95, Y=80 Notes BOXTYPE=HOLLOW,MARGIN=10, LINETHICKNESS=0.1, COLOR=BLACK, FILLCOLOR=WHITE Not allowed to change size units parameter. } REFSCATSYMBOL { COLOR = <color> RED FILLCOLOR = <color> RED ISFILLED = <boolean> NO LINETHICKNESS = 0.1 MAGNITUDE <op> <dexp> <op> <dexp> SHOW = <boolean> NO SYMBOLSHAPE <<symbolshape>> See Notes XYPOS <<xy>> X=80, Y=80 RELATIVESIZE <op> <dexp> =0 Scaling factor for scatter symbols sized “By Variable.” RELATIVESIZEING = <boolean> YES If YES, scatter sizing “By Variable” is in grid units /magnitude otherwise centimeters/magnitude. =1 ISASCII=NO, GEOMSHAPE=SQUARE } RIDUNITS SPHERESCATTERRENDER QUALITY VAR HIGH = <spherescatterrenderquality> Config file and stylesheet only option. = <integer> Scatter sizing variable. Example: This example does the following: • Increases the relative size of scatter symbols that are sized by variable by ten percent. • Turns on the scatter sizing legend. • Turns on the reference scatter symbol and makes it red. • Turns on data labels for nodes. $!GLOBALSCATTER RELATIVESIZE * = 1.1 LEGEND { SHOW = YES } REFSCATSYMBOL { SHOW = YES COLOR = RED } DATALABELS { 137 SHOWNODELABELS = YES } $!GLOBALTHREED Syntax: $!GLOBALTHREED [optional parameters] Description:A SetValue command that changes global attributes associated with 3D plots. Optional Parameters If you would like the settings in these commands to persist, add them to your tecplot.cfg file (located in your installation directory). Parameter Syntax Default AXISBOXPADDING <op> <dexp> =5 AXISSCALEFACT <<xyz>> X=1, Y=1, Z=1 Notes The 3D axis must be INDEPENDENT for this option to work properly. See $!THREEDAXIS. LIGHTSOURCE { BACKGROUNDLIGHT = <double> 25 INCLUDESPECULAR = <boolean> YES INTENSITY = <double> 75 SPECULARINTENSIT Y = <integer> 40 Range = 1-100 SPECULARSHININES S = <integer> 60 Range = 1-100 SURFACECOLORCONT RAST = <double> 100 XYZDIRECTION <<xyz>> X = -0.2, Y = -0.2, Z = 0.959... FORCEGOURADFOR3D CONTFLOOD = <boolean> YES = <boolean> YES LINELIFTFRACTION <op> <dexp> = 0.2 NEARPLANEFRACTION <dexp> 0.1 PERFORMEXTRA3D <boolean> NO FORCEPANELED FOR3DCELLFLOOD Always specify all three components here. Tecplot 360 normalizes X, Y and Z after processing the Z-component. X, Y and Z represent a vector in the eye coordinate system. } Specify the position of the "near plane". In a 3D plot, the "near plane" acts as a windshield: anything in front of this plane does not display. SORTING PLACEMENTPLANE Specify the coordinate of the placement plane. POSITION { X = <double> Y = <double> Z = <double> } ROTATEORIGIN <<xyz>> X=0.5, Y=0.5, Z=0.5 <<xyz>> X=0, Y=0, Z=0 SLICE { ORIGIN 138 Parameter NORMAL Syntax Default <<xyz>> X=0, Y=0, Z=1 <op> <dexp> = 0.6 <op> <dexp> = 0.7 Notes } SYMBOLLIFT FRACTION VECTORLIFT FRACTION Example: $!GLOBALTHREED ROTATEORIGIN{X = 4.36052333891} $!GLOBALTHREED LIGHTSOURCE { XYZDIRECTION { X = 0.398226616447 Y = 0.435028248588 Z = 0.807567944438 } } $!GLOBALTHREED LIGHTSOURCE{INTENSITY = 80} $!GLOBALTHREED LIGHTSOURCE{BACKGROUNDLIGHT = 25} $!GLOBALTHREED LIGHTSOURCE{SURFACECOLORCONTRAST = 85} $!GLOBALTHREED LINELIFTFRACTION = 7 $!GLOBALTHREED SYMBOLLIFTFRACTION = 0.5 $!GLOBALTHREED VECTORLIFTFRACTION = 6 $!GLOBALTHREED PERFORMEXTRA3DSORTING = YES $!GLOBALTHREEDVECTOR Syntax: $!GLOBALTHREEDVECTOR [optional parameters] Description:A SetValue command that changes global attributes associated with 3D vector plots. Optional Parameters If you would like the settings in these commands to persist, add them to your tecplot.cfg file (located in your in installation directory). Parameter ARROWHEADANGLE Syntax Default Notes <op> <dexp> <op> <dexp> = 18 Angle is in degrees. = 0.2 Head is sized as a fraction of the stem length. <op> <dexp> =2 Value is in Y-frame units. SHOW = <boolean> NO COLOR = <color> BLACK MAGNITUDE =1 ANGLE <op> <dexp> <op> <dexp> <op> <dexp> XYPOS <<xy>> X=80, Y=80 HEADSIZEASFRACTIO N HEADSIZEINFRAMEUN ITS REFVECTOR { LINETHICKNESS = 0.1 =0 MAGNITUDELABEL 139 Parameter Syntax Default Notes { SHOW = <boolean> NO TEXTCOLOR = <color> <<textshape>> BLACK TEXTSHAPE FONTFAMILY= "Helvetica", ISBOLD=YES, ISITALIC=NO, SIZEUNITS=FR AME, HEIGHT=3 NUMFORMAT <<numberformat> > OFFSET = <double> 2 RELATIVELENGTH <op> <dexp> =0 RELATIVELENGTHIN = <boolean> YES If YES and USERELATIVE is YES then vectors are sized in Grid Units/Magnitude. If NO and USERELATIVE is YES then vectors are sized in cm/magnitude. = <boolean> YES If YES, HEADSIZEASFRACTION is used to size arrowheads otherwise HEADSIZEINFRAMEUNITS is used. Value is in Y-frame units. } } GRIDUNITS SIZEHEADBY FRACTION UNIFORMLENGTH <op> <dexp> =2 USERELATIVE = <boolean> YES UVAR = <integer> Variable number for the X-vector component. VVAR = <integer> Variable number for the Y-vector component. WVAR = <integer> Variable number for the Z-vector component. If NO, vectors are all the same size (UNIFORMLENGTH). Example: This example does the following: • Makes all vectors be uniform in size; 5 percent in Y-frame units. • Makes the arrowheads 0.2 times the size of the stems. • Turns off the reference vector. $!GLOBALTHREEDVECTOR USERELATIVE = NO UNIFORMLENGTH = 5 HEADSIZEASFRACTION = .2 REFVECTOR { SHOW = NO } $!GLOBALTIME Syntax: $!GLOBALTIME SolutionTime Description: A SetValue command for frames (2D and 3D ONLY). Different frames can have different values of $!GLOBALTIME. If you would like the settings in this command to persist, add them to your tecplot.cfg file (located in your installation directory). Parameter SOLUTIONTIME 140 Syntax = <double> Default 0 Notes If SolutionTime is not set to a solution time in set of solution times from all zones of the active strand field-maps, SolutionTime is adjusted to the closest value in that set. $!GLOBALTWODVECTOR Syntax: $!GLOBALTWODVECTOR [optional parameters] Description:A SetValue command that changes global attributes associated with 2D vector plots. Optional Parameters If you would like the settings in these commands to persist, add them to your tecplot.cfg file (located in your installation directory). Parameter ARROWHEADANGLE Syntax Default Notes <op> <dexp> <op> <dexp> = 18 Angle is in degrees. = 0.2 Head is sized as a fraction of the stem length. <op> <dexp> =2 Value is in Y-frame units. SHOW = <boolean> NO COLOR = <color> BLACK MAGNITUDE =1 ANGLE <op> <dexp> <op> <dexp> <op> <dexp> XYPOS <<xy>> X=80, Y=80 SHOW = <boolean> NO TEXTCOLOR = <color> <<textshape>> BLACK HEADSIZEAS FRACTION HEADSIZEINFRAME UNITS REFVECTOR { LINETHICKNESS = 0.1 =0 MAGNITUDELABEL { TEXTSHAPE See Notes FONTFAMILY="Helvetica", ISBOLD=YES, ISITALIC=NO, SIZEUNITS=FRAME, HEIGHT=3 NUMFORMAT <<numberformat> > OFFSET = <double> 2 RELATIVELENGTH <op> <dexp> =0 RELATIVELENGTH = <boolean> YES If YES and USERELATIVE is YES then vectors are sized in Grid Units/Magnitude. If NO and USERELATIVE is YES then vectors are sized in cm/magnitude. = <boolean> YES If YES, HEADSIZEASFRACTION is used to size arrowheads otherwise HEADSIZEINFRAMEUNITS is used. Value is in Y-frame units. } } INGRIDUNITS SIZEHEADBY FRACTION UNIFORMLENGTH <op> <dexp> =2 USERELATIVE = <boolean> YES UVAR = <integer> Variable number for the X-vector component. VVAR = <integer> Variable number for the Y-vector component. If NO, vectors are all the same size (UNIFORMLENGTH). Example: This example does the following: • Doubles the vector length (assume vectors currently drawn using relative length). • Make the vector heads uniform in size; 2 percent in frame units. 141 • Make the head angle 15 degrees. $!GLOBALTWODVECTOR RELATIVELENGTH *= 2 SIZEHEADBYFRACTION = NO HEADSIZEINFRAMEUNITS = 2 HEADANGLE = 15 I $!IF...$!ENDIF Syntax: $!IF <conditionalexp> $!ENDIF Description:Conditionally process macro commands. Examples: Example 1: Process macro commands if the macro variable |myvar| is less than 73.2: $!IF |myvar| < 73.2 $!ENDIF Example 2: Process macro commands if the macro variable |response| is YES: $!IF "|response|" == "YES" . . . $!ENDIF $!INCLUDEMACRO Syntax: $!INCLUDEMACRO <string> Description:Insert the commands from another macro file. Because the $!INCLUDEMACRO command is processed when the macro is loaded and not when the macro is executed, you are not allowed to reference macro variables within the <string> parameter. Example: Include the macro file m2.mcr: $!INCLUDEMACRO "m2.mcr" $!INTERFACE Syntax: 142 $!INTERFACE [optional parameters] Description:A SetValue command that sets attributes related to the Tecplot 360 interface. Optional Parameters If you would like the settings in these commands to persist, add them to your tecplot.cfg file (located in your installation directory). Parameter ALLOWDATAPOINTSELECT Syntax Default = <boolean> YES Notes If YES, Tecplot 360 allows you to use the Adjustor tool to select and move data points. ALLOWDATAPOINTADJUST = <boolean> YES ALWAYSPOPACTIVEFRAME = <boolean> NO If YES, whenever the active frame changes in the interface, Tecplot 360 moves the active frame to the top of the draw order. This makes Tecplot 360 run like v.11.3 and earlier versions, and may help older add-on and macros to run correctly. Default is NO. AUTOREDRAWISACTIVE = <boolean> YES Set to NO to turn Auto Redraw off. BACKINGSTOREMODE = <backingstoremode> REALTIMEUPDATE BEEPONFRAMEINTERRUPT = <boolean> NO CACHELIGHTDISPLAY = <boolean> NO LISTSONLY CONSERVEDERIVED When caching graphics in display lists, only cache those objects which use little memory. When this is on, only approximated plots are saved. Full plots are not saved. This only has an effect if USEDISPLAYLISTS is set to YES, and if USEAPPROXIMATEPLOTS is YES. = <boolean> VARIABLESPACE COLLECTTIME = <boolean> NO SMOOTHBNDRYCOND = <boundarycondition> FIXED NUMSMOOTHPASSES =1 LINEARINTERPCONST <op> <integer> <op> <dexp> <op> <dexp> <op> <dexp> <op> <dexp> LINEARINTERPMODE = <linearinterpmode> SETTOCONST INTERPPTSELECTION = <pointselection> OCTANTNPOINTS INTERPNPOINTS =8 KRIGZEROVALUE <op> <integer> <op> <dexp> <op> <dexp> KRIGDRIFT = <krigdrift> LINEAR DERIVATIVEBOUNDARY = <derivpos> SIMPLE TRIANGLEKEEPFACTOR <op> <dexp> = 0.25 VARIABLEDERIVATIONME THOD = [ACCURATE or FAST] FAST VOLUMECELLINTERPOLAT IONMODE = [TRILINEAR or PIECEWISELINEAR] PIECEWISELINEAR EXTRACTSLICEFROMPLAN ECOPYCELLCENTERS = <boolean> NO STATISTICS DATA { SMOOTHWEIGHT INVDISTEXPONENT INVDISTMINRADIUS KRIGRANGE = 0.5 = 3.5 =0 =0 = 0.3 =0 By default, volume interpolation is piece-wise linear and calculates for first-order accuracy. This tri-linear interpolation option calculates for second-order accuracy. 143 Parameter Syntax Default CONTLINECREATEMODE = [ONEZONEPERCONTOU RLEVEL, ONEZONEPERINDEPEN DENTPOLYLINE] ONEZONEPERCONTOU RLEVEL POLYCELLINTERPOLATIO NMODE = [USECCVALUE, AVERAGENODES] AVERAGENODES Notes This parameter only appears in the tecplot config file. When using contour flooding, contour lines, or precise value blanking for polyhedral and polygonal data, it chooses between using the cell-centered value or using the average of the nodes. This parameter also applies to the creation of iso-surfaces for cellcentered values in a polyhedral zone. It does not apply to Primary Value contour flooding. } DIALOGPLACEMENT { ADVANCED3DCONTROLDIA LOG <<dialogplacement>> AXISEDITDIALOG <<dialogplacement>> COLORMAPDIALOG <<dialogplacement>> CONTOURDIALOG <<dialogplacement>> CREATE1DLINEDIALOG <<dialogplacement>> CREATECIRCULARZONEDI ALOG <<dialogplacement>> CREATERECTANGULARZON EDIALOG <<dialogplacement>> CREATEZONEFROM POLYLINESDIALOG <<dialogplacement>> CREATEZONEFROMVALUES DIALOG <<dialogplacement>> CURVEINFODIALOG <<dialogplacement>> DATAINFODIALOG <<dialogplacement>> DATALABELSDIALOG <<dialogplacement>> DATASPREADSHEETDIALO G <<dialogplacement>> DELETEVARIABLESDIALO G <<dialogplacement>> DELETEZONESDIALOG <<dialogplacement>> DEPTHBLANKINGDIALOG <<dialogplacement>> DUPLICATEZONEDIALOG <<dialogplacement>> EQUATIONDIALOG <<dialogplacement>> EXPORTDIALOG <<dialogplacement>> EXTRACTCONTOURLINESD IALOG <<dialogplacement>> EXTRACTDISCRETEPOINT SDIALOG <<dialogplacement>> EXTRACTFEBOUNDARYDIA LOG <<dialogplacement>> EXTRACTISOSURFACESDI ALOG <<dialogplacement>> EXTRACTPOINTSFROMGEO METRYDIALOG <<dialogplacement>> 144 The DIALOGPLACMENT parameter may only appear in the tecplot config file. You may specify the placement of the indicated dialogs. Dialog placement is relative to the main Tecplot 360 window. Parameter Syntax EXTRACTPOINTSFROMPOL YLINEDIALOG <<dialogplacement>> EXTRACTSLICEFROMPLAN EDIALOG <<dialogplacement>> EXTRACTSLICESDIALOG <<dialogplacement>> EXTRACTSTREAMTRACESD IALOG <<dialogplacement>> EXTRACTSUBZONEDIALOG <<dialogplacement>> IJKBLANKINGDIALOG <<dialogplacement>> IMPORTDIALOG <<dialogplacement>> INVERSEDISTANCEINTER POLATIONDIALOG <<dialogplacement>> IOFFSET <<dialogplacement>> JOFFSET <<dialogplacement>> ISOSURFACESDIALOG <<dialogplacement>> KRIGINGINTERPOLATION DIALOG <<dialogplacement>> LIGHTSOURCEDIALOG <<dialogplacement>> LINEARINTERPOLATIOND IALOG <<dialogplacement>> LINEMAPLEGENDDIALOG <<dialogplacement>> LOADDATADIALOG <<dialogplacement>> MACROPLAYDIALOG <<dialogplacement>> MACRORECORDDIALOG <<dialogplacement>> MACROVIEWERDIALOG <<dialogplacement>> MIRRORZONEDIALOG <<dialogplacement>> NEWLAYOUTDIALOG <<dialogplacement>> OPENLAYOUTDIALOG <<dialogplacement>> ORDERFRAMESDIALOG <<dialogplacement>> PAPERSETUPDIALOG <<dialogplacement>> POLARDRAWINGOPTIONSD IALOG <<dialogplacement>> PRINTDIALOG <<dialogplacement>> RULERGRIDDIALOG <<dialogplacement>> SAVEASDIALOG <<dialogplacement>> SAVEDIALOG <<dialogplacement>> SCATTERLEGENDDIALOG <<dialogplacement>> SCATTERREFERENCESYMB OLDIALOG <<dialogplacement>> SCATTERSIZEANDFONTDI ALOG <<dialogplacement>> SLICESDIALOG <<dialogplacement>> SMOOTHDIALOG <<dialogplacement>> SPATIALVARSDIALOG <<dialogplacement>> STREAMTRACESDIALOG <<dialogplacement>> STYLELINKINGDIALOG <<dialogplacement>> THREEDAXISLIMITSDIAL OG <<dialogplacement>> THREEDORIENTATIONAXI SDIALOG <<dialogplacement>> THREEDVIEWDETAILSDIA LOG <<dialogplacement>> THREEDVIEWROTATEDIAL OG <<dialogplacement>> Default Notes 145 Parameter Syntax TRANSFORMCOORDINATES DIALOG <<dialogplacement>> TRANSLATEMAGNIFYDIAL OG <<dialogplacement>> TRIANGULATEDIALOG <<dialogplacement>> TWODDRAWORDERDIALOG <<dialogplacement>> VALUEBLANKINGDIALOG <<dialogplacement>> VECTORARROWHEADSDIAL OG <<dialogplacement>> VECTORLENGTHDIALOG <<dialogplacement>> VECTORREFERENCEVECTO RDIALOG <<dialogplacement>> VECTORVARSDIALOG <<dialogplacement>> WRITEDATADIALOG <<dialogplacement>> ZONEMAPSTYLEDIALOG <<dialogplacement>> Default Notes } ENABLEDELAYS = <boolean> YES ENABLEINTERRUPTS = <boolean> YES Enable or disable user interrupts. ENABLEPAUSES = <boolean> YES Enable or disable pause. ENABLEWARNINGS = <boolean> YES GLOBALPLACEMENTPLANE Enable or disable delays in macro commands. Enable or disable warning dialogs. Use a placement plane. { SHOW Turn the placement plane on/off. PLACEMENTPLANEORIENT ATION Specify the axis orientation of the placement plane. FONTPATH <string> IDOTSPERSQUAREINCH = <double> INTIALFIELDPROBE = [NODALVALUES, ZONECELLINFO, CELLCENTEREDVALUES, or FACENEIGHBORS] NODALVALUES INITIALPLOTFIRSTZONEO NLY = <boolean> NO INITIALPLOTTYPE = <plottype> AUTOMATIC INTERRUPTCHECKING = <integer> Set the number of milliseconds between checks for a key- or buttonpress by the user to interrupt processing in Tecplot 360. JDOTSPERSQUAREINCH = <double> This along with IDOTSPERSQUAREINCH set the size and aspect of the screen. If left unspecified, Tecplot 360 will determine the value for you. LISTCOMMANDSINMACRO = <boolean> If NO, macro commands are displayed in full one at a time. DIALOGPAGE The operating system’s font folder(s) This along with JDOTSPERSQUAREINCH set the size and aspect of the screen. If left unspecified, Tecplot 360 will determine the value for you. FREQUENCY VIEWER LOADADDONSUSING LAZYRELOCATE 146 = <boolean> One or more directories where TrueType fonts can be found, e.g. ’"PATH1" "PATH2" "PATH3"’. Note use of double quotes around each path and single quotes around the eniter string. YES If YES, only the first enabled zone is activated. Default shows all zones (except from within a layout). If set to NO, all add-on symbols are loaded immediately. Parameter MAXCUSTOMCOLORSIN Syntax Default = <integer> 56 MAXNUMUNDOLEVELS = <integer> 50 MINPIXELSFORDRAG = <integer> 1 BUTTONCLICK = <mousebuttonclick> REDRAW SIMPLEDRAG = <mousebuttondrag> ZOOMDATA CONTROLLEDDRAG = <mousebuttondrag> ZOOMDATA ALTEDDRAG = <mousebuttondrag> ZOOMVIEWER SHIFTEDDRAG = <mousebuttondrag> ZOOMPAPER CONTROLALTEDDRAG = <mousebuttondrag> ZOOMVIEWER CONTROLSHIFTEDDRAG = <mousebuttondrag> ZOOMPAPER ALTSHIFTEDDRAG = <mousebuttondrag> ZOOMVIEWER CONTROLALTSHIFTEDDRA G = <mousebuttondrag> ZOOMPAPER BUTTONCLICK = <mousebuttonclick> REVERTTOSELECT SIMPLEDRAG = <mousebuttondrag> TRANSLATEDATA CONTROLLEDDRAG = <mousebuttondrag> ROLLERBALL ROTATEDATA ALTEDDRAG = <mousebuttondrag> TRANSLATE VIEWER SHIFTEDDRAG = <mousebuttondrag> TRANSLATEPAPER CONTROLALTEDDRAG = <mousebuttondrag> ZOOMVIEWER CONTROLSHIFTEDDRAG = <mousebuttondrag> ROLLERBALL ROTATEDATA ALTSHIFTEDDRAG = <mousebuttondrag> TRANSLATEPAPER CONTROLALTSHIFTEDDRA G = <mousebuttondrag> ZOOMVIEWER = <integer> 10 INTERFACE Notes UNIX only. Valid values are 1 to 56. Some UNIX displays cannot allocate enough colors for the Tecplot 360 interface. Use this option to limit the number of custom colors displayed in the Tecplot 360 interface. Number of pixels to move the pointer before it is considered a drag. MOUSEACTIONS { MIDDLEBUTTON { } RIGHTBUTTON { } } NUMCOLORCELL STORETURN NUMMOUSEBUTTONS = <integer> NUMPTSALLOWEDBEFORE = <integer> APPROX This option is only for UNIX users who are using MIDDLEMOUSEBUTTONMODE or RIGHTMOUSEBUTTONMODE. 500,000 When a frame’s active zones contain this many points or less, the frame is not approximated, but always drawn in full. This applies to all frames when PLOTAPPROXIMATIONMODE is AUTOMATIC, and to the active frame only when PLOTAPPROXIMATIONMODE is NONCURRENTALWAYSAPPROX. This setting has no effect when PLOTAPPROXIMATIONMODE is set to ALLFRAMESALWAYSAPPROX. 147 Parameter OKTOEXECUTESYSTEM Syntax Default Notes = <boolean> YES Allow use of $!SYSTEM commands in macros. This is a security issue. If set to NO and the macro is run intermittently you will be asked for permission to execute the $!SYSTEM command. If Tecplot 360 is run in batch mode and this is NO an error will be generated and the macro will terminate. RUNDISPLAYLISTSAFTER BUILDING = <boolean> YES Tecplot 360 defaults to building and running display lists simultaneously. Turn RunDisplayListsAfterBuilding on if you want to run the display lists after they are built. This may increase display list performance on some machines. The difference is often times negligible. ALLOWHWACCELERATION = <boolean> YES Windows only. This will disable hardware acceleration for Tecplot 360 without having to change the Windows Display Properties. Setting ALLOWHWACCELERATION to NO may fix errors caused by hardware acceleration on buggy graphics card drivers. COMMAND OPENGLCONFIG { SCREENRENDERING <<renderconfig>> Sets options for screen rendering. IMAGERENDERING <<renderconfig>> Sets options for offscreen rendering (for image exports or raster printing). = <integer> 2 = <boolean> NO = <integer> 10 Sets the percentage of points to keep in a frame when a frame is approximated. See also Section “Best Practices For Rendering Performance” in the User’s Manual. PICKHANDLEWIDTH <op> <dexp> = 0.1 Value is in inches on the screen. PLOTAPPROXIMATION = <plotapproximationmode> AUTOMATIC Specifies the mode in which you PRINTDEBUG = <boolean> NO If YES, debugging information is sent to the standard output. QUICKCOLORMODE = <quickcolormode> LINECOLOR Choose objects for color changes made using the Quick Edit dialog MAXFILTERMAGNIFICATI ON INCLUDEBACKBUFFERDUR INGFRONTBUFFERDRAWS Sets the maximum magnification by non-texture resize filter before textures are used. This keeps Tecplot 360 from creating textures which are too large. Setting this above three is not recommended. Setting below 1.0 will result in the use of a faster texture algorithm. } PERCENTAGEOFPOINTS TOKEEP MODE want the plots to be approximated. See Section “Plot Approximation” in the User’s Manual for a complete description of each mode. ROTATION Settings for interactive rotations in 3D. { ROTATIONMODE = <rotationmode> XYAXIS CURRENTANGLE <op> <dexp> <op> <dexp> <op> <dexp> <op> <dexp> =5 SMALLANGLE MEDIUMANGLE LARGEANGLE 148 =1 =5 = 15 Parameter Syntax ROTATEDEGPERFRAMEUNI T = <integer> SHOWGEOMS = <boolean> Default Notes YES } ROTATEDEGPERFRAME = <integer> UNIT RULERPADDING <op> <dexp> = 0.05 Distance between workarea ruler and clipping edge for the paper and frames. Units are inches. RULERTHICKNESS <op> <dexp> = 0.15 Value is in inches on the screen. SCALE Settings for interactive scaling. { STEPSIZE SMALLSTEP MEDIUMSTEP LARGESTEP ZOOMSCALEPERFRAMEUNI T <op> <dexp> <op> <dexp> <op> <dexp> <op> <dexp> <op> <double> = 10 =1 = 10 = 20 =4 } SCRBACKGROUNDCOLOR = <color> SECURESPOOLCOMMANDS = <boolean> YES SHOWCONTINUOUSSTATUS = <boolean> YES SHOWCOORDINATES = <boolean> YES SHOWCOORDINATESWITH = <boolean> NO Set the workspace background color. SELECTORADJUSTOR Set to NO to allow $!SPOOLER commands outside the configuration file. When YES, running coordinates for both X&Y are displayed in grid coordinates in the status line for all plot types except 3D. If $!INTERFACE SHOWCOORDINATES is off, the value of SHOWCOORDINATESWITHSELEC TORADJUSTOR is ignored. This command is available via the config file (tecplot.cfg) only. SHOWFRAMEBORDERS = <boolean> NO SHOWSTATUSLINE = <boolean> YES SHOWTEXTGEOMSIN = <boolean> YES SHOWTOOLTIPS = <boolean> YES SHOWWAITDIALOGS = <boolean> YES SIDEBARSIZING = <sidebarsizing> MAXOFALL WHENOFF APPROXVIEWS TRANSLATION If YES, frame borders are drawn using a dashed line when they are turned off. This applies only to the screen and does not effect the hardcopy. Set to YES if you want text and geometries to show up in frames using approximated plots If NO, all "Please Wait" and "Percent Done" dialogs will be disabled. Settings for interactive translation. { STEPSIZE <op> <dexp> = 10 SMALLSTEP <op> <dexp> =5 MEDIUMSTEP <op> <dexp> = 10 LARGESTEP <op> <dexp> = 20 ZOOMSCALEPERFRAMEUNI T = <double> } 149 Parameter TRUETYPEMINOUTLINE Syntax Default Notes = <integer> 19 on Windows 16 on other platforms Tecplot 360 will use a bitmap font for text smaller than this size. = <boolean> NO Certain platforms have a problem with the ALT key. Set to YES to bypass the problem. USECLASSICADJUSTORTOO L = <boolean> NO If set to YES, uses the old-style adjustor tool that selects the closest control point, rather than the whole object, when clicking. UNIXHELPBROWSERCMD = <string> $TECHOME/bin/ LaunchBrowser/ Sets the command used to launch a browser for add-ons that use HTML for their help file (UNIX only; the Windows operating system automatically connects to primary browser). For security reasons this command can only be used in the Tecplot 360 configuration file. TRYTOUSEDOUBLEBUFFER = <boolean> YES USEINITIALPLOTDIALOG = <boolean> YES UNIXTRUETYPEFONTPATH = <string> USEAPPROXIMATEPLOTS = <boolean> NO YES POINTSIZE USEMOD2MASKFORALT DETECTION USEDISPLAYLISTS = <boolean> USEDOUBLEBUFFERING = <boolean> USEDOUBLEFORDISPLAY = <boolean> Path to where TrueType fonts are stored. Set to YES to use approximate plots. See Section “Plot Approximation” in the User’s Manual for further details. YES LISTS USEFASTAPPROX = <boolean> CONTINUOUSFLOOD USEDISPLAYLISTS = <boolean> USEOFFSCREENBITMAP = <boolean> YES USEOPENGL = <boolean> YES USESTROKEFONTSFOR3D = <boolean> YES Use stroke fonts for data labels and ASCII scatter symbols in 3D plots. TEXT USESTROKEFONTSFOR = <boolean> NO = <boolean> NO XORCOLOR <op> <integer> =0 XPGONFILLOFFSET = <integer> 0 YPGONFILLOFFSET = <integer> 0 ZONEMAPNAMECOLUMN = <double> SCREEN USETECPLOTPRINT Set to YES to use Tecplot 360’s internal stroke fonts, set to NO to use True Type fonts. This option is only available on Windows platforms. When using True Type fonts, switch to stroke fonts for small characters. = <boolean> SMALLSCREENTEXT USESTROKEFONTSON Set to YES to render images offscreen. Set to YES to use Tecplot 360’s printer drivers. Set to NO to use your default printer driver. DRIVERS WIDTH Color index to use for XORed lines. Set to 0 to make Tecplot 360 calculate. Range is 10-1000. Sets the width of the Zone/Map Name column under Plot Attributes. Example: This example does the following: • Makes the frame borders show on the screen when they are turned off. • Makes the middle mouse button be Redraw. • Makes the right mouse button revert to Selector. 150 • Makes the default number of passes for smoothing 20. • Turns off the status line. $!INTERFACE SHOWFRAMEBORDERSWHENOFF = YES MOUSEACTIONS { MIDDLEBUTTON { BUTTONCLICK = REDRAW } RIGHTBUTTON { BUTTONCLICK = REVERTTOSELECT } } DATA { NUMSMOOTHPASSES = 20 } SHOWSTATUSLINE = NO $!INVERSEDISTINTERPOLATE Syntax: $!INVERSEDISTINTERPOLATE DESTINATIONZONE = <integer> [optional parameters] Description:Interpolate selected variables from one or more zones onto a destination zone using the inverse distance method. Required Parameter Parameters DESTINATIONZONE Syntax Default Notes = <integer> Zone to which to interpolate. Optional Parameters Parameters Syntax Default INTERPNPOINTS = <integer> 8 INTERPPTSELECTION = <interpptselection> OCTANTNPOINTS INVDISTEXPONENT = <dexp> 3.5 INVDISTMINRADIUS = <dexp> 0.0 SOURCEZONES = <set> All zones except destination zone. VARLIST = <set> All variables except spatial variables. Notes Choose the variables to interpolate. The spatial variables (X, Y and Z if 3D) are not allowed. Example: Interpolate variables 7-10 from zone 4 to zone 2: $!INVERSEDISTINTERPOLATE SOURCEZONES = [4] DESTINATIONZONE = 2 VARLIST = [7-10] 151 $!ISOSURFACEATTRIBUTES Syntax: $!ISOSURFACEATTRIBUTES [<group>] [optional parameters] Description:A SetValue command which changes attributes associated with iso-surfaces.The optional group parameter can range from 1-8 and defaults to 1 when absent. 152 Optional Parameters Parameter Syntax Default SHOWGROUP = <boolean> YES ISOSURFACESELECTION = <isosurfacesselection> ONESPECIFIC VALUE ISOVALUE1 = <double> 1 x 10150 ISOVALUE2 = <double> 1 x 10150 ISOVALUE3 = <double> 1 x 10150 Notes MESH { LINEPATTERN = <linepattern> SOLID PATTERNLENGTH = <dexp> 2 SHOW = <boolean> NO COLOR = <color> LINETHICKNESS = <double> 0.1 MESHTYPE = <meshtype> OVERLAY PATTERNLENGTH = <dexp> 2 SHOW = <boolean> YES USELIGHTINGEFFECT = <boolean> YES CONTOURTYPE = <contourtype> FLOOD FLOODCOLORING = <contourcoloring> GROUP1 LINECONTOURGROUP = <integer> 1 COLOR = <color> LINETHICKNESS = <double> 0.1 LINEPATTERN = <linepattern> SOLID USEVALUEBLANKING = <boolean> YES LIGHTINGEFFECT = <lightingeffect> GOURAUD SURFACETRANSLUCENCY = <translucency> 50 USETRANSLUCENCY = <boolean> NO USECLIPPLANES = <set> [1-6] = <integer> 1 = [classic or classicplus] CLASSICPLUS = <boolean> NO = <boolean> YES } CONTOUR { PRIMARYVALUE and AVERAGECELL not allowed. } EFFECTS { } DEFINITIONCONTOUR GROUP MARCHINGCUBE Contour group from which isosurfaces are based. ALGORITHM OBEYSOURCEZONE BLANKING OBEYCLIPPLANES Clip the iso-surface by any clipping planes that intersect the iso-surface. SHADE { COLOR = <color> SHOW = <boolean> NO USELIGHTINGEFFECT = <boolean> YES } 153 Example: $!ISOSURFACEATTRIBUTE ISOSURFACESELECTION = ONESPECIFICVALUE ISOVALUE1 = 113.626812744 MESH{SHOW = YES} MESH{COLOR = BLUE} MESH{LINETHICKNESS = 0.4} CONTOUR{SHOW = YES} SURFACEEFFECTS{LIGHTINGEFFECT = PANELED} SURFACEEFFECTS{SURFACETRANSLUCENCY = 60} $!ISOSURFACELAYERS Syntax: $!ISOSURFACELAYERS SHOW = <boolean> Description:Turn iso-surfaces on or off. Required Parameters Parameter Syntax Default SHOW = <boolean> NO SHOWMESH = <boolean> YES SHOWCONTOUR = <boolean> YES SHOWSHADE = <boolean> YES USETRANSLUCENCY = <boolean> YES USELIGHTINGEFFECT = <boolean> YES Notes Note When iso-surfaces are activated, they are colored using the contour variable by default. When you activate iso-surfaces via the macro language you must perform one of the following steps in order for the isosurfaces to be visible in your final plot: • Set the contour variable by adding the following command to your macro file (prior to calling $!ISOSURFACELAYERS). $!GLOBALCONTOUR n VAR=m where n is the contour group number and m is the number of the variable to use for contouring. or • Set CONTOUR SHOW = NO via the $!ISOSURFACEATTRIBUTES command. If you choose this option, you may want to turn on shading to improve the visibility of your slice. K-O $!KRIG Syntax: $!KRIG DESTINATIONZONE = <integer> [optional parameters] Description:Interpolate selected variables from a set of source zones to a destination zone using the kriging 154 method. Required Parameter Parameters Syntax DESTINATIONZONE Default Notes = <integer> Zone to interpolate to. Optional Parameters Parameters Syntax Default INTERPNPOINTS = <integer> 8 INTERPPTSELECTION = <interpptselection> OCTANTNPOINTS KRIGDRIFT = <krigdrift> LINEAR KRIGRANGE = <dexp> 0.3 KRIGZEROVALUE = <dexp> 0.0 SOURCEZONES = <set> All zones except the destination zone. VARLIST = <set> All variables except spatial variables. Notes Choose the variables to interpolate. The spatial variables (X, Y and Z if 3D) are not allowed. Example: Krig from zones 3 and 4 onto zone 2. Only interpolate variable 7: $!KRIG SOURCEZONES = [3, 4] DESTINATIONZONE= 2 VARLIST = [7] $!LAUNCHDIALOG Syntax: $!LAUNCHDIALOG <dialogname> [no parameters] Description:Launch a Tecplot 360 interface dialog; This command is mainly useful for the Tecplot 360 demo. Example: Launch Tecplot 360’s Macro Viewer dialog: $!LAUNCHDIALOG MACROVIEWER $!LIMITS Syntax: $!LIMITS [optional parameters] Description:A SetValue command that sets some of the internal limits in Tecplot 360. See Chapter F: “Limits of Tecplot Focus” in the User’s Manual for additional information. The $!LIMITS command can only be used in the Tecplot 360 configuration file. 155 Optional Parameters Parameter Syntax LODTHRESHOLDMIN Default <op><double> = 0.3 <op><double> = 0.7 <op><integer> =0 FRACT LODTHRESHOLD MAXFRACT MAXAVAILABLE PROCESSORS MAXPTSINALINE Notes When Load on demand is set to auto-unload, set the minimum and maximum memory thresholds. The values may be from 0 to 1, where .5 corresponds to a threshold of 50%. If Tecplot 360’s memory usage exceeds the maximum threshold, it continues to unload variables until it either runs out of variables or reaches the minimum threshold. These values may also be set interactively via the Performance dialog. Refer to Section 32 - 2.3 “Miscellaneous Preferences dialog” in the User’s Manual for additional information. Sets the maximum number of processors used by Tecplot 360. Some tasks can be performed in parallel, so using all available processors greatly increases performance of those tasks. By default, Tecplot 360 uses all processors available on the machine to provide the best performance in most cases. Assign a value less than the total number of available processors to limit the number of processors used by Tecplot 360 to the assigned number. <op><integer> <op><integer> Maximum number of points for geometry polylines. <op><integer> Maximum number of contour levels. <op><integer> <op><integer> Maximum number of objects to pick. MAXUSABLEMEMORY PRELOADDATATIME <integer> Sets the maximum time in milliseconds to spend pre-loading data. MAXCHRSINTEXT Maximum number of characters in text labels. LABELS MAXNUMCONTOUR LEVELS MAXNUMPICKOBJECTS THRESHOLDINMS Limit the amount of memory used by Tecplot 360 (units of MB). Example: Increase the maximum number of contour levels allowed to 1,000: $!LIMITS MAXNUMCONTOURLEVELS = 1000 $!LINEARINTERPOLATE Syntax: $!LINEARINTERPOLATE DESTINATIONZONE = <integer> [optional parameters] Description:Interpolate selected variables from a set of source zones to a destination zone using linear interpolation. The source zones cannot be I-ordered. Values assigned to the destination zone are equivalent to the results of using the probe tool in Tecplot 360. 156 Required Parameter Parameters DESTINATIONZONE Syntax Default = <integer> Notes Zone to interpolate to. Optional Parameters Parameters Syntax Default SOURCEZONES = <set> All zones except the destination zone. VARLIST = <set> All variables except spatial variables. Notes Choose the variables to interpolate. The spatial variables (X, Y and Z if 3D) are not allowed. Example: Do linear interpolation from zones 2, 3 and 4 onto zone 7. Interpolate only variables 3-7: $!LINEARINTERPOLATE SOURCEZONES = [2-4] DESTINATIONZONE = 7 VARLIST = [3-7] $!LINEMAP Syntax: $!LINEMAP [<set>] [optional parameters] Description:A SetValue command that assigns attributes for individual Line-mappings. The <set> parameter immediately following the $!LINEMAP command is optional. If <set> is omitted then the assignment is applied to all Line-mappings, otherwise the assignment is applied only to the Line-mappings specified in <set>. 157 Optional Parameters Parameter Syntax Default Notes ASSIGN { ZONE = <integer> 1 XAXISVAR =1 YAXIS <op> <integer> <op> <integer> <op> <integer> <op> <integer> <op> <integer> <op> <integer> FUNCTIONDEPENDENCY = <functiondependency> XINDEPENDENT SHOWINLEGEND = [ALWAYS,NEVER, AUTO] AUTO SORT <sortby> NONE SORTVAR = <integer> YAXISVAR THETAAXISVAR RAXISVAR XAXIS =2 =1 =1 } BARCHARTS { SHOW = <boolean> YES COLOR = <color> RED FILLMODE = <fillmode> USESPECIFICCOLOR FILLCOLOR = <color> RED SIZE <op> <dexp> <op> <dexp> = 2.5 CURVETYPE = <curvetype> LINESEG EXTENDEDNAME = <string> Only used by the Extended Curve-fit Add-on. EXTENDEDSETTINGS = <string> Only used by the Extended Curve-fit Add-on. LINETHICKNESS = 0.4 } CURVES { USEWEIGHTVAR = <boolean> NO NUMPTS = 200 POLYORDER <op> <integer> <op> <integer> WEIGHTVAR = <integer> 0 INDVARMIN <op> <dexp> -1 x 10150 INDVARMAX <op> <dexp> 1 x 10150 USEINDVARRANGE = <boolean> NO CLAMPSPLINE = <boolean> NO SPLINEDERIVATIVEATST ART <op> <dexp> =0 SPLINEDERIVATIVEATEN D <op> <dexp> =0 SHOW = <boolean> NO VAR = <integer> BARTYPE = <errorbartype> VERT COLOR = <color> RED LINETHICKNESS <op> <dexp> = 0.1 =3 } ERRORBARS { 158 Parameter SKIPPING Syntax Default <op> <dexp> =1 SKIPMODE = <skipmode> BYINDEX SIZE <op> <dexp> = 2.5 Notes Skip can be by index or distance depending on SKIPMODE. } INDICES { IJKLINES = <ijklines> I IRANGE <<indexrange>> MIN=1, MAX=0, SKIP=1 JRANGE <<indexrange>> MIN=1, MAX=0, SKIP=1 KRANGE <<indexrange>> MIN=1, MAX=0, SKIP=1 The indices parameter is used to restrict the range of data plotted (and which lines are plotted if the data is IJ- or IJK-ordered). } LINES { SHOW = <boolean> YES COLOR = <color> RED LINEPATTERN = <linepattern> SOLID PATTERNLENGTH <op> <dexp> <op> <dexp> =2 = <string> ’&DV&’ SHOW = <boolean> YES COLOR = <color> RED FILLMODE = <fillmode> NONE FILLCOLOR = <color> RED SIZE <op> <dexp> <op> <dexp> <op> <dexp> = 2.5 = <skipmode> <<symbolshape>> BYINDEX LINETHICKNESS = 0.1 } NAME SYMBOLS { LINETHICKNESS SKIPPING SKIPMODE SYMBOLSHAPE = 0.1 =1 Skip can be by index or distance depending on SKIPMODE. ISASCII = NO, GEOMSHAPE = SQUARE } Examples: Example 1: Assign variable 1 to be on the X-axis and variable 4 to be on the Y-axis for Line-mapping number 7: $!LINEMAP [7] ASSIGN { XAXISVAR = 1 YAXISVAR = 4 } 159 Example 2: Make Error Bars red for all Line-mappings: $!LINEMAP ERRORBARS { COLOR = RED } Example 3: Set Line-mappings 3-5 to draw a polynomial curve fit of order 5: $!LINEMAP [3-5] CURVES { POLYORDER = 5 CURVETYPE = CURVFIT } LINES { SHOW = YES } $!LINEPLOTLAYERS Syntax: $!LINEPLOTLAYERS [optional parameters] Description:A SetValue command that turns on or off Line-plot layers. Optional Parameters: Parameter Syntax Default SHOWLINES = <boolean> YES SHOWSYMBOLS = <boolean> NO SHOWBARCHARTS = <boolean> NO SHOWERRORBARS = <boolean> NO Notes Line-mapping must have an error bar variable assigned for this to have an effect. Example: Turn on the symbols layer for line plots: $!LINEPLOTLAYERS SHOWSYMBOLS = YES $!LINKING Syntax: $!LINKING [optional parameters] Description:Link attributes in two or more frames so that changes to attributes of one frame effect all linked frames. 160 Optional Parameters Parameter Syntax Default Notes BETWEENFRAMES { LINKCONTOURLEVELS = <boolean> NO LINKFRAMESIZEANDPOSI TION = <boolean> NO LINKXAXISRANGE = <boolean> NO LINKYAXISRANGE = <boolean> NO LINKPOLARVIEW = <boolean> NO LINK3DVIEW = <boolean> NO LINKGROUP = <integer> 1 LINKAXISPOSITION = <boolean> NO LINKVALUEBLANKING = <boolean> NO LINKSLICEPOSITIONS = <boolean> NO LINKISOSURFACEVALUES = <boolean> NO LINKSOLUTIONTIME = <boolean> NO LINKAXISSTYLE = <boolean> NO LINKGRIDLINESTYLE = <boolean> NO LINKLAYERLINECOLOR = <boolean> NO LINKLAYERLINEPATTERN = <boolean> NO } WITHINFRAME { } Example: The following example will set the link attribute for all frames in the layout to LINK3DVIEW.: $!LOOP |NUMFRAMES| $!LINKING BETWEENFRAMES LINK3DVIEW = YES $!FRAMECONTROL MOVETOBOTTOMBYNUMBER $!FRAMECONTROL ATIVATETOP $!ENDLOOP $!LOADADDON Syntax: $!LOADADDON <string> ADDONSTYLE = <addonstyle> Description:Load an add-on into Tecplot 360. The <string> is the name of the add-on to load. See Section 33 - 1 “Add-on Loading” in the User’s Manual for instructions on how to specify the add-on. Optional Parameters Parameters ADDONSTYLE Syntax = <string> Default V7Standard Notes Style of the add-on to load. This can be either V7STANDARD or V7ACTIVEX. Example: 161 Load the Circle Stream add-on. It is a V7STANDARD add-on stored in a library named cstream.: $!LOADADDON "cstream" $!LOADCOLORMAP Syntax: $!LOADCOLORMAP <string> [no parameters] Description:Load a color map file. The <string> is the name of the file to load. Example: $!LOADCOLORMAP "mycolors.map" $!LOOP...$!ENDLOOP Syntax:$!LOOP <integer> $!ENDLOOP Description:Process macro commands in a loop. Within the loop you may access the current loop counter using the internal macro variable |Loop|. Loops may be nested up to 10 levels deep. Example: Process macro commands 3 times over: $!LOOP 3 $!ENDLOOP $!MACROFUNCTION...$!ENDMACROFUNCTION Syntax: $!MACROFUNCTION NAME = <string> [optional parameters] $!ENDMACROFUNCTION Description:Define a macro function. All commands between a $!MACROFUNCTION and the $!ENDMACROFUNCTION are associated with the macro function NAME. These commands are not executed when they are defined but are executed when a $!RUNMACROFUNCTION command is processed. Parameters can be passed to a macro function. Use |n| to reference the nth parameter. (See $!RUNMACROFUNCTION). In the user-interface, [Crtl]-M must be pressed, before using the keyboard shortcut specified by the KEYSTROKE option. For example, if the KEYSTROKE option is set to "P", the user must press [CTRL]-M-P. 162 Required Parameter Parameter NAME Syntax Default = <string> Notes Name of the macro function. Optional Parameter Parameter Syntax Default Notes KEYSTROKE = <string> RETAIN = <boolean> NO Set this to YES if you want Tecplot 360 to retain this macro function when the macro in which this macro function was defined terminates. If the macro function is retained then it can be called when another macro is loaded at a later time. SHOWINMACROPANEL = <boolean> YES Used only for macro functions within the tecplot.mcr file. Set this to NO if you do not want Tecplot 360 to include the macro function in Tecplot 360’s Quick Macro Panel. Allows keyboard shortcuts Example: Define a macro function that redraws the active frame n times when <Ctrl>+M is hit and then the ‘R’ key is pressed, where n is passed to the macro function: $!MACROFUNCTION NAME = "ABC" KEYSTROKE = "R" $!LOOP |n| $!REDRAW $!ENDLOOP $!ENDMACROFUNCTION $!NEWLAYOUT Syntax: $!NEWLAYOUT [no parameters] Description:Clear the current layout and start again. When a new layout is created, the following steps occur: 1. All pages are deleted. 2. A new page is created. 3. A new frame is added to the page. $!OPENLAYOUT Syntax: $!OPENLAYOUT <string> [optional parameters] Description:Open and read in a new layout file. The <string> is the name of the file to open. 163 Optional Parameters Parameter ALTDATALOAD Syntax Default Null Specify alternate data load instructions. Tecplot 360 data files: This is a list of filenames to use as replacements for data files referenced in the layout file. Use " to enclose file names that contain spaces or the + symbol. By default, separate file names listed in the ALTDATALOADINSTRUCTIONS are assigned to successive data sets that are referenced within a layout file. If you have a data set that references multiple data files, use the plus symbol, +, to group file names. Non-Tecplot 360 formats (including data being input via a data loader add-on): This is a list of instructions that are passed on to the loader. = <boolean> NO Set to NO if you want Tecplot 360 to delete the current layout prior to reading in the new one. INSTRUCTIONS APPEND Notes = <string> Examples: Example 1: Open a new layout file called abc.lay and replace the data file referenced in the layout file with t.plt: $!OPENLAYOUT "abc.lay" ALTDATALOADINSTRUCTIONS = "t.plt" Example 2: Open a new layout file called multiframe.lay and replace the first data set with t.plt and the second data set with the two files, a.plt and b.plt: $!OPENLAYOUT "multiframe.lay" ALTDATALOADINSTRUCTIONS = '"t.plt" "a.plt"+"b.plt"' P-Q $!PAGE Syntax: $!PAGE [optional parameters] Description:A SetValue command that sets the paper characteristics. 164 Optional Parameters Parameter Syntax Default Notes PAPERATTRIBUTES { BACKGROUNDCOLOR = <color> WHITE ISTRANSPARENT = <boolean> YES ORIENTPORTRAIT = <boolean> NO PAPERGRIDSPACING = <papergridspacing> HALFINCH PAPERSIZE = <papersize> <<rect>> LETTER REGIONINWORKAREA RULERSPACING = <paperrulerspacing> ONEINCH SHOWGRID = <boolean> YES SHOWPAPER = <boolean> NO SHOWRULER = <boolean> NO X1=1, Y1=0.25, X2=10, Y2=8.25 Set the spacing for the tick marks on the paper. Specify rectangle that must fit within the workarea. Units are in inches (that is, in the paper coordinate system). } USESOFTWARERENDERING = <boolean> Use the painter’s algorithm (meaning, display graphics cell-bycell from front-to-back), instead of using OpenGL. NAME = <string> Name parameter is empty until specified. Example: This example does the following: • Turns off the paper grid. • Makes the paper size CUSTOM1. • Makes the dimensions for CUSTOM1 to be 4 by 5 inches. $!PAGE PAPERATTRIBUTES { SHOWGRID = NO PAPERSIZE = CUSTOM1 PAPERSIZEINFO { CUSTOM1 { WIDTH = 4 HEIGHT = 5 } } } See also: Section “$!GLOBALPAPER” on page 133. $!PAGECONTROL [Required-Control Option] Description:The different commands in the PAGECONTROL compound function family are described separately in the following sections. The PAGECONTROL compound functions are: $!PAGECONTROL CREATE 165 $!PAGECONTROL $!PAGECONTROL $!PAGECONTROL $!PAGECONTROL $!PAGECONTROL SETCURRENTTONEXT SETCURRENTTOPREVIOUS SETCURRENTBYNAME DELETE CLEAR $!PAGECONTROL CREATE Syntax: $!PAGECONTROL CREATE [no parameters] Description:Create a new page. The created page will include an initial frame. $!PAGECONTROL SETCURRENTTONEXT Syntax: $!PAGECONTROL SETCURRENTTONEXT [no parameters] Description:Set the next page to be the current page. $!PAGECONTROL SETCURRENTTOPREVIOUS Syntax: $!PAGECONTROL SETCURRENTTOPREVIOUS [no parameters] Description:Set the previous page to be the current page. $!PAGECONTROL SETCURRENTBYNAME Syntax: $!PAGECONTROL SETCURRENTBYNAME NAME = <string> Description:Set the current page to the page specified. Example: $!PAGECONTROL SETCURRENTBYNAME NAME = "BANANA" $!PAGECONTROL DELETE Syntax: $!PAGECONTROL DELETE Description:Delete the current page. If the command is operated on the only page, then an initial page is created with an initial frame. $!PAGECONTROL CLEAR Syntax: $!PAGECONTROL CLEAR Description:Clears all frames in the current page and creates a default initial frame. 166 $!PAGEGETNAME Syntax: $!PAGEGETNAME |MACROVAR| Description:Action command to get the name of the current page. $!PAGENAME Syntax: $!PAGENAME <string> [no parameters] Description:Set the name of the page. $!PAUSE Syntax: $!PAUSE <string> [no parameters] Description:Stop execution of a macro and optionally display a dialog with a message. If <string> is set to "" then no dialog is displayed and the user must click in the work area to continue. Example: Pause and display the message This is the first example plot: $!PAUSE "This is the first example plot." $!PICK [Required-Control Option] Description:The different commands in the PICK compound function family are described separately in the following sections. The PICK compound functions are: $!PICK $!PICK $!PICK $!PICK $!PICK $!PICK $!PICK $!PICK $!PICK $!PICK $!PICK $!PICK $!PICK ADDATPOSITION ADDALL ADDALLINRECT CLEAR COPY CUT EDIT MAGNIFY PASTE POP PUSH SETMOUSEMODE SHIFT $!PICK ADDATPOSITION Syntax: $!PICK CHECKTOADD X = <dexp> Y = <dexp> [optional parameters] Description:Attempt to pick an object at a specific location on the paper. Does not pop or activate frames. 167 Required Parameters Parameters Syntax Default Notes X = <dexp> X-location (in inches) relative to the left edge of the paper. Y = <dexp> Y-location (in inches) relative to the top edge of the paper. Optional Parameters Parameters COLLECTINGOBJECTS Syntax Default = <boolean> NO Notes If NO, the list of picked objects is cleared before the attempt is made to add a new object. CONSIDERSTYLE = <boolean> NO DIGGINGFOROBJECTS = <boolean> NO If YES, attempt to pick objects below any currently picked objects at this location. IGNOREZONEOBJECTS = <boolean> NO If YES, pick operations will ignore zones and pick objects such as slices, iso-surfaces and streamtraces. Example: Attempt to add to the list of picked objects by picking at paper location (1.0, 7.0). Do not clear the list of picked objects before picking: $!PICK CHECKTOADD X = 1.0 Y = 7.0 COLLECTINGOBJECTS = YES $!PICK ADDALL Syntax: $!PICK ADDALL [optional parameters] Description:Add all objects of a certain type to the list of picked objects. Optional Parameters Parameters Syntax Default Notes SELECTTEXT = <boolean> NO Select all text objects in the active frame. SELECTGEOMS = <boolean> NO Select all geometry objects in the active frame. SELECTFRAMES = <boolean> NO Select all frames. SELECT = <boolean> NO Select all streamtrace objects in the active frame. SELECTMAPS = <boolean> NO Select all line map objects in the active frame. SELECTZONES = <boolean> NO Select all zone objects in the active frame. STREAMTRACES Example: Add all text and geometries in the active frame to the list of picked objects: $!PICK ADDALL SELECTTEXT = YES SELECTGEOMS = YES $!PICK ADDALLINRECT Syntax: 168 $!PICK ADDALLINRECT X1 = <dexp> Y1 = <dexp> X2 = <dexp> Y2 = <dexp> [optional parameters] Description:Add objects defined within a specified region to the list of picked objects. The region is defined in terms of the paper coordinate system. Optional filters can be used to restrict the objects selected. The region is defined by the two corner points (X1, Y1) and (X2, Y2). Required Parameters Parameters Syntax Default Notes X1 = <dexp> X-location (in inches) relative to the left edge of the paper. Y1 = <dexp> Y-location (in inches) relative to the top edge of the paper. X2 = <dexp> X-location (in inches) relative to the left edge of the paper. Y2 = <dexp> Y-location (in inches) relative to the top edge of the paper. Optional Parameters Parameters Syntax Default Notes COLORFILTER = <color> FONTFAMILYFILTER = <string> Not used. ISBOLD = <boolean> NO Only boldface text objects will be selected. ISITALIC = <boolean> NO Only italicized text objects will be selected. GEOMFILTER = <geomtype> Not used.a LINEPATTERNFILTER = <linepattern> Not SELECTCONTOUR = <boolean> NO Select all contour labels in specified region Select all frame objects in the specified region. a Only objects of this color will be selected. a Only text objects with this font will be selected. Not used. used.a Only geometry objects of this type will be selected. Only geometry objects with this line pattern will be selected. LABELS SELECTFRAMES = <boolean> NO SELECTGEOMS = <boolean> NO Select all geometry objects in the specified region. SELECTGRIDAREA = <boolean> NO Select the grid area in specified region SELECTMAPS = <boolean> NO Select all line map objects in the specified region. SELECT = <boolean> NO Select all streamtrace objects in the specified region. SELECTTEXT = <boolean> NO Select all text objects in the specified region. SELECTZONES = <boolean> NO Select all zone objects in the specified region. STREAMTRACES a. There is no default for this parameter. If this parameter is omitted then the corresponding filter is not used. Example: Pick all circles using a dashed line pattern within the rectangle bounded by the points (0, 0) and (3, 5): $!PICK ADDALLINRECT SELECTGEOMS = YES LINEPATTERNFILTER= DASHED GEOMFILTER = CIRCLE X1 = 0 Y1 = 0 X2 = 3 Y2 = 5 169 $!PICK CLEAR Syntax: $!PICK CLEAR [no parameters] Description:Delete all objects that are currently picked. (These objects cannot be retrieved.) Example: $!PICK CLEAR $!PICK COPY Syntax: $!PICK COPY [no parameters] Description:Copy all objects that are currently picked to the paste buffer. Example: $!PICK COPY $!PICK CUT Syntax: $!PICK CUT [no parameters] Description:Copy all objects that are currently picked to the paste buffer and then delete them. Example: $!PICK CUT $!PICK EDIT Syntax: $!PICK EDIT [parameters] Description:Perform a global edit operation on the currently picked objects. Only one edit operation is allowed per $!PICK EDIT command. Objects are edited only if the supplied parameter is relevant. Actions taken using the Quick Edit dialog in Tecplot 360 generate these commands. Parameters Must select one from this table. Parameters ARROWHEADANGLE Syntax = <dexp> ARROWHEADATTACHMENT = <arrowheadattachment> ARROWHEADSIZE = <dexp> ARROWHEADSTYLE <arrowheadstyle> ASCIICHAR = <string> BARCHARTS { 170 Default Notes Angle is in degrees. Value is in Y-frame units (0-100). Only operates on XY line mapping objects. Parameters Syntax SHOW = <boolean> ISFILLED = <boolean> Default Notes } COLOR = <color> CONTOUR Only operates on 2D or 3D zone objects. { SHOW = <boolean> CONTOURTYPE = <contourtype> } CURVES Only operates on XY line mapping objects. { CURVETYPE = <curvetype> } EDGELAYER Only operates on 2D or 3D zone objects. { SHOW = <boolean> SUBBOUNDARY = <subboundary> } ERRORBARS Only operates on XY line mapping objects. { SHOW = <boolean> BARTYPE = <errorbartype> } FILLCOLOR = <color> FONTFAMILY = <string> GEOMSHAPE = <geomshape> ISBOLD = <boolean> ISITALIC = <boolean> LINEPATTERN = <linepattern> LINES Applies only to scatter symbols or XY-plot symbols. Only operates on XY line mapping objects. { SHOW = <boolean> } LINETHICKNESS = <dexp> MESH Value is in Y-frame units (0-100). Only operates on 2D or 3D zone objects. { SHOW = <boolean> MESHTYPE = <meshtype> Only operates on 2D or 3D zone objects. OBJECTALIGN = <objectalign> Only allowed if selected objects are all text and/or geometries. PATTERNLENGTH = <dexp> Value is in Y-frame units (0-100). } SCATTER Only operates on 2D or 3D zone objects. { SHOW = <boolean> FILLMODE = <fillmode> 171 Parameters Syntax Default Notes } SHADE Only operates on 2D or 3D zone objects. { SHOW = <boolean> SHADETYPE = <shadetype> } SHOWBORDER = <boolean> Only operates on frame objects. SIZE = <dexp> Value is in Y-frame units. This applies to things like symbols. SYMBOLS Only operates on line mapping objects. { SHOW = <boolean> ISFILLED = <boolean> } TEXTCOLOR = <color> TEXTHEIGHTBYPERCENT = <dexp> Value is in Y-frame units (0-100). TEXTHEIGHTBYPOINTS = <dexp> Value is in points. VECTOR Only operates on 2D or 3D zone objects. { SHOW = <boolean> VECTORTYPE = <vectortype> } Examples: Example 1: Set all picked objects to use the color yellow: $!PICK EDIT COLOR = YELLOW Example 2: Set all picked objects to use the dashed line pattern: $!PICK EDIT LINEPATTERN = DASHED Example 3: Set all picked objects (which are zones) to use the contour plot type of flooding: $!PICK EDIT CONTOUR {CONTOURTYPE = FLOOD} $!PICK MAGNIFY Syntax: 172 $!PICK MAGNIFY MAG = <dexp> Description:Magnify all picked objects. The objects will also be translated proportional to the distance between their anchor position and the anchor position of the first object picked. Example: Magnify all objects by 1.5: $!PICK MAGNIFY MAG = 1.5 $!PICK PASTE Syntax: $!PICK PASTE [no parameters] Description:Paste the currently picked objects from the paste buffer to the work area. $!PICK POP Syntax: $!PICK POP [no parameters] Description:Change the order in which objects are drawn by popping the currently picked objects to the front. Only frames, text, geometries, and the grid area for 2D plots are allowed. $!PICK PUSH Syntax: $!PICK PUSH [no parameters] Description:Change the order in which objects are drawn by pushing the currently picked objects back. Only frames, text, geometries, and the grid area for 2D plots are allowed. $!PICK SETMOUSEMODE Syntax: $!PICK SETMOUSEMODE MOUSEMODE = <mousemode> Description:Prepare to pick objects by setting the mouse mode to SELECT, ADJUST, or ADVANCEADJUST. ADVANCEADJUST is a combination of SELECT and ADJUST that allows an object’s control points to be adjusted by dragging, or the entire object to be selected by clicking away from the control points. This command also clears the list of picked objects (that is, unpicks all picked objects). Required Parameter Parameter MOUSEMODE Syntax = <mousemode> Default Notes Set to SELECT or ADJUST. Example: Set the mouse mode so picked objects are adjusted: $!PICK SETMOUSEMODE MOUSEMODE = ADJUST 173 $!PICK SHIFT Syntax: $!PICK SHIFT X = <dexp> Y = <dexp> [optional parameters] Description:Shift the currently picked objects. Objects are shifted relative to their starting position. X and Y shift amounts are in paper units (inches). If snapping is in effect then it is applied after shifting in X and Y. (See the SetValue commands $!GLOBALFRAME SNAPTOGRID and $!GLOBALFRAME SNAPTOPAPER.) Required Parameters Parameters Syntax Default Notes X = <dexp> Shift amount in the X-direction. Units are inches. Y = <dexp> Shift amount in the Y-direction. Units are inches. Optional Parameter Parameters POINTERSTYLE Syntax = <pointerstyle> Default ALLDIRECTIO NS Notes Only frames and non-3D grid area objects can use a pointer style that is not ALLDIRECTIONS. Example: Shift the currently picked objects 1 inch to the right and 2 inches down: $!PICK SHIFT X = 1 Y = 2 $!PLOTOPTIONS Syntax: $!PLOTOPTIONS = <boolean> Description:Change the plot option between subdividing all cells, or using a quicker algorithm. Optional Parameters Parameters SUBDIVIDEALLCELLS Syntax = <boolean> Default NO Notes If YES, divides all non-triangular, non-tetrahedral cells of all zone types when contouring, probing and creating iso-surfaces and slices. This option only affects IJ- and IJK- ordered plots. If NO, uses quicker "marching cubes" style algorithm, but generates holes in the iso-surfaces at certain saddle points. Example: Use the following command to subdivide all volume cells: $!PLOTOPTIONS SUBDIVIDEALLCELLS = YES $!PLOTTYPE Syntax: $!PLOTTYPE = <plottype> [no parameters] Description:Changes plot types between valid Tecplot 360 modes such as XYLine and Cartesian2D. Valid 174 options shown below. Required Parameters Parameter Syntax PLOTTYPE = <plottype> Default Notes CARTESIAN3D Example: Change the plot style to show a polar plot: $!PLOTTYPE = POLARLINE $!POLARAXIS Syntax: $!POLARAXIS [optional parameters] Description:A SetValue command that assigns attributes for axes in a polar frame. Optional Parameters Parameter Syntax GRIDAREA <<areastyle>> PRECISEGRID <<precisegrid>> PRESERVEAXISSCALE <boolean> RDETAIL <<axisdetail>> THETADETAIL <<axisdetail>> Default See Notes Notes DRAWBORDER=YES, ISFILLED=NO, FILLCOLOR=WHITE, DRAWGRIDLAST=NO INCLUDE=NO, SIZE=0.0045, COLOR=BLACK YES THETAMODE = <thetamode> DEGREES THETAPERIOD = <double> 360 VIEWPORTPOSITION <<rect>> See Notes X1=0, Y1=0, X2=100, Y2=100 VIEWPORTSTYLE <<areastyle>> See Notes DRAWBORDER=NO, COLOR=BLACK, LINETHICKNESS=0.4, ISFILLED=NO, FILLCOLOR=WHITE Example: Set the Theta range, in Radians, from Pi to -Pi. $!POLARAXIS $!POLARAXIS $!POLARAXIS $!POLARAXIS THETAMODE = RADIANS THETAPERIOD = 6.28318530718 THETADETAIL{VALUEATORIGIN = 0} THETADETAIL{RANGEMIN = -3.14159265359} $!POLARTORECTANGULAR Syntax: $!POLARTORECTANGULAR <set> [no parameters] Description:Treat the variables currently assigned to X and Y as referring to R and and convert them to X and Y. In 3D, X, Y and Z refer to R, , and . Tecplot 360 has addition capabilities for transforming coordinates, please see $!TRANSFORMCOORDINATES. Example: Convert zones 1, 2 and 3 from polar to rectangular: $!POLARTORECTANGULAR [1-3] 175 $!POLARVIEW Syntax: $!POLARVIEW [optional parameters] Description: Sets the viewing style for polar plots in a layout. Required Parameters Parameter Syntax <<rect>> EXTENTS Default X1=-1.29771, Y1=-1.15352, X2=1.29771, Y2=1.15352 Notes View extents of transformed X & Y in polar plots. Numbers listed are in the form of grid units. Example: Set the view of the polar plot to view the full extents of the plot area. $!POLARVIEW EXTENTS { X1=10 Y1=10 X2=90 Y2=90 } $!PRINT Syntax: $!PRINT [no parameters] Description:Print the current layout to a printer or send the print instructions to a file. Use the $!PRINTSETUP SetValue command to configure printing. Example: $!PRINT $!PRINTSETUP Syntax: $!PRINTSETUP [optional parameters] Description:A SetValue command that sets the attributes for printing. Use $!PRINT to do the actual printing. See $!EXPORTSETUP and $!EXPORT if you intend to create image files destined for desktop publishing programs. 176 Optional Parameters Parameter DRIVER Syntax Default = <printerdriver> FORCEEXTRA3D Notes Only applies if using the Tecplot 360 printer drivers. See $!INTERFACE USETECPLOTPRINT. = <boolean> SORTING JOBCONTROL These strings contain characters to be sent at the beginning and ending of a print file. These strings most often contain escape sequences used to switch modes on the printer. Non-printable characters can be inserted. Use ^nnn to insert a character with ordinal value nnn. Use \ to force the character after the \ to be inserted. Use $B for a Backspace, $E for Esc, $C for a carriage return, and $X for the Delete key. { POSTMOPUPSTR = <string> LGMOPUPSTR = <string> POSTSETUPSTR = <string> LGSETUPSTR = <string> } IMAGERESOLUTION = <integer> NUMHARDCOPYCOPIES <op> <integer> NUMLIGHTSOURCESHA DES = <integer> Applies only when DRIVER = PS. PALETTE = <palette> Must choose options valid for current DRIVER setting. PRECISION <op> <integer> Applies only if EXPORTFORMAT is PS, EPS, or RASTERMETAFILE. Name of the file to write to if SENDPRINTTOFILE is YES. PRINTFNAME = <string> PRINTRENDERTYPE = <printrendertyp e> RGBLEGENDOUTPUT = <integer> RESOLUTION SENDPRINTTOFILE = <boolean> SPOOLER { PSMONOSPOOLCMD = <string> PSCOLORSPOOLCMD = <string> LGSPOOLCMD = <string> 50 Determines the number of triangles which compose the bottom layer of the RGB Legend. This option is only available through macro language (for example, the config file) If YES then PRINTFNAME is name of file to write to. These strings contain the system command needed to send a file to the print spooler on your computer. Use the @ symbol as a place holder for where you normally insert the name of the file to be printed. For security reasons these commands can only be used in the Tecplot 360 configuration file. } USEISOLATIN1FONTS -INPS = <boolean> Use extended ISO-Latin1 fonts when generating PostScript® output using Tecplot 360’s internal PostScript driver. Example: This example does the following: • Instruct Tecplot 360 to send print output to the print spooler. • Sets the spooler command for monochrome PostScript to be lpr @. • Sets the print driver to be monochrome PostScript. $!PRINTSETUP SENDPRINTTOFILE = NO DRIVER = PS PALETTE = MONOCHROME SPOOLER { PSMONOSPOOLCMD = "lpr @" } 177 $!PROMPTFORFILENAME Syntax: $!PROMPTFORFILENAME <macrovar> DIALOGTITLE = <string> DEFAULTFNAME = <string> FILEFILTER = <string> Description:Instruct Tecplot 360 to launch a file selection dialog. The resulting file name will be placed in <macrovar>. If the user cancels out of the dialog then <macrovar> will be empty (see the example below). Optional Parameter Parameter Syntax Default Notes DIALOGTITLE = <string> Null Include a title at the top of the dialog. DEFAULTFNAME = <string> Null Make the dialog come up with a default file name. FILEFILTER = <string> Null Set the filter for the file selection dialog. FILEMUSTEXIST = <string> YES Example: Prompt the user for the name of a file to delete: $!PROMPTFORFILENAME|filetodelete| DIALOGTITLE = "Delete File" FILEFILTER = "*.*" $!IF "|filetodelete|" != "" $!IF |OPSys| = 1 # UNIX/Mac $!System "rm |filetodelete|" $!Endif $!IF |OPSys| = 2 # Windows $!System "cmd /c del |filetodelete|" $!Endif $!Endif $!PROMPTFORTEXTSTRING Syntax: $!PROMPTFORTEXTSTRING <macrovar> INSTRUCTIONS = <string> Description:Instruct Tecplot 360 to launch a dialog containing a single line text field and optional instructions. The user enters text into the text field and the resulting string is assigned to <macrovar>. Optional Parameter Parameter INSTRUCTIONS Syntax = <string> Default Null Notes Include text at the top of the dialog to instruct the user regarding the value to enter. On Windows platforms, this is limited to three lines of text. Example: $!PROMPTFORTEXTSTRING |timestring| INSTRUCTIONS = "Enter the time of the experiment" 178 $!PROMPTFORYESNO Syntax: $!PROMPTFORYESNO <macrovar> INSTRUCTIONS = <string> Description:Instruct Tecplot 360 to launch a dialog containing two buttons, one labeled Yes and the other No. The <macrovar> is assigned the string Yes or No depending on the selection. Optional Parameter Parameter Syntax INSTRUCTIONS = <string> Default Null Notes Include text at the top of the dialog with instructions. Example: $!PROMPTFORYESNO |goforit| INSTRUCTIONS = "Do you want to go for it?" $!IF "|goforit|" == "YES" ... code that goes for it.... $!ENDIF $!PROPAGATELINKING Syntax: $!PROPAGATELINKING [optional parameters] Description: Link multiple frames, either within frame or between frames. Optional Parameter Parameter Syntax FRAMECOLLECTION = [ALL, PICKED] LINKTYPE = [WITHINFRAME, BETWEENFRAMES] Default Notes Example: $!PROPAGATELINKING LINKTYPE = BETWEENFRAMES FRAMECOLLECTION = ALL $!PUBLISH Syntax: $!PUBLISH <string> Description:Create an HTML file displaying one or more images. A linked layout with packaged data may be included. You must provide the file name. 179 Optional Parameter Parameter Syntax Default Notes IMAGESELECTION = <imagestyle> ONEPERFRAME Choosing ONEPERFRAME will create one image per frame, selecting WORKSPACEONLY creates one image which includes all your frames. INCLUDELAYOUTPACKAGE = <boolean> No Choose YES to create a linked layout file. Example: $!PUBLISH "C:\TEC360\separate.html" INCLUDELAYOUTPACKAGE = NO IMAGESELECTION = ONEPERFRAME $!QUIT Syntax:$!QUIT Description:Terminate the execution of the Tecplot 360 program. Example: $!QUIT R $!RAWCOLORMAP Syntax: $!RAWCOLORMAP <colormaprawdata> Description:Assign the RGB values that define the Raw user-defined color map. This does not set the color map to use the Raw user-defined color map. Use $!COLORMAP to set the current color map. Required Parameter Parameter Syntax <colormaprawdata> Default Notes This is a list of RGB values. Example: Assign the Raw user-defined color map to a gray scale using 11 colors: $!RAWCOLORMAP RAWDATA 11 0 0 25 25 50 50 75 75 100 100 125 125 150 150 175 175 180 0 25 50 75 100 125 150 175 200 225 255 200 225 255 200 225 255 $!READDATASET Syntax: $!READDATASET <string> [optional parameters] Description:The $!READDATASET macro command has two separate uses. The parameters available for the command are dependent upon the intended use. It may either be used to load data in Tecplot 360’s file format (*.plt or *.dat) or in a foreign data file format. To load data in Tecplot 360’s file format, use the parameters listed in Table 9 - 2. To load data in a foreign file format, use the parameters listed in Table 9 - 1 along with a set of name/value pairs. The name/value pairs are specific to the data loader and described in Chapter 4: “Data Loaders” in the User’s Manual. Examples: FLUENT Loader Example: ® The following example loads one case file and one data file with the FLUENT file loader. Note that the DATASETREADER parameter is at the end of the command call. $!READDATASET '"STANDARDSYNTAX" "1.0" "LoadOption" "MultipleCaseAndData" "FILELIST_Files" "2" "triangular.cas" "triangular.dat" "UnsteadyOption" "ReadTimeFromDataFiles" "AssignStrandIDs" "Yes" "GridZones" "CellsAndBoundaries" "IncludeParticleData" "Yes" "AverageToNodes" "Yes" "AveragingMethod" "Arithmetic"' DATASETREADER = 'Fluent Data Loader' Ensight Loader Example The following example loads one Ensight case file. Note that the DATASETREADER parameter is at the end of the command call. $!READDATASET '"STANDARDSYNTAX" "1.0" "FILENAME_CASEFILE" "wing.case" "ISkip" "1" "JSkip" "1" "KSkip" "1"' DATASETREADER = 'EnSight Loader' Table 9 - 1: Parameters for loading data in a foreign file format Parameters DATASETREADER Syntax Default = <string> Notes Used to specify an alternate data reader for Tecplot 360. Table 9 - 2: Parameters for loading data in Tecplot 360 format Parameters ADDZONETOEXISTING Syntax Default NO If YES, Tecplot 360 will add the zones from the appended data to any existing strands in the dataset. If NO, Tecplot 360 will append the strands from the appended data to any existing strands in the dataset. = <boolean> NO If YES, Tecplot 360 will assign strand ID's to zones if time is supplied for the zones but strand ID's are not. If NO, Tecplot 360 will not associate these zones with any strands. STRANDS ASSIGNSTRANDID Notes = <boolean> 181 Table 9 - 2: Parameters for loading data in Tecplot 360 format Parameters Syntax Default IJKSKIP Notes Use values greater than 1 to skip data points. { I = <integer> 1 J = <integer> 1 K = <integer> 1 = <boolean> NO Renumber zones and variables if zones or variables are disabled. = <boolean> YES Set to YES to load in any custom labels in the data files. } COLLAPSEZONESAND VARS INCLUDECUSTOM LABELS INCLUDEDATA = <boolean> YES Set to YES to load in any field data in the data files. INCLUDEGEOM = <boolean> YES Set to YES to load in any geometries in the data files. INCLUDETEXT = <boolean> YES Set to YES to load in any text in the data files. INITIALPLOTFIRST = <boolean> Allows faster performance for files with multiple zones. ZONEONLY INITIALPLOTTYPE = <plottype> READDATAOPTION = <readdataoption > NEW Set to APPEND to append the new zones to the zones in the data set that existed prior to using this command. Set to NEW to remove the data set from the active frame prior to reading in the new data set. If other frames use the same data set they will continue to use the old one. Set to REPLACE to replace the data set attached to the active frame and to all other frames that use the same data set, with the new data set. RESETSTYLE = <boolean> YES Set to NO if you want Tecplot 360 to keep the current style. This only applies if READDATA OPTION is not APPEND. VARLOADMODE = <varloadmode> BYPOSITION Set to BYPOSITION to load variables based on their position in the file. Set to BYNAME to load variables based on their name. If set to BYNAME, then VARNAMELIST must be supplied as well. VARNAMELIST = <string> Use this to list the names of the variables to load into Tecplot 360. Names separated by a ; or a + are joined together to form a set of aliases for a given variable. VARPOSITIONLIST = <set> All vars. Use this to reduce the number of variables loaded. ZONELIST = <set> All zones. Use this to reduce the number of zones loaded. Example 1: Read in the data files t1.plt and t2.plt to form a single data set in Tecplot 360: $!READDATASET "t1.plt t2.plt" Example 2: Read in the datafile t1.plt. Only read in zones 1 and 4. Skip over every other I-index: $!READDATASET "t1.plt" ZONELIST = [1,4] IJKSKIP { I = 2 } 182 Example 3: Read in the data files t1.plt, t2.plt, and t3.plt. Append the new data set to the current one: $!READDATASET "t1.plt t2.plt t3.plt" READDATAOPTION = APPEND Example 4: Read in the data files t1.plt and t2.plt from directory, /users/john/testrun7/runb: $!VARSET |BASEDIR| = "/users/john/testrun7/runb" $!READDATASET "|basedir|/t1.plt |basedir|/t2.plt" $!READSTYLESHEET Syntax: $!READSTYLESHEET <string> [optional parameters] Description:Read in a stylesheet file. The <string> is the name of the file to read. Optional Parameters Parameters Syntax Default Notes INCLUDEAUXDATA = <boolean> YES Set to YES to read auxiliary data. INCLUDECONTOUR = <boolean> YES Set to YES to read in all contour levels. = <boolean> NO Set to YES if you want the active frame to be sized and positioned exactly like the frame used to create the stylesheet. LEVELS INCLUDEFRAMESIZE ANDPOSITION INCLUDEGEOM = <boolean> YES Set to YES to load in any geometries in the stylesheet file. INCLUDEPLOTSTYLE = <boolean> YES Set to YES to process commands related to plot style (mesh color, vector type, and so on). INCLUDESTREAM = <boolean> YES Set to YES to read in streamtrace starting positions. INCLUDETEXT = <boolean> YES Set to YES to load in any text in the stylesheet file. MERGE = <boolean> NO Set to NO to reset all frame attributes back to their factory defaults prior to reading in the stylesheet. POSITIONS Example: Read the stylesheet file t.sty. Do not read in any text or geometries: $!READSTYLESHEET "t.sty" INCLUDETEXT = NO INCLUDEGEOM = NO $!REDRAW Syntax: $!REDRAW [optional parameters] Description:Redraw the active frame. 183 Optional Parameter Parameter Syntax DOFULLDRAWING = <boolean> Default YES Notes Set to NO to draw only a “trace” of the data in the frame. Example: $!REDRAW $!REDRAWALL Syntax: $!REDRAWALL [optional parameters] Description:Redraw all frames. Optional Parameter Parameter Syntax DOFULLDRAWING = <boolean> Default YES Notes Set to NO to draw only a “trace” of the data in each frame. Example: $!REDRAWALL $!REMOVEVAR Syntax: $!REMOVEVAR <macrouserdefvar> Description:Remove a user-defined macro variable. This frees up space so another user-defined macro variable can be defined. Example: Remove the macro variable |ABC|: $!REMOVEVAR |ABC| $!RENAMEDATASETVAR Syntax: $!RENAMEDATASETVAR VAR = <integer> NAME = <string> [no optional parameters] Description:Rename a data set variable in Tecplot 360. 184 Required Parameters Parameter Syntax Default Notes VAR = <integer> Specify the variable number. NAME = <string> Specify the new variable name. Example: Rename variable 1 to be Banana: $!RENAMEDATASETVAR VAR = 1 NAME = "Banana" $!RENAMEDATASETZONE Syntax: $!RENAMEDATASETZONE ZONE = <integer> NAME = <string> [no optional parameters] Description:Rename a data set zone in Tecplot 360. Required Parameters Parameter Syntax Default Notes ZONE = <integer> Specify the zone number. NAME = <string> Specify the new zone name. Example: Rename zone 1 to be Banana: $!RENAMEDATASETZONE ZONE = 1 NAME = "Banana" $!RESET3DAXES Syntax: $!RESET3DAXES [no parameters] Description:Reset the ranges on the 3D axes. Example: $!RESET3DAXES $!RESET3DORIGIN Syntax: $!RESET3DORIGIN [optional parameters] Description:Reposition the rotation origin in 3D to be at the specified location. 185 Optional Parameter Parameter ORIGINRESETLOCATION Syntax Default Notes = <originresetlocation> Example: $!RESET3DORIGIN ORIGINRESETLOCATION = DATACENTER $!RESET3DSCALEFACTORS Syntax: $!RESET3DSCALEFACTORS [no parameters] Description:Recalculate the scale factors for the 3D axes. Aspect ratio limits are taken into account. Example: $!RESET3DSCALEFACTORS $!RESETVECTORLENGTH Syntax: $!RESETVECTORLENGTH [no parameters] Description:Reset the length of the vectors. Tecplot 360 will find the vector with the largest magnitude and set the scaling factor so it will appear on the screen using the length specified by $!FRAMESETUP VECTDEFLEN. Example: $!RESETVECTORLENGTH $!ROTATE2DDATA Syntax: $!ROTATE2DDATA ANGLE = <dexp> [optional parameters] Description:Rotate field data in 2D about any point. 186 Required Parameter Parameter Syntax ANGLE Default = <dexp> Notes Specify angle of rotation in degrees. Optional Parameters Parameter Syntax Default Notes ZONELIST = <set> All zones. Zones to rotate. X = <dexp> 0 X-origin to rotate about. Y = <dexp> 0 Y-origin to rotate about. Example: Rotate zone 3 30 degrees about the point (7, 2): $!ROTATE2DDATA ANGLE = 30 ZONELIST = [3] X = 7 Y = 2 $!ROTATE3DVIEW Syntax: $!ROTATE3DVIEW <rotateaxis> ANGLE = <dexp> [optional parameters] Description:Do a 3D rotation about a given axis. The <rotateaxis> must be supplied. Required Parameter Parameter ANGLE Syntax Default = <dexp> Notes Angle to rotate (in degrees). Optional Parameter Parameter ROTATEORIGIN Syntax Default Notes LOCATION = <rotateoriginloc ation> VECTORX = <dexp> Required when rotate axis is ABOUTVECTOR. VECTORY = <dexp> Required when rotate axis is ABOUTVECTOR. VECTORZ = <dexp> Required when rotate axis is ABOUTVECTOR. Example: $!ROTATE3DVIEW PSI ANGLE = 10 $!RUNMACROFUNCTION Syntax: $!RUNMACROFUNCTION <string> [<macroparameterlist>] Description:Execute commands defined in a macro function. The <string> references the name of the macro function to run. If the macro command requires parameters, then include them (within parentheses) after the macro command name. 187 Example: Run macro function XYZ and pass the value 7 as the first parameter and the value 3.5 as the second parameter: $!RUNMACROFUNCTION "XYZ" (7,3.5) S $!SAVELAYOUT Syntax: $!SAVELAYOUT <string> [optional parameters] Description:Save the current layout to a file. You must supply the file name. Optional Parameter Parameters Syntax Default Notes INCLUDEDATA = <boolean> NO INCLUDEPREVIEW = <boolean> YES Applies only if INCLUDEDATA is YES. USERELATIVEPATHS = <boolean> NO If YES, all files referenced in the layout file will use relative paths. If YES, a layout package file will be created. The extension .lpk is recommended. Example: Save the current layout to a file called ex1.lay: $!SAVELAYOUT "ex1.lay" $!SET3DEYEDISTANCE Syntax: $!SET3DEYEDISTANCE EYEDISTANCE = <dexp> Description:Sets the distance from the viewer to the plane of the current center of rotation. Example: $!SET3DEYEDISTANCE EYEDISTANCE = 13.5 $!SETAUXDATA Syntax: $!SETAUXDATA AUXDATALOCATION = [zone/var/dataset/frame/linemap] NAME = <string> VALUESTRING = <string> [optional parameters] Description:Add Auxiliary Data in the form of name/value pairs to zones, frames or datasets. The name must begin with an underscore or letter, and may be followed by one or more underscore, period, letter, or digit characters. 188 Required Parameters Parameter Syntax AUXDATALOCATION = [zone/var/ dataset/frame/ linemap|page] NAME = <string> VALUESTRING = <string> Default Notes Default Notes Optional Parameters Parameter Syntax MAP = <integer> Only required if AUXDATALOCATION = linemap VAR = <integer> Only required if AUXDATALOCATION = var ZONE = <integer> Only required if AUXDATALOCATION = zone Example: Set the selected Auxiliary Data to Zone 2: $!SETAUXDATA AUXDATALOCATION = zone ZONE = 2 NAME = "VARIABLE.DATA" VALUESTRING = "WEST SECTOR" $!SETDATASETTITLE Syntax: $!SETDATASETTITLE <string> [no optional parameters] Description:Set the title for the current data set. Example: $!SETDATASETTITLE "My data set" $!SETFIELDVALUE Syntax: $!SETFIELDVALUE ZONE = <integer> VAR = <integer> INDEX = <integer> FIELDVALUE = <dexp> AUTOBRANCH = <boolean> [no optional parameters] Description:Specify a field value (data set value) at a specified point index. If the zone referenced is IJ- or IJK-ordered then the point index is calculated by treating the 2- or 3D array as a 1-D array. 189 Required Parameters Parameters Syntax AUTOBRANCH = <boolean> FIELDVALUE = <dexp> INDEX = <integer> VAR = <integer> ZONE = <integer> Default Notes Affects shared variables only. If YES, the specified zone will no longer share that variable with the other zones. If NO, the variable will still be shared, and the change to the variable will be shown for all zones where it is shared. Example: A data set contains 2 zones and 3 variables. Zone 2 is dimensioned 5 by 3. Set the value for variable 3 at IJlocation (2, 2) to be 37.5: $!SETFIELDVALUE ZONE = 2 VAR = 3 INDEX = 7 FIELDVALUE = 37.5 AUTOBRANCH = YES Note that the INDEX value was calculated using: INDEX = I + (J-1)*|MAXI| + (K-1) * |MAXI| * |MAXJ| = 5*(2-1)+2 = 7 $!SETFRAMEBACKGROUNDCOLOR Syntax: $!SETFRAMEBACKGROUNDCOLOR <color> Description:Sets the frame background to the specified color and surveys all basic color assignments in Tecplot 360, converting the all basic colors using the following rules to achieve the best contrast: 1. For all line type basic colors that match the new basic frame color, set the basic line color to the best show color of the basic frame color. 2. For all fill type basic colors that match the best show color of the new basic frame color, set the fill color to the new frame color. Exceptions: 1. For geometries and text boxes if the line and fill colors are the same and filling is active then both lines and fill follow the fill rules above. 2. For zone, slice, iso-surface, and streamtrace object types the basic color shading (i.e. fill) only follows the fill rules above if lighting effects are not being used. $!SETSTYLEBASE Syntax: $!SETSTYLEBASE <stylebase> [no parameters] Description:Instruct Tecplot 360 on how to initialize frame style values when a new frame is created. During normal operation, Tecplot 360 bases the style of a new frame on the factory defaults plus any changes assigned in the Tecplot 360 configuration file. Layout files and stylesheet files, however, rely on Tecplot 360 basing new frames only on the factory defaults. This command is typically not 190 used by the casual user. Example: Set the style base for frames to use the factory defaults: $!SETSTYLEBASE FACTORY $!SHARECONNECTIVITY Syntax: $!SHARECONNECTIVITY SOURCEZONE = <integer> DESTINATIONZONE = <integer> [no optional parameters] Description:Share the nodemap between the source and destination zones, presuming that the zones are FE and have the same element type and number of nodes. Required Parameters Parameter Syntax DESTINATIONZONE = <integer> SOURCEZONE = <integer> Default Notes Example: Shares the connectivity of the second zone with the sixth zone: $!SHARECONNECTIVITY SOURCEZONE = 2 DESTINATIONZONE = 6 $!SHAREFIELDDATAVAR Syntax: $!SHAREFIELDDATAVAR SOURCEZONE = <integer> VAR = <integer> DESTINATIONZONE = <integer> [no optional parameters] Description:Allows sharing of the specified variable from the source zone to the destination zone. Zone must be of the same type (ordered or FE) and dimensions. Cell centered variables in FE must have the same number of cells. Sharing is not allowed if either zone has global face neighbors. Required Parameters Parameter Syntax DESTINATIONZONE = <integer> SOURCEZONE = <integer> VAR = <integer> Default Notes Example: Shares the third variable from the second zone, with the fifth zone: $!SHAREFIELDDATAVAR SOURCEZONE = 2 VAR = 3 DESTINATIONZONE = 5 191 $!SHIFTLINEMAPSTOBOTTOM Syntax: $!SHIFTLINEMAPSTOBOTTOM <set> [no parameters] Description:Shift a list of Line-mappings to the bottom of the Line-mapping list. This in effect causes the selected Line-mappings to be drawn last. Example: Shift Line-mappings 2 and 4 to the bottom: $!SHIFTLINEMAPSTOBOTTOM [2,4] $!SHIFTLINEMAPSTOTOP Syntax: $!SHIFTLINEMAPSTOTOP <set> [no parameters] Description:Shift a list of Line-maps to the top of the Line-map list. This in effect causes the selected Linemaps to be drawn first. Example: Shift Line-maps 2 and 4 to the top: $!SHIFTLINEMAPSTOTOP [2,4] $!SHOWMOUSEPOINTER Syntax: $!SHOWMOUSEPOINTER <boolean> [optional parameters] Description:The mouse icon may be deactivated within a macro to enhance the on-screen animation. It must be reactivated before exiting the macro. Example: $!SHOWMOUSEPOINTER NO $!LOOP 36 $!ROTATE3DVIEW X ANGLE = 5 $!REDRAW $!ENDLOOP $!SHOWMOUSEPOINTER YES $!SKETCHAXIS Syntax: $!SKETCHAXIS [optional parameters] Description:A SetValue command that assigns attributes for axes in a sketch mode frame. Axes are rarely used in sketch frames. 192 Optional Parameters Parameter AUTOADJUSTRANGES Syntax Default Notes = <boolean> NO AXISMODE = <axismode> XYDEPENDENT Set to INDEPENDENT or XYDEPENDENT. DEPXTOYRATIO <op> <dexp> =1 AXISMODE must be XYDEPENDENT to use this. GRIDAREA <<gridarea>> DRAWBORDER=NO, COLOR=BLACK, LINETHICKNESS=0.4 PRECISEGRID <<precisegrid>> INCLUDE=NO, SIZE=0.0045, COLOR=BLACK, ISFILLED=NO, FILLCOLOR=WHITE, DRAWGRIDLAST= NO PRESERVEAXISSCALE = <boolean> NO VIEWPORTNICEFIT = <double> TONICEVALEUS BUFFER VIEWPORTPOSITION <<rect>> X1=0, Y1=0, X2=100, Y2=100 VIEWPORTTOPSNAP = <double> 100 = <double> 10 TARGET VIEWPORTTOPSNAP TOLERANCE XDETAIL <<axisdetail>> YDETAIL <<axisdetail>> Example: Change the axis mode to be INDEPENDENT for sketch mode in the active frame: $!SKETCHAXIS AXISMODE = INDEPENDENT $!SLICEATTRIBUTES Syntax: $!SLICEATTRIBUTES [<slicegroup>] [optional parameters] Description:A SetValue command that changes global attributes associated with slices. 193 Optional Parameters Parameter Syntax Default Notes CONTOUR { LINEPATTERN = <linepattern> SOLID SHOW = <boolean> YES CONTOURTYPE = <contourtype> FLOOD COLOR = <color> SMRAINBOW LINETHICKNESS = <double> 0.1 USELIGHTINGEFFECT = <boolean> NO FLOODCOLORING = <contourcoloring> GROUP1 LINECONTOURGROUP = <integer> 1 PATTERNLENGTH = <dexp> 2 } EDGELAYER { EDGETYPE BORDERS SHOW = <boolean> NO COLOR = <color> BLACK LINETHICKNESS <op> <double> = 0.4 IBORDER BOTH JBORDER BOTH KBORDER BOTH } EFFECTS { LIGHTINGEFFECT GOURAUD SURFACETRANSLUCENCY = <integer> 10 USETRANSLUCENCY = <boolean> YES USEVALUEBLANKING = <boolean> YES USECLIPPLANES = <set> [1-6] X = <double> 0.95 Y = <double> 0.95 Z = <double> 0.95 I = <integer> 10 J = <integer> 10 K = <integer> 10 LINEPATTERN = <linepattern> SOLID PATTERNLENGTH = <dexp> 2 SHOW = <boolean> NO COLOR = <color> LINETHICKNESS = <double> 0.1 MESHTYPE = <meshtype> OVERLAY } ENDPOSITION { } MESH { } 194 CORNERCELL and AVERAGECELL options not allowed for CONTOURTYPE. Parameter NUMINTERMEDIATE Syntax Default Notes = <integer> 1 OBEYSOURCEBLANKING = <boolean> NO CLIPPLANE = <clipplane> NONE Use slice as a clipping plane, with one of the clipplane types. OBEYCLIPPLANES = <boolean> YES Clip slice by any clipping planes that intersect it. X = <double> 0.5 Y = <double> 0.5 Z = <double> 0.5 I = <integer> 5 J = <integer> 5 K = <integer> 5 SHOW = <boolean> NO COLOR = <color> BLACK USELIGHTINGEFFECT = <boolean> YES SHOWGROUP = <boolean> YES SHOWINTERMEDIATE = <boolean> NO SHOWPRIMARYSLICE = <boolean> YES SHOWSTARTENDSLICE = <boolean> NO SLICES PRIMARYPOSITION { } SHADE { } SLICES SLICECONSTRAINT { INCLUDE = <boolean> BOXDIMENSION <<xyz>> ORIGIN <<xyz>> } SLICESURFACE = <slicesurface> XPLANES X = <double> 0.05 Y = <double> 0.05 Z = <double> 0.05 I = <integer> 0 J = <integer> 0 K = <integer> 0 STARTPOSITION { } SURFACEEFFECTS { LIGHTINGEFFECT = <lightingeffect> SURFACETRANSLUCENCY = <translucency> USETRANSLUCENCY = <boolean> } VECTOR { SHOW = <boolean> NO COLOR = <color> BLACK 195 Parameter Syntax Default ISTANGENT = <boolean> NO LINETHICKNESS = <double> 0.1 VECTORTYPE = <vectortype> TAILATPOINT ARROWHEADSTYLE = <arrowheadstyle> PLAIN PATTERNLENGTH = <dexp> 2 LINEPATTERN = <linepattern> SOLID Notes } Example: $!GLOBALCONTOUR VAR = 4 $!SLICEATTRIBUTES ENDPOSITION {X = 1} $!SLICEATTRIBUTES STARTPOSITION {X = 6} $!SLICEATTRIBUTES NUMINTERMEDIATESLICES = 6 $!SLICEATTRIBUTES SHOWSTARTENDSLICE = YES $!SLICEATTRIBUTES SHOWINTERMEDIATESLICES = YES $!REDRAW $!CREATESLICEZONES $!SLICELAYERS Syntax: $!SLICELAYER SHOW = <boolean> Description:Turn slicing on or off. Required Parameters Parameter Syntax Default SHOW = <boolean> NO SHOWMESH = <boolean> YES SHOWCONTOUR = <boolean> YES SHOWVECTOR = <boolean> YES SHOWSHADE = <boolean> YES SHOWEDGE = <boolean> YES USETRANSLUCENCY = <boolean> YES USELIGHTINGEFFECT = <boolean> YES Notes Note: When slices are activated, they are colored using the contour variable by default. When you activate slices via the macro language you must perform one of the following steps in order for the slices to be visible in your final plot: • Set the contour variable by adding the following command to your macro file (prior to calling $!SLICELAYER). $!GLOBALCONTOUR n VAR=m where n is the contour group number and m is the number of the variable to use for contouring. or • Set CONTOUR SHOW = NO via the $!SLICEATTRIBUTES command. If you choose this option, you may want to turn on shading to improve the visibility of your slice. 196 $!SMOOTH Syntax: $!SMOOTH ZONE = <set> VAR = <set> [optional parameters] Description:Smooth data (reduce the spikes) for selected variables in selected zones. Required Parameters Parameter Syntax Default Notes ZONE = <set> Zones to smooth. VAR = <set> Variables to smooth. These cannot be X or Y if in 2D or Z if in 3D and they must be a dependent variable in XY-plots. Optional Parameters Parameter Syntax Default NUMSMOOTHPASSES = <integer> 1 SMOOTHWEIGHT = <dexp> 0.8 SMOOTHBNDRYCOND = <boundarycondi tion> FIXED Notes Example: Smooth variable 3 in zone 2: $!SMOOTH ZONE = 2 VAR = 3 NUMSMOOTHPASSES = 5 SMOOTHBNDRYCOND = ZERO2ND $!STREAMATTRIBUTES Syntax: $!STREAMATTRIBUTES [optional parameters] Description:A SetValue command that changes global attributes associated with streamtraces. 197 Optional Parameters Parameter Syntax Default Notes ADDARROWS = <boolean> YES ARROWHEADSIZE <op> <dexp> = 1.2 ARROWHEADSPACING <op> <double> = 10 Distance between arrowheads in frame units. CELLFRACTION <op> <dexp> = 0.25 Maximum fraction of the distance across a cell a streamtrace moves in one step. A streamtrace adjusts its step-size between CELLFRACTION and MINCELLFRACTION depending on local curvature of the streamtrace. COLOR = <color> BLACK LINETHICKNESS = 0.1 MAXSTEPS <op> <dexp> <op> <integer> MINCELLFRACTION <op> <dexp> = 1 x 10-005 OBEYSOURCEZONE = <boolean> NO = <boolean> NO Clip streamtraces by any clipping planes that intersect the streamtraces. <op><dexp> <op> <integer> = 0.01 Value is grid units. =3 Number of points used to define the streamrod cross-section. SHOW = <boolean> NO COLOR = <color> LINETHICKNESS <op><dexp> = 0.1 MESHTYPE = <meshtype> OVERLAY LINEPATTERN = <linepattern> SOLID PATTERNLENGTH = <dexp> 2 SHOW = <boolean> NO USELIGHTINGEFFECT = <boolean> YES FLOODCOLORING = <contourcoloring> GROUP1 CONTOURTYPE = <contourtype> FLOOD LINECONTOURGROUP = <integer> 1 LINEPATTERN = <linepattern> SOLID PATTERNLENGTH = <dexp> 2 LINETHICKNESS = <dexp> 0.1 SHOW = <boolean> YES COLOR = <color> USELIGHTINGEFFECT = <boolean> = 10,000 Minimum fraction of the distance across a cell a streamtrace moves in one step. BLANKING OBEYCLIPPLANES RODRIBBON { WIDTH NUMRODPOINTS MESH { } CONTOUR { } SHADE { } EFFECTS { 198 YES Parameter Syntax Default LIGHTINGEFFECT = <lightingeffect> GOURAUD SURFACETRANSLUCENCY = <translucency> 50 USETRANSLUCENCY = <boolean> NO USEVALUEBLANKING = <boolean> YES USECLIPPLANES = <set> [1-6] = <boolean> YES SHOWDASHES = <boolean> NO SHOWMARKERS = <boolean> NO MARKCOLOR = <color> BLACK MARKSIZE <op> <dexp> =1 DASHSKIP <op> <integer> =1 MARKSYMBOL <<symbolshape>> ISASCII=NO, GEOMSHAPE= SQUARE TIMESTART = <double> -1 x 10150 TIMEEND = <double> 1 x 10150 TIMEANCHOR = <double> 0 TIMEDELTA = <double> 1 x 10150 Notes } } SHOWPATHS STREAMTIMING { } TERMLINE { ISACTIVE = <boolean> NO SHOW = <boolean> YES COLOR = <color> BLACK LINEPATTERN = <linepattern> SOLID PATTERNLENGTH <op> <dexp> <op> <dexp> =2 LINETHICKNESS = 0.1 } $!STREAMTRACE [Required-Control Option] Description: The different commands in the STREAMTRACE compound function family are described separately in the following sections. The STREAMTRACE compound function family is: $!STREAMTRACE ADD $!STREAMTRACE DELETALL $!STREAMTRACE DELETERANGE $!STREAMTRACE RESETDELTATIME $!STREAMTRACE SETTERMINATIONLINE $!STREAMTRACE ADD Syntax: $!STREAMTRACE ADD [optional parameters] Description:Add a single streamtrace or a rake of streamtraces to the active frame. The frame must be a 2D or 199 3D field plot. Optional Parameters Parameters Syntax Default ALTSTARTPOS Notes This is required if NUMPTS is greater than 1 or if the streamtype is a volume rod or volume ribbon. { X = <dexp> 0.0 Y = <dexp> 0.0 Z = <dexp> 0.0 DIRECTION = <streamdirection> FORWARD DISTRIBUTIONREGION = <streamdistributionregion> NUMPTS = <integer> } If not present, use NUMPTS to decide whether to add a single streamtrace or a rake of streamtraces. 1 STARTPOS Use 1 to add a single streamtrace. Use n, n>1 for a rake of streamtraces. Z is necessary only if dealing with a 3D streamtrace. { X = <dexp> 0.0 Y = <dexp> 0.0 Z = <dexp> 0.0 } STREAMTYPE =<streamtype> Tecplot 360 determines the default STREAMTYPE based on a number of factors. It is best to always specify this parameter explicitly. Example 1: Add a rake of 5 streamtraces in a 2D field plot: $!STREAMTRACE ADD NUMPTS = 5 STREAMTYPE = TWODLINE STARTPOS { X = 0.5 Y = 0.5 } ALTSTARTPOS { X = 0.5 Y = 1.5 } Example 2: Add a single volume ribbon. Start the ribbon oriented parallel to the Z-axis: $!STREAMTRACE ADD STREAMTYPE = VOLUMERIBBON STARTPOS { X = 3.0 Y = 4.0 Z = 1.0 } ALTSTARTPOS { 200 X = 3.0 Y = 4.0 Z = 8.0 } $!STREAMTRACE DELETEALL Syntax: $!STREAMTRACE DELETEALL [no parameters] Description:Deletes all streamtraces in the active frame. If the frame mode is 2D, all 2D streamtraces are deleted. If the frame mode is 3D, all 3D streamtraces are deleted. Example: $!STREAMTRACE DELETEALL $!STREAMTRACE DELETERANGE Syntax: $!STREAMTRACE DELETERANGE [optional parameters] Description:Delete a range of streamtraces. Streamtraces are numbered sequentially in the order they were created. Optional Parameters Parameters Syntax Default RANGESTART = <integer> 1 RANGEEND = <integer> 1 Notes Example: Delete streamtraces 3-5: $!STREAMTRACE DELETERANGE RANGESTART = 3 RANGEEND = 5 $!STREAMTRACE RESETDELTATIME Syntax: $!STREAMTRACE RESETDELTATIME [no parameters] Description:Reset the time delta for dashed streamtraces. The delta time is reset such that a stream dash in the vicinity of the maximum vector magnitude will have a length approximately equal to 10 percent of the frame width. Example: $!STREAMTRACE RESETDELTATIME 201 $!STREAMTRACE SETTERMINATIONLINE Syntax: $!STREAMTRACE SETTERMINATIONLINE <xyrawdata> Description:Set the position of the termination line for streamtraces. Required Parameter Parameters Syntax Default <xyrawdata> Notes In 3D, the termination line is defined in the eye coordinate system. Example: Set the termination line using 3 points: $!STREAMTRACE SETTERMINATIONLINE RAWDATA 3 4 0 7 0 5 0 9 0 5 0 3 0 $!STREAMTRACELAYERS Syntax: $!STREAMTRACELAYERSSHOW = <boolean> Description:Turn streamtraces on or off. Required Parameters Parameter Syntax Default SHOW = <boolean> NO SHOWPATHS = <boolean> YES SHOWDASHES = <boolean> YES SHOWARROWHEADS = <boolean> YES SHOWMESH = <boolean> YES SHOWCONTOUR = <boolean> YES SHOWSHADE = <boolean> YES SHOWMARKERS = <boolean> YES USETRANSLUCENCY = <boolean> YES USELIGHTINGEFFECT = <boolean> YES Notes $!SYSTEM Syntax: $!SYSTEM <string> [optional parameters] Description:Instruct Tecplot 360 to submit a command to the operating system. For security reasons, execution of the $!SYSTEM command can be disabled to prevent unauthorized execution of system commands via macros. Use the OKTOEXECUTESYSTEMCOMMAND option to the $!INTERFACE macro command. 202 Example: Submit the system command to copy the file t7.plt to xxx.plt (UNIX): $!SYSTEM "cp t7.plt xxx.plt" Example: Submit the system command to copy the file t7.plt to xxx.plt (WINDOWS): $!SYSTEM "cmd /c t7.plt xxx.plt" Optional Parameters Parameter WAIT Syntax = <boolean> Default Notes YES If YES, Tecplot 360 will wait until the execution of the system command has completed before continuing. T $!THREEDAXIS Syntax: $!THREEDAXIS [optional parameters] Description:A SetValue command that assigns attributes for axes in a 3D frame. 203 Optional Parameters Parameter ASPECTRATIOLIMIT Syntax Default Notes = 25 Restrict the aspect ratio of the data. =2 Set aspect ratio for the data to this value when ASPECTRATIOLIMIT is exceeded. ASPECTRATIORESET <op> <dexp> <op> <dexp> AXISMODE = <axismode> BOXASPECTRATIOLIMIT <op> <dexp> = 25 Restrict the aspect ratio of the axis box. BOXASPECTRATIORESET <op> <dexp> =2 Set aspect ratio for the axis box to this value when ASPECTRATIOLIMIT is exceeded. DEPXTOYRATIO <op> <dexp> AXISMODE must be DEPENDENT to use this. DEPXTOZRATIO <op> <dexp> AXISMODE must be DEPENDENT to use this. EDGEAUTORESET = <boolean> Make Tecplot 360 automatically choose edges to label. Set to INDEPENDENT, XYDEPENDENT, or XYZDEPENDENT. FRAMEAXIS { SHOW = <boolean> SIZE <op> <dexp> <op> <dexp> LINETHICKNESS COLOR = <color> <<xy>> XYPOS } GRIDAREA <<gridarea>> PRESERVEAXISSCALE = <boolean> WHENRANGEISCHANGED XDETAIL <<axisdetail>> XYDEPXTOYRATIO <op> <dexp> YDETAIL <<axisdetail>> ZDETAIL <<axisdetail>> AXISMODE must be XYDEPENDENT to use this. Example: This example does the following: • Changes the variable assigned to the Z-axis to be variable number 2. • Turns off auto edge assignment and make axis labeling for the Y-axis occur on edge 2. $!THREEDAXIS ZVAR = 2 EDGEAUTORESET = NO YEDGE = 2 $!THREEDVIEW Syntax: $!THREEDVIEW [optional parameters] Description:A SetValue command that changes global attributes associated with the 3D view. 204 Optional Parameters Parameter Syntax Default ALPHAANGLE <op> <dexp> =0 DRAWINPERSPECTIVE = <boolean> NO FIELDOFVIEW <op> <dexp> Notes Angle is in degrees. PSIANGLE <op> <dexp> = 60 Angle is in degrees. THETAANGLE <op> <dexp> = 240 Angle is in degrees. VIEWERPOSITION <<xyz>> See Notes X = 8.073, Y = 4.873, Z = 5.549 VIEWWIDTH <op> <dexp> = 1.74267 Example: This example does the following: • Switches to perspective. • Changes the field of view. • Rotates around psi by 20 degrees. • Changes the viewer position. $!THREEDVIEW DRAWNINPERSPECTIVE = YES FIELDOFVIEW = 100 PSIANGLE += 20 VIEWERPOSITION { X = 1.26 Y = 1.25 Z = 0.74 } $!TRANSFORMCOORDINATES Syntax: $!TRANSFORMCOORDINATES TRANSFORMATION = <transformation> [optional parameters] Description:Transforms all points in one or more zones from one coordinate system to another. Tecplot 360 versions 2006 R2 and earlier incorrectly recorded the $!TRANSFORMCOORDINATES command. In these versions, the variable number options in this command were recorded as zero-based values instead of one-based values. Macros or layout files created with any of these versions and containing $!TRANSFORMCOORDINATES should increment each variable sub-command option by “one” in order to operate correctly with Tecplot 360 versions 2008 and newer. 205 Required Parameter Parameters TRANSFORMATION Syntax Default = <transformation> Notes Transformation. Optional Parameters Parameter Syntax Default Notes ANGLESPEC = <anglespec> RADIANS Specifies whether data is in degrees or radians CREATENEW = <boolean> NO If YES, then new variables X,Y,Z will be created if converting to rectangular coordinates, or R,THETA,PHI if converting to spherical. If NO, then you must specify the output variables. VARIABLES PSIVAR = <integer> PSI variable number. REQUIRED if the transformation is spherical to rectangular or if CREATENEWVARIABLES is NO. RVAR = <integer> R variable number. REQUIRED if the transformation is polar to rectangular or spherical to rectangular or if CREATENEWVARIABLES is NO. THETAVAR = <integer> XVAR = <integer> X variable number. REQUIRED if the transformation is rectangular to polar or rectangular to spherical or CREATENEWVARIABLES is NO. YVAR = <integer> Y variable number. REQUIRED if the transformation is rectangular to polar or rectangular to spherical or CREATENEWVARIABLES is NO. ZONELIST = <set> ZVAR = <integer> NONE all zones Theta variable number. REQUIRED if the transformation is polar to rectangular or spherical to rectangular or if CREATENEWVARIABLES is NO. Set of zones to operate on. Z variable number. REQUIRED if the transformation or rectangular to spherical or CREATENEWVARIABLES is NO. Example: Transform data from rectangular coordinates to polar coordinates specifying angles in degrees and creating new variables. $!TRANSFORMCOORDINATES TRANSFORMATION = RECTTOPOLAR ANGLESPEC = DEGREES CREATENEWVARIABLES = YES XVAR = 2 YVAR = 3 $!TRIANGULATE Syntax: $!TRIANGULATE [optional parameters] Description:Create a new zone by forming triangles from data points in existing zones. 206 Optional Parameters: Parameters Syntax AUTOSTRANDTRANSIENTDATA = <boolean> BOUNDARYZONES = <set> INCLUDEBOUNDARY Default Notes YES If set to YES, time strands are automatically created for transient data in the new zone. = <boolean> NO Set to YES if you also want the boundary points to be used to create triangles. SOURCEZONES = <set> All zones. TRIANGLEKEEP = <dexp> 0.25 = <boolean> NO Required if USEBOUNDARY is YES. PTS FACTOR USEBOUNDARY Specify one or more I-ordered zones that define boundaries across which no triangles can be created. Example: Create a zone by triangulating data points from zones 1 and 2: $!TRIANGULATE SOURCEZONES= [1,2] $!TWODAXIS Syntax: $!TWODAXIS [optional parameters] Description:A SetValue command that assigns attributes for axes in a 2D frame. Optional Parameters Parameter AUTOADJUSTRANGES Syntax Default Notes = <boolean> TONICEVALUES AXISMODE <axismode> Set to INDEPENDENT or XYDEPENDENT DEPXTOYRATIO <op> <dexp> AXISMODE must be XYDEPENDENT to use this. GRIDAREA <<gridarea>> PRECISEGRID <<precisegrid>> PRESERVEAXISSCALE = <boolean> WHENRANGEISCHANGED VIEWPORTNICEFIT = <double> BUFFER VIEWPORTPOSTITION <<rect>> VIEWPORTTOPSNAP = <integer> 100 = <integer> 10 XDETAIL <<axisdetail>> VARNUM = 1 YDETAIL <<axisdetail>> VARNUM = 2 TARGET VIEWPORTTOPSNAP TOLERANCE Example: Set the X-axis to use variable 3 for a 2D plot: $!TWODAXIS XDETAIL {VARNUM = 3} 207 V $!VARSET Syntax: $!VARSET <macrovar> <op> <dexp> [no parameters] or $!VARSET <macrovar> = <string> [no parameters] Description:Assign a value to a macro variable. If the macro variable did not exist prior to this command, then it is defined here. A macro variable can be assigned a value or a string. Examples: Example 1: Set the macro variable |myvar| to 3: $!VARSET |myvar| = 3 Example 2: Add 2 to the macro variable |myvar|: $!VARSET |myvar| += 2 Example 3: Set the macro variable |File1| to be myfile.plt: $!VARSET |File1| = "myfile.plt" Example 4: Set the macro variable |F1| to equal |V2| + |V3|, where |V2| and |V3| are predefined variables: $!VARSET|V2| = 4 $!VARSET|V3| = 5 $!VARSET|F1| = (|V2| + |V3|) $!VIEW [Required-Control Option] Description: The different commands in the VIEW compound function family are described separately in the following sections. The VIEW compound function family is: $!VIEW $!VIEW $!VIEW $!VIEW $!VIEW $!VIEW $!VIEW 208 AXISFIT AXISMAKECURRENTVALUESNICE AXISNICEFIT CENTER COPY DATAFIT FIT $!VIEW $!VIEW $!VIEW $!VIEW $!VIEW $!VIEW $!VIEW $!VIEW $!VIEW $!VIEW FITSURFACES LAST MAKECURRENTVIEWNICE NICEFIT PASTE PUSH RESETTOENTIRECIRCLE SETMAGNIFICATION TRANSLATE ZOOM $!VIEW AXISFIT Syntax: $!VIEW AXISFIT [optional parameters] Description:Reset the range on a specific axis so that it equals the minimum and maximum of the data being plotted. If the axis dependency is not independent then this action may also affect the range on another axis. Optional Parameters Parameter Syntax Default Notes AXIS = <xyaxis> ‘X’ Default is ‘T’ for polar plot type. AXISNUM = <integer> 1 Only XY frame mode allows for this to be a number greater than 1. Example: Reset the range on the Y-axis to fit the data being plotted: $!VIEW AXISFIT AXIS =’Y’ $!VIEW AXISMAKECURRENTAXISVALUESNICE Syntax: $!VIEW AXISMAKECURRENTAXISVALUESNICE [optional parameters] Description:Reset the axis-line label values such that all currently displayed values are set to have the smallest number of significant digits possible. Optional Parameters Parameter Syntax Default Notes AXIS = <xyaxis> ‘X’ Default is ‘T’ for polar plot type. AXISNUM = <integer> 1 Only XY line plots allow for this to be a number greater than 1. Example: Set the range on the Z-axis to have nice values for the axis labels: $!VIEW AXISMAKECURRENTAXISVALUESNICE AXIS = ’Z’ $!VIEW AXISNICEFIT Syntax: $!VIEW AXISNICEFIT [optional parameters] 209 Description:Reset the range on a specific axis so that it equals the minimum and maximum of the data being plotted, but makes the axis values “nice” by setting labels to have the smallest number of significant digits possible. If the axis dependency is not independent then this action may also affect the range on another axis. Optional Parameters: Parameter Syntax Default Notes AXIS = <xyaxis> ‘X’ Default is ‘T’ for polar plot type. AXISNUM = <integer> 1 Only XY frame mode allows for this to be a number greater than 1. Example: Reset the range on the Y-axis to fit the data being plotted, with nice values on the axis-line: $!VIEW AXISNICEFIT AXIS =’Y’ $!VIEW CENTER Syntax: $!VIEW CENTER [no parameters] Description:Center the data within the axis grid area. $!VIEW COPY Syntax: $!VIEW COPY [no parameters] Description:Copy the current view to the view paste buffer. See also $!VIEW PASTE. $!VIEW DATAFIT Syntax: $!VIEW DATAFIT [no parameters] Description:Fit the current set of data zones or line mappings being plotted within the grid area. This does not take into consideration text or geometries. $!VIEW FIT Syntax: $!VIEW FIT [no parameters] Description:Fit the entire plot to the grid area. This also takes into consideration text and geometries that are plotted using the grid coordinate system. In 3D, this also includes the axes. 210 $!VIEW FITSURFACES Syntax: $!VIEW FITSURFACES [no parameters] Description:Fits active plot surfaces to the grid area. 3D volume zones are excluded when surfaces to plot are set to none. See $!FIELDMAP for more information on setting surfaces to plot. $!VIEW LAST Syntax: $!VIEW LAST [no parameters] Description:Retrieve the previous view from the view stack. Each frame mode within each frame maintains its own view stack. $!VIEW LAST will not reverse alterations to data. $!VIEW MAKECURRENTVIEWNICE Syntax: $!VIEW MAKECURRENTVIEWNICE [no parameters] Description:Shifts axis to make axis-line values nice without changing the extents of the window. Only works in Sketch/XY/2D. $!VIEW NICEFIT Syntax: $!VIEW NICEFIT [no parameters] Description:Change view to make the extents of the frame neatly hold the plot with integer values for axis labels. Only works in Sketch/XY/2D. $!VIEW PASTE Syntax: $!VIEW PASTE [no parameters] Description:Retrieve the view from the view paste buffer and assign it to the active frame. $!VIEW PUSH Syntax: $!VIEW PUSH [no parameters] Description:Instruct Tecplot 360 to push the current view onto the view stack. A view will not be pushed if the current view is the same as the top view on the stack. Note that commands VIEW AXISFIT, VIEW CENTER, VIEW DATAFIT, VIEW FIT, and VIEW ZOOM automatically push a view onto the stack. Tecplot 360 automatically pushes the current view onto the stack when a $!REDRAW command is issued and the current view is different from the top view on the view stack. 211 $!VIEW RESETTOENTIRECIRCLE Syntax: $!VIEW RESETTOENTIRECIRCLE [no parameters] Description:Reset the Theta-R Axis to initial settings. For Polar plots only. $!VIEW SETMAGNIFICATION Syntax: $!VIEW SETMAGNIFICATION MAGNIFICATION = <dexp> Description:Set the magnification for the data being plotted. A magnification of 1 will size the plot so it can fit within the grid area. Required Parameter Parameter MAGNIFICATION Syntax Default Notes = <dexp> Example: Make the plot to be drawn one-half as big as when it fits within the grid area: $!VIEW SETMAGNIFICATION MAGNIFICATION = 0.5 $!VIEW TRANSLATE Syntax: $!VIEW TRANSLATE X = <dexp> Y = <dexp> [no optional parameters] Description:Shift the data being plotted in the X- and/or Y-direction. The amount translated is in frame units. Required Parameters Parameter Syntax Default Notes X = <dexp> 0.0 Amount to translate in X-frame units. Y = <dexp> 0.0 Amount to translate in Y-frame units. Example: Translate the view 10 percent of the frame width to the right: $!VIEW TRANSLATE X = 10 Y = 0 $!VIEW ZOOM Syntax: 212 $!VIEW ZOOM X1 = <dexp> Y1 = <dexp> X2 = <dexp> Y2 = <dexp> [no optional parameters] Description:Change the view by “zooming” into the data. In Sketch, XY, and 2D frame mode plots, Tecplot 360 will adjust the ranges on the axis to view the region defined by the rectangle with corners at (X1, Y1) and (X2, Y2). For 3D orthographic plots, the view is translated and scaled to fit the region. For 3D perspective plots, the view is rotated about the viewer and scaled to fit the region. X1 and so forth are measured in grid coordinates. Required Parameters Parameter Syntax X1 = <dexp> Y1 = <dexp> X2 = <dexp> Y2 = <dexp> Default Notes Example: Zoom so the rectangular region with corners at (1, 0) and (7, 9) are in view: $!VIEW ZOOM X1 = 1 Y1 = 0 X2 = 7 Y2 = 9 W-X $!WHILE...$!ENDWHILE Syntax:$!WHILE <conditionalexp> .$!ENDWHILE Description:Continue to execute a set of commands until a conditional expression is NO. Example: Execute a set of commands until the macro variable |myvar| is greater than 1.0: $!VARSET |myvar| = 0.0 $!WHILE |myvar| < 1.0 $!VARSET |myvar| += 0.01 $!ENDWHILE $!WORKSPACEVIEW [Required-Control Option] Description:The different commands in the WORKSPACEVIEW compound function family are described separately in the following sections. The WORKSPACEVIEW compound functions are: $!WORKSPACEVIEW $!WORKSPACEVIEW $!WORKSPACEVIEW $!WORKSPACEVIEW $!WORKSPACEVIEW $!WORKSPACEVIEW $!WORKSPACEVIEW $!WORKSPACEVIEW FITALLFRAMES FITPAPER FITSELECTEDFRAMES LASTVIEW MAXIMIZE TRANSLATE UNMAXIMIZE ZOOM 213 $!WORKSPACEVIEW FITALLFRAMES Syntax: $!WORKSPACEVIEW FITALLFRAMES [no parameters] Description:Change the view in the workspace so all frames are fit just inside the edges of the workspace. $!WORKSPACEVIEW FITPAPER Syntax: $!WORKSPACEVIEW FITPAPER [no parameters] Description:Change the view in the workspace so the entire paper is fit just inside the edges of the workspace. $!WORKSPACEVIEW FITSELECTEDFRAMES Syntax: $!WORKSPACEVIEW FITSELECTEDFRAMES [no parameters] Description:Change the view in the workspace so the currently selected frames (that is, the frames with pick handles) are fit just inside the edges of the workspace. $!WORKSPACEVIEW LASTVIEW Syntax: $!WORKSPACEVIEW LASTVIEW [no parameters] Description:Return to the previous workspace view. $!WORKSPACEVIEW MAXIMIZE Syntax: $!WORKSPACEVIEW MAXIMIZE [no parameters] Description:Temporarily expand the work area as large as possible. The maximized work area occupies the entire Tecplot 360 process window. $!WORKSPACEVIEW TRANSLATE Syntax: $!WORKSPACEVIEW TRANSLATE X = <dexp> Y = <dexp> [no optional parameters] Description:Shift the view of the workspace. This has no effect on the local view within any frame in your layout. 214 Required Parameters Parameter Syntax Default Notes X = <dexp> 0 Value is in inches. Y = <dexp> 0 Value is in inches. Example: Shift the workspace view to the left by 2 inches (as measured by the workspace ruler): $!WORKSPACEVIEW TRANSLATE X = -2 Y = 0 $!WORKSPACEVIEW UNMAXIMIZE Syntax: $!WORKSPACEVIEW UNMAXIMIZE [no parameters] Description:Returns the workspace to its normal size after it has been expanded after $!WORKSPACE MAXIMIZE has been used. $!WORKSPACEVIEW ZOOM Syntax: $!WORKSPACEVIEW ZOOM X1 = <dexp> Y1 = <dexp> X2 = <dexp> Y2 = <dexp> [no optional parameters] Description:Change the view into the work area. This has no effect on the local view within any frame in your layout. Required Parameters Parameter Syntax X1 = <dexp> Y1 = <dexp> X2 = <dexp> Y2 = <dexp> Default Notes Example: Make the region in the lower left corner of an 8.5 by 11 paper be viewable in the work area. The paper is in portrait orientation: $!WORKSPACEVIEW ZOOM X1 = 0 Y1 = 5.5 X2 = 4.25 Y2 = 9.75 215 $!WRITECOLORMAP Syntax: $!WRITECOLORMAP <string> [no parameters] Description:Write the current color map to a file. The <string> is the name of the file to write to. Example: $!WRITECOLORMAP "mycolors.map" $!WRITECURVEINFO Syntax: $!WRITECURVEINFO <string> SOURCEMAP = <integer> [optional parameters] Description:Write out the curve details or the calculated data points for the equation(s) used to draw the curve for a selected line mapping. The <string> is the name of the file to write to. Required Parameter Parameter Syntax SOURCEMAP Default = <integer> Notes This must be the number of a line mapping that does some type of curve fit or spline. Optional Parameter Parameters Syntax CURVEINFOMODE = <curveinfomode > Default CURVE DETAILS Notes Use CURVE DETAILS or CURVEPOINTS. Example: Write out the coefficients for XY line mapping number 3 to map3.out: $!WRITECURVEINFO "map3.out" SOURCEMAP = 3 CURVEINFOMODE = CURVE DETAILS $!WRITEDATASET Syntax: $!WRITEDATASET <string> [optional parameters] Description:Write the data set attached to the active frame to a file. The <string> is the name of the file to write to. 216 Optional Parameters Parameters ASSOCIATELAYOUT Syntax Default Notes = <boolean> YES BINARY = <boolean> YES INCLUDEAUTOGEN = <boolean> NO = <boolean> YES INCLUDEDATA = <boolean> YES INCLUDEDATASHAREL INKAGE = <boolean> NO INCLUDEGEOM = <boolean> YES INCLUDETEXT = <boolean> YES PRECISION = <integer> 12 Only used if ASCII (that is, BINARY is NO). TECPLOTVERSION = <string> TecplotCurrent Optional designation of binary file version. Possible values are TecplotCurrent, Tecplot2009, Tecplot2008, and Tecplot2006. Only used if ASCII (that is, BINARY is NO). WITHDATAFILE If NO, you can include PRECISION and USEPOINTFORMAT. FACENEIGHBORS INCLUDECUSTOM LABELS TOWRITE USEPOINTFORMAT = <boolean> NO VARPOSITIONLIST = <set> All vars. Use this to limit the number of variables written out. ZONELIST = <set> All zones. Use this to limit the number of zones written out. Example: Write out only zone 3 to a file called zone3.plt: $!WRITEDATASET "zone3.plt" INCLUDETEXT = NO INCLUDEGEOM = NO INCLUDECUSTOMLABELS = NO ZONELIST = [3] $!WRITESTYLESHEET Syntax: $!WRITESTYLESHEET <string> [optional parameters] Description:Write the style for the active frame to a file. The <string> is the name of the file to write to. 217 Optional Parameters Parameters Syntax INCLUDECONTOUR Default = <boolean> YES INCLUDETEXT = <boolean> YES INCLUDEGEOM = <boolean> YES INCLUDEPLOTSTYLE = <boolean> YES INCLUDESTREAMPOSI TIONS = <boolean> YES INCLUDEFACTORY = <boolean> NO Notes LEVELS DEFAULTS USERELATIVEPATHS = <boolean> INCLUDEAUXDATA = <boolean> YES Example: Write out a stylesheet for the active frame to f1.sty: $!WRITESTYLESHEET "f1.sty" INCLUDEFACTORYDEFAULTS = YES $!XYLINEAXIS Syntax: $!XYLINEAXIS [optional parameters] Description:A SetValue command that assigns attributes for axes in an XY Line plot. Optional Parameters Parameter Syntax AUTOADJUSTRANGES Default Notes = <boolean> NO AXISMODE <axismode> INDEPENDENT Set to INDEPENDENT or XYDEPENDENT. DEPXTOYRATIO <op> <dexp> =1 AXISMODE must be XYDEPENDENT to use this. This applies only to the X1- and Y1-axes. GRIDAREA <<gridarea>> <<precisegrid>> See Notes DRAWBORDER=N0, COLOR=BLACK, LINE THICKNESS=0.4 See Notes INCLUDE=NO, SIZE=0.0045, COLOR=BLACK, ISFILLED=NO, FILLCOLOR=WHITE, DRAWGRIDLAST=NO PRESERVEAXISSCALE = <boolean> NO VIEWPORTNICEFIT = <double> TONICEVALUES PRECISEGRID Between 1 and 100. BUFFER VIEWPORTPOSITION VIEWPORTTOPSNAP See Notes = <integer> 100 = <integer> 10 X1 = 13, Y1 = 11, X2 = 8, Y = 88 TARGET VIEWPORTTOPSNAP TOLERANCE XDETAIL <integer> <<axisdetail>> The <integer> option specifies which axis to operate on, 1 n 5. YDETAIL <integer> <<axisdetail>> The <integer> option specifies which axis to operate on, 1 n 5. Example: Set the axis mode to be independent for the XY-axes (note that this affects only X1 versus Y1): $!XYLINEAXIS AXISMODE = INDEPENDENT 218 10 Macro Commands for the Analyze Menu All of the macro commands associated with the Analyze menu are embedded within Tecplot 360’s EXTENDEDCOMMAND macro. The syntax of this macro is shown below: $!EXTENDEDCOMMAND COMMANDPROCESSORID = <string> COMMAND = <string> The first <string> is a text string should be set to CFDAnalyzer3. The second string is sent to one of the add-ons listed below. 10 - 1 Summary of Analyze Macro Commands ANIMATESTREAKLINES may be used following a streakline calculation to animate the streaklines, either to the screen or to a file. ATTACHINTEGRATIONRESULTS is used following an integration to create a text field and attach it to the current Tecplot 360 frame. This macro has the same effect as clicking Make Text on the Integration Results text dialog. Note: It is not necessary to direct the macro to display the Integration Results dialog in order to attach or save the results. CALCPARTICLEPATH calculates particle paths or streaklines for steady or unsteady flow solutions, using the location of any existing streamtraces as starting locations for the particles. Particles may have mass or be massless. CALCTURBULENCEFUNCTION calculates any of four turbulence-related functions, given any two in your data set. CALCULATE calculates a PLOT3D function. The name of this function must be specified in the shortened form listed in Section 10 - 3 “Parameter Assignment Values”. 219 CALCULATEACCURACY uses Richardson extrapolation to estimate the order accuracy of the solution, given the solution on three grids of successively finer resolution. If either of the plotting options are set to TRUE, the resulting Tecplot 360 frames will be in front after executing this command. DISPLAYBOUNDARIES displays zone boundaries in a new frame according to settings made by the SETGEOMETRYANDBOUNDARIES macro. Each boundary of each 3D zone (in 3D Cartesian plots) or 2D zone (in 2D Cartesian plots) is displayed and named according to the boundary condition applied to it. Boundaries that are connected to the boundaries of adjacent zones are named as such. EXTRACTFLOWFEATURE displays shock surfaces, vortex cores, or separation and attachment lines for 3D flow solutions. Separation and attachment lines are only calculated on no-slip wall boundaries identified by the SETGEOMETRYANDBOUNDARIES macro. Shock surfaces are displayed as iso-surfaces of a new variable, ShockFeature, while the remaining features are displayed as new zones. EXTRAPOLATESOLUTION performs Richardson extrapolation to estimate the true solution from three input solutions on grids of successively finer resolution. It saves the extrapolated solution as a new zone in the current data set. It also saves an additional zone containing the difference between this solution and the original solution. INTEGRATE performs an integration. All Integrate dialog options are available to this macro, including the display options. If the PLOTRESULTS parameter is set to TRUE, then the Tecplot 360 frame showing the integration results is the active frame following this command. SAVEINTEGRATIONRESULTS has the same effect as clicking Save on the Integration Results dialog and selecting a file. The results are saved to the file named by the FILE parameter. SETFIELDVARIABLES identifies variables in your data, such as velocity, pressure and temperature, for use in analysis. SETFLUIDPROPERTIES sets the properties of the fluid, such as viscosity. These are used by some actions of the CALCULATE and INTEGRATE commands. SETGEOMETRYANDBOUNDARIES identifies boundaries of zones in a flow solution and the boundary conditions applied to them. It also specifies whether zones with coincident boundary nodes should be considered connected at those points, as well as whether 2D solutions should be regarded as axisymmetric. SETREFERENCEVALUES sets the reference (free-stream) properties of the solution. This information is used by other calculations. SETUNSTEADYFLOWOPTIONS identifies solution time levels for unsteady flow solutions. This information is used for particle path and streakline calculations. 10 - 2 Macro Command Description The syntax, mandatory and optional parameters for each of the macro commands listed in Section 10 - 1 are described below. Items within single angle brackets (<>) are defined in Section 10 - 3. The COMMAND strings below must be contained on a single line in your macro command file, although they appear on multiple lines below. ANIMATESTREAKLINES Syntax:$!EXTENDEDCOMMAND COMMANDPROCESSORID = ‘CFDANALYZER3’ COMMAND = ‘ANIMATESTREAKLINES 220 Macro Command Description [optional parameters]’ Description: Animates previously calculated streaklines to the screen or to a file. Optional Parameters: Parameter Syntax Default DESTINATION = <string> SCREEN FILENAME = <string> ““ WIDTH SPEED = <integer> = <double> 300 10.0 USEMULTIPLECOLO R = <boolean> FALSE = <boolean> FALSE Notes Specifies the destination of the animation. May be SCREEN, AVIFILE or RASTERMETAFILE. The name of the file to which to save the animation. Must be specified for DESTINATION values of AVIFILE or RASTERMETAFILE. The width of the animation when saved to a file. The speed in frames per second of the animation. Only used for animations saved to an AVI file. Specifies whether animations saved to a file should include one color table for each frame. The default is to use a single color table. TABLES INCLUDEZONE ANIMATION ATTACHINTEGRATIONRESULTS Syntax: $!EXTENDEDCOMMAND COMMANDPROCESSORID = ‘CFDAnalyzer3’ COMMAND = ‘ATTACHINTEGRATIONRESULTS’ Description:Attach the text results of the previous integration as a text field in the active frame. CALCPARTICLEPATH Syntax: $!EXTENDEDCOMMAND COMMANDPROCESSORID = ‘CFDAnalyzer3’ COMMAND = ‘CALCPARTICLEPATH [optional parameters]’ Description:Calculate particle paths or streaklines, starting from existing Tecplot 360 streamtraces. 221 Optional Parameters: Parameter Syntax Default FUNCTION = <particlefunction> TIMESTEP = <double> 1 MAXTIMESTEPS RELEASEFREQ = <integer> 1000 1 RELEASEOPTION = <releaseoption> HAVEMASS = <double> PARTICLEPATH Notes Can be PARTICLEPATH or STREAKLINE. The integration time step for the calculation. For steady-state calculations only. For FUNCTION = STREAKLINE. Indicates the number of particles to release in the indicated time period (see the next parameter). TIMELEVEL For FUNCTION = STREAKLINE. If TIMELEVEL, indicates that RELEASEFREQ particles should be released every solution time level. If UNITTIME, indicates that this number of particles should be released in a unit amount of solution time. = <boolean> FALSE If TRUE, particles have mass; specify the particle mass options below. CREATESINGLEZONE = <boolean> FALSE For FUNCTION = PARTICLEPATH only, specifies that all particle paths should be combined into a single I-J ordered zone. STOREOPTION = <storeoption> PARTICLEVALUES If PARTICLEVALUES, the particle’s velocity, mass and temperature (if calculated) will be stored in place of appropriate fluid values in the particle path’s zone. If FLUIDVALUES, all fluid values the particle passed through will be stored in the zone. COEFFS = <coeffsoption> GENERAL If GENERAL, specify BALLISTICCOEFF, plus TEMPTIMECONST if calculating particle temperature. If DETAILED, specify MASS, RADIUS, and DRAGCOEFF, plus SPECIFICHEAT and NUSSELT if calculating temperature. Only applies if HAVEMASS = TRUE. CALCTEMPERATURE = <boolean> FALSE If TRUE, particle temperature will be calculated. Only applies if HAVEMASS = TRUE. GRAVITYCONSTANT = <double> 0.0 The acceleration due to gravity. Only applies if HAVEMASS = TRUE. GRAVITYDIRECTION = <gravitydirection> INITIALVELOCITYOPTI ON = <initialvelocityoption> BALLISTICCOEFF TEMPTIMECONST MINUSX The axis direction in which gravity acts. Only applies if HAVEMASS = TRUE. LOCALFLUIDVELOCITY The initial velocity of particles. Options are LOCALFLUIDVELOCITY and ZEROVELOCITY. Only applies if HAVEMASS = TRUE. = <double> 1.0 For GENERAL coefficients only, the ballistic coefficient of the particle. Only applies if HAVEMASS = TRUE. = <double> 1.0 For GENERAL coefficients with CALCTEMPERATURE = TRUE only, the temperature relaxation factor of the particle. Only applies if HAVEMASS = TRUE. MASS = <double> 1.0 For DETAILED coefficients only, the particle mass. Only applies if HAVEMASS = TRUE. RADIUS = <double> 1.0 For DETAILED coefficients only, the particle initial radius. Only applies if HAVEMASS = TRUE. 222 Macro Command Description Parameter Syntax Default DRAGCOEFFOPTION = <specifyoption> SPECIFY DRAGCOEFF = <double> 1.0 Notes For DETAILED coefficients only. If SPECIFY, specify DRAGCOEFF. If CALCULATE, Tecplot 360 will calculate the drag coefficient. Only applies if HAVEMASS = TRUE. For DETAILED coefficients only, with DRAGCOEFFOPTION = SPECIFY, the particle drag coefficient. Only applies if HAVEMASS = TRUE. SPECIFICHEAT = <double> 1.0 For DETAILED coefficients with CALCTEMPERATURE = TRUE only, the particle specific heat. Only applies if HAVEMASS = TRUE. NUSSELTOPTION = <specifyoption> NUSSELT = <double> SPECIFY For DETAILED coefficients with CALCTEMPERATURE = TRUE only. If SPECIFY, specify NUSSELT. If CALCULATE, Tecplot 360 will calculate the Nusselt number. Only applies if HAVEMASS = TRUE. 1.0 For DETAILED coefficients with CALCTEMPERATURE = TRUE and NUSSELTOPTION = SPECIFY only, the particle Nusselt number. Only applies if HAVEMASS = TRUE. TERMOPTION = <terminationoption> TEMPERATURE For DETAILED coefficients with CALCTEMPERATURE = TRUE only (is always TEMPERATURE for general coefficients), the particle termination option. May beTEMPERATURE or ABLATE. Only applies if HAVEMASS = TRUE. TEMPERATURE = <double> 1.0 If TERMOPTION = TEMPERATURE, the particle termination temperature. If TERMOPTION = ABLATE, the ablation temperature. Only applies if HAVEMASS = TRUE. LATENTHEAT = <double> 1.0 For TERMOPTION = ABLATE only, the latent heat of the ablative process. Only applies if HAVEMASS = TRUE. Example 1:Calculate streaklines with an integration time step of 0.1, releasing eight particles per unit solution time: $!EXTENDEDCOMMAND COMMANDPROCESSORID = CFDAnalyzer3 COMMAND = ‘CALCPARTICLEPATH FUNCTION=STREAKLINE TIMESTEP=0.1 RELEASEFREQ=8 RELEASEOPTION=UNITTIME’ Example 2:Calculate particle paths, including temperature with ablation, in a steady-state flow for particles with an initial mass of 3E-14, an initial radius of 1.5E-6 and a specific heat of 703. Use a time step of 1E-6. Have Tecplot 360 calculate the drag coefficient and the Nusselt number. Use an ablation temperature of 2,250 and a latent heat of 1.5E5: $!EXTENDEDCOMMAND COMMANDPROCESSORID = CFDAnalyzer3 COMMAND = ‘CALCPARTICLEPATH TIMESTEP = 1.0e-6 HAVEMASS = TRUE COEFFS = DETAILED CALCTEMPERATURE = TRUE MASS = 3e-14 223 RADIUS = 1.5e-6 DRAGCOEFFOPTION = CALCULATE SPECIFICHEAT = 703 NUSSELTOPTION = CALCULATE TERMOPTION = ABLATE TEMPERATURE = 2250 LATENTHEAT = 1.5e5’ CALCTURBULENCEFUNCTION Syntax: $!EXTENDEDCOMMAND COMMANDPROCESSORID = ‘CFDAnalyzer3’ COMMAND = ‘CALCTURBULENCEFUNCTION’ [optional parameters] Description:Calculate a turbulence-related function from two variables in the current data set. Add the result to the data set as a new variable using the function’s name, or overwrite the variable if it already exists. Optional Parameters: Parameter Syntax Default Notes CALCULATEONDEMAND = <boolean> FUNCTION = <turbulencefunction> FREQUENCY May be ENERGY, DISSIPATIONRATE, FREQUENCY, or VISCOSITY. ID1 = <turbulencefunction> ENERGY The turbulence quantity the first data set variable represents. VARIABLE1 = <integer> ID2 = <turbulencefunction> VARIABLE2 = <integer> VALUELOCATION = <valuelocation> FALSE 1 The number of the first data set variable. DISSIPATIONRATE The turbulence quantity the second data set variable represents. 2 The number of the second data set variable. NODAL The location of new variables added to the data set. Can be NODAL or CELLCENTERED. Example:Calculate turbulent kinematic viscosity from turbulent kinetic energy, variable 5, and turbulent frequency, variable 6: $!EXTENDEDCOMMAND COMMANDPROCESSORID = CFDAnalyzer3 COMMAND = ‘CALCTURBULENCEFUNCTION FUNCTION=VISCOSITY VARIABLE1=5 ID2=FREQUENCY VARIABLE2=6’ CALCULATE Syntax: $!EXTENDEDCOMMAND COMMANDPROCESSORID = ‘CFDAnalyzer3’ COMMAND = ‘CALCULATE FUNCTION = <functionname> [optional parameters]’ Description:Calculate a Tecplot 360 variable using the specified function and add it to the current data set. If the variable already exists in the current data set, it will be recalculated. 224 Macro Command Description Required Parameter: Parameter Syntax FUNCTION Default = <functionname> Notes Indicates the function to be used to calculate the variable. If it is a vector function, the components will be stored as X name, Y name, and Z name, where name is the function name appearing in the interface. Optional Parameter: Parameter Syntax Default NORMALIZATION = <normalizationo ption> NONE VALUELOCATION = <valuelocation> NODAL CALCULATEONDEMAND = <boolean> Notes May be NONE, MAXIMUMMAGNITUDE or REFERENCEVALUES. The location of new variables added to the data set. Can be NODAL or CELLCENTERED. FALSE Example 1:Calculate the Jacobian for the grid of the current data set: $!EXTENDEDCOMMAND COMMANDPROCESSORID = CFDAnalyzer3 COMMAND = ‘CALCULATE FUNCTION = JACOBIAN’ Example 2:Calculate the pressure coefficient for the current data set. The freestream density and speed of sound are 1.0 (the defaults): $!EXTENDEDCOMMAND COMMANDPROCESSORID = CFDAnalyzer3 COMMAND = ‘CALCULATE FUNCTION = PRESSURECOEF’ CALCULATEACCURACY Syntax: $!EXTENDEDCOMMAND COMMANDPROCESSORID = ‘CFDAnalyzer3’ COMMAND = ‘CALCULATEACCURACY ZONES = [<set>] [optional parameters]’ Description:Calculate the order accuracy of the solution contained in the listed zones. Optionally, plot the overall accuracy versus grid spacing and plot the accuracy at each grid node. 225 Required Parameter: Parameter Syntax ZONES Default = <set> Notes Indicates the three zones from which to perform the accuracy calculation. Optional Parameters: Parameter Syntax Syntax Default Notes MAXACCURACY = <double> 2.0 DATASETVAR = <integer> 1 PLOTDETAILED = <boolean> FALSE ACCURACY PLOTOVERALL If TRUE, a new frame will be created containing the accuracy calculated at each grid node. = <boolean> FALSE If TRUE, a new frame will be created containing the 1-norm and max-norm of the estimated error for each solution zone plotted versus grid resolution. ACCURACY The maximum theoretical accuracy of the solver which generated the solution. Used to limit the calculated accuracy. The data set variable with which to perform the accuracy calculation. Example:Calculate the accuracy using zones 3, 4 and 5, along with data set variable 7, plotting the overall accuracy: $!EXTENDEDCOMMAND COMMANDPROCESSORID = CFDAnalyzer3 COMMAND = ‘CALCULATEACCURACY ZONES=[3-5] DATASETVAR=7 PLOTOVERALLACCURACY=TRUE’ DISPLAYBOUNDARIES Syntax: $!EXTENDEDCOMMAND COMMANDPROCESSORID = ‘CFDAnalyzer3’ COMMAND = ‘DISPLAYBOUNDARIES [optional parameters] [RAWDATA <boundaryrawdata>]’ Description:Displays boundaries corresponding to a geometry and boundaries specification without actually setting the geometry and boundaries. This macro is generally not useful for those writing macro files, but is recorded when the user clicks the Display Boundaries button in the Geometry and Boundaries dialog in order to duplicate the actions of Tecplot 360 that happen in response to that action. See Section “SETGEOMETRYANDBOUNDARIES” on page 232 for a description of the parameters for this macro. EXTRACTFLOWFEATURE Syntax: $!EXTENDEDCOMMAND COMMANDPROCESSORID = CFDAnalyzer3 COMMAND = ‘EXTRACTFLOWFEATURE [optional parameters]’ Description:Extract and display shock surfaces, vortex cores, or separation and attachment lines. Shock surfaces are displayed as iso-surfaces of a new variable, ShockSurface, while vortex cores and separation and attachment lines are displayed as new zones. 226 Macro Command Description Optional Parameters: Parameter Syntax Feature = <flowfeature> VCOREMETHOD = <vcoremethod> EXCLUDEBLANKED = <boolean> Default SHOCKSURFACE S EIGENMODES FALSE Notes Can be SHOCKSURFACES, VORTEXCORES, or SEPATTACHLINES. The vortex core extraction method. Can be VORTICITY or EIGENMODES. If TRUE, vortex cores and separation/attachment lines will not be calculated in blanked regions. Example:Extract vortex cores using the eigenmodes method: $!EXTENDEDCOMMAND COMMANDPROCESSORID = CFDAnalyzer3 COMMAND = ‘EXTRACTFLOWFEATURE FEATURE = VORTEXCORES VCOREMETHOD = EIGENMODES’ EXTRAPOLATESOLUTION Syntax: $!EXTENDEDCOMMAND COMMANDPROCESSORID = CFDAnalyzer3 COMMAND = ‘EXTRAPOLATESOLUTION ZONES = <set> [MAXACCURACY = <double>]’ Description:Perform Richardson extrapolation to estimate the true solution from three input solutions on grids of successively finer resolution. Two new zones are added to the current data set. The first contains the extrapolated solution, while the second contains the estimated error. Required Parameter: Parameter ZONES Syntax Default = <set> Notes Indicates the three zones from which to perform the accuracy calculation. Optional Parameter: Parameter MAXACCURACY Syntax = <double> Default 2.0 Notes The maximum theoretical accuracy of the solver which generated the solution. Used to limit the calculated accuracy. Example:Extrapolate zones 3, 4, and 5, which were calculated with a second order accurate solver: $!EXTENDEDCOMMAND COMMANDPROCESSORID = CFDAnalyzer3 COMMAND = ‘EXTRAPOLATESOLUTION ZONES=[3-5] MAXACCURACY = 2 INTEGRATE Syntax: $!EXTENDEDCOMMAND COMMANDPROCESSORID = CFDAnalyzer3 COMMAND = ‘INTEGRATE [<set>] [optional parameters]’ Description:Perform an integration over the specified zones (or time strands, if INTEGRATEBY is set to TIMESTRANDS). If <set> is not specified, the integration will be performed over all zones (or time 227 strands). If PLOTAS is set to TRUE, the integration results will be plotted in a new frame. Optional Parameters: Syntax Default VARIABLEOPTION Parameter = <variableoption> SCALAR Notes XORIGIN = <double> 0.0 For VARIABLEOPTION = FORCESANDMOMENTS, indicates the origin X-location for moment calculations. YORIGIN = <double> 0.0 For VARIABLEOPTION = FORCESANDMOMENTS, indicates the origin Y-location for moment calculations. ZORIGIN = <double> 0.0 For VARIABLEOPTION = FORCESANDMOMENTS, indicates the origin Z-location for moment calculations. SCALARVAR = <integer> 1 For when VARIABLEOPTION = AVERAGE, MASSWEIGHTEDAVERAGE, WEIGHTEDAVERAGE, MASSFLOWWEIGHTEDAVERAGE, or VECTORAVERAGE. Indicates which variable’s average will be calculated. ABSOLUTE = <boolean> FALSE If TRUE, the absolute value of cell volumes will be used for integration. EXCLUDEBLANKED XVARIABLE = <boolean> If TRUE, integration will only include non-blanked regions. = <integer> FALSE 0 YVARIABLE = <integer> 0 Only required for vector integrations. Indicates the Ycomponent of the vector variable to be integrated. ZVARIABLE = <integer> 0 Only required for vector integrations. Indicates the Zcomponent of the vector variable to be integrated. INTEGRATEBY = <integratebyopti on> ZONES Indicates whether the integration is performed by zones or by time strands. INTEGRATEOVER = <integrateovero ption> CELLS Specifies cell volumes, planes, or lines. Data set position of the scalar variable or X-component of the vector variable to be integrated. IRANGE { MIN = <integer> 1 MAX = <integer> SKIP = <integer> 0 1 = <integer> 1 = <integer> 0 1 } JRANGE { MIN MAX SKIP } KRANGE { MIN MAX SKIP } PLOTRESULTS PLOTAS = <integer> = <integer> 1 = <integer> = <integer> 0 1 = <boolean> FALSE Indicated whether the results of the integration will be plotted in a Tecplot 360 frame. Results The variable name used to plot integration results. If it contains spaces, surround it with quotes preceded by a backslash (\’). Ignored for forces and moments. = <string> Range Parameters: The I-range, J-range and K-range parameters are used to limit the data altered by the equation. The specification of range indices follow the rules below. 228 Macro Command Description • All indices start with one and go to some maximum index m. • Zero can be used to represent the maximum index m; specifying zero tells the command to go to the very last position of the range, that is, the maximum index value m. If the maximum index m = 15, specifying zero sets the range index to 15. • Negative values represent the offset from the maximum index. If a value of -2 is specified, and the maximum index m is 14, the value used is 14–2, or 12. You can access your integration results in macros through a variety of specific environment variables. For a list of the variables and how to access them, refer to Section 22 - 7.2 “Accessing Integration Results in Macros” in the User’s Manual Examples: Example 1: The following command calculates the mass for all zones by integrating density (variable 4) over cell volumes: $!EXTENDEDCOMMAND COMMANDPROCESSORID = CFDAnalyzer3 COMMAND = ‘INTEGRATE SCALARVAR = 4’ Example 2: Calculate the mass flux across a series of I = constant planes for zones 1, 2, and 3 and plots the results as “Mass Flux.” Since the COMMAND string is surrounded by single quotation marks (‘), the quotes surrounding the PLOTAS parameter must be preceded by a backslash to avoid a syntax error: $!EXTENDEDCOMMAND COMMANDPROCESSORID = CFDAnalyzer3 COMMAND = ‘INTEGRATE [1-3] VARIABLEOPTION = MASSFLOWRATE INTEGRATEOVER = IPLANES PLOTRESULTS = TRUE PLOTAS = \‘Mass Flux\’ ’ Example 3: Calculate the “mass-weighted average” (actually the mass flow-weighted average) of total pressure, variable 7: $!EXTENDEDCOMMAND COMMANDPROCESSORID = CFDAnalyzer3 COMMAND = ‘INTEGRATE [1-3] VARIABLEOPTION = MASSFLOWWEIGHTEDAVERAGE SCALARVAR = 7 INTEGRATEOVER = IPLANES PLOTRESULTS = TRUE PLOTAS = \‘Mass Weighted Avg Pt\’ ’ SAVEINTEGRATIONRESULTS Syntax: $!EXTENDEDCOMMAND COMMANDPROCESSORID = CFDAnalyzer3 COMMAND = ‘SAVEINTEGRATIONRESULTS FILENAME = <string>’ Description: Saves the most recently calculated integration results to a text file. 229 Required parameter: Parameter FILENAME Syntax Notes = <string> Indicates the name of the file to which to save the results. It may be a new or existing file. Example:Save the most recent integration results to file E:\users\dave\results.txt. The backslash characters (\) must be escaped with a second backslash character, and the file name is surrounded by quotes (“): $!EXTENDEDCOMMAND COMMANDPROCESSORID = CFDAnalyzer3 COMMAND = ‘SAVEINTEGRATIONRESULTS FILENAME = “E:\\users\\dave\\results.txt”’ SETFIELDVARIABLES Syntax: $!EXTENDEDCOMMAND COMMANDPROCESSORID = CFDAnalyzer3 COMMAND = ‘SETFIELDVARIABLES [optional parameters]’ Description:Identifies variables in your data, such as velocity, pressure and temperature, for use in analysis. Optional Parameters: Parameter Default Notes CONVECTIONVARSA REMOMENTUM = <boolean> Syntax TRUE Indicates whether the variables designated for Tecplot 360 vector plots are momentum variables (density * velocity). If FALSE, then the vector variables must represent velocity values. UVar = <integer> 0 Specify the variable (by number) to use for the first Vector/ Momentum variable. VVar = <integer> 0 Specify the variable (by number) to use for the second Vector/ Momentum variable. WVar = <integer> 0 Specify the variable (by number) to use for the second Vector/ Momentum variable. ID1 = <varid> NOTUSED Identification of the first data set variable from which the function will be calculated. ID2 = <varid> NOTUSED Identification of the second data set variable from which the function will be calculated. VARIABLE1 = <integer> 0 Position of the first variable in the data set. VARIABLE2 = <integer> 0 Position of the second variable in the data set. SETFLUIDPROPERTIES Syntax: $!EXTENDEDCOMMAND COMMANDPROCESSORID = CFDAnalyzer3 COMMAND = ‘SETFLUIDPROPERTIES’ [optional parameters] Description:Set the fluid properties for use by other commands. 230 Macro Command Description Optional Parameters: Parameter Syntax Default INCOMPRESSIBLE DENSITY = <boolean> = <double> FALSE 1.0 SPECIFICHEAT = <double> 2.5 USESPECIFICHEAT = <boolean> VAR SPECIFICHEATVAR = <integer> 1 GASCONSTANT = <double> 1.0 USEGASCONSTANTV AR GASCONSTANTVAR = <boolean> FALSE = <integer> 1 GAMMA = <double> 1.4 USEGAMMAVAR GAMMAVAR = <boolean> FALSE 1 VISCOSITY USEVISCOSITYVAR VISCOSITYVAR = <double> CONDUCTIVITY USECONDUCTIVITY = <double> = <integer> FALSE Notes If TRUE, indicates an incompressible fluid. For INCOMPRESSIBLE = TRUE, indicates the density of the fluid. For INCOMPRESSIBLE = TRUE. The value of the fluid’s specific heat. For INCOMPRESSIBLE = TRUE. For INCOMPRESSIBLE = TRUE and USESPECIFICHEATVAR = TRUE. The data set variable that holds the fluid’s specific heat. For INCOMPRESSIBLE = FALSE. The value of the fluid’s specific gas constant. For INCOMPRESSIBLE = FALSE. For INCOMPRESSIBLE = FALSE and USEGASCONSTANTVAR = TRUE. The data set variable which holds the fluid’s specific gas constant. For INCOMPRESSIBLE = FALSE. The value of the fluid’s ratio of specific heats. Must be between 1 and 5/3. For INCOMPRESSIBLE = FALSE. For INCOMPRESSIBLE = FALSE and USEGAMMAVAR = TRUE. The data set variable that holds the fluid’s ratio of specific heats. VAR CONDUCTIVITYVAR = <boolean> = <integer> 1.0 FALSE 1 = <boolean> 1.0 FALSE = <integer> 1 The value of the fluid’s dynamic viscosity. For USEVISCOSITYVAR = TRUE. The data set variable which holds the fluid’s dynamic viscosity. The value of the fluid’s conductivity. For USECONDUCTIVITYVAR = TRUE. The data set variable which holds the fluid’s conductivity. Example 1:Set the fluid properties to standard air values in meters/kilograms/seconds units: $!EXTENDEDCOMMAND COMMANDPROCESSORID = CFDAnalyzer3 COMMAND = ‘SETFLUIDPROPERTIES GASCONSTANT=287 VISCOSITY=17.8E-6’ CONDUCTIVITY=2.48E-2 Example 2:Set the fluid properties to incompressible with density equal to 1.0 (the default) and specific heat, viscosity and conductivity taken from data set variables 5, 6, and 7: $!EXTENDEDCOMMAND COMMANDPROCESSORID = CFDAnalyzer3 COMMAND = ‘SETFLUIDPROPERTIES INCOMPRESSIBLE=TRUE SPECIFICHEATOPTION=DATASETVAR SPECIFICHEATVAR=5 VISCOSITYOPTION=DATASETVAR VISCOSITYVAR=6’ CONDUCTIVITYOPTION=DATASETVAR CONDUCTIVITYVAR=7 231 SETGEOMETRYANDBOUNDARIES Syntax: $!EXTENDEDCOMMAND COMMANDPROCESSORID = ‘CFDAnalyzer3’ COMMAND = ‘SETGEOMETRYANDBOUNDARIES [optional parameters]’ [RAWDATA <boundaryrawdata>] Description:Specify whether the data represent an axisymmetric flow solution (2D Cartesian plots only), whether adjacent zones should be considered to be connected at coincident faces, and specify zone boundaries and their corresponding boundary conditions. Each line of the RAWDATA describes one boundary, and appears in the same format as on the Geometry and Boundaries dialog. For all boundaries, list the boundary condition and the set of zones, separated by a comma. The index range-type boundary follows this with the boundary face, the first starting index, the first ending index, the second starting index and the second ending index. All entries are separated by commas. The boundary condition is one of INFLOW, OUTFLOW, WALL, SLIPWALL, SYMMETRY, EXTRAPOLATED. The boundary face is one of I=1, I=IMAX, J=1, J=JMAX, K=1, and K=KMAX. Refer to Section 22 - 4 “Setting Geometry and Boundary Options” in the User’s Manual for more information on boundaries. Optional Parameters: Parameter Syntax Default FALSE Notes AXISYMMETRIC = <boolean> SYMMETRYVAR = <XorY> SYMMETRYVALUE = <double> 0.0 CONNECTZONES = <boolean> TRUE NODETOLERANCE = <double> 1.0E-6 Indicates how close two nodes must be before they will be considered coincident for the purpose of matching zone faces. DEFAULTBC = <string> EXTRAPOLATED Indicates the boundary condition that will be applied to all zone boundary faces not connected to adjacent zones or covered by zone boundaries defined by the RAWDATA section. Y Can only be TRUE if the current plot type is 2D Cartesian. If TRUE, indicates that the data represents an axisymmetric solution. For AXISYMMETRIC = TRUE. Can be X or Y. Indicates which axis variable is constant along the axis of symmetry. For AXISYMMETRIC = TRUE. Indicates the value of the SYMMETRYVAR along the axis of symmetry. If TRUE, indicates that adjacent zones should be connected where boundary faces coincide. Example:Specify that the solution data represents an axisymmetric solution about X = 1. Do not allow adjacent zones to be connected. Identify two zone-type boundaries and one zone, face and index-range-type boundary: $!EXTENDEDCOMMAND COMMANDPROCESSORID = ‘CFDAnalyzer3’ COMMAND = ‘SETGEOMETRYANDBOUNDARIES AXISYMMETRIC = TRUE SYMMETRYVAR = X SYMMETRYVALUE = 1 CONNECTZONES = FALSE’ RAWDATA WALL,[2-3] INFLOW,[4] OUTFLOW,[1],I=IMAX,1,10,1,20 SETREFERENCEVALUES Syntax: 232 $!EXTENDEDCOMMAND COMMANDPROCESSORID = CFDAnalyzer3 Macro Command Description COMMAND = ‘SETREFERENCEVALUES [optional parameters]’ Description:Specify the reference (free-stream) properties of the solution, identify two variables in the current data set for use with other commands. Optional Parameters: Default Notes RVELOCITY1ID Parameter = <string> Syntax MACHNUMBER Identification of the first free-stream velocity component. May be UVELOCITY or MACHNUMBER. RVELOCITY1 RVELOCITY2ID = <double> = <string> 0.0 ANGLEOFATTAC K RVELOCITY2 = <double> 0.0 RTHERMO1ID = <string> DENSITY RTHERMO1 RTHERMO2ID = <double> = <string> 1.0 SPEEDOFSOUND RTHERMO2 = <double> 1.0 The value of the first free-stream velocity component. Identification of the second free-stream velocity component. May be VVELOCITY or ANGLEOFATTACK. The value of the second free-stream velocity component. NOTE: RVELOCITY1 must be defined before using RVELOCITY2. Identification of the first free-stream thermodynamic variable. May be PRESSURE or DENSITY. The value of the first free-stream thermodynamic variable. Identification of the second free-stream thermodynamic variable. May be TEMPERATURE or SPEEDOFSOUND. The value of the second free-stream thermodynamic variable. SETUNSTEADYFLOWOPTIONS Syntax: $!EXTENDEDCOMMAND COMMANDPROCESSORID = ‘CFDANALYZER3’ COMMAND = ‘SETUNSTEADYFLOWOPTIONS [SteadyState=<boolean>] [RAWDATA <timelevelrawdata>]’ Description: Identifies time levels for unsteady flow, or specifies that the solution is steady-state. If the flow is unsteady, the solution time levels are specified in the RAWDATA section. The first line of the RAWDATA section must consist of a single integer indicating the number of solution time levels. This must be followed by the time levels themselves. Each time level must be on a separate line and must consist of a floating-point number (the solution time), as well as one or more integers (the zone numbers for that solution time). Optional Parameters: Parameter STEADYSTATE Syntax Default = <boolean> TRUE Notes If TRUE, indicates that the solution is steady-state, and the RAWDATA, if any, is ignored. If FALSE, indicates that the solution is unsteady, with time levels identified in the RAWDATA section. Example:The unsteady solution contains three solution time levels of two zones each, representing solution times 0.5, 1.0 and 1.5: $!EXTENDEDCOMMAND COMMANDPROCESSORID = CFDAnalyzer3 COMMAND = ‘SETUNSTEADYFLOWOPTIONS STEADYSTATE = FALSE’ RAWDATA 233 3 .5 1 2 1.0 3 4 1.5 5 6 10 - 3 Parameter Assignment Values Parameter assignments referenced in the previous section using single angle brackets (<>) not defined in the 12, are defined here. Note that case is not important. Value Identifier <coeffsoption> <functionname> <gravitydirection> <integratebyoption> <integrateoveroption> <normalizationoption> <particlefunction> <releaseoption> <specifyoption> <storeoption> <terminationoption> <turbulencefunction> <variableoption> <varid> <XorY> 234 Allowable Values GENERAL, DETAILED IASPECTRATIO, JASPECTRATIO, KASPECTRATIO, ISTRETCHRATIO, JSTRETCHRATIO, KSTRETCHRATIO, IFACESKEWNESS, JFACESKEWNESS, KFACESKEWNESS, CELLDIAGONAL1SKEWNESS, CELLDIAGONAL2SKEWNESS, IJNORMALSSKEWNESS, JKNORMALSSKEWNESS, KINORMALSSKEWNESS, MAXNORMALSSKEWNESS, IORTHOGONALITY, JORTHOGONALITY, KORTHOGONALITY, MINORTHOGONALITY, INONPLANARITY, JNONPLANARITY, KNONPLANARITY, MINNOPLANARITY, JACOBIAN, CELLVOLUME, GRIDIUNITNORMAL, GRIDJUNITNORMAL, GRIDKUNITNORMAL, DENSITY, STAGDENSITY, PRESSURE, STAGPRESSURE, PRESSURECOEF, STAGPRESSURECOEF, PITOTPRESSURE, PITOTPRESSURERATIO, DYNAMICPRESSURE, TEMPERATURE, STAGTEMPERATURE, ENTHALPY, STAGENTHALPY, INTERNALENERGY, STAGENERGY, STAGENERGYPERUNITVOL, KINETICENERGY, UVELOCITY, VVELOCITY, WVELOCITY, VELOCITYMAG, MACHNUMBER, SPEEDOFSOUND, CROSSFLOWVELOCITY, EQUIVALENTPOTENTIALVELRAT, XMOMENTUM, YMOMENTUM, ZMOMENTUM, ENTROPY, ENTROPYMEASURES1, XVORTICITY, YVORTICITY, ZVORTICITY, VORTICITYMAG, SWIRL, VELOCITYCROSSVORTICITYMAG, HELICITY, RELATIVEHELICITY, FILTEREDRELATIVEHELICITY, SHOCK, FILTEREDSHOCK, PRESSUREGRADIENTMAG, DENSITYGRADIENTMAG, XDENSITYGRADIENT, YDENSITYGRADIENT, ZDENSITYGRADIENT, SHADOWGRAPH, DIVERGENCEOFVELOCITY, SUTHERLANDSLAW, ISENTROPICDENSRAT, ISENTROPICPRESRAT, ISENTROPICTEMPRAT, VELOCITY, VORTICITY, MOMENTUM, PERTURBATIONVELOCITY, VELOCITYCROSSVORTICITY, PRESSUREGRADIENT, DENSITYGRADIENT, VELOCITYGRADIENT MINUSX, MINUSY, MINUSZ, PLUSX, PLUSY, PLUSZ ZONES, TIMESTRANDS CELLS, IPLANES, JPLANES, KPLANES, ILINES, JLINES, KLINES NONE, MAXIMUMMAGNITUDE, REFERENCEVALUES PARTICLEPATH, STREAKLINE TIMELEVEL, UNITTIME SPECIFY, CALCULATE PARTICLEVALUES, FLUIDVALUES TEMPERATURE, ABLATE ENERGY, DISSIPATIONRATE, DYNAMICVISCOSITY, FREQUENCY, VISCOSITY LENGTHAREAVOLUME, SCALAR, AVERAGE, MASSWEIGHTEDSCALAR, MASSWEIGHTEDAVERAGE, WEIGHTEDAVERAGE, SCALARFLOWRATE, MASSFLOWRATE, MASSWEIGHTEDFLOWRATE, MASSFLOWWEIGHTEDAVERAGE, FORCESANDMOMENTS, VECTORDOTNORMAL, VECTORAVERAGE, VECTORDOTTANGENTIAL PRESSURE, TEMPERATURE, DENSITY, STAGNATIONENERGY, MACHNUMBER, NOTUSED X, Y 11 Parameter Subcommands This chapter details secondary or common macro parameter subcommands in Tecplot 360. These subcommands provide a means to access the lower level variables of commands defined in the previous chapter of this manual. Each subcommand can expand to contain one or more parameters or subcommands. All parameters within a subcommand are optional. Items within single angle brackets (< >) are defined in 12. <<anchorpos>> Description:Assign attributes for positioning of objects. Expands to: Parameter Syntax Default Notes { X Y Z THETA R = = = = = <double> Sets X-value (and THETA-value) <double> Sets Y-value (and R-value) <double> Sets Z-value <double> Sets THETA-value (and X-value) <double> Sets R-value (and Y-value) } Example: Make a square geometry and place it at a certain XY location: $!ATTACHGEOM GEOMTYPE = SQUARE POSITIONCOORDSYS = FRAME ANCHORPOS { X = 2.89124668435 235 Y = 88.7359084881 } RAWDATA 5.23430593312 <<areastyle>> Description:Change settings for the axis grid area. Expands to: Parameter Syntax Default Notes { DRAWGRIDLAST = <boolean> DRAWBORDER = <boolean> LINETHICKNESS <op> <dexp> COLOR = <color> ISFILLED = <boolean> FILLCOLOR = <color> USELIGHTSOURCETO FIL = <boolean> Not available in 3D frame mode. Only available for 3D frame mode. } Example:Turn on the grid area border for a 2D plot and change the line thickness to be 2 percent: $!TWODAXIS AREASTYLE { DRAWBORDER = YES LINETHICKNESS = 2 } <<axisdetail>> Description:Assign attributes for axes. 236 Expands to: Parameter Syntax Default Notes { SHOWAXIS AUTOGRID ISREVERSED GRANCHOR GRSPACING RANGEMIN RANGEMAX COORDSCALE CLIPDATA VALUEATORIGIN VARNUM = = = = = = = = = = = <boolean> <boolean> <boolean> <double> <double> <double> <double> <coordscale> <double> <integer> TITLE <<ticklabeldetail> > <<gridlinedetail> > <<gridlinedetail> > <<gridlinedetail> > <<ticklabeldetail> > <<axistitle>> AXISLINE <<axisline>> TICKLABEL GRIDLINES MINORGRIDLINES MARKERGRIDLINE TICKS XY and Polar Line plots only. <boolean> Available for 2D and 3D plot types only. Refer to “$!LINEMAP” on page 157 for information on referencing variable number for XY and Polar Line plots. } Example:Turn on the axis line, reverse the axis direction, and set the range to go from 0.5 to 1.5 for the X-axis in a 2D plot: $!TWODAXIS SHOWAXISLINE = TRUE XDETAIL { ISREVERSED = TRUE RANGEMIN = 0.5 RANGEMAX = 1.5 } <<axisline>> Description:Assign attributes for axis lines. 237 Expands to: Parameter Syntax Default Notes { SHOW = <boolean> SHOWBOTHDIRECTIONS = <boolean> FALSE Non-3D only. SHOWPERPENDICULAR = <boolean> FALSE Non-3D only. SHOWOPPOSITEEDGE = <boolean> FALSE 3D only COLOR = <color> LINETHICKNESS ALIGNMENT = <double> <axisalignment> OPPOSINGAXISVALUE = <double> POSITION = <double> ANGLE = <double> OFFSET = <double> EDGE = <integer> } Example:Change the thickness of the Theta-axis line to 0.8 and the color to red.: $!POLARAXIS THETADETAIL{AXISLINE{COLOR = RED}} $!POLARAXIS THETADETAIL{AXISLINE{LINETHICKNESS = 0.8}} <<axistitle>> Description:Assign attributes for titles. Expands to: Parameter Syntax Default Notes { SHOWONAXISLINE = <boolean> TRUE SHOWONGRIDBORDERMIN = <boolean> FALSE Non-3D only. SHOWONGRIDBORDERMAX = <boolean> FALSE Non-3D only. SHOWONOPPOSITEEDGE = <boolean> FALSE 3D only. SHOWONALLAXES = <boolean> TRUE Polar R only. SHOWONVIEWPORTTOP = <boolean> TRUE Polar only. SHOWONVIEWPORTBOTTOM = <boolean> TRUE Polar only. SHOWONVIEWPORTLEFT = <boolean> TRUE Polar only. SHOWONVIEWPORTRIGHT = <boolean> TRUE Polar only. TITLEMODE = <axistitlemode> TEXT = <string> COLOR TEXTSHAPE = <color> <<textshape>> OFFSET = <double> PERCENTALONGLINE = <double> 50% } Example:Create a R-axis title, saying “Harmonic Motion” in red, times, size 6 font.: $!POLARAXIS RDETAIL{TITLE{TEXT = ’Harmonic Motion’}} $!POLARAXIS RDETAIL{TITLE{OFFSET = -4}} $!POLARAXIS RDETAIL{TITLE{COLOR = RED}} 238 $!POLARAXIS $!POLARAXIS $!POLARAXIS $!POLARAXIS RDETAIL{TITLE{TEXTSHAPE{FONTFAMILY = “Times”}}} RDETAIL{TITLE{TEXTSHAPE{ISBOLD = NO}}} RDETAIL{TITLE{TEXTSHAPE{ISITALIC = NO}}} RDETAIL{TITLE{TEXTSHAPE{HEIGHT = 6}}} <<basiccolorcontrol>> Description:Assign name to a basic color . Expands to: Parameter Syntax Default Notes { NAME = <string> ‘’ May include dynamic text variables SHOW = <boolean> YES Controls visibility of the basic color in a basic color legend. } Example:Change the medium line pattern length for drop-down menus in the interface to be five percent: $!BASICSIZE LINEPATLENGTHS { MEDIUM = 5 } <<basicsizelist>> Description:Assign basic sizes. The units for the values assigned here are dependent on the parent command. Assignments here do not affect the plot. These assignments are used only to configure drop-down menus in the interface so the user can make quick selections. Expands to: Parameter Syntax Default Notes { TINY <op> <dexp> SMALL <op> <dexp> MEDIUM <op> <dexp> LARGE <op> <dexp> HUGE <op> <dexp> } Example:Change the medium line pattern length for drop-down menus in the interface to be five percent: $!BASICSIZE LINEPATLENGTHS { MEDIUM = 5 } 239 <<colormapcontrolpoints>> Description:All contour color maps except the Raw user-defined color map make use of control points to determine the color distribution. Each control point has a position and a left and right color. The <<colormapcontrolpoints>> subcommand can contain more than one CONTROLPOINT subcommand. Expands to: Parameter Syntax Default Notes { CONTROLPOINT <integer> Use <integer> to specify which control point to modify. COLORMAPFRACTION <op> <dexp> Positions the control point; 0 sets the position to the lowest index and 1 to the highest index in the color map. LEADRGB <<rgb>> TRAILRGB <<rgb>> { } } Example:Change the lead RGB values for control point 2 in the small rainbow color map to be 100, 0, 0: $!COLORMAP SMRAINBOW { CONTROLPOINT 2 { LEADRGB { R = 100 G = 0 B = 0 } } } <<colormapoverride>> Description:Change settings for a color map override. Color map overrides are used to replace a specific band in a contour color map with one of the 16 basic colors. 240 Expands to: Parameter Syntax Default Notes { INCLUDE = <boolean> COLOR = <color> STARTLEVEL <op> <integer> ENDLEVEL <op> <integer> } Example:Set the color used between contour level number 1 to number 3 to be purple. Use color map override number 3: $!GLOBALCONTOUR COLORMAPFILTER { COLORMAPOVERRIDEACTIVE = YES COLORMAPOVERRIDE 3 { INCLUDE = YES COLOR = PURPLE STARTLEVEL = 1 ENDLEVEL = 3 } } <<continuouscolor>> Description:Change settings for continuous color. Expands to: Parameter Syntax CMIN = <double> CMAX = <double> Default Notes Example:Set the continuous color. $!GLOBALCONTOUR VAR = 4 $!FIELDLAYERS SHOWCONTOUR = YES $!GLOBALCONTOUR COLORMAPFILTER {COLORMAPDISTRIBUTION = CONTINUOUS} $!GLOBALCONTOUR COLORMAPFILTER { CONTINUOUSCOLOR { CMIN = 0.5 CMAX = 2 } } 241 <<dialogplacement>> Description:Describes the placement for a dialog. Expands to: Parameter Syntax Default Notes ANCHORALIGNMENT = <anchoralignme nt> ANCHORHORIZONTAL INSIDE = <boolean> ANCHORVERTICALIN SIDE = <boolean> MINVISIBILITYPER CENTAGE = <integer> The MINVISIBILITYPERCENTAGE specifies the minimum percentage of the dialog, between 1 and 100, that must be visible within the desktop. This prevents a dialog from being placed outside of the visible desktop. Note that not all window managers allow dialogs to be placed so that the portions of the dialog are not visible and in effect enforce a value of 100. IOFFSET = <integer> JOFFSET = <integer> IOFFSET and JOFFSET are in pixels. They may be negative, but will be truncated to the bounding rectangle of the Tecplot 360 main window. POSITIONATANCHOR = <positionatanch or> { ANCHORHORIZONTALINSIDE and ANCHORVERTICALINSIDE control how the dialog window is anchored in both the horizontal and vertical directions relative to the Tecplot 360 main window. POSITIONATANCHOR specifies when to place it at the anchor, NEVER, ONCE (initial launch), or ALWAYS. } Example:Set the position of the Colormap dialog to always launch 10 pixels from Tecplot 360’s bottom-right corner: $!INTERFACE DIALOGPLACEMENT { COLORMAPDIALOG { ANCHORALIGNMENT = BOTTOMRIGHT IOFFSET = 100 JOFFSET = 100 POSITIONATANCHOR = ALWAYS } } <<gridarea>> Description:Change settings for the axis grid area. 242 Expands to: Parameter Syntax Default Notes { DRAWBORDER = <boolean> LINETHICKNESS <op> <dexp> COLOR = <color> ISFILLED = <boolean> FILLCOLOR = <color> USELIGHTSOURCETO FILL = <boolean> LABELSALLSIDES = <boolean> TICKSALLSIDES = <boolean> EXTENTS <<rect>> Not available in 3D. Not available for 3D or Polar Line. Only available for 3D. Not available in 3D. } Example:Turn on the grid area border for a 2D plot and change the line thickness to be 2 percent: $!TWODAXIS GRIDAREA { DRAWBORDER = YES LINETHICKNESS = 2 } <<gridlinedetail>> Description:Change settings for axis gridlines. Expands to: Parameter Syntax Default Notes { COLOR = <color> SHOW = <boolean> LINEPATTERN = <linepattern> PATTERNLENGTH <op> <dexp> LINETHICKNESS <op> <dexp> CUTOFF = <double> Theta only. DRAWGRIDLAST = <boolean> Drawing last places the grid at the front of the plot; drawing first places it in the back POSITIONMARKERBY = <markerpos> Marker gridline only CONSTANTVALUE = <double> Marker gridline only; valid only when POSITIONMARKERBY is CONSTANT } Example:Set the line pattern for minor gridlines for the X-axis in a 3D plot to be dashed: $!THREEDAXIS XDETAIL { MINORGRIDLINES { LINEPATTERN = DASHED 243 } } <<ijk>> Description:Set an I-, J-, or K-index. Expands to: Parameter Syntax Default Notes { I <op> <integer> J <op> <integer> K <op> <integer> } Example:Set the I- and J-index skip for vectors to 2 for all zones: $!FIELDMAP VECTOR { IJKSKIP { I = 2 J = 2 } } <<indexrange>> Description:Set an index range. Expands to: Parameter Syntax Default Notes { MIN <op> <integer> MAX <op> <integer> SKIP <op> <integer> } Example:Change the plot so the data set shows I-planes 3, 5, and 7 for zones 1 to 3: $!FIELDMAP [1-3] SURFACES { SURFACESTOPLOT = IPLANES IRANGE { MIN = 3 MAX = 7 SKIP = 2 244 } } <<numberformat>> Description:Set the format used to draw a number. Expands to: Parameter Syntax Default Notes { FORMATTING = <valueformat> CUSTOMLABEL = <integer> DYNAMICLABELNAME = <string> PRECISION <op> <integer> SHOWDECIMALSONWH OLENUMBERS = <boolean> FALSE = <boolean> FALSE SHOWNEGATIVESIGN = <boolean> TRUE POSITIVEPREFIX = <string> POSITIVESUFFIX = <string> NEGATIVEPREFIX = <string> NEGATIVESUFFIX = <string> TIMEDATEFORMAT = <string> ZEROPREFIX = <string> ZEROSUFFIX = <string> REMOVELEADING ZEROS Name of the dynamic label generator to use when “Formatting” is set to “DynamicLabel” } Example:Set the number format for axis labels on the X-axis in a 2D field plot to use the “float” format with a precision of 3, and add the phrase “DAYS WITHOUT RAIN” after every positive value: $!TWODAXIS XDETAIL { TICKLABEL { NUMFORMAT { FORMATTING = FIXEDFLOAT PRECISION = 3 POSITIVESUFFIX = “DAYS WITHOUT RAIN” } } } Example: Set the number format for axis labels on the X-axis in a 2D field plot to use the Time/Date format. Add the time and date in format 245 <<papersize>> Description:Change dimensions or hardclip offsets for LETTER, DOUBLE, A3, A4, CUSTOM1 and CUSTOM2 paper sizes. Expands to: Parameter Syntax Default { Notes All values are in inches. WIDTH <op> <dexp> HEIGHT <op> <dexp> LEFTHARDCLIPOFFSET <op> <dexp> RIGHTHARDCLIPOFFSET <op> <dexp> TOPHARDCLIPOFFSET <op> <dexp> BOTTOMHARDCLIPOFFSET <op> <dexp> } Example:Change the left hardclip offset for LETTER size paper to be 0.25 inches: $!PAGE PAPERSIZEINFO { LETTER { LEFTHARDCLIPOFFSET = 0.25 } } <<precisegrid>> Description:Change settings for the precise dot grid. Expands to: Parameter Syntax Default Notes { INCLUDE = <boolean> COLOR = <color> SIZE = <double> Size is in centimeters. } Example:Turn on the precise dot grid in an XY-plot: $!XYAXIS PRECISEGRID { INCLUDE = YES } <<rect>> Description:Change settings for a rectangle. The rectangle is defined using two points (X1,Y1) and (X2,Y2). 246 Expands to: Parameter Syntax Default { Notes Units are based on the parent command. X1 <op> <dexp> Y1 <op> <dexp> X2 <op> <dexp> Y2 <op> <dexp> } Example:Set the 2D axis grid area to be positioned 10 percent from all edges of the frame: $!TWODAXIS AREASTYLE { EXTENTS { X1 = 10 Y1 = 10 X2 = 90 Y2 = 90 } } <<refscatsymbol>> Description:Set the attributes for the reference scatter symbol. Expands to: Parameter Syntax Default Notes { SHOW = <boolean> COLOR = <color> LINETHICKNESS = <dexp> ISFILLED = <boolean> FILLCOLOR = <color> MAGNITUDE XYPOS = <dexp> <<xyz>> SYMBOLSHAPE <<symbolshape>> } Example:Change the fill color of the reference scatter symbol to be green: $!GLOBALSCATTER REFSCATSYMBOL { FILLCOLOR = GREEN } 247 <<renderconfig>> Description:Set the attributes for OpenGL rendering. Expands to: Parameter Syntax Default Notes { POLYGONOFFSET EXTBIASFACTOR = <double> STIPPLEALLLINES = <stipplemode> If thin patterned lines are not drawn correctly, set STIPPLEALLLINES to ALL. DEPTHBUFFERSIZE = <integer> For low memory graphics cards, the depth buffer size may need to be reduced. MINBITSPERRGB PLANE = <integer> Specify the minimum number of bits used for each of the planes in the image buffer. DOEXTRADRAWFOR LASTPIXEL = <boolean> Sometimes the last pixel for stroked font characters is not drawn If so, turn DOEXTRADRAWFORLASTPIXEL on. MAXMULTISAMPLES = <integer> Sets the number of multisamples used for antialising. Default: 4 for screen, 0 for offscreen. MAXSTRIPLENGTH = <integer> Some graphics cards have problems with long strips. Use MAXSTRIPLENGTH to reduce the strip length. MAXPRIMATIVESPER BLOCK = <integer> Some graphics cards have problems with large numbers of graphics primitives in a single block. Use MAXPRIMATIVESPERBLOCK to reduce the number of primitives delivered to the graphics hardware in a single block. CONSTANTLYUSE SCISSORING = <boolean> Turn ConstantlyUseScissoring on if you see lines extending outside the borders of the frame. There is a slight performance penalty when using this option. USEQUADSTRIPS = <boolean> If some shaded or contour flooded quads or triangles do not appear or are black, try turning this off. USETRIANGLE STRIPS = <boolean> As with USEQUADSTRIPS, try turning off USEQUADSTRIPS before turning USETRIANGLESTIPS off. Turning off both options will result in reduced performance, but may help fix errors caused by buggy graphics card drivers. TRIANGULATE FILLEDPOLYGONS = <boolean> As with USEQUADSTRIPS, try turning on TRIANGULATEFILLEDPOLYGONS if you are still experiencing problems even after turning off USETRIANGLESTRIPS and USEQUADSTRIPS. USEGLCOLOR MATERIALFUNCTION = <boolean> Some graphics cards have problems with an OpenGL’s glColorMaterial function. Higher performance (especially for continuous contour flooded plots) can be achieved when it is used. However, it may need to be turned off if you are experiencing problems. MAXTEXTURESIZE = <integer> FORCESMOOTHSHADI NGFORLIGHTING = <boolean> ADJUSTRECTANGLE RIGHTANDBOTTOM = <boolean> } Example:Force all line drawing to include the last point in the line. Also, make the size of the depth buffer to be at least 32 bits. $!INTERFACE OPENGLCONFIG { SCREENRENDERING { DOEXTRADRAWFORLASTPIXEL = TRUE DEPTHBUFFERSIZE = 32 248 } } <<rgb>> Description:Set a color value by assigning values to its red, green, and blue components. Expands to: Parameter Syntax Default Notes { R <op> <integer> G <op> <integer> B <op> <integer> } Example:Change the CUSTOM3 basic color to be light green: $!BASICCOLOR CUSTOM 3 { R = 80 G = 255 B = 80 } <<shademap>> Description:Map colors on the screen to shades of gray for monochrome hardcopy output. 249 Expands to: Parameter Syntax { Default Notes Shade values can range from 0 (black) to 100 (white). BLACKSHADE = <dexp> REDSHADE = <dexp> GREENSHADE = <dexp> BLUESHADE = <dexp> CYANSHADE = <dexp> YELLOWSHADE = <dexp> PURPLESHADE = <dexp> WHITESHADE = <dexp> CUSTOM1SHADE = <dexp> CUSTOM2SHADE = <dexp> CUSTOM3SHADE = <dexp> CUSTOM4SHADE = <dexp> CUSTOM5SHADE = <dexp> CUSTOM6SHADE = <dexp> CUSTOM7SHADE = <dexp> CUSTOM8SHADE = <dexp> } Example:Make blue flooded regions map to 50 percent gray: $!PRINTSETUP MONOFLOODMAP { BLUESHADE = 50 } <<symbolshape>> Description:Set a symbol shape. Symbols can be a geometric shape (circle, square, and so forth) or an ASCII character. 250 Expands to: Parameter Syntax Default Notes { ISASCII = <boolean> ASCIISHAPE { USEBASEFONT = <boolean> FONTOVERRIDE = <font> ASCIICHAR = <string> } GEOMSHAPE = <geomshape> } Example:Change the symbol shape for symbols drawn with line map 3 to use circles: $!LINEMAP[3] SYMBOLS { SYMBOLSHAPE { ISASCII = FALSE GEOMSHAPE = CIRCLE } } <<textbox>> Description:Change settings for the optional box around a text label. Expands to: Parameter Syntax Default Notes { BOXTYPE = <textboxtype> MARGIN <op> <dexp> LINETHICKNESS <op> <dexp> COLOR = <color> FILLCOLOR = <color> } Example:See example for <<textbox>> is incorporated in the example for <<textshape>>. <<textshape>> Description:Change settings related to text font and character height. 251 Expands to: Parameter Syntax Default Notes { FONTFAMILY = <string> ISBOLD = <boolean> ISITALIC = <boolean> SIZEUNITS = <sizeunits> HEIGHT <op> <dexp> } Example:Add a text label in the center of the frame using Times Roman font. Make the text height 12 point. Include a box around the text with a line thickness of one percent: $!ATTACHTEXT XYPOS { X = 50 Y = 50 } TEXTSHAPE { FONTMFFAMILY = “Times” ISBOLD = NO ISITALIC = NO } BOX { BOXTYPE = HOLLOW LINETHICKNESS = 1 } TEXT = ’Hi Mom’ <<ticklabeldetail>> Description:Change settings for the text used to label axis tick marks. 252 Expands to: Parameter Syntax Default Notes { SHOWONAXISLINE = <boolean> TRUE SHOWONGRIDBORDERMIN = <boolean> FALSE SHOWONGRIDBORDERMAX = <boolean> FALSE Non-3D only. SHOWONOPPOSITEEDGE = <boolean> FALSE 3D only. SHOWONALLAXES = <boolean> TRUE Polar R only. SHOWATAXISINTER SECTION = <boolean> SKIP = <integer> ERASEBEHINDLABELS = <boolean> NUMFORMAT <<numberformat>> TEXTSHAPE <<textshape>> OFFSET <op> <dexp> LABELALIGNMENT = <labelalignment> ANGLE <op> <dexp> COLOR = <color> Non-3D only. Not allowed to change size units parameter. } Example:Change the color for X-axis tick mark labels in a 2D plot to be red: $!TWODAXIS XDETAIL { TICKLABEL { COLOR = RED } } <<tickmarkdetail>> Description:Assign attributes for axis tick marks. 253 Expands to: Parameter Syntax Default Notes { SHOWONAXISLINE = <boolean> TRUE SHOWONGRIDBORDERMIN = <boolean> FALSE Non-3D only. SHOWONGRIDBORDERMAX = <boolean> FALSE Non-3D only. SHOWONOPPOSITEEDGE = <boolean> FALSE 3D only. SHOWONALLAXES = <boolean> TRUE Polar R only. TICKDIRECTION = <tickdirection> LENGTH <op> <dexp> LINETHICKNESS <op> <dexp> NUMMINORTICKS = <integer> MINORLENGTH = <double> MINORLINETHICKNESS = <double> } Example:Set the tick mark length to 2 percent for the second Y-axis in an XY-plot: $!XYLINEAXIS YDETAIL 2 { TICKS { LENGTH = 2 SHOWONGRIDBORDERMIN = TRUE } } <<volumeobjectstoplot>> Description:Specifies what volume objects are to be displayed. Expands to: Parameter Syntax { SHOWISOSURFACES = <boolean> SHOWSLICES = <boolean> SHOWSTREAMTRACES = <boolean> } Example: $!FIELD VOLUMEMODE { VOLUMEOBJECTSTOPLOT { SHOWISOSURFACES = NO SHOWSLICES = YES SHOWSTREAMTRACES = YES } } 254 Default Notes <<xy>> Description:Change settings for an (X,Y) position. Expands to: Parameter Syntax Default Notes { X <op> <dexp> Y <op> <dexp> } Example:See the XYPOS parameter in the example for <<textshape>>. <<xyz>> Description:Change settings for an (X, Y, Z) triplet. Expands to: Parameter Syntax Default Notes { X <op> <dexp> Y <op> <dexp> Z <op> <dexp> } Example:Change the scale factor on the Z-axis to be 0.5: $!GLOBALTHREED AXISSCALEFACT { Z = 0.5 } <<zebrashade>> Description:Change zebra shading attributes. 255 Expands to: Parameter Syntax Default Notes { INCLUDE = <boolean> ISTRANSPARENT = <boolean> COLOR = <color> } Example:Turn on zebra shading and make the zebra shade color to be black: $!GLOBALCONTOUR COLORMAPFILTER { ZEBRA { INCLUDE = TRUE COLOR = BLACK } } 256 12 Parameter Assignment Values, Expressions, and Operators 12 - 1 Assignment Value Table Parameter assignments referenced in the previous chapters using single angle brackets (< >) are defined here. (Case is not important.) Value Identifier Allowable Values <altmousebuttonmode> REDRAW REVERTTOSELECT <addonstyle> V7STANDARD V7ACTIVEX <anchoralignment> TOPLEFT TOPCENTER TOPRIGHT MIDDLELEFT MIDDLECENTER MIDDLERIGHT BOTTOMLEFT BOTTOMRIGHT BOTTOMCENTER <anglespec> RADIANS DEGREES <arrowheadattachment> NONE ATBEGINNING ATEND HOLLOW ATBOTHENDS <arrowheadstyle> PLAIN FILLED <axisalignment> WITHVIEWPORT WITHSPECIFICANGLE WITHGRIDMIN WITHGRIDAREABOTTOM WITHGRIDMAX WITHGRIDAREARIGHT. WITHGRIDAREATOP WITHGRIDAREALEFT WITHOPPOSINGAXISVALUE <axismode> INDEPENDENT XYDEPENDENT XYZDEPENDENT <axistitlemode> USEVARNAME USETEXT <axistitleposition> LEFT CENTER RIGHT <backingstoremode> REALTIMEUPDATE NOTUSED PERIODICUPDATE <bitdumpregion> CURRENTFRAME ALLFRAMES WORKAREA 257 Value Identifier <boolean> Allowable Values YES NO TRUE FALSE ON OFF <borderlocation> IBORDER JBORDER KBORDER <boundarycondition> FIXED ZEROGRADIENT ZERO2ND <boxtype> NONE FILLED HOLLOW <charactersequence> One or more printable characters. <clipping> CLIPTOVIEWPORT CLIPTOFRAME <clipplane> BELOWPRIMARYSLICE ABOVEPRIMARYSLIC E NONE <color> BLACK RED GREEN BLUE CYAN YELLOW WHITE CUSTOM1 to CUSTOM56 PURPLE MULTI1 to MULTI4 <colormap> a <standardcolormap> RGBCOLOR WILD USERDEF RAWUSERDEF <colormapcontrol> COPYSTANDARD REDISTRIBUTECONTROLPOINTS RESETTOFACTORY <colormapdistribution> BANDED CONTINUOUS <compressiontype> BESTSPEED SMALLESTSIZE <conditionalexp> <dexp> <relop> <dexp> <string> <relop> <string>. <constrainintop2mode> USEVAR USECONSTANT <contourcoloring> RGB GROUP1 to GROUP4 <contourlabelaction> ADD DELETEALL <contourlabellocation> COLORMAPDIVISIONS INCREMENT CONTOURLEVELS <contourlevelaction> ADD NEW DELETERANGE DELETENEAREST RESET <contourlinemode> USEZONELINETYPE SKIPTOSOLID DASHNEGATIVE <contourtype> LINES FLOOD AVERAGECELL PRIMARYVALUE BOTHLINESANDFLOOD <coordscale> LINEAR LOG <coordsys> GRID FRAME <curveinfomode> CURVEDETAILS CURVEPOINTS <curvetype> LINESEG CURVFIT SPLINE PARASPLINE ETORFIT POWERFIT EXTENDED POLYNOMIALFIT SINGLE DOUBLE LONGINT SHORTINT BYTE BIT AUTO HEAP <datatype> <dataloadstrategy> 258 GRID3D Assignment Value Table Value Identifier <derivpos> Allowable Values SIMPLE ATPOINT COMPLEX ATPOINTB2 <dialogname> AXISEDIT ADVANCED3DCONTROL COLORMAP CONTOUR CREATE1DLINE CREATECIRCULARZONE CURVEINFO CREATERECTANGULARZONE CREATEZONEFROMPOLYLINES CREATEZONEFROMVALUES DATAINFO DATALABELS DATASPREADSHEET DELETEVARIABLES DELETEZONES DEPTHBLANKING DUPLICATEZONE EQUATION EXPORT EXTRAEXTRACTDISCRETEPOINTS EXTRACTFEBOUNDAR Y EXTRACTISOSURFACES EXTRACTPOINTSFROMGEOMETRY EXTRACTPOINTSFROMPOLYLINE EXTRACTSLICEFROMPLANE EXTRACTSLICES EXTRACTSTREAMTRACES EXTRACTSUBZONE EXTRACTCONTOURLINES IJKBLANKING IMPORT LIGHTSOURCE INVERSEDISTANCEINTERPOLATION LINEARINTERPOLATION KRIGINGINTERPOLATION LINEMAPLEGEND LOADDATA MACROPLAY MACRORECORD MACROVIEWER MIRRORZONE NEWLAYOUT OPENLAYOUT ORDERFRAMES PAPERSETUP PERFORMANCEb POLARDRAWINGOPTIONS PRINT PROBEAT PROBE QUICKEDIT QUICKMACROPANEL RESET3DAXES RGBCOLORLEGEND RGBCOLORVARSANDRANGE ROTATE2DDATA RULERGRID SAVEAS SAVE SCATTERLEGEND SCATTERSIZEANDFONT SCATTERREFERENCESYMBOL SLICES SMOOTH SPATIALVARS STREAMTRACES STYLELINKING THREEDAXISLIMITS THREEDVIEWDETAILS THREEDORIENTATIONAXIS THREEDVIEWROTATE TRANSFORMCOORDINATES TRANSLATEMAGNIFY TRIANGULATE VALUEBLANKING VECTORLENGTH TWODDRAWORDER 259 Value Identifier Allowable Values VECTORARROWHEADS VECTORREFERENCEVECTOR VECTORVARS WRITEDATA ZONEMAPSTYLE <derivpos> SIMPLE ATPOINT COMPLEX <dexp> <double> ((<expression>)) <double> Valid floating point value. <draworder> BEFOREDATA AFTERDATA <drift> NONE LINEAR QUAD <edgesetting> NONE MIN MAX BOTH <edgetype> BORDERSANDCREASE BORDERS CREASES <epspreviewimagetype> NONE TIFF EPSIV2 FRAME <errorbartype> UP DOWN LEFT RIGHT VERT. HORZ CROSS <exportformat> RASTERMETAFILE TIFF SUNRASTER XWINDOWS PSIMAGE PS EPS X3D BMP PNG AVI JPEG WINDOWSMETAFILE TECPLOTVIEWER FLV MPEG4 WMV <expression> See Figure 12 - 2. <fielddatatype> FLOAT DOUBLE <fillmode> NONE USEBACKGROUNDCOLOR USELINECOLOR USESPECIFICCOLOR HELV HELVBOLD TIMES TIMESBOLD TIMESITALIC TIMESITALICBOLD COURIER COURIERBOLD GREEK MATH USERDEF DELETETOP FITALLTOPAPER POPATPOSITION PUSHTOP <framecollection> ALL PICKED <framecoordmode> PAPER WORKSPACE <framemode> THREED TWOD XY YINDEPENDENT RINDEPENDENT <font> <frameaction> POP SKETCH <functiondependency> XINDEPENDENT THETAINDEPENDENDT 260 Assignment Value Table Value Identifier <geomshape> <geomtype> Allowable Values SQUARE DEL GRAD RTRI LTRI DIAMOND CIRCLE CUBE OCTAHEDRON SPHERE POINT GEOMIMAGE LINESEGS RECTANGLE SQUARE CIRCLE ELLIPSE LINESEGS3D <ijkblankmode> INTERIOR EXTERIOR <ijklines> I J K <ijkplane> I J K <imagestyle> ONEPERFRAME WORKSPACEONLY <imagetype> LOSSLESS JPEG <integer> Integer constants or variables containing an integer. Expressions that logically result in integer are not currently supported. <interpptselection> NEARESTNPOINTS ALLPOINTS <isosurfacesselection> ALLCOUNTOURLEVELS TWOSPECIFICVALUES THREESPECIFICVALUES ONESPECIFICVALUE <krigdrift> NONE LINEAR <labelalignment> BYANGLE ALONGAXIS 256COLOR OCTANTNPOINTS QUAD PERPENDICULARTOAXIS <labeltype> INDEX VARVALUE <lightingeffect> PANELED GOURAUD <linearinterpmode> DONTCHANGE SETTOCONST <linepattern> SOLID DASHED DASHDOT DOTTED LONGDASH DASHDOTDOT WITHINFRAME BETWEENFRAMES <linktype> <macrofunctionvar> XANDYVARVALUEc |<integer>| 261 Value Identifier <macrointrinsic> Allowable Values AXISMAXX AXISMAXY AXISMAXZ AXISMINX AXISMINY AXISMINZ COLORMAPDYNAMIC ENDSLICEPOS FRAMEMODE IS3DV LOOP MACROFILEPATH MAXB MAXC MAXI MAXJ MAXK MAXS MAXU MAXV MAXVnn MAXW MAXX MAXY MAXZ MINB MINC MINS MINU MINV MINVnn MINW MINX MINY MINZ NUMFRAMES NUMPLANES NUMVARS NUMWIN NUMXYMAPS NUMZONES OPSYS PLATFORMNAME SOLUTIONTIME SLICEPLANETYPE STARTSLICEPOS TECHOME TECPLOTVERSION <macrointrinsicvar> |<macrointrinsic>| <macroparameter> <charactersequence> <string> <macroparameterlist> (<macroparameter> <macroparameter>...) <macrouserdefvar> |<charactersequence>| <macrovar> <macrointrinsicvar> <macrouserdefvar> <macrofunctionvar> <markerpos> SOLUTIONTIME CONSTANTs <meshtype> WIREFRAME OVERLAY HIDDENLINE <mirrorvar> ‘X’ ‘Y’ ‘Z’ <mousebuttonclick> REDRAW REVERTTOSELECT NOOP <mousebuttondrag> NOOP ZOOMDATA ZOOMPAPER TRANSLATEDATA TRANSLATEPAPER ROLLERBALLROTATE TWISTROTATE SPHERICALXROTATEDATA SPHERICALYROTATEDATA SPHERICALZROTATEDATA XROTATE YROTATE ZROTATE <mousemode> ADJUST ADVANCEADJUST SELECT <noncurrentframedrawlevel> FULL TRACE <objectalign> BOTTOM CENTER LEFTJUSTIFY RIGHTJUSTIFY = -= *= /= <originresetlocation> DATACENTER VIEWCENTER <palette> MONOCHROME PENPLOTTER <op> 262 TOP += COLOR Assignment Value Table Value Identifier <papergridspacing> <paperrulerspacing> <papersize> <pickaction> Allowable Values HALFCENTIMETER ONECENTIMETER TWOCENTIMETERS QUARTERINCH HALFINCH ONEINCH TENPOINTS TWENTYFOURPOINTS THIRTYSIXPOINTS FIFTYPOINTS ONEINCH FIFTYPOINTS TWOCENTIMETERS SEVENTYTWOPOINTS LETTER DOUBLE A4 A3 CUSTOM1 CUSTOM2 ADD ADDALL ADDALLINREGION CLEAR COPY CUT EDIT MAGNIFY PASTE POP PUSH SETMOUSEMODE Z ONECENTIMETER SHIFT <placementplaneorientation> X Y <plotapproximationmode> AUTOMATIC NONCURRENTALWAYSAPPROX ALLFRAMESALWAYSAPPROX <plottype> CARTESIAN3D CARTESIAN2D POLARLINE SKETCH ALLDIRECTIONS BOTTOM LEFT LEFTRIGHT LOWERLEFT LOWERRIGHT RIGHT TOP UPDOWN UPPERLEFT UPPERRIGHT <pointselection> NEARESTNPOINTS ALLPOINTS <pointstoplot> SURFACESONLY ALL <positionatanchor> ONCE NEVER <printerdriver> PS EPS <printrendertype> VECTOR IMAGE <quickcolormode> LINECOLOR FILLCOLOR TEXTCOLOR <readdataoption> NEW APPEND REPLACE <relop> < > <= >= == != (not equal to) <> (not equal to). GREATERTHAN LESSTHAN EQUALTO NOTEQUALTO TEXTUREFILTER BOXFILTER LANCZOS3FILTER LANCZOS2FILTER BELLFILTER TRIANGLEFILTER BSPLINEFILTER CUBICFILTER MITCHELFILTER RGB GBR BRG RBG BGR GRB <pointerstyle> <resizefilter> XYLINE OCTANTNPOINTS ALWAYS GAUSSIANFILTER <rgblegendorientation> 263 Value Identifier <rgbmode> Allowable Values SPECIFYRGB SPECIFYRG SPECIFYRB X Y Z ALPHA THETA PSI ABOUTVECTOR TWIST HORZROLLERBALL SPECIFYGB <rotateaxis> VERTROLLERBALL <rotateoriginlocation> VIEWER DEFINEDORIGIN <rotationmode> XYZAXIS SPHERICAL <scope> LOCAL GLOBAL <set> [<setspecifier> <setspecifier> ... ] <setspecifier> <integer> <integer>-<integer>[:<integer>] <shadetype> SOLIDCOLOR PANELED ROLLERBALL GOURAUD COLOREDPANELED <sidebarsizing> MAXOFALL DYNAMIC <sizeunits> GRID FRAME <skipmode> BYINDEX BYFRAMEUNITS <slicesource> VOLUMEZONES SURFACEZONES POINT LINEARZONES SURFACESOFVOLUMEZONES <slicesurface> <sortby> XPLANES YPLANES ZPLANES IPLANES JPLANES KPLANES NONE BYSPECIFICVAR BYDEPENDENDTVAR SPECIFYRG SPECIFYRB BYINDEPENDENTVAR <specifyrgb> SPECIFYRGB SPECIFYGB <spherescatterrenderquality> LOW MEDIUM HIGH. <standardcolormap> SMRAINBOW LGRAINBOW MODERN GRAYSCALE TWOCOLOR <stipplemode> ALL CRITICAL NONE <streamdirection> FORWARD REVERSE BOTH <streamdistributionregion> POINT RAKE SURFACESOFACTIVEZONES SURFACESOFSELECTEDOBJECTS <streamtype> SURFACELINE VOLUMELINE VOLUMEROD TWODLINE VOLUMERIBBON <string> "<charactersequence>" '<charactersequence>'d <stylebase> FACTORY CONFIG <subboundary> ADD ADDONLY ALL STANDARD BYTEENCODED REMOVE <sunrasterformat> 264 OLDFORMAT Assignment Value Table Value Identifier <surfacestoplot> Allowable Values BOUNDARYFACES ALL IPLANES JPLANES KPLANES IJPLANES JKPLANES IKPLANES IJKPLANES EXPOSEDCELLFACE NONE LEFT CENTER RIGHT MIDLEFT MIDCENTER MIDRIGHT HEADLEFT HEADCENTER HEADRIGHT <textboxtype> NONE FILLED HOLLOW <threedviewchangedrawlevel> FULL TRACE <thetamode> DEGREES RADIANS ARBITRARY <tickdirection> IN OUT CENTERED <tiffbyteorder> INTEL MOTOROLA <transformation> POLARTORECT RECTTOPOLAR <textanchor> SPHERICALTORECT RECTTOSPHERICAL <translucency> Valid integer from one to 99. <twoddraworder> BYZONE BYLAYER <unloadstrategy> MINIMIZEMEMORYUSE NEVERUNLOAD AUTO <valueblankcellmode> ALLCORNERS ANYCORNER PRIMARYVALUE <valueblankrelop> LESSTHANOREQUAL NOTEQUALTO GREATERTHAN LESSTHAN EQUALTO GREATERTHANOREQUAL <valueformat> INTEGER FLOAT EXPONENT BESTFLOAT SUPERSCRIPT RANGEBESTFLOAT CUSTOMLABEL TIMEDATE <valuelocation> AUTO NODAL <varloadmode> BYNAME BYPOSITION <vectortype> TAILATPOINT HEADATPOINT MIDATPOINT FIT ZOOM DATAFIT SETMAGNIFICATION AXISFIT CENTER TRANSLATE LAST COPY PASTE PUSH HANN HAMMING RECTANGULAR FITSELECTEDFRAMES FITALLFRAMES FITPAPER MAXIMIZE LASTVIEW ZOOM CELLCENTERED HEADONLY <viewmode> <windowfunction> TRIANGULAR <workspaceviewmode> TRANSLATE <xyaxis> ’X’ ’Y’ 265 a. In order to color an object using one of the contour variable groups (i.e. assigning the color to MULTI1, MULTI2, etc.), you must first set the contour variable via the $!GLOBALCONTOUR command. b. The performance dialog cannot be launched or dropped via the macro language on Windows platforms. c. Available in XY-plots only d. The only difference in using single quotes vs. double quotes for strings is that single quotes prevent the processing of the backslash character “\” (that is \n inserts a newline \\ inserts the backslash itself). 12 - 2 Assignment Value Expressions Simple values are literal constants such as 1, 3, 3.5, 2.5e17. Complex expressions are identified by an equation surrounded by '(' and ')' delimiters. Expressions can be used within any layout or macro file and support all of the common operators and functions familiar to most C and FORTRAN programmers. Arithmetic operators include the common multiply, divide, add, and subtract (*, /, + and -), as well as a few others (^ and **) that are worth noting. The raise operator (^, or **) returns the result of raising the first number by the second. Expressions may also contain macro variables and an assortment of useful functions and constants. Following are tables of supported functions and constants and a short explanation for each: abs(x) Absolute value of x. acos(x) Arc cosine of x between -1 and 1. Return an angle between 0 and p radians. asin(x) Arc sine of x between -1 and 1. Return an angle between -p/2 and p/2 radians. atan(x) Arc tangent of x. Return an angle between -p and p radians. atan2(y,x) Arc tangent of y x . Return an angle between -p and p radians. ceil(x) Smallest integer larger than or equal to x. cos(x) Cosine of x in radians. cosh(x) Hyperbolic cosine of x. exp(x) Exponential of x. floor(x) Largest integer smaller than or equal to x. frac(x) Fractional part of x. int(x) Integer part of x. log(x) Natural logarithm of x. log10(x) Logarithm to the base 10 of x. max(x,y) Larger of x or y. min(x,y) Smaller of x or y. pow(x,y) xy. sin(x) Sine of x in radians. sinh(x) Hyperbolic sine of x. sqrt(x) Square root of x. tan(x) Tangent of x in radians. tanh(x) Hyperbolic tangent of x. 266 Assignment Value Expressions Constants are also supported, as listed in the following table. BASEe Natural logarithm base e. DEG Degrees per radian. GAMMA Euler-Mascheroni constant. PHI Golden ratio: 5 + 1 2 . PI p. RAD Radians per degree. The following table shows the operator precedence and associativity for assignment value expressions. Operators with higher precedence are listed in the higher rows of the table, while operators that are in the same row have the same precedence. The associativity describes how an operator associates with its operand. Operator Type Operators Associativity Expression () Left to right. Power ^ ** Right to left. Unary -+! Right to left. Multiplicative */ Left to right. Additive +- Left to right. Relational > >= < <= == != Left to right. Logical AND && Left to right. Logical OR || Left to right. Conditional ?: Right to left. Unlike C, relational expressions do not evaluate to 0 or 1, instead, they evaluate to true or false. As such, they may only be used with other logical operators, or with the conditional operator. Examples of common expressions used in the Tecplot 360 macro language follow (note that all expressions evaluate to a simple, <dexp>, value): In addition to the more common operators mentioned above, some relational and logical operators are $!If (|b|^2) > (4*|a|*|c|) $!If |a| > 0.0 $!VarSet |root1| = (-|b| + sqrt(|b|^2 - 4*|a|*|c|) / (2*|a|)) $!VarSet |root2| = (-|b| - sqrt(|b|^2 - 4*|a|*|c|) / (2*|a|)) $!EndIf $!EndIf $!VarSet |area| = (PI*|r|**2) provided to form compound expressions. A relation, <relation>, may be constructed and used in conjunction with the conditional operator (? and :) to form compound expressions. The conditional operator (? and :) has the following syntax: <relation> ? <expression if true> : <expression if false> where: • <relation> is a conditional statement that evaluates to true or false, and is formed by any two subexpressions which are compared to one another with one of the relational operators (>, >=, 267 <, <=, ==, !=) in combination with zero or more of the logical operators: logical Not (!), logical And (&&), and logical Or (||). • <expression if true> is the <expression> that is evaluated if the <relation> condition evaluates to TRUE. • <expression if false> is the <expression> that is evaluated if the <relation> condition evaluates to FALSE. Examples of compound expressions used in the Tecplot 360 macro language follow (note that all compound expressions evaluate to a simple, <dexp>, value): $!VarSet |value| = (|stress| > |cutoff| ? |cutoff| : |stress|) $!VarSet |value| = (|x| < 1.5 && |y| <= 5.5 ? |x|^6 : (|x|+|y|)^3.2) $!VarSet |root| = (|b|^2 > 4*|a|*|c| && |a| > 0.0 ? -|b| + sqrt(|b|^2 4*|a|*|c|) / (2*|a|) : 0) It is important not to confuse an expression's relation, <relation>, that controls the evaluation of a compound expression, with the conditional expression, <conditionalexp>, that controls the execution of control commands such as $!IF and $!WHILE. For example, the following is a valid macro command since it has a valid expression syntax and a valid control command syntax: $!If |a| > (PI*|r|^2) ... $!EndIf The following is also a valid macro command because, like the last example, it has a valid expression syntax and a valid control command syntax: $!If (|a|^2) == (|b| > 5 ? 1 : 0) ... $!EndIf The following is not a valid macro command since it has an invalid expression syntax and consequently an invalid control command syntax: $!If (|a| > PI*|r|^2) ... $!EndIf As with the invalid example above, if Tecplot 360 encounters a relation, <relation>, within an expression, <expression> (enclosed within ( and ) delimiters), it expects to find the conditional operator (? and :) and the two required expressions following the specified relation. 268 13 Raw Data Some macro commands contain a “raw data” section. A raw data section is defined by using the keyword RAWDATA followed by the raw data values unique to the macro command. Most raw data sections start with a single count value which represents the number of blocks of raw data followed by the blocks of raw data themselves. The following table lists the raw data sections found in Tecplot 360 macros. Raw Data Name Value Type(s) per Block Notes <arbfielddata> NM p11 p12 p13 ... p1M p21 p22 p23 ....p2M ... pN1 pN2 pN3 ...pNM Where: N is the number of points M is the number of variables per data point. <colormaprawdata> <integer> <integer> <integer> Red. Green. Blue. <contourlevelrawdata> <dexp> Contour level. <extendedcommandrawdata> <string> Each line of the RAWDATA section contains an arbitrary text string. The only requirement is that the character sequence “$!” (a dollar sign followed by an exclamation mark) cannot appear anywhere in the section. Comments can be inserted by using # (the octothorp). If encountered, everything to the right of the # (including the # itself) will be ignored. <geometryrawdata> (Line segment geometry) <xyrawdata> Each block contains a block of <xyrawdata>, which forms a single polyline within the geometry. <geometryrawdata> (3D Line segment) <xyzrawdata> Each block contains a block of <xyzrawdata>, which forms a single polyline within the geometry. <geometryrawdata> (circle) <dexp>a Only one value supplied. Value is the radius. <geometryrawdata> (ellipse) <dexp>a <dexp>a Two values supplied. Values are RX and RY. <geometryrawdata> (rectangle) <dexp>a <dexp>a Two values supplied. Values are width and height. <geometryrawdata> (square) <dexp>a Only one value supplied. Value is the width. 269 Raw Data Name Value Type(s) per Block Notes <xyrawdata> <dexp> <dexp> X. Y. <xyzrawdata> <dexp> <dexp> <dexp> X. Y. Z. a. A count value does not precede the raw data in this case. Examples: Example 1: Raw data for a circle with radius equal to 1.7: RAWDATA 1.7 Example 2: Raw data for a line segment geometry with two segments. Segment 1 has 4 points and segment 2 has 3 points: RAWDATA 2 4 1.5 2.2 1.7 2.4 1.9 2.8 2.1 3.0 3 1.1 1.7 1.2 1.9 1.3 2.0 Example 3: Raw data to define five contour levels: RAWDATA 5 1.5 2.6 3.7 4.9 5.5 Example 4: Raw data to define three RGB values: RAWDATA 3 0 0 0 45 100 100 90 200 200 270 Example 5: For greater control of contour levels in a macro, set the levels with RAWDATA. This example allows you to choose the number of levels, then sets new levels based on the minimum and maximum values of the current contour variable. $!FIELDLAYERS SHOWCONTOUR = YES $!Drawgraphics No $!GLOBALCONTOUR 1 VAR = 4 $!PromptforTextString |numlevels| Instructions = "Enter the number of contour levels." $!Varset |Delta| = ((|maxc| - |minc|)/|numlevels|) $!CONTOURLEVELS DELETERANGE CONTOURGROUP = 1 RANGEMIN = |minc| RANGEMAX = |maxc| $!Varset |newlevel| = (|minc| + |delta|/2) $!Loop |numlevels| $!CONTOURLEVELS ADD CONTOURGROUP = 1 RAWDATA 1 |newlevel| $!Varset |newlevel| += |Delta| $!Endloop $!Drawgraphics Yes $!REDRAW 271 272 14 Macro Language Limitations The only macro control commands allowed in stylesheets and layout files are: $!VARSET and $!REMOVEVAR The only SetValue command allowed in color map files is: $!COLORMAP Layout files, stylesheet files and colormap files cannot contain any of the following commands: $!OPENLAYOUT $!READSTYLESHEET $!LOADCOLORMAP Only SetValue macro commands are allowed in the Tecplot 360 configuration file. The $!LIMITS command can be used only in the Tecplot 360 configuration file. The $!FIELDMAP and $!LINEMAP commands may be used in the configuration file but they may not specify an individual zone or line map. This special use of $!FIELDMAP and $!LINEMAP allows you to change the default attributes for all zones and line mappings when they are initialized in Tecplot 360. The file name referenced in the $!INCLUDEMACRO command cannot use Tecplot 360 macro variables. Size limitations: Maximum number of nested macro function calls 10 Maximum number of nested macro loops 10 Maximum number of nested While-EndWhile loops Unlimited. Maximum number of nested If-EndIf loops Unlimited. Maximum number of nested macro includes 5 Maximum number of macro commands 200,000 Maximum number of parameters per macro function 20 Maximum number of characters in macro variable name 31 273 Maximum number of characters in macro function name Unlimited. Maximum number of macro variables 400 274 Part 2 Python Scripting 15 Using Tecplot 360’s Python Interpreter 15 - 1 Using Python Scripts with Tecplot 360 A Python interpreter has been added to Tecplot 360 to allow you to harness the automation capabilities of macros and extend Tecplot 360’s functionality using standard Python libraries (e.g. FFT) without writing an add-on. You may incorporate Python scripts with Tecplot 360 in several different ways: 1. Using a macro file that calls Python modules. 2. Using the Python Quick Scripts dialog. 3. Running standalone Python modules launched via the Play Macro or Script dialog (accessed via Scripting>Play Macro/Script). Refer to Chapter 30: “Working With Python Scripts” in the User’s Manual for details on each of the above scenarios. 15 - 2 Installation and Setup When you install Tecplot 360, a Python interpreter (version 2.7.2) is included in $TEC_360_2013R1/python, where $TEC_360_2013R1 is the directory of your Tecplot 360 installation. If you would rather use your own Python 2.7.2 installation, set the environment variable TEC_PYTHON_HOME to point to it, and Tecplot 360 will use the specified Python interpreter instead of the included copy. In order to access your Python scripts via the Tecplot 360 interface, ensure that the following line is included in your tecplot.add file (located at base directory of your Tecplot 360 installation): $!LoadAddon “pythonutil” Python scripts can be accessed via Scripting>Play Macro/Script. It is imperative that your PYTHONHOME and PYTHONPATH environment variables be set properly. Refer to the Section 30 - 5 “Python Installation Notes” in the User’s Manual for additional details. This is a Python requirement, not a Tecplot 360 requirement. 277 Several Python scripting samples have been included for your reference. These scripts are located in your Tecplot 360 installation directory and are also available at www.tecplottalk.com/python. 278 16 Python Syntax Rules Tecplot 360’s Python commands are wrapper functions to the TecUtil functions included with the Add-on Developer’s Kit (ADK). The ADK contains C/C++ functions which are thoroughly documented in the ADK Reference Manual. Each entry in the manual includes an indicator for whether the function is available to the Python interpreter. The syntax required for using Tecplot 360’s Python interpreter is described for each function in the ADK Reference Manual as well as the remainder of this chapter. Refer to www.tecplottalk.com/python for sample Python scripts that you may download and execute. 16 - 1 Import Modules You must include the following import statements at the start of every Python script you wish to use with Tecplot 360: import TecUtil import TecVals Both of the above modules are included in your Tecplot 360 distribution. TecUtil contains the TecUtil library function calls. TecVals contains the enumerated values, set value constants and defines required for the TecUtil library. The TecUtil library will work properly only when you are running Tecplot 360. You can not run Python scripts that use the TecUtil library outside of the Tecplot 360 environment. You may also include other Python libraries that your script requires, such as NumPy or SciPy. NumPy and SciPy are Python libraries created for scientific computations, such as FFT and linear algebra. You may find it useful to acquire and install these modules. For more information, please visit www.scipy.org. 279 16 - 2 Basic Syntax Rules The Python Syntax for each TecUtil command is provided for you in the ADK Reference Manual. If you are already familiar with the C-syntax for the functions you wish to call, you may apply the following syntax rules to the C-syntax of the TecUtil functions: • TecUtil function - In Python, a TecUtil function is referenced by TecUtil.<BaseFunctionName>. For example: C Syntax Python Syntax TecUtilExportCancal() TecUtil.ExportCancel() TecUtilFramePop(3) TecUtil.FramePop(3) • Enumerated Type or Defined Value - In Python, prepend the enumerated type or defined value with “TecVals.”. For example: C Syntax Python Syntax TecUtilFrameSetPlotType(Plot Type_Cartesian3D) TecUtil.FrameSetPlotType(TecVals.Plot Type_Cartesian3D TecUtilDialogLaunch(Dialog_P robe) TecUtil.DialogLaunch(TecVals.Dialog_ Probe) If you will be working extensively with enumerated types, you can import the TecVals library into your script by adding the following directive: from TecVals import * This will eliminate the need to append TecVals. However, you may encounter name conflicts between your pre-existing values and items in the TecVals. These errors may cause unexpected behavior. • In/Out parameters - The C-syntax for the TecUtil functions includes both inputs and outputs in the argument list. The Python/ syntax explicitly sets the “outs” from the C-syntax as the result(s) for the Python version of the function. The “ins” remain input parameters for the Python version of the function. Given the following C-syntax: TecUtilMyFunction(int var1, int var2, int var3, /*OUT*/ int var4); /*OUT*/ The Python equivalent is: Results=TecUtil.MyFunction(var1, var2) where: int int tuple var1 var2 Results int Results[0] var3 int Results[1]var4 Refer to the following sections for additional syntax rules, limitations and exceptions. 280 Input Types 16 - 3 Input Types Variables in Python are not typed as they are in C. Instead, all variables are effectively pointers to Python objects. When working with TecUtil functions, note that the variables will not be cast to the type shown in the ADK Reference Manual, but will be equivalent to the Python built-in type, as described in the following table: C Type Boolean_t, bool Python built-in type Boolean int, short, char (not char *), SetIndex_t, ColorIndex_t, EntIndex_t, SmInteger_t, Integer LgIndex_t, NodeMap_t, Strand_t, FaceNodeOffset_t, ElemFaceOffset_t, FaceBndryItemOffset_t long, UniqueID_t, GeomID, Text_ID, Long integer (unlimited size) Int64_t, UInt64_t, FileOffset_t, MemMapOffset_t float, double Float char * String Refer to the following sections for additional information on variable types in Python: • String Lists • Sets • NULL Pointers • Sequences • ArgList_pa Types 281 • Input Parameters With Mixed Types • Opaque Types 16 - 3.1 String Lists If a variable is of the type String_pa, perform the following steps for the Python syntax: 1. Declare a list: mylist=[“val1”, “val2”, ..., “valn”] 2. In the function prototype, use mylist in lieu of the StringList_pa variable. For example, given the following C-syntax: TecUtilMyFunction ( Boolean IsTrue, StringList_pa VarList) The equivalent Python syntax is: mylist=[“val1”, “val2”, ..., “valn”] TecUtil.MyFunction(IsTrue, mylist) where: boolean list 16 - 3.2 IsTrue mylist Sets If a variable is of the type Set_pa, perform the following steps for the Python syntax: 1. Declare a list or tuple: mylist=[6,13,15] or nine=9.0 mytuple = (0, 1, 4, 9, 16, 25) 2. In the function prototype, use mylist or mytuple in lieu of the Set_pa variable. For example, given the following C-syntax: TecUtilMyFunction ( Boolean IsTrue, Set_pa The equivalent Python syntax is: mylist=[1, 4, 9] TecUtil.MyFunction(IsTrue, mylist) where: boolean list or nine=9.0 282 IsTrue mylist VarSet) Input Types mytuple = (0, 1, 4, 9, 16, 25) TecUtil.MyFunction(IsTrue, mytuple) where: boolean tuple 16 - 3.3 IsTrue mytuple NULL Pointers Use the None object in your Python code wherever a NULL pointer would have been passed in C code. For example: success=TecUtil.LineMapSetAssignment(TecVals.SV_Zone, None, 0, 2) 16 - 3.4 Sequences Arrays of values in Python are defined as either a list or a tuple. TecUtil functions support both forms of input arrays. Square brackets are used to denote lists and parentheses are used to denote tuples. Consider the following examples: four = nine = xVals yVals 4 9.0 = [0, 1.0, 2, 3.0, 4, 5] # Okay to mix integers and doubles = (0, 1, four, nine, 16, 25)# This tuple references other # objects (four and nine). numPoints = len(xVals) success = TecUtil.CreateSimpleZone(numPoints, xVals, yVals, TecVals.FieldDataType_Double) Note that some of the values being passed to CreateSimpleZone are integers, even though the function expects doubles. This is acceptable - the values will be promoted to the expected type within the TecUtil glue function. Also note that while lists and tuples in Python can point to objects of different types, including other lists, not all mixtures are acceptable to Tecplot 360. For example, you cannot input strings or references to another list in a function that expects doubles. 16 - 3.5 ArgList_pa Types ArgList_pa types are used in TecUtil functions that end with the letter X. TecUtil functions that end in the letter X (i.e. TecUtil*X) are TecUtil functions that require a flexible, or extended, argument list or a varied number of arguments. Where appropriate, a standard argument list function is provided along with the extended version so that common uses of the function are not burdened with the additional instructions required for the extended version. The ArgList_pa type maps nicely to a Python dictionary native type. Dictionaries are lists of key value pairs. The following code snippet illustrates how this might be used in a call to TecUtilStyleSetLowLevelX. Note: For brevity, we have omitted creation of the zoneSet variable. The C code: ArgList_pa arglist1 = TecUtilArgListAlloc(); TecUtilArgListAppendString(arglist1, SV_P1, SV_FIELDMAP); TecUtilArgListAppendString(arglist1, SV_P2, SV_EDGELAYER); TecUtilArgListAppendString(arglist1, SV_P3, SV_COLOR); TecUtilArgListAppendSet(arglist1, SV_OBJECTSET, zoneSet); TecUtilArgListAppendArbParam(arglist1, SV_IVALUE, (ArbParam_t) Blue_C); TecUtilStyleSetLowLevelX(arglist1); 283 TecUtilArgListDealloc(&argList1);: The equivalent code in Python: argList = dict() argList[TecVals.SV_P1] = (TecVals.AppendString, TecVals.SV_FIELDMAP) argList[TecVals.SV_P2] = (TecVals.AppendString, TecVals.SV_EDGELAYER) argList[TecVals.SV_P3] = (TecVals.AppendString, TecVals.SV_COLOR) argList[TecVals.SV_OBJECTSET] = (TecVals.AppendSet, [2]) argList[TecVals.SV_IVALUE] = (TecVals.AppendArbParam, TecVals.Blue_C) TecUtil.StyleSetLowLevelX(argList) Note that the name string (second parameter in the C version of the TecUtilArgListAppend* functions) becomes the key string in the Python dictionary. The value portion of the dictionary must be a tuple. The first item in the tuple identifies the type of data using constants found in the TecVals module. The type identifiers correspond to the ArgListAppend* function that you would normally call in C: TecVals.AppendArbParam TecVals.AppendInt TecVals.AppendDouble TecVals.AppendSet TecVals.AppendStringList TecVals.AppendArray The second item in the value tuple holds the actual data (what is usually the third parameter in the C version of the TecUtilArgListAppend* function). When the data are in the form of a Set, StringList, or Array, then again the native Python lists can be used. Any TecUtil*X function that requires a parameter that is a pointer is not supported by the Python interpreter. 16 - 3.6 Input Parameters With Mixed Types In the ADK, ArbParam_t is used to cast input parameters when the data being passed may take different forms (integer, double, list, etc.). When an input parameter is an ArbParam_t in the C syntax, the ADK Reference Manual will indicate the type of data actually expected (usually depending on other input parameters). In the Python call, simply use the appropriate built-in type (see also: Section 16 - 3 “Input Types”). For example, when calling TecUtilStateChanged for Zones Added, the ArbParam_t parameter references a Set_pa. Since Set_pa maps to a Python list, the call would simply be: TecUtil.StateChanged(TecVals.StateChange_ZonesAdded, [1,2,3]) 16 - 3.7 Opaque Types Some functions return a pointer to an "opaque" type. These are references that cannot be manipulated in the Python code - they are used only as input parameters for subsequent calls to other TecUtil functions. In these cases, you do not need to be concerned with the data type that is returned. Simply assign the return object to a variable and pass that variable back into the functions that need it. For example: textId = TecUtil.TextCreate(TecVals.CoordSys_Frame, 50, 50, TecVals.Units_Frame, 3.5, "Hello World") TecUtil.TextSetFont(textId, TecVals.Font_Helvetica) 284 Output Types Opaque types include: Menu_pa AddOn_pa NodeMap_pa FaceNeighbor_pa FaceMap_pa ElemToFaceMap_pa FieldData_pa AuxData_pa ViewState_pa UniqueID_t Geom_ID Text_ID 16 - 4 Output Types Most TecUtil functions that send data or set styles return a single value or none at all. In general, these map to the Python boolean or integer types shown in Section 16 - 3 “Input Types”. All successful calls to the TecUtil functions return an object pointer. In the case where the C version of the TecUtil function is void, the return in Python points to a special "NONE" object. See also: Section 16 - 3.3 “NULL Pointers”. 16 - 4.1 Output Parameters Because of the way data are handled in Python, most objects are immutable. Arguments to functions are typically passed by value and not by reference. Lists are the primary exception to this rule. For example, consider the following C code: double xPos; double yPos; double height; double width; TecUtilFrameGetPosAndSize(&xPos, &yPos, &width, &height); Python will not allow us to declare a variable without an assignment. It also does not have an equivalent to the & (address of) operator in C. When the C version of a TecUtil function includes output parameters, they are not included in the argument list. The desired values are packed into a tuple which becomes return value. returnVals = TecUtil.FrameGetPosAndSize() print 'X pos is ', returnVals[0] print 'height is ', returnVals[3] Note that the function call did not include any arguments, since all the parameters in this function were output values. If the C function included both input and output parameters, only the input values would be included in the argument list. The output values would be in the returned tuple in the same order that they appeared in the original function: # CSyntax is "void TecUtilTextGetAnchorPos(Text_ID textId, double * xPos, double * yPos, double * zPos)" returnVals = TecUtil.TextGetAnchorPos(textId)# only the Text_ID value is included in the arguments print 'X Pos is', returnVals[0] print 'Y Pos is', returnVals[1] In this example, the original function is void so the return parameters begin at the first item in the tuple (index 0). If the function had both a return value and output parameters, then the return value would be in index 0 and the output parameters would begin at index 1. 285 16 - 4.2 Reference Counts ALL returns from TecUtil functions are new references. The Python code is therefore the "owner" of these objects, and is responsible for performing DECREFs (decrement the reference count) when the objects are no longer needed. 16 - 5 Exceptions to the Rules A small number of functions use slight variations to the rules shown above. • ViewDealloc • The C syntax indicates that the "address of" (&) operator be prepended to the variable name. Since this is not a valid Python operator, the opaque pointer is passed in as is. • ContourGetLevels The list of levels is returned as the third item in the return tuple. In Python, do not call TecUtilArrayDealloc as noted in the instructions, although the return tuple should be dereferenced when it is no longer needed. 16 - 6 Convenience Functions Tecplot 360’s Python interpreter includes a small library of convenience functions for reading and writing data. The following functions are provided: • ZoneGetDimensions • IOrderedDataValuesGet • IOrderedDataValuesSet • IJOrderedDataValuesGet • IJOrderedDataValuesSet • IJKOrderedDataValuesGet • IJKOrderedDataValuesSet 16 - 6.1 ZoneGetDimensions ZoneGetDimensions is an abbreviated version of ZoneGetInfo that skips all the FieldData_pa returns. It has the following syntax: dims = TecUtil.ZoneGetDimensions(zoneNum) On return, dims will reference a tuple with the following values: dims[0] I-dimension for ordered data, or number of data points for FE data. dims[1] J-dimension for ordered data, or number of elements for FE data. dims[2] K-dimension for ordered data, or the number of nodes per cell for cell-based FE data (triangles, bricks, tetrahedra, and quadrilaterals), or the number of faces for face-based FE data (polygons and polyhedrons). 16 - 6.2 IOrderedDataValuesGet The IOrderedDataValuesGet function reads data from the active frame in Tecplot 360. The data are returned in a list object in a 1-dimensional format. This function can be used whether the data in Tecplot 360 are XY, 2D, or 3D. The "IOrder" refers to the format of the returned list object, not the format of the data. 286 Convenience Functions The function has the following syntax: ptList = TecUtil.IOrderedDataValuesGet(zoneNum, varNum, start, end) Variable Type Optional / Default / Return Notes zoneNum Integer Required 1-based value of the zone containing data to be read. varNum Integer Required 1-based index of the variable to be read. Start Integer Optional / 1 1-based index of the first point to be read. If not included, read will start at the first data point. End Integer Optional / Last point 1-based index of the last point to be read (inclusive). If not specified, the read will go to the last data point. ptList List Return object New reference. List containing the requested values. Note: if the 'start' value is set at 8, then ptList[0] contains the value for the eighth data point in the zone. 16 - 6.3 IOrderedDataValuesSet The IOrderedDataValuesSet function updates data in the active frame in Tecplot 360. The zone and variable must already exist - this simply populates the values. The values are passed using a list object in a 1-dimensional format. This function can be used whether the data in Tecplot 360 are XY, 2D, or 3D, and ordered or FE data. The "IOrder" refers to the format of the input list object, not the format of the data in the frame. The function has the following syntax: returnVal = TecUtil.IOrderedDataValuesSet(zoneNum, varNum, ptList, start) Variable Type Optional / Default / Return Notes zoneNum Integer Required 1-based value of the zone to be modified. varNum Integer Required 1-based index of the variable to be modified. ptList List Required List containing the data values. Must be 1-dimensional (no references to other lists). Start Integer Optional / 1 1-based index of the first point to be output. Points will be written to the end of the list or the end of the zone size, whichever comes first. returnVal None Return object 16 - 6.4 IJOrderedDataValuesGet The IJOrderedDataValuesGet function reads data from the active frame in Tecplot 360. The frame must contain ordered data (not FE data). The values are returned in a list object in a 2-dimensional format (i.e. a list of lists). 287 The function has the following syntax: ptList = TecUtil.IJOrderedDataValuesGet(zoneNum, varNum, startI, endI, startJ, endJ) Variable Type Optional / Default / Return Notes zoneNum Integer Required 1-based value of the zone containing data to be read. varNum Integer Required 1-based index of the variable to be read. startI Integer Optional / 1 1-based value for the starting I-index. endI Integer Optional / Max data I dimension 1-based value of the last I-index (inclusive). startJ Integer Optional / 1 1-based value of the first J-index. endJ Integer Optional / Max data J dimension 1-based value of the last J-index. ptList List Return object New reference. 2-dimensional list containing the requested values. 16 - 6.5 IJOrderedDataValuesSet The IJOrderedDataValuesSet function updates data in the active frame in Tecplot 360. The zone and variable must already exist - this simply populates the values. The values are passed using a list object in a 2-dimensional format (a list of J lists, each containing a list of I values). The data in the frame must be ordered data in at least 2 dimensions. The function has the following syntax: ptList = TecUtil.IJOrderedDataValuesSet(zoneNum, varNum, ptList, startI, startJ) Variable Type Optional / Default / Return Notes zoneNum Integer Required 1-based value of the zone containing data to be read. varNum Integer Required 1-based index of the variable to be read. ptList List Required List containing the data values. Must be 2-dimensional (list of lists). startI Integer Optional / 1 1-based value for the starting I-index. startJ Integer Optional / 1 1-based value of the first J-index. returnVal None Return object 288 Convenience Functions 16 - 6.6 IJKOrderedDataValuesGet The IJKOrderedDataValuesGet function reads data from the active frame in Tecplot 360. The frame must contain ordered data (not FE data). The values are returned in a list object in a 3-dimensional format. The function has the following syntax: ptList = TecUtil.IJKOrderedDataValuesGet(zoneNum, varNum, startI, endI, startJ, endJ, startK, endK) Variable Type Optional / Default / Return Notes zoneNum Integer Required 1-based value of the zone containing data to be read. varNum Integer Required 1-based index of the variable to be read. startI Integer Optional / 1 1-based value for the starting I-index. endI Integer Optional / Max data I dimension 1-based value of the last I-index (inclusive). startJ Integer Optional / 1 1-based value of the first J-index. endJ Integer Optional / Max data J dimension 1-based value of the last J-index. startK Integer Optional / 1 1-based value of the first K-index. endK Integer Optional / Max data J dimension 1-based value of the last K-index. ptList List Return object New reference. 3-dimensional list containing KMax lists of JMax lists of IMax values. 16 - 6.7 IJKOrderedDataValuesSet The IJKOrderedDataValuesSet function updates data in the active frame in Tecplot 360. The zone and variable must already exist - this simply populates the values. The values are passed using a list object in a 3-dimensional format (for each K there is a list of J lists, each containing a list of I values). The data in the frame must be ordered data in at least 3 dimensions. The function has the following syntax: ptList = TecUtil.IJOrderedDataValuesSet(zoneNum, varNum, ptList, startI, startJ, startK) Variable zoneNum Type Integer Optional / Default / Return Required Notes 1-based value of the zone containing data to be read. 289 varNum Integer Required 1-based index of the variable to be read. ptList List Required List containing the data values. Must be 3-dimensional lists. startI Integer Optional / 1 1-based value for the starting I-index. startJ Integer Optional / 1 1-based value of the first J-index. startK Integer Optional / 1 1-based value of the first K-index. returnVal None Return object 16 - 7 Tecplot 360 Macro Commands for Python Modules One of the best methods for working with Python scripts in Tecplot 360 is to combine the scripts with Tecplot 360 macro commands. Refer to Section 30 - 1 “Combining Python scripts with macro commands” in the User’s Manual for details on this procedure. The syntax for the macro commands that work directly with the Python interpreter add-on is described below. LOADPYFILE NAME Description:Use this function to load a Python module via a macro file. Syntax: $!EXTENDEDCOMMAND COMMANDPROCESSORID = 'Python Utility' COMMAND = 'LOADPYFILE NAME="<string>" Parameter NAME Type = “<string>” Required Notes Y Name of Python module to load / reload. Do not include the path or extension. NOTE: the file must reside in a directory included in your PYTHONPATH definition. Refer to Section 15 - 2 “Installation and Setup” for details. MODIFYPYPATH Description:Use this command to temporarily modify your PYTHONPATH variable. The variable will be set for the duration of the Tecplot 360 session using the macro command/file. Syntax: $!EXTENDEDCOMMAND COMMANDPROCESSORID = 'Python Utility' COMMAND = 'MODIFYPYPATH FOLDER="<string>" Parameter FOLDER 290 Type = “<string>” Required Y Notes Name of folder to be added to the Python search path. Notes for Novice Python Users RUNPYFUNCTION Description:Use this command to execute a Python function via a macro file. NOTE: Before executing a Python function, you must first load the module that contains it via the LOADPYFILE NAME command. Syntax: $!EXTENDEDCOMMAND COMMANDPROCESSORID = 'Python Utility' COMMAND = 'RUNPYFUNCTION MODULE="<string>" FUNCTION="<string>" ARGUMENTS="<arg1>, <arg2>, ..."' Parameter MODULE Type = “<string>” FUNCTION = “<string>” ARGUMENTS = “<arg1>, <arg2>, ...” 16 - 8 Required Notes Y Name of module containing the desired function (do not include path or extensions). NOTE: the module must already be loaded using the LOADPYFILE NAME command. Y Name of quick macro function to execute. Y, for any function that requires input parameters. Input arguments for the Function, entered as comma separated values in a quoted string. The number of individual arguments and the argument types depend on function. Notes for Novice Python Users If you are new to Python scripting, please be aware of the following concepts: • There are not any Python equivalents for TecUtil Alloc, Dealloc or manipulation functions. Use the built-in Python functions. • The comment symbol in Python is “#”. 291 292 Index Symbols 257, 258, 259, 260, 261, 262, 263, 264, 265 <anglespec> 257 <axisalignment> 257 <bitdumpregion> 257 <boolean> 258 <borderlocation> 258 <clipping> 258 <compressiontype> 258 <conditionalexp> 258 <constraintop2mode> 258 <contourcoloring> 258 <contourlabellocation> 258 <curveinfomode> 258 <dataloadstrategy> 258 <dialogname> 259 <draworder> 260 <edgetype> 260 <fielddatatype> 260 <fillmode> 260 <framecollection> 260 <ijklines> 261 <interpptselection> 261 <isosurfaceselection> 261 <linktype> 261 <macrofunctionvar> 261 <macrointrinsicvar> 262 <macroparameter> 262 <macroparameterlist> 262 <macrouserdefvar> 262 <macrovar> 262 <mirrorvar> 262 <mousebuttonclick> 262 <mousebuttondrag> 262 <mousemode> 262 <noncurrentframedrawlevel> 262 <op> 262 <originresetlocation> 262 <pickaction> 263 <plotapproximationmode> 263 <plottype> 263 <positionatanchor> 263 <printrendertype> 263 <relop> 263 <resizefilter> 263 <rgblegendorientation> 263 <rgbmode> 264 <scope> 264 <set> 264 <setspecifier> 264 <sortby> 264 <string> 264 <stylebase> 264 <subboundary> 264 <thetamode> 265 <threedviewchangedrawlevel> 265 <transformation> 265 <translucency> 265 <valueblankrelop> 265 <valuelocation> 265 <varloadmode> 265 <xyaxis> 265 $!ACTIVEFIELDFILEMAPS 57 $!ACTIVELINEMAPS 58 $!ADDMACROPANELTITLE 58 $!ALTERDATA 58, 60 $!ANIMATECONTOURLEVELS 60 $!ANIMATEIJKBLANKING 61 $!ANIMATEIJKPLANES 62, 63 $!ANIMATELINEMAPS 64, 65 $!ANIMATESLICES 63, 65 $!ANIMATESTREAM 64, 66 $!ANIMATETIME 66 $!ANIMATEZONES 66, 67 $!ATTACHDATASET 68 $!ATTACHGEOM 69, 70, 71 $!ATTACHTEXT 71, 72, 252 $!BASICCOLOR 73, 74, 249 $!BASICSIZE 74, 76, 77, 239 $!BLANKING 77, 79 $!BRANCHCONNECTIVITY 79 $!BRANCHFIELDDATAVAR 80 $!BREAK 80 $!COLORMAP 127 in color map files 273 $!COLORMAPCONTROL COPYSTANDARD 81 $!COLORMAPCONTROL REDISTRIBUTECONTROLPOINTS 81 $!COLORMAPCONTROL RESETTOFACTORY 81 $!COMPATIBILITY 81 $!CONTINUE 82 $!CONTOURLABELS 82 $!CONTOURLABELS ADD 82, 83 $!CONTOURLABELS DELETEALL 83 $!CONTOURLEVELS ADD 84 $!CONTOURLEVELS DELETENEAREST 84, 85 $!CONTOURLEVELS DELETERANGE 85 $!CONTOURLEVELS NEW 85 $!CONTOURLEVELS RESET 86 $!CONTOURLEVELS RESETTONICE 86, 87 $!CREATEBOUNDARYZONE 87 $!CREATECIRCULARZONE 87 $!CREATECONTOURLINEZONES 88 $!CREATEFEBOUNDARY 89 $!CREATEFESURFACEFROMIORDERED 89 $!CREATEISOZONES 90 $!CREATELINEMAP 90 $!CREATEMIRRORZONES 90, 91 $!CREATENEWFRAME 91 $!CREATERECTANGULARZONE 91, 92 $!CREATESIMPLEZONE 92, 93 $!CREATESLICEZONEFROMPLANE 93 $!CREATESLICEZONES 94 $!CREATESPHERICALZONE 94 $!CREATESTREAMZONES 95 $!DATASETUP 95 $!DEFAULTGEOM 96, 97 $!DEFAULTTEXT 97 $!DELAY 98 $!DELETEAUXDATA 98 $!DELETELINEMAPS 99 $!DELETEZONES 99, 100 $!DOUBLEBUFFER OFF 100 $!DOUBLEBUFFER ON 100 $!DOUBLEBUFFER SWAP 100 293 INDEX $!DRAWGRAPHICS 101 $!DROPDIALOG 101 $!DUPLICATELINEMAP 101 $!DUPLICATEZONE 101 $!ELSE 102 $!ELSEIF 103 $!ENDIF 142 $!ENDLOOP 162 $!ENDWHILE 213 $!EXPORT 104 $!EXPORTCANCEL 104 $!EXPORTFINISH 104 $!EXPORTNEXTFRAME 105 $!EXPORTSETUP 105, 106 $!EXPORTSTART 106 $!EXTENDEDCOMMAND 107 $!EXTRACTFROMGEOM 107, 108 $!EXTRACTFROMPOLYLINE 108 $!FIELDLAYERS 109 $!FIELDMAP 109, 244 restrictions on using 273 $!FILECONFIG 112 $!FONTADJUST 115 $!FOURIERTRANSFORM 115 $!FRAMECONTROL ACTIVATEATPOSITION 117, 118 $!FRAMECONTROL ACTIVATEBYNAME 118 $!FRAMECONTROL ACTIVATEBYNUMBER 118 $!FRAMECONTROL ACTIVATENEXT 117 $!FRAMECONTROL ACTIVATEPREVIOUS 117 $!FRAMECONTROL ACTIVATETOP 117 $!FRAMECONTROL DELETEACTIVE 120 $!FRAMECONTROL FITALLTOPAPER 120 $!FRAMECONTROL MOVETOBOTTOMACTIVE 119 $!FRAMECONTROL MOVETOBOTTOMBYNAME 119, 120 $!FRAMECONTROL MOVETOBOTTOMBYNUMBER 120 $!FRAMECONTROL MOVETOTOPACTIVE 118 $!FRAMECONTROL MOVETOTOPBYNAME 119 $!FRAMECONTROL MOVETOTOPBYNUMBER 119 $!FRAMENAME 121 $!FRAMESETUP 121 $!GETAUXDATA 123 $!GETCONNECTIVITYREFCOUNT 123 $!GETCURFRAMENAME 124 $!GETFIELDVALUE 124 $!GETFIELDVALUEREFCOUNT 124 $!GETNODEINDEX 125 $!GETUSERINPUT replaced by $!PROMPTFORTEXTSTRING 178 $!GETVARLOCATION 126 $!GETVARNUMBYNAME 126 $!GLOABLPAPER 133 $!GLOBALCOLORMAP 127 $!GLOBALCONTOUR 128, 130, 241, 256 $!GLOBALEDGE 131 $!GLOBALFRAME 131 $!GLOBALLINEPLOT 132 $!GLOBALLINKING 133 $!GLOBALPOLAR 134 $!GLOBALRGB 135 $!GLOBALSCATTER 136, 247 $!GLOBALTHREED 138, 255 $!GLOBALTHREEDVECTOR 139 294 $!GLOBALTIME 140 $!GLOBALTWODVECTOR 141 $!IF 142 $!INCLUDEMACRO 142 restrictions on using 273 $!INTERFACE 142 $!INVERSEDISTINTERPOLATE 151 $!ISOSURFACEATTRIBUTES 152 $!ISOSURFACELAYERS 154 $!KRIG 154 $!LAUNCHDIALOG 155 $!LIMITS 155, 273 $!LINEARINTERPOLATE 156 $!LINEMAP 157, 251 restrictions on using 273 $!LINEPLOTLAYERS 160 $!LINKING 160 $!LOADADDON 161 $!LOADCOLORMAP 162 restrictions on using 273 $!LOOP 162 $!LOOP-ENDLOOP 80 $!MACROFUNCTION 24, 162 $!NEWLAYOUT 163 $!OPENLAYOUT 163 restrictions on using 273 $!PAGE 18, 164, 246 $!PAGECONTROL all functions 165 $!PAGECONTROL CREATE 166 $!PAGECONTROL SETCURRENTBYNAME 166 $!PAGECONTROL SETCURRENTTONEXT 166 $!PAGECONTROL SETCURRENTTOPREVIOUS 166 $!PAGENAME 167 $!PAGENAME 167 $!PAUSE 167 $!PICK ADD 167 $!PICK ADDALL 168 $!PICK ADDALLINRECT 168 $!PICK CLEAR 170 $!PICK COPY 170 $!PICK CUT 170 $!PICK EDIT 170 $!PICK MAGNIFY 172 $!PICK PASTE 173 $!PICK POP 173 $!PICK PUSH 173 $!PICK SETMOUSEMODE 173 $!PICK SHIFT 174 $!PLOTTYPE 174 $!POLARDAXIS 175 $!POLARTORECTANGULAR 175 $!POLARVIEW 176 $!PRINT 176 $!PRINTSETUP 176, 250 $!PROMPTFORFILENAME 178 $!PROMPTFORTEXTSTRING 178 $!PROMPTFORYESNO 179 $!PROPAGATELINKING 179 $!PUBLISH 179 $!QUIT 180 $!RAWCOLORMAP 180 $!READDATASET 181 $!READSTYLESHEET 183 restrictions on using 273 $!REDRAW 183 $!REDRAWALL 184 $!REMOVEVAR 184 in stylesheets and layout files 273 $!RENAMEDATASETVAR 184 $!RENAMEDATASETZONE 185 $!RESET3DAXES 185 $!RESET3DORIGIN 185 $!RESET3DSCALEFACTORS 186 $!RESETVECTORLENGTH 186 $!ROTATE2DDATA 186 $!ROTATE3DVIEW 187 $!RUNMACROFUNCTION 187 $!SAVELAYOUT 188 $!SET3DEYEDISTANCE 188 $!SETAUXDATA 188 $!SETDATASETTITLE 189 $!SETFIELDVALUE 189 $!SETFRAMEBACKGROUNDCOLOR 190 $!SETSTYLEBASE 190 $!SHARECONNECTIVITY 191 $!SHAREFIELDDATAVAR 191 $!SHIFTLINEMAPSTOBOTTOM 192 $!SHIFTLINEMAPSTOTOP 192 $!SHOWMOUSEPOINTER 192 $!SKETCHAXIS 192 $!SLICEATRRIBUTES 193 $!SMOOTH 197 $!STREAMATTRIBUTES 197 $!STREAMTRACE ADD 199, 200 $!STREAMTRACE DELETEALL 201 $!STREAMTRACE DELETERANGE 201 $!STREAMTRACE RESETDELTATIME 201 $!STREAMTRACE SETTERMINATIONLINE 202 $!SYSTEM 202 $!THREEDAXIS 203, 242, 243 $!THREEDVIEW 204 $!TRANFORMCOORDINATES 205 $!TRIANGULATE 206 $!TWODAXIS 207, 235, 236, 237, 238, 243, 245, 247, 253 $!VARSET 19, 23, 208 in stylesheets and layout files 273 $!VIEW AXISFIT 209 $!VIEW AXISNICEFIT 209 $!VIEW CENTER 210 $!VIEW COPY 210 $!VIEW DATAFIT 210 $!VIEW FIT 210, 211 $!VIEW LAST 211 $!VIEW MAKECURRENTVIEWNICE 211 $!VIEW NICEFIT 211 $!VIEW PASTE 211 $!VIEW PUSH 211 $!VIEW RESETTOENTIRECIRCLE 212 $!VIEW SETMAGNIFICATION 212 $!VIEW TRANSLATE 212 $!VIEW ZOOM 212 $!WHILE 213 $!WHILE-$!ENDWHILE 80 $!WORKSPACEVIEW 213 $!WORKSPACEVIEW FITALLFRAMES 214 $!WORKSPACEVIEW FITPAPER 214 $!WORKSPACEVIEW FITSELECTEDFRAMES 214 $!WORKSPACEVIEW LASTVIEW 214 $!WORKSPACEVIEW MAXIMIZE 214 $!WORKSPACEVIEW TRANSLATE 214 $!WORKSPACEVIEW UNMAXIMIZE 215 $!WORKSPACEVIEW ZOOM 215 $!WRITECOLORMAP 216 $!WRITECURVEINFO 216 $!WRITEDATASET 216 $!WRITESTYLESHEET 217 $!XYLINEAXIS 218, 254 Numerics 2D axes settings 207 2D draw order 265 2D field plots 83 vector plots 141 3D axes attributes 203 reset 185 3D plots global attributes 138, 204 3D rotation 264 3D vector plot attributes 139 A Action commands 57 Active planes 261 Active zones 57 Add-on loading 161 Add-on commands send to add-on 107 Add-on style 257 ALIGNINGCONTOURLABELS 122 Alignment 262 axis 257 ALLOWDATAPOINTADJUST 143 ALLOWDATAPOINTSELECT 143 ALLOWHWACCELERATION 148 Alter data command 58 ALWAYSPOPACTIVEFRAME 143 Anchor 235 text 72 Angle rotate 3D 138, 187, 204 Angle units 257 Animate commands 60–68 ANIMATESTREAKLINES macro command 219, 220 Animation contour levels 60 frames 65 IJK blanking 61 IJK planes 62, 63 iso-surface 63 line mappings 64 slice 65 stream markers 66 streamtraces 66 Time 66 zone 66, 67 zones 67 Area style 236 Arrays for Python 283 295 INDEX Arrowhead angle 70 attachment 70, 257 size 70 style 70, 257 ARROWHEADSIZES 77 ATTACHINTEGRATIONRESULTS macro command 219, 221 automatic stranding 89, 90, 95, 207 AUTOREDRAWISACTIVE 143 Auxiliary data 123 delete 98 macro variables 20 setting 188 Axes 209, 210, 236, 237, 238 2D settings 207 3D attributes 203 adjust to center data 210 adjust to nice fit 211 adjust to nice view 211 assign variables 175, 203, 207 attributes 235, 236, 237, 238, 253 dependent mode 257 fit to data 209 grid area 236, 242 grid areas 242 gridlines 243 in Sketch frame mode 192 labels 245 nice fit 209 number 209, 210 polar attributes 175 reset 185 reset scale factors 186 tick marks 253 attributes 253 label formatting 252 labels 253 title mode 257 title position 257 variables 204 XY Line attributes assignments 218 Axis alignment 257 B Back buffer swap to front 100 Backing store 257 BACKINGSTOREMODE 143 basic colors naming 239 basiccolorcontrol subcommand 239 basicsizelist subcommand 239 BEEPONFRAMEINTERRUPT 143 Blanking 77, 79 animate 61 IJK 77 Value 265 value 77 BOLDFACTOR 115 Boundary condition 258 Box type 258 Break out command 80 296 Buffer commands 100 C CACHELIGHTDISPLAYLISTSONLY 143 CALCPARTICLEPATH macro command 219, 221 CALCTURBULENCEFUNCTION macro command 219, 224 CALCULATE macro command 219, 224 CALCULATEACCURACY macro command 220, 225 Case of characters 19 Cell labels 136 Center view 210 Character sequence 258 Circle raw data 269 Circular zone 87, 94 Clipping 70 Color fill color 70 flooding 241 palette 262 rgb 73 text 72 Color map 80, 127, 258 active 81 assignment value options 264 color spectrum 127 contour 240 override 240 control 80, 258 control commands 80–82 control points 81, 240 distribution 240, 258 files 273 gray scale output 249 loading 162 override 240, 241 raw data 269 raw user-defined 240 reset to default 127 RGB values 180 standard 81 user-defined 81 write to file 216 Color palette 262 Color text 72 COLORMAPFILE 113 Colors 70, 73, 74, 258 assigning RGB values 249 quickedit 263 RGB 135, 249 set command in macros 73 shading 249 zebra shading 255 Command Line 11 Command parameters 17 Conditional execute 213 Conditional expressions 258 Configuration OpenGL 248 Configuration file SetValue macro commands 273 Configuring dropdown menus 239 Continue command 82 Continue to execute a set of commands 213 Contour color map 240 override 240 zebra shading 255 line mode 258 plot type 258 Contour color map 81 Contour commands 82–87 Contour labels 82, 129, 258 Contour levels 85, 258 animate 60 animation 61 delete 84 new 85 raw data 269 Contour plot animation 60 attributes 110 color map 81, 127 global changes 128 label 82 labels 129 levels 60 add 84 copy to another frame 218 delete 84, 85 reset 86 show 109 variable 129 Control commands If...Endif 142, 268 Control points 81 contour color maps 240 Convenience functions Python scripting 286–290 Coordinates convert polar to rectangular 175 Copy picked objects 170 Curve details write to file 216 Curve equations write 216 Cut delete picked objects 170 Cutaway views blanking 77 D Data 143 adjust axes to fit 209 center in view 210 fit to axis grid area 210, 211 read 181 reading 263 rotate 186 rotating 19 smooth 197 Data alteration 58 Data extraction 107 Data fit 210 Data labels 136 Data manipulation 58 polar to rectangular coordinates 175 Data operations zone number specification 60 Data point adjust 143 moving 143 select 143 Data set attach to frame command 68 naming 189 variable 124 write 216 Data set variables set value (from macro variable) 189 Data sharing branching connectivity 79 branching variables 80 connectivity 191 field variables 191 reference count 124 Data type 92, 258 DATAFILEVARLOADMODE 113 Debugging macro files 12 Debugging macros 11 Delay 98 Delete objects 170 Delete picked objects 170 Derivative position 259 DERIVATIVEBOUNDARY 143 Destination map 101 zone 151 Dialog drop a Tecplot dialog 101 Display render 150 Display message 167 DISPLAYBOUNDARIES macro command 220, 226 DISTRIBUTIONREGION 200 DOAUTOFNAMEEXTENSION 113 Double 260 Double buffer compound functions 100 turning off 100 turning on 100 Double expression 260 Draw order 265 Line mappings 192 sort level 138, 204 Dropdown menus 239 Duplicate zones 101 Dura labels labeling node 261 E Edge attributes 110 Edge plot show 109 Edge setting 260 Edit global edit on picked objects 170 Ellipse 297 INDEX raw data 269 ENABLEDELAYS 146 ENABLEINTERRUPTS 146 ENABLEPAUSES 146 ENABLEWARNINGS 146 Encapsulated PostScript preview image 260 EndLoop command 162 Environment variables 22 EQUATIONFILE 113 Equations 59 Error bars plot types 260 Examples 2D axes attributes 175, 207 3D axis attributes 204 activating field zones for plotting 57 Adding contour levels 84 adding Line maps 58 adding zones to the set of active zones 57 assigning attributes for field plots 112 assigning axes attributes 237 assigning control point for small rainbow color map 127 assigning the medium line pattern length 77 attributes applied to all frames 132 attributes for default geometry 97 attributes for exporting image files 106 axis grid area borders 236, 243 axis gridlines settings 243 axis modes 193 axis tick mark attributes 254 axis tick mark labels 253 basic size values 239 circle raw data 270 color map control points 240 contour attributes 130 contour levels raw data 270 Create a new zone for each contour line on an existing contour plot. 89 Creating mirror zones 91 Deleting contour levels 85 edit picked objects 164, 172 inverse distance interpolation 151 Line legend and data labels 133 line mappings attributes 159 line plot layers on or off 160 line segment geometry raw data 270 macro function file 12 making Line maps active for plotting 58 making line maps active for plotting 58 making zones active for plotting 57 mapping monochrome hardcopy output 250 paper characteristics 165 paper size dimensions 246 path information 114 pick all in rectangle 169 positioning frame on the paper 121 Preplot launch command 96 print attributes 177 rectangle settings 247 removing Line maps 58 removing zones from the set of active zones 58 RGB values raw data 270 298 set parameters for dynamic frame attributes 122 setting (X,Y,Z) triplets 255 setting (X,Y) positions 255 setting 3D global attributes 139 setting attributes of 2D vector plots 141 setting attributes of 3D vector plots 140 setting attributes of default font 98 setting attributes of Tecplot interface 150 setting character spacing and sizing for fonts 115 setting color map overrides 241 setting color values 249 setting grid area borders 236, 243 setting I- J- and K-indices 244 setting IJK blankings 79 setting numbers formats 245 setting reference scatter symbols attributes 247 setting scatter attributes 137 setting some Tecplot limits 156 setting symbol shapes 251 setting text shapes 252 setting the red, green, and blue components 74 text box 251 turning on scatter layers 109 Using value-blankings 79 XY Line axis attributes 218 zebra shading attributes 256 Examples of macros 225, 229 Exit command 180 Export 104 image attributes 105 Exporting layout to paper or file 176 Exporting images file types 260 formats 260 Expression 260 EXTENDEDCOMMAND macro 219 Extract 3D slice 93 isosurfaces 90 EXTRACTFLOWFEATURE macro command 220, 226 EXTRAPOLATESOLUTION macro command 220, 227 Eye distance 188 F FE boundary 89 FE surfaces 90 Field mappings number of field mappings 21 Field plots 109 contour attributes 128 plot layers 109 scatter attributes 136 Field value setting 189 Field variable query 124 Fieldmaps set active zones command 57 specify 57 File open data set 181 open layout 163 save data set 216 save layout 188 File name prompt for 178 File names 108 File paths configuration 112 Finite-element create FE-surface zones 90 Finite-element data zone boundary creation 89 First line of macro file 17 Flooded contour plots 258 FNAMEFILTER 113 Font 98, 260 Fonts 72 spacing 115 Formats in macro variables 24 Formatting numbers 245 FORTRAN-like equations 58 Frame 68 activate frame by name 118 activate frame by number 118 activate frame by position 117 activate next frame 117 activate previous frame 117 activate top frame 117 always pop active frame 143 attach to data set command 68 create 91 delete 166 delete active frame 120 dynamic attributes 121 fit frames to paper 120 get name 124 invisible borders 149 move active frame to top 118 move frame to bottom by name 119 move frame to bottom by number 120 move frame to top by number 119 move to top by name 119 moves active frame to bottom 119 text (attach) 71 view last 211 Frame control commands 116–120 Frame coordinates 258 Frame manipulating 260 Frame modes 201, 260 Frame style attributes 190 FRAMEHEADERFORMAT 131 FRAMEHEADERHEIGHT 131 Frames fit all into workspace view 214 fit selected frames in view 214 number of frames 21 setting global attributes 131 Frames with pick handles 214 FRAMETEXTSIZES 77 G Geometries copy to another frame 218 default attributes 96 Geometry attach command 69 attach to frame 69 attributes 96 color 70 defaults 96 extract data 107 Geometry attributes 69 Geometry raw data 269 Geometry type 70, 261 circle 261 ellipse 261 rectangle 261 square 261 Global attributes 127–133 Global edit on picked objects 170 Graphics turn drawing on or off 101 Gray scale output 249 Grid precise dot 246 Grid area 242 Grid area border 236, 243 Grid area example 247 Grid coordinates 258 Grid lines 243 gridarea subcommand 242 gridlinedetail subcommand 243 Gridlines 243 I I-, J-, or K-indices setting 244 If command 142 IJK Blanking 79 IJK blanking 77 animation 61 blanking domain 261 IJK index 244 ijk subcommand 244 IJK-indices minimum/maximum as variables 20 IJK-planes animation 62 Image export 104 attributes 105 Image style 261 IMAGERENDERING 148 Import Modules 279 Index ranges 244 setting 244 indexrange subcommand 244 Infinite see Loop Initial dialog placement 242 INITIAL3DSCALE 122 initialdialogplacement subcommand 242 INITIALPLOTFIRSTZONEONLY 146 INPUTDATAFILE 113 INPUTLAYOUTFILE 113 299 INDEX Integer 261 INTEGRATE macro command 220, 227 Integration accessing results 229 Interface Data 143 launch dialog 155 render 150 set attributes 142 Internal macro variables 22 INTERPNPOINTS 143 Interpolation inverse distance method 151 kriging 154 linear method 156 pointer selection 263 INTERPPTSELECTION 143 INTERRUPTCHECKINGFREQUENCY 146 Intrinsic values 262 INVDISTEXPONENT 143 INVDISTMINRADIUS 143 Inverse distance interpolation 151 I-ordered zones 207 ISFILLED 70 Iso-surface animate 63 Iso-surfaces 152 Isosurfaces zone creation 90 J Jacobian macro example 225 K Krig drift 261 KRIGDRIFT 143 Kriging 154 Kriging Drift 260 KRIGRANGE 143 KRIGZEROVALUE 143 L Label contour 82 Labels tick marks 252 LARGESTEP 149 Layout clear 163 new 163 printing to paper or file 176 saving 188 Layout files macro control commands 273 Layouts attach data set of another frame 68 opening 163 Light source shading 138, 204 change settings 127 Lighting effects 261 Limitations 273 Limits set in Tecplot 155 300 Line mappings 58, 64, 101 animation 64 attributes 157 create 90 delete 99 draw order 192 duplicate 101 number of line mappings 21 set active mappings command 58 shift to bottom of list 192 shift to top of list 192 write coefficients 216 write curve information 216 line mappings show symbols 160 Line maps activate 58 attributes 273 defaults 273 see Line mappings 99 specify 58 Line pattern 70 Line patterns 261 Line plot layers 160 Line plots 65 setting global attributes 132 show lines 160 Line space text 72 Line thickness 70 Linear interpolation 156 action on outside points 261 LINEARINTERPCONST 143 LINEARINTERPMODE 143 LINEPATLENGTHS 77 Lines line plots 160 LINETHICKNESSES 77 Load data 181 Loading your own macro function file 12 Log axes 258 Loop See also Infinite Loop command 162 M Macro command summary 27 Macro command syntax 17 Macro commands 9, 11, 17 ANIMATESTREAKLINES 219, 220 ATTACHINTEGRATIONRESULTS 219, 221 CALCPARTICLEPATH 219, 221 CALCTURBULENCEFUNCTION 219, 224 CALCULATE 219, 224 CALCULATEACCURACY 220, 225 conditionally processing 142 DISPLAYBOUNDARIES 220, 226 EXTRACTFLOWFEATURE 220, 226 EXTRAPOLATESOLUTION 220, 227 INTEGRATE 220, 227 macro variables 19 major 27 SAVEINTEGRATIONRESULTS 220, 229 SETFIELDVARIABLES 220, 230 SETFLUIDPROPERTIES 220, 230 SETGEOMETRYANDBOUNDARIES 220, 232 SETREFERENCEANDFIELDVARIABLES 232 SETREFERENCEVALUES 220 SETUNSTEADYFLOWOPTIONS 220, 233 spacing 18 Macro control commands 57 allowed in stylesheets and layouts 273 Break 80 Continue 82 Delay 98 include macro 142 Loop...Endloop 162 pause 167 run macro function 187 stop execution 167 system commands 202 While...Endwhile 213 Macro definitions 12 Macro files 17 debugging 12 first line 17 nesting one file within another 142 Macro function execute 187 Macro function files example 12 loading your own 12 Macro functions 11, 12 definition 162 retaining 11 run command 23 Macro language restrictions and limitations 273 Macro Panel 12 Macro panel 163 title 58 Macro syntax examples 268 Macro variable set field value 189 values 22 Macro variables assigning strings 23 assigning value or string 208 assigning values 22 function 23 get active frame name 124 get field value 124 name 22 remove user-defined 184 select variable (by name) 126 strings 23 using formats 24 Macro viewer 12 MACROFILE 113 Macros 9, 11, 12 debugging 11 running from the command line 11 running from the Quick Macro Panel 12 running from the Tecplot interface 11 Macros vs. macro functions vs. macro commands 11 Magnification set for view 212 zoom 212 Magnify picked objects 172 Major macro commands 27 Managing Tecplot macros 11 Mandatory parameters 17 Mappings delete 99 duplicate 101 Mass calculation example 229 Mass flux example 229 Mass-weighted average example 229 MAXCHRSINTEXTLABELS 156 MAXCUSTOMCOLORSININTERFACE 147 Maximum index 229 Maximum values as variables 20 MAXNUMCONTOURLEVELS 156 MAXPTSINALINE 156 MEDIUMSTEP 149 Mesh attributes 110 Mesh plot show 109 Mesh plots plot types 262 Message display 167 Minimum values as variables 21 MINPIXELSFORDRAG 147 Mirror zones create 90 Modern color maps 127 Modifiers command-specific 17 Modules Python import 279 Monochrome hardcopy 249 Mouse button assignments 257 Mouse mode set for picking 173 Mouse pointer 263 Move picked objects 174 Movie files 61, 63, 64, 65, 66, 67, 68 N Name get frame name 124 Negative values 59, 229 NULL Pointers 283 Number format 245 Number formats 265 Number of cycles for animation 64, 65, 66 Number of ellipse points 70 number of zones 21 numberformat subcommand 245 Numbers formatting in macro variables 24 NUMPTSALLOWEDBEFOREAPPROX 147 NUMSMOOTHPASSES 143 NUMSTREAMRAKE 122 NUMSTREAMRAKEPOINTS 122 NUMSTREAMSURFACEPOINTS 122 301 INDEX O Object size 74, 76 OKTOEXECUTESYSTEMCOMMAND 148 Opaque types 284 OpenGL rendering settings 248 OpenGL rendering 248 OPENGLCONFIG 148 Operating system using as variable 21 Operating system instructions 202 Optional box settings 251 Optional parameters 17 Output file configuration 112 OUTPUTASCIIDATAFILE 113 OUTPUTBINARYDATAFILE 113 OUTPUTLAYOUTFILE 113 OUTPUTLAYOUTPACKAGEFILE 113 Overrides color map 240 P Page color 164 create page 166 name the current page 167 set next page to active 166 set previous page to current 166 set specifications 164 show grid 164 show ruler 164 Page control commands 165–167 Paper 246 color 164 fit within workspace view 214 grid spacing 263 set specifications 133, 164 show grid 164 show ruler 164 size 133, 246 Paper ruler spacing 263 Paper size 263 papersize subcommand 246 Parameter assignment 17 Parameter Assignment Values 257 Parameter assignment values 234 Parameter assignments 17, 257 Parameter subcommands 17, 235 Parameters data setup command 95 for CFD Analyzer macro commands 220 Parameters for dynamic frame attributes 121 Paste 173 from view paste buffer 211 Paths configuring for output 112 Pattern length 70 Pause macro execution 167 PERCENTAGEOFPOINTSTOKEEP 148 Pick copy picked objects 170 302 delete picked objects 170 global edit on picked objects 170 magnify picked objects 172 mouse mode set 173 move picked objects 174 object at given location 167 objects in rectangle 168 objects of type 168 objects to delete 170 paste picked objects from buffer 173 pop picked objects 173 push picked objects back 173 Pick commands 167–174 PICKHANDLEWIDTH 148 Planes animate 62 Plot Approximation 263 Plot layers 109, 160 field plots 109 Plot Type 263 Plot Types Vector 265 PLOTAPPROXIMATIONMODE 148 Plotting points 263 Points write to file 216 Points to plot 263 POINTTEXTSIZES 77 Polar axes attributes 175 Polar coordinates convert to rectangular 175 Polyline extracting data 108 raw data 269 Popping picked objects 173 Position text example 252 Precise dot grid 246 precisegrid subcommand 246 Preferences basic color 73 basic size 74, 76 show coordinates 142 PREPLOTARGS 96 Print last file name printed 21 PRINTDEBUG 148 Printers 263 rendering 263 Printing attributes 176 to paper or file 176 Prompt commands 178–179 Push picked objects 173 view stack 211 Python scripting 277–?? arrays 283 convenience functions 286–290 import modules 279 input types 281–285 NULL pointers 283 opaque types 284 output types 285 Q Query dialogs 178 Query functions 124–127 Quick Edit colors 263 Quick Macro Panel 12, 163 title 58 QUICKCOLORMODE 148 Quit command 180 R Range Parameters 59, 228 Raster Metafile 106 Raw data 93, 108, 202 circle 270 color map 269 contour level 269 contour levels 270 geometry 269 line segment geometry 270 RGB values 270 section of macro commands 269 square 269 values 269 XY 270 XYZ 270 Raw User-Defined color maps 240 RAWDATA example 270 Read data 181 rect subcommand 246 Rectangle 246 raw data 269 Rectangles 246 settings 246 Rectangular zones create 92 Redraw 183 Redraw All 184 Reference scatter symbol 137 attributes 247 Reference scatter symbols 247 refscatsymbol subcommand 247 Remove user-defined macro variable 184 rendconfig subcommand 248 Rendering off-screen 150 with OpenGL 248 Retaining macro function 11 RGB 249 components 73 rgb subcommand 249 Rotate 2D plot 186 3D plots 138, 187, 204 Rotate a 3D plot example 19 ROTATION details 148 Rotation 264 axis 264 origin location 264 reset rotation origin 185 rotation origin 185 Ruler 164, 263 RULERPADDING 149 RULERTHICKNESS 149 RUNDISPLAYLISTSAFTERBUILDING 148 Running macro function 23 Running macros from the command line 11 from the Quick Macro Panel 12 from the tecplot interface 11 Tecplot 11 S Save color map 216 curve information 216 data set 216 stylesheet 217 SAVEINTEGRATIONRESULTS macro command 220, 229 SCALE 149 Scale factors reset 186 Scatter legend 136, 153 sizing by variable 136, 153 Scatter attributes 111 Scatter plot show 109 Scatter plots 111 set global attributes 136 Scatter symbol attributes 247 Scatter symbols 247 Scope of text 70 Scratch data type 95 SCRATCHDATAFIELDTYPE 96 SCRBACKGROUNDCOLOR 149 SCREENRENDERING 148 Scripting Python 277–?? Select objects 167 SETFIELDVARIABLES macro command 220, 230 SETFLUIDPROPERTIES macro command 220, 230 SETGEOMETRYANDBOUNDARIES macro command 220, 232 SETREFERENCEANDFIELDVARIABLES macro command 232 SETREFERENCEVALUES macro command 220 Setting (X,Y,Z) triplets 255 Setting (X,Y) positions 255 Setting attributes reference scatter symbols 247, 248 Setting color values 249 Setting I-, J-, or K-indices 244 Setting index ranges 244 Setting number formats 245 Setting symbol shapes 250 Setting zebra shading attributes 255 303 INDEX Settings OpenGL rendering 248 SETUNSTEADYFLOWOPTIONS macro command 220, 233 SetValue commands in color map files 273 macro configuration files 273 Shade attributes 111 Shade maps 249 shademap subcommand 249 Shading 249 Shift picked objects 174 SHOWCONTINUOUSSTATUS 149 SHOWCOORDINATES 149 SHOWCOORDINATESWITHSELECTORADJUSTOR 1 49 SHOWFRAMEBORDERSWHENOFF 149 -showpanel flag 12 SHOWSTATUSLINE 149 SHOWTEXTGEOMSINAPPROXVIEW 149 SHOWWAITDIALOGS 149 Simple zone create 92 Single angle brackets 235, 257 Size 239 object 74, 76 paper 133 preference 76 set command in macros 74, 76 Size limitations macro control commands 273 Size lists 239 Size preferences 76 Size units 264 Sketch axis 192 Skip mode 264 Slice animate 65 create slice zone command 93 Plane type assigned 21 positioning 21 Slice source 264 Slices 264 create zones 94 global settings 193 Slicing 264 Small Rainbow color maps 81 SMALLSTEP 149 SMOOTHBNDRYCOND 143 Smoothing data 197 SMOOTHWEIGHT 143 SNAPTOGRID 131 SNAPTOPAPER 132 Solution time 21 Source maps 101 Source zones 89, 90, 91 Specify fieldmaps 57 line maps 58 STARTSLICEPOS 21 Steps per cycle in animation 66 STEPSIZE 149 304 Stipple 264 Stop macro execution 167 Stream dashes animation 66 Stream markers animation 66 STREAMSTARTPOS 21 Streamtrace positioning 21 Streamtrace commands 197–202 add 199 delete all 201 delete range 201 reset time increments 201 set termination line 202 Streamtrace paths 66 Streamtraces animate 66 animation dashes or markers 66 create zones 95 delete all 201 direction 264 global settings 197 type 264 STREAMTYPE 21 Strings assigning 23 STROKEFONTLINETHICKNESS 115 STYLEFILE 113 Stylesheet read 183 write to file 217 Stylesheets macro control commands 273 Subscript 115 SUBSUPFRACTION 115 SunRaster format options 264 Superscript 115 Surface Effects 110 Surfaces to plot 265 Symbol shape 250, 261 Symbol shapes setting 250 Symbols line plots 160 symbolshape subcommand 250 SYMBOLSIZES 77 Syntax example macros 268 for CFD Analyzer macro commands 220 System command instructions 202 System environment variables 22 T TECHOME using as variable 21 Tecplot starting 5 Tecplot Interface 11 Tecplot interface set attributes 142 Tecplot macro 9 tecplot.mcr 12 TEMPFILEPATH 114 Text 251 anchor 72, 265 angle 72 attach command 71 attributes 71, 97 box 72 centering 73 character height 251 color 72 copy to another frame 218 default 97 defaults 97 display 167 fonts 72, 252, 260 frame 71 height 252 label box 251 label details 252 line spacing 72 prompt for 178, 179 setting font and position 252 setting fonts 251 shape 251 spacing 115 subscript 115 superscript 115 text box 72 thickness 252 zone (attach) 72 Text box 72 Text boxes 251, 265 Text shape 72 Textbox 72 textbox subcommand 251 textshape subcommand 251 Tick marks 253 attributes 253 axis 253 directions 265 label formatting 252 labels 252, 253 setting attributes 254 ticklabeldetail subcommand 252 TICKLENGTHS 77 Tickmark labels alignment 261 tickmarkdetail subcommand 253 TIFF byte order 265 Time Animation 66 Title data set 189 Transform coordinates 205 polar to rectangular coordinates 175 Translate view 212 workspace view 214 Translate picked objects 174 TRANSLATION 149 Translucency 265 TRIANGLEKEEPFACTOR 143 U Undo view only 211 UNIXHELPBROWSERCMD 150 USEAPPROXIMATEPLOTS 150 USEDISPLAYLISTS 150 USEDOUBLEBUFFERING 150 User input dialogs 178 User interface launch dialog 155 set attributes 142 User-defined variables 22 USETECPLOTPRINTDRIVERS 150 V Value blanking 77, 265 cell mode 265 Values display 136, 137 macro variables 19 set field value 189 Variable lists 161 Variables 3D axis 204 assign to 2D axis 175, 207 assign to 3D axes 203 assigning values 208 contours 129 environment 22 initializing 208 internal 19 location 126 macro functions 23 remove user-defined macro variable 184 renaming 184 scatter symbol sizing 136, 153 variable number 126 vector 140, 141 VECTDEFLEN 122 VECTMINLEN 122 Vector plot attributes 139 Vector plots 265 variables 140 vector format 111 Vector variables 141 minimum/maximum as variables 20 Vectors length reset 186 reference vector 139, 141 Vectors plot show 109 Vertical bars (’|’s) 19 View axis fit 209 axis nice fit 209 center 210 copy 210 data fit 210 fit 210, 211 fit all frames 214 fit paper in workspace 214 fit selected frames 214 last 211 305 INDEX magnify 212 maximize 215 maximize workspace view 214 nice fit 211 paste 211 return to last view 214 rotate 187 shift workspace 214 translate 212 zoom workspace 215 View commands 208–213, 213–215 View compound function family 208 View mode 265 View stack 211 retrieve last view 211 Viewer/Debugger 9 volume attributes 111 Volume objects 254 Volume surfaces create FE surfaces 90 VOLUMEMODE 111 volumeobjectstoplot subcommand 254 W While command 213 Workspace color map dialog 81 view 214 translate 214 unmaximize 215 view mode 265 Workspace commands 213–215 Write color map 216 data set 216 stylesheet 217 X X-axis gridlines 243 XORCOLOR 150 XY raw data 270 XY Line axes attributes assign 218 XY line plots coordinate scale 258 curve information 258 curve type 258 error bars 260 XY mapping function dependency 260 xy subcommand 255 XY vectors 255 XYZ raw data 270 vectors 255 xyz subcommand 255 Z Z-clip 138, 204 Zebra shading 255 attributes 255 zebrashade subcommand 255 Zone 306 animation 66, 67 attach geometry 70 attributes 109 Zone boundaries finite-element data 89 for finite element data 89 Zone numbers specify 60 Zones 21, 70 animate 66, 67 attributes 273 concatenate 95 create 87–88, 94–95 create isozones command 90 create mirrors 90 create rectangular 91 defaults 273 delete 99 duplicate 101 FE surface 90 new 92 streamtraces 94 renaming 185 specify number 60 triangulate 206 Zoom picked objects 172 view 212 workspace view 215


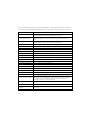
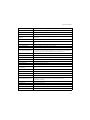


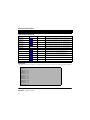
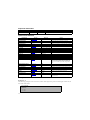
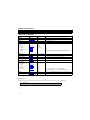
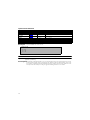
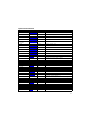

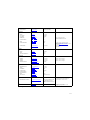
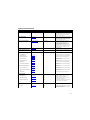
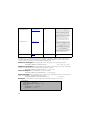
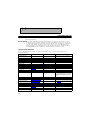
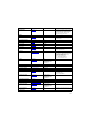
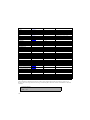
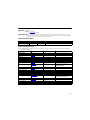
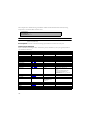
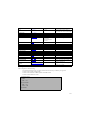
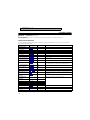
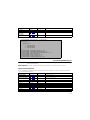
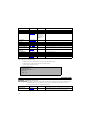
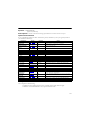
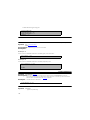
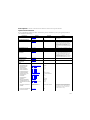
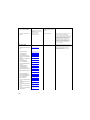
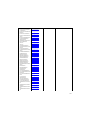
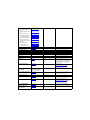
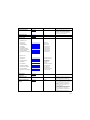
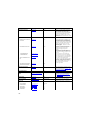
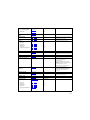
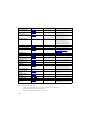
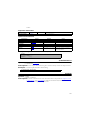
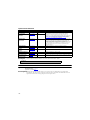
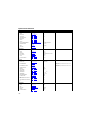
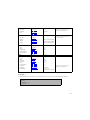
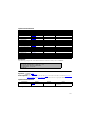
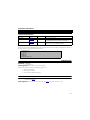
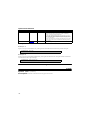
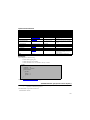
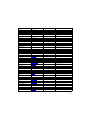
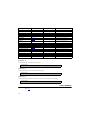
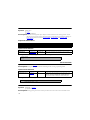

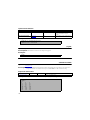
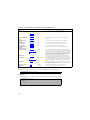

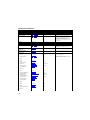
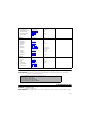
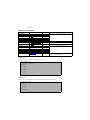


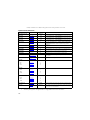
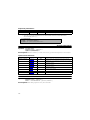
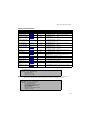
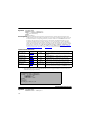
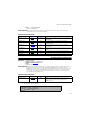
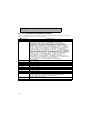
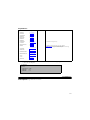

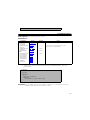
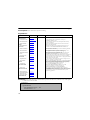


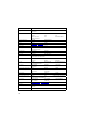
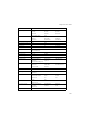
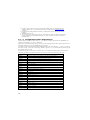
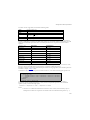
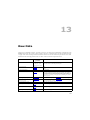
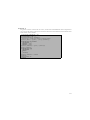


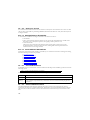
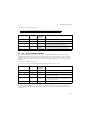
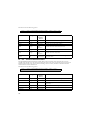
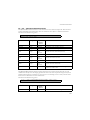
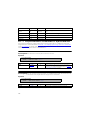

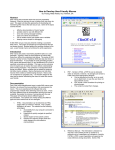


![[ ] playback mode](http://vs1.manualzilla.com/store/data/005894332_1-eb04455062e124c285a30d79ed1ad6c3-150x150.png)