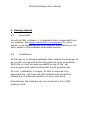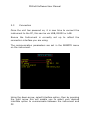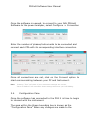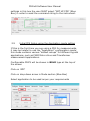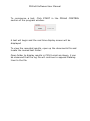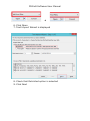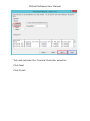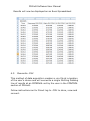
1
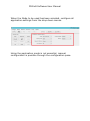
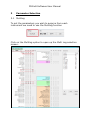
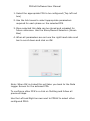
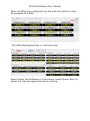
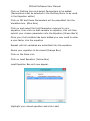
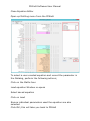
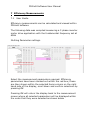
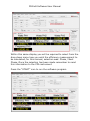
PPALoG
Data Logging
Software
Software User
Manual
V3_0e
PPAloG Software User Manual
ABOUT THIS MANUAL
PPAloG is a self contained executable software program for use
with the N4L PPA500, PPA1500, PPA2500, PPA2600 and
PPA5500 power analyzers.
Accordingly, this manual first describes the general features
and specification of the software as a whole; and then
describes the individual functions in detail.
Each function is described in turn, in its own chapter, with
details of the principles on which it is based, how to use it, the
options available, display options etc.
Revision:
This manual is copyright © 2004-2013 Newtons4th Ltd. and all
rights are reserved. No part may be copied or reproduced in
any form without prior written consent.
30th July 2013
PPAloG Software User Manual
CONTENTS
Introduction – general principles of operation .............
1
1.1
2
Introduction…………………………………………………………………………
Getting started ......................................................
2.1
2.2
2.3
2.4
Download...................................................................
Installation.................................................................
Connection.................................................................
Configuration Pane......................................................
Initial PPA set up using the APP mode setting....................
2.5
3
Parameter Selection................................................
3.1
3.2
4
Multilog ......................................................................
Datalog Interval ..........................................................
Data Setting Option ................................................
4.1
4.2
4.3
4.4
4.5
4.6
4.7
5
Manual Setting ............................................................
Log. Real time table .....................................................
Completing a test, Saving and Clearing Data ...................
Direct log to .csv .........................................................
Overwrite .csv .............................................................
Export ........................................................................
Export to .csv option ....................................................
High Speed Mode ...................................................
5.1
6
User Guide.................................................................
Maths Mode and Equation Editor ...............................
6.1
7
8
User Guide ..................................................................
Efficiency Measurements……………………………………………….
7.1
User Guide.................................................................
Oscilloscope Mode ..................................................
8.1
9
User Guide ................................................................
Screen Grab from PPA screen ...................................
9.1
10
User Guide.................................................................
Harmonics Analyzer.............................................
10.1
User Guide.................................................................
PPAloG Software User Manual
APPENDICES
Appendix A
Configurable parameters
Appendix B
Contact details
PPAloG Software User Manual
1 Introduction – general principles of operation
1.1
Introduction
PPALoG is a self contained executable software program written
in C++ using the Microsoft win32 graphics set.
PPALoG has the ability to connect to the PPA series of
instruments via RS232, USB and LAN. The software includes all
measurement modes to reflect instrument operation.
The ability to export directly to excel is supported by PPALoG
Firmware V2_106 was used to compile this User Manual
PPAloG Software User Manual
2 Getting started
2.1
Download
As with all N4L software, it is available free to download from
our website. See www.newtons4th.com/support for more
details, once registered and your account is activated you will
have access to the software downloads section.
2.2
Installation
At N4L we try to develop software that enables the engineer to
be up and running and performing tests as soon as possible.
With this in mind we have avoided the use of the .net
environment and used the Microsoft win32 graphics set.
As such, installation is simple. All that is required is to
download the .exe from the N4L website and extract the
software to the desired location on your hard drive.
Alternatively the software can be run directly from USB
memory stick.
PPAloG Software User Manual
2.3
Connection
Once the unit has powered on, it is now time to connect the
instrument to the PC, this can be via USB, RS232 or LAN.
Ensure the Instrument is correctly set up to reflect the
connection interface you are using.
The communication parameters are set in the REMOTE menu
on the instrument.
Using the down arrow, select Interface option, then by pressing
the right arrow this will enable you to select your desired
interface option to communicate between the instrument and
PC.
PPAloG Software User Manual
Once the software is opened, to connect to your N4L PPALoG
Software to the power analyser, select Configure -> Connection
Enter the number of phases/instruments to be connected and
connect each PPA with its corresponding interface connection.
Once all connections are set, click on the Connect option to
start communicating between your PC and Instrument.
Note:
2.4
Pressing “Test” will check if your connection settings are correct,
“Save as Default” will remember these settings whenever you load PPAlog
Configuration Pane
Once the software has connected to the PPA it is time to begin
to interact with the instrument.
The area within the Green bounding box is known as the
“Configuration Pane” When any changes are made to the
PPAloG Software User Manual
settings in this box the user MUST select “SET UP PPA” (Blue
Box) in order to send the command string to the instrument.
2.5
Initial PPA Setup using the Application mode setting
If this is the first time you are using a PPA for measurements,
it may be helpful to use the “Application” configuration mode,
this mode contains various “default setups” for different typical
applications, such as PWM Motor drive and Transformer
measurement applications.
Configurable PPA’S will be shown in BOLD type at the top of
the screen
Click on ‘APP’
Click on drop down arrow in Mode section (Blue Box)
Select application to be used as per your requirements
PPAloG Software User Manual
When the Mode to be used has been selected, configure all
application settings from the drop down menus.
Using the application mode is not essential, manual
configuration is possible through the configuration pane.
PPAloG Software User Manual
3
Parameter Selection
3.1 Multilog
To set the parameters you wish to acquire from each
instrument we need to use the Multilog function
Click on the Multilog option to open up the Multi Log selection
screen.
PPAloG Software User Manual
1. Select the appropriate PPA to be configured (Top left red
box)
2. Use the tick boxes to select appropriate parameters
required for each phase on the selected PPA
3. Once selected this data can be stored and reloaded for
future reference. Use the Store/Record Selection (Green
Box)
4. When all parameters are set use the right hand side scroll
bar to scroll down and click on OK.
Note: When OK is clicked this will take you back to the Data
Logger Screen for the actioned PPA.
To configure other PPA’s re click on Multilog and follow all
previous steps.
Use the Left and Right arrows next to PPAXX to select other
configured PPA’s
PPAloG Software User Manual
When all PPA’s are configured use the view all button to view
all available PPA data
The data displayed will be in real time view
Select either the Software or Instrument mode (Green Box) to
select the interval speed desired for testing.
PPAloG Software User Manual
3.2 Datalog Interval
Software – Datalog interval is selected in the Interval window
in the software and the software will periodically send a
MULTILOG? command to the instrument at the interval selected
in the software.
Instrument – Speed selected within the ACQU speed window,
this directly sets the window size on the PPA and the software
update rate will depend upon new data being available from
the PPA. In essence the software is in slave mode and the
power analyzer is the master.
Note: In the Instrument mode the PPA display screen will
freeze whilst log is running, but will unfreeze when log is
stopped
Click on the Start window (Blue Box) to commence the test.
PPAloG Software User Manual
4
Data Setting Options
Once the instrument has been configured and the Multilog
parameters set, we can start testing our device and recording
data, these can be viewed in the 4 following formats.
4.1
Manual Setting:
In this mode the operator will be able to Start/Stop the display
and gather the displayed data during a device’s test cycle.
Notes can also be added to aid reading of results (shown
below);
Select Manual log from the Data Settings Menu
A text string may be entered into the notes
field; this can be used to highlight a mode
change in the device under test in order to
make sense of a trend in the recorded data.
PPAloG Software User Manual
By clicking on the Real Time icon, we are presented with the
“Real Time Display”
Real time windows will now start showing the results.
Click “Stop” to pause the test
Click “Log” (Yellow Box) this will bring up an initially empty log
data sheet
At this point before we review our data you are able to add any
notes relating to this section of the test.
Add text into “Notes” (Blue Box)
Click “Append” (Green Box). This will now record all results *at
this appropriate point in the test* and display them on the first
line with any notes you have inputted
PPAloG Software User Manual
You are now able to select the Start, Stop, Real Time and
Append icons to record more data.
Remember to enter any new notes in the Notes box before
selecting Append to view your results (Stop will display when
Start is activated)
After a period of time you will build up a Data Log of all your
results
*Notes field relates to different parameters within your test
cycle*
PPAloG Software User Manual
4.2
Log, real time table:
In the Log, real time table mode the software will allow all data
parameters selected in Multilog to be viewed as the device is
under test conditions and recorded in a Datalog. Results can be
viewed in 3 formats: Real Time, Graph and Log. All will be
displayed and updated according to the time set within the
Datalog Interval control section.
Real Time:
PPAloG Software User Manual
Graph:
Log:
PPAloG Software User Manual
4.3
Completing a Test, saving and clearing data
When the user has completed their analysis, the Stop Icon can
be clicked and any Data up to this point can be viewed, the
user will then have 2 options, to continue the test with the
START button to enable more analysis to be collected, export
existing data** or CLEAR LOG,
**For exporting, please see section 4.6**
If CLEAR LOG is selected, a prompt will now ask you to confirm
if you would like to save your Multilog Results?
Clicking the Yes button will open up the “Select file for CSV
logging window” to enable the data to be saved to a selected
file in the users documents folder.
Clicking No will clear all data from the PPAloG screen
PPAloG Software User Manual
4.4
Direct log to .CSV (Comma Separated Values)
In the Direct log to .CSV option the software will collect and
store all results in a CSV file, that will be stored and viewed
within the users documents folder, once stored the file can be
converted into an Excel spreadsheet file. This file can be used
by external datalogging programs such as Labview to log data
from the PPA without the burden of directly controlling the
instrument.
Select: Direct log to .CSV
Click in CSV file box: This will take you to the
documents library
Name the folder where you wish your results to be saved, as
described below:
Click Save (Blue Box). The file will now be stored within your
documents folder
PPAloG Software User Manual
To commence a test, Click START in the PPAloG CONTROL
section of the program window.
A test will begin and the real time display screen will be
displayed
To view the recorded results, open up the documents file and
locate the named test folder.
Open folder to display results in CSV format as shown, it can
be observed that the log file will continue to append Datalog
lines to the file.
PPAloG Software User Manual
To convert your CSV data file into an excel spreadsheet.
1. Open Microsoft Excel
2. Click on Windows icon in top left hand corner
3. Click on Open
4. Select File to convert
5. Change ‘all excel files’ to ‘Text files’
PPAloG Software User Manual
→
6. Click Open
7. Text Import Wizard is displayed
8. Check that Delimited option is selected
9. Click Next
PPAloG Software User Manual
Tick and activate the ‘Comma’ Delimiter selection
Click Next
Click Finish
PPAloG Software User Manual
Results will now be displayed as an Excel Spreadsheet
4.5
Overwrite .CSV
This method of data acquisition creates a .csv file at a location
of the user’s choice and will overwrite a single Multilog Datalog
line of results at an INTERVAL set by the user in the CONTROL
section of PPALoG.
Follow instructions as for Direct log to .CSV to store, view and
convert.
PPAloG Software User Manual
4.6
Export
Within the Data settings options the software allows the user to
select how they wish to save and view all data collected. By
clicking on the Export button in any of the 4 data settings a
window will open for the user to select which option they would
like to choose.
Export to Excel will take the data and instantly open up an
Excel file with all results populated. This will allow the user to
save files for later analysis.
The data can be exported and viewed in 3 different formats
Standard – Data extracted as it is actually displayed
ie: 0.1234V
Engineering – Data extracted and displayed in an Engineering
format ie: 123.4mV
Scientific – Data extracted and displayed in a Scientific format
ie: 1.234 E-1
PPAloG Software User Manual
4.7
Export to .CSV option
In the .CSV option all data collected can be converted and
saved into a CSV (Comma Separated Value) file within the
documents folder on the computer’s hard drive
1. Click on the Export icon
2. Select Export to .CSV option
3. Click on (Yellow Box) this will take you to your documents
files
4. Select a folder to save the converted data to
5. This will now show in the File Location (Blue Box)
6. Click on OK to transfer data results
PPAloG Software User Manual
5
5.1
High Speed Mode
User Guide
High speed mode will be prompted when the window interval
speed selected is less than 100mS
When entering High Speed Mode there are certain
configurations that will submit a prompt asking whether or not
you wish to continue?
PPAloG Software User Manual
Should you require the sum data of specified parameters whilst
measuring in High Speed Mode you can set this up manually in
MATHS mode (Section 6) and select the user created
parameter in the Multilog Parameter selection window.
PPAloG Software User Manual
6
Maths mode and Equation Editor
6.1
User Guide
PPALoG supports the function of user created equations using
data selected in the Multilog selection pane.
Click on Configure at the top of the PPAloG
Click on Add / Edit Equations
This will open up the Equation Editor Box
PPAloG Software User Manual
Click on Multilog Icon and select Parameters to be added
(Parameters must be selected in the Multilog Menu to be used
in the Equation editor)
Click on OK and these Parameters will be populated into the
Variables box. (Blue Box)
Click on and select the first Parameter required in your
equation, then click on Add variable to equation, this will then
submit your chosen parameter into the Equation (Green Box’s)
Once your first variable has been added you now need to enter
a sum factor into the equation
Repeat until all variables are submitted into the equation.
Name your equation to be saved (Orange Box)
Click on the Save icon
Click on Load Equation (Yellow Box)
Load Equation Box will now appear.
Highlight your saved equation and click Load
PPAloG Software User Manual
Close Equation Editor
Open up Multilog menu from the PPAloG
To select a user created equation and record the parameter in
the Datalog, perform the following actions;
Click on the Maths Icon
Load equation Window re-opens
Select saved equation
Click on Load
Ensure individual parameters used the equation are also
selected
Click OK; this will take you back to PPAloG
PPAloG Software User Manual
7 Efficiency Measurements
7.1
User Guide
Efficiency measurements can be calculated and viewed within
PPALoG software
The following data was compiled measuring a 3 phase inverter
motor drive application with the fundamental frequency set at
65Hz
Multilog Parameter settings.
Select the measurement parameters required. Efficiency
parameters have been marked out within the red box; these
are then shown within the selected items column on the right
hand side of the display, scroll down and confirm selections by
pressing OK
Pressing OK will return the display back to the measurement
screen where all selected parameters will be displayed within
the order that they were selected as shown below
PPAloG Software User Manual
Within this same display you will be required to select from the
drop down menu how you wish the efficiency measurement to
be calculated, for this manual, selection was: Phase / Next
Phase. Once the selection has been made remember to send
this information to the PPA instrument
Press the “START” icon to run the software program
PPAloG Software User Manual
Efficiency measurements will be taken, calculated and
displayed as per the configuration set earlier. From our
selection of Phase / Next Phase then:
Efficiency PH1 = Watts PH1 / Watts PH2
Efficiency PH2 = Watts PH2 / Watts PH3
Efficiency PH3 = Watts PH3 / Watts PH1
PPAloG Software User Manual
8 Oscilloscope Mode
8.1
User Guide
In this section we will describe the use of the oscilloscope
mode, during this test the test subject was a 3 Phase PWM
Inverter, supplying a 3 Phase induction motor.
To enter Oscilloscope mode and change oscilloscope settings,
in the PPAloG screen click on the Mode Icon.
Use the drop down menu from the Operation Mode and select
Oscilloscope. (Red Boxes)
Set the Timebase Parameter (Blue Box)
Click on ‘SET UP PPA’ (Orange Box)
Click on Scope (Green Box)
Other oscilloscope settings can be set in this configuration
pane.
Click on SINGLE or CONTINUOUS to display the waveform.
Scope data will now be displayed in PPA screen
PPAloG Software User Manual
Single mode will display the waveform data when the button is
clicked.
Continuous will display a continuously updated waveform on
the display.
Set Voltage/Current/Both to be viewed on screen (Brown Box)
PPAloG Software User Manual
9
Screen grab from PPA screen.
9.1
User Guide
Click on Capture in the Datalog main menu
Screen Capture window will open
Click on Colour Download
Downloading will begin as shown below
PPAloG Software User Manual
Once downloading has completed your PPA screen shot will be
published into the blank panel.
Black and white screen grab is also available and will perform
the download in a shorter period of time.
PPAloG Software User Manual
10
10.1
Harmonics Analyzer
User Guide
In the PPAloG screen, click on the Mode Icon
Use the drop down menu from the Operation Mode and select
Harmonic Analyzer. (Red Boxes)
Select Harmonic parameters
Set your required configuration, in the screenshot above
Harmonic Series computation and 50 Harmonics will be
recorded.
Click ‘SET UP PPA’
Click on Harmonics in the PPA header
Harmonics display screen will now be present
Click on start in Harmonics Control to begin datalogging
harmonic data.
PPAloG Software User Manual
Harmonics data will now be collected. Click on Stop once
completed and to review results.
Harmonic results can now be viewed in either a Table or Graph
format by selecting the appropriate Icon (Blue Box)
To zoom in on the graph data, use the Zoom Icon’s (Yellow
Box). You now have the opportunity to view the graph with
either parameters selected or both together
To view a snapshot of any given Harmonic result (Red Box-H39
Voltage shown) hover your mouse over the appropriate
Harmonic to be viewed
PPAloG Software User Manual
All results can be stored in either an Excel or .CSV format by
selecting the appropriate Icon to click (Green Box)
If you require any further assistance with the operation of
PPALoG please do not hesitate to contact your local distributor
or N4L on [email protected]