1
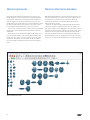
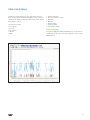
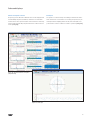
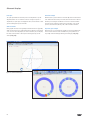
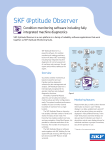
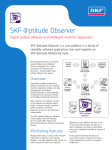
SKF @ptitude Observer
Condition monitoring software optimized to
collect and analyze continuous measurement
data from critical rotating machinery
SKF @ptitude Observer is the on-line application in a
family of reliability software applications that work
together as SKF @ptitude Monitoring Suite.
The SKF @ptitude Observer along with the
SKF Multilog IMx-M 19” rack mounted system is our most powerful solution for the
protection and condition monitoring of critical machinery. This solution has been carefully designed according to the API 670
standards.
By combining the SKF Multilog On-line
System IMx family of data acquisition
devices with the power of the SKF @ptitude
Observer version 10 software, delivers a
powerful condition monitoring solution
which can be ordered with or without the
advanced machine protection features.
Overview
Successful condition monitoring requires
powerful and user-friendly machine diagnostics software for data management and
analysis. SKF @ptitude Observer’s easy-touse operator interface and intelligent diagnostics functions provide users of all levels
the tools needed to set up and run effective
on-line monitoring programs.
SKF @ptitude Observer software works
together with the SKF Multilog On-line System IMx (all versions), SKF MasCon 48 (all
versions) and SKF MasCon 16 (all versions).
Within SKF @ptitude Observer, powerful
Wizards allow users to easily set up and
maintain machine and measurement configurations. The system’s optimized design
enables users to monitor several hundred
machines from a single location. In addition,
the SKF @ptitude Observer machinery
measurement hierarchy display is easy to
navigate and enables an unlimited number
of hierarchy levels, while clearly displaying
the alarm status of each hierarchy item.
Using SKF @ptitude Observer Workspaces,
it’s possible to easily extract portions of the
machinery measurement hierarchy for clarity and focused analysis and reporting on
areas of specific interest.
Monitoring features
Machine information database
Measurement data and relevant information are shown in userfriendly displays. Live data, updated every second (depending on
measurement configurations), and long term historical data can
easily be displayed in a variety of useful formats. A specific user
friendly feature is the multi-level process overview window, in which
live data and alarm indicators are shown in a descriptive control
room display for individual machines, or groups of machines.
In the system overview, the status of each of the system hardware
components is shown clearly displaying any system component
malfunction.
Historical data can be displayed in multiple trends, where one or
more monitored parameters can automatically be displayed and
compared to time, speed, or process parameters (such as, power,
temperature, water level, etc.). Live trends can also be updated
every second (again, depending on the measurement configurations).
With SKF @ptitude Observer’s machine information database, each
machine is defined by its mechanical components, and the interaction between the components is also defined. This allows all
machine fault frequencies to be dynamically calculated and displayed in frequency spectra.
Machines are easily defined by dragging and dropping machine
components together to build the machine (such as, shafts, bearings, gears, impellers, etc.) († fig. 2). For each component, relevant
information is defined (such as, bearing code, number of gear teeth,
number of vanes, etc.). Based on this information and the actual
shaft speeds, all fault frequencies are dynamically calculated and
advanced diagnostic rules are applied. In live spectrum mode, fault
frequencies are continuously updated based on current shaft speed.
Figure 2. Machine parts setup.
2
Advanced displays
In addition to standard displays such as single trend, spectrum
(FFT), and time waveform, SKF @ptitude Observer has a variety of
enhanced data displays for improved interpretation and root cause
failure analysis, such as:
• Enhanced trend plots
• Trend / Bode
• FFT tools
• Topology plot
• 3D plot
• Orbits
• Machine diagnostics
• Historical comparison of data
• Profile plot
• Polar plot
• Shaft centerline
• Transient analysis
• Improvedgear analysis
Enhanced trend plots
Trend plots († fig. 3) in SKF @ptitude Observer not only show the
overall value but also various important parameters such as, speed,
BOV and bands.
Figure 3. Advanced trend plot.
3
Advanced displays
In a multi trend plot († fig. 4), several measurements are displayed
together and the overall values are displayed as bars for easy comparison.
Trend/Bode
Vibration amplitude / phase can be trended as a function of time,
speed, or any process parameter recorded. It is possible to trend discrete frequencies (fixed or speed following) with a user selected
number of harmonics, or a user selected frequency range. Data
from different measurements can be overlaid in the same plot for
easy comparison.
FFT tools
Frequency plots († fig. 5) include useful tools for identifying peaks
such as bearing markers, sideband cursors, etc.
Harmonic frequencies can be displayed for any specified fundamental frequency. The system automatically calculates the best fit
for the harmonic frequencies, making harmonic effects much more
visible. This is often used together with machine component fault
frequencies.
Figure 4. Multi trend plot.
Figure 5. FFT with frequency markers plot.
4
Advanced displays
Topology plot
3D plot
Topology plots († fig. 6) are a powerful tool to illustrate frequency
spectra vs. speed or time. They use color separation, a method that
easily identifies variations in machine behavior. These plots are used
with any historical data, or during Run up / Coast down analysis.
A 3D plot († fig. 7) illustrates frequency spectra vs. speed, process
data or time. Users can freely zoom, rotate, or elevate the plot to
view the trace from any position. 3D plots are used with any historical data or during run up coast down analysis.
Figure 6. Topology plot.
Figure 7. 3D plot.
5
Advanced displays
Orbits
Machine diagnostics
Using signals from two orthogonally mounted transducers (typically
eddy current probes), shaft orbits can be displayed and analyzed
(† fig. 8). Orbits are performed using the raw signal (true orbit), or
using a filtered signal (filtered orbit) at shaft speed or shaft speed
harmonics, or at a user defined frequency range.
The powerful machine diagnostics feature includes standard rules
for common machine faults, such as unbalance, misalignment, various bearing faults, gear faults, cavitation, etc. User defined diagnosis
rules can also be easily implemented. SKF @ptitude Observer’s
machine diagnostics feature is always active, constantly monitoring
incoming data, detecting machine faults, and displaying clear text
alarms († fig. 9).
Figure 8. Orbit plot.
Figure 9. Diagnostics plot.
6
Advanced displays
Historical comparison of data
Profile plot
Frequency spectra collected at different times can be displayed and
be individually compared. In addition, subtraction of a selectable
measurement can be performed. User selected reference data may
be fixed, and automatically compared with new or earlier measurements († fig. 10).
The profile is a convenient way of visualizing a vibration time waveform referenced to one revolution of a rotating component. It is particularly useful for analyzing data from rolls, felts and similar components whose surface condition is critical to operation († fig. 11).
Figure 10. FFT, time waveform, and phase
plot (historical).
Figure 11. Profile plot.
7
Advanced displays
Polar plot
Transient analysis
The polar plot illustrates vibration phase and amplitude in a polar
diagram. Alarms are set as alarm circles for changes in phase or
amplitude. The polar plot can display live data, historical data or data
captured during Run up / Coast down.
Machine Run up / Coast down is automatically detected and starts a
user defined measurement procedure. Measurements are taken at
defined speed changes and all data is stored in a transient buffer.
The data can be viewed in a wide variety of displays, such as 3D,
spectra, time waveform, Bode, polar, orbit and shaft centerline.
Shaft centerline
Using signals from two orthogonally mounted transducers (typically
eddy current probes), the shaft radial position relative to the bearing
cross-section can be displayed. The shaft centerline plot can display
live data, historical data or data captured during Run up / Coast
down († fig. 12).
Improved gear analysis
Gear Inspector is a powerful time signal processing and display feature for better detection and visualization of gear problems. It is
especially useful for finding localized gear damage († fig. 13).
Figure 12. Shaft centerline plot.
Figure 13. Localized damage (left image, red / yellow colors).
8
Diagnosis and analysis
Process overview
The process overview is a graphical user
interface that allows users to use a machine
schematic, picture, etc. to show measurements, and status. It is fully configurable and
supports several levels († fig. 14).
Multi-parameter analysis
SKF @ptitude Observer provides a wealth of
tools and features for sophisticated multiparameter machinery analysis. For example,
the software supports oil quality monitoring
displays, blade monitoring displays and
more.
Alarms and warnings
In SKF @ptitude Observer, there are two
types of alarms – primary alarms (typically
checked every second, depending on measurement configuration) and secondary
Figure 14. Operator display plot.
alarms (checked at every system event and
at a time interval selected by the user).
For acceleration enveloping and vibration
Planning tools
measurement points, primary alarms perform at four different frequencies, fixed or speed dependent, with a selectable number of
harmonics and one frequency range. All measurement values can be Maintenance planner
exponentially averaged. Alarm levels can be configured to automatically adjust for speed and / or load variances. Primary alarms can
also be set to detect process measurement points for both high and
low alarms, with two levels each.
Secondary alarms are performed by advanced machine diagnostics, with sophisticated alarm conditions selected from an alarm
condition library or created by the user. Secondary alarms make a
diagnosis three months ahead. If a primary alarm is triggered, secondary alarm diagnostics are automatically performed.
For vibration measurements, both primary alarms and secondary
alarms can be utilized in acceleration, velocity or displacement
measurements, regardless of sensor type.
All alarms are transferred to SKF @ptitude Observer Monitor and
stored in the database together with corresponding measurement
data. The SKF @ptitude Observer Monitor computer can be
equipped with relay cards containing 16 relays each, fully programmable to respond to any type of alarm. Additionally, alarm information can also be distributed via e-mail or SMS.
Scheduled tasks such as lubrication, replacements, etc. can now be
planned and tracked efficiently via the maintenance planner. This
feature keeps track of machine assets, their running hours and
when maintenance is due. Actual machine running hours are measured and recorded with the SKF Multilog IMx.
Data export for ODS analysis
Data can be exported to a Universal file format which can be
imported into software that can do animation. This is especially useful when diagnosing complex problems involving multiple measurement points, such as when investigating structural or resonance
problems.
Data tagging of measurements
Condition monitoring often requires knowledge of operating parameters / conditions that may influence how data is interpreted or analyzed. With this feature, a text string can be appended to measurements either via manual input or automatically through OPC. This
text string “characteristic” can be used to view or classify data in a
variety of ways, such as by product type, specific asset (such as a
drive motor), model / manufacturer, etc.
9
Diagnosis and analysis
Reports
System integrity
SKF @ptitude Observer software has the capability to generate a
variety of useful reports. System diagrams, plots and images can be
included in reports along with tabular data and notes. Supplied
report templates allow quick and easy report configuration for
standard report setups. In addition, users may pre-configure and
save their own report setups for easy, quick regeneration (such as,
measurements in alarm, last measurement, etc.).
All reports can be sent to screen, PDF file, Word DOC file, RTF file,
Open Office or printer and also posted to Internet, intranet or
e-mailed.
In theory, on-line condition monitoring systems should always be
operating. If something happens that interrupts the monitoring, the
system must be able to detect the fault and report it to the operator.
If possible, the system itself should be able to correct the fault and
continue to operate.
Following is a description of the SKF @ptitude Observer system
integrity:
Storage
SKF @ptitude Observer software stores data in a Microsoft SQL
Server. Using the royalty free Microsoft SQL Server Express, the
database size can be up to 10 GB. Using a full version of Microsoft
SQL Server, database size is virtually unlimited.
All stored data is date and time stamped for later use in troubleshooting and trend analysis. Storage is performed in the following
methods:
Trend storage
Trend data consists of different trend buffers storing data typically
once every 10 seconds. Data is also stored in the archive buffer once
every ten minutes. All trend buffers and the archive buffer are using
a first-in-first-out process. Data is also stored in transient mode
(see transient analysis).
Spectrum and Time Domain storage
At a user defined time interval, manually, or upon a system event
(see below), vibration spectrum and time domain data is stored.
Spectrum and time domain data can be enabled for:
• vibration
• vibration, harmonic
• acceleration enveloping
• process FFT
Event related storage
Measurement points can be configured as members of “event
groups.” An event can be based on an alarm or a change in process
data. When an event occurs, based on data from one of the group
members, measurement data from all group members are stored.
Client / Server
SKF @ptitude Observer is a fully TCP/IP based client / server application, which means SKF @ptitude Observer Monitor can be connected to the Internet through a firewall and easily accessed from a
Windows-based computer anywhere that has SKF @ptitude
Observer installed.
10
• checks all sensor signals and reports on sensor failure
• easy for operator to disable a sensor upon sensor failure
• a “watchdog” looks after both the SKF Multilog On-line System
IMx/SKF MasCon units and the SKF @ptitude Observer Monitor
and reports, then restarts upon failure
• system faults are stored in the database and can be accessed by
the operator, for example, for access during system service
OPC support
SKF @ptitude Observer can be connected to other systems or
devices through an OPC server using the OPC standard communication protocol. Data transmission (data publication) of trend data and
alarm information, and data reception (data subscription) of process
data is fully supported.
Advanced balancing
Advanced balancing for SKF @ptitude Observer is an add-on for online applications to enable a full dynamic rotor balancing operation.
Balancing data is obtained from SKF Multilog On-line System IMx,
SKF MasCon48, and SKF MasCon16, and the balancing operation is
performed in a step-by-step method. Dynamic rotor balancing can
be performed from 1 up to 15 planes in one session, and if needed,
the number of correction planes can be reduced using balancing
plane elimination.
Data quality used by the balancing software is continuously
checked and displayed, allowing the operator to easily replace erroneous measurements. Balancing results, including the Influence
coefficient matrix, are stored in the SKF @ptitude Observer database. When rebalancing, stored balancing data can be quickly
recalled to minimize machine stops to one.
WebCon
SKF @ptitude Observer’s database fully supports WebCon, providing
data and alarm information to the WebCon web server which can be
accessed by any PC using Internet Explorer.
Features and capabilities
Alarms
Machine parts
• Alarm window
–– Quickly find and identify all points in alarm within the hierarchy,
process view or system view
• Alarm detail
–– Provides a summary of type of alarm and status
• Trend alarms
–– Trend alarms frequency can be fixed or speed following with a
selectable number of harmonics
–– The trend alarm level can be speed or process data dependent
following a user defined graph
–– Unlimited number of alarms can be configured in the system
–– Alarms based on data from multiple measurement points
–– Run up coast down alarming using speed dependent alarm levels
–– Vector alarms using circular alarm levels
–– Alarm hysteresis
–– Exponential filtering
–– Activation of user selectable on-line device relay for each alarm
level violation
–– Activation of user selectable SKF @ptitude Observer Monitor
device relay for each alarm level violation
–– User defined vibration unit selection (acceleration, velocity or
displacement)
–– Data storage selection (maximum, minimum or instant)
–– Alarm blocking (on/off)
–– Alarm groups
• Four overall alarm levels per measurement point
–– Danger high, alert high, alert low, danger low
–– Adaptive alarming whereas the trend alarm level can be speed
or process data dependent following a user defined graph
–– Enhanced event log capabilities
• Machine diagnostics
–– Alarms based on rules created to detect a particular machine
fault
–– Standard rules and user defined rules available
–– Clear text message on machine fault
• Active range
–– Speed range setting and/or process data range setting
–– Setting for maximum allowed speed and/or process data variation during measurement
–– Advanced data gating
• Graphical tool for machine library creation
• Automatic defect frequency calculation
• Automatic calculation of all shaft speeds
• Seamless connection to machine diagnostics
• Standard library
• Machine template
Communication
• Automatic e-mail or SMS generation upon alarm
• Data transfer with SKF Multilog On-line System IMx and SKF
MasCon. For other devices contact your local SKF Representative.
• TCP/IP
• RS232 or USB
• OPC – subscription as well as publication
• Modbus
Data display
All displays can be used in live mode for transient as well as for
steady-state analysis
• True orbit
• Filtered orbit
• Shaft centerline
• Polar (including circular alarm levels)
• Bode
• Profile
• Topology
• 3D plot
• Overall trend displays
• Process (Temperature, pressure, speed, etc.)
• Digital images
• Spectrum displays
• Single point, multiple point displays
• Triaxial point
• Time waveform
• Phase displays
• History plot
• Multi-channel display
• Trend list
• Process overview
–– Live update
–– Amplitude/phase
–– Speed
–– Links to other process views
–– Live bars
• Graph overlays
• Spectrum
–– Machine part defect frequency
–– Single, harmonic, sideband, peak, band cursors
–– Running speed
–– Spectral band alarm
–– Overall alarms
–– DiagX
11
Features and capabilities
• Display tools
–– Notes with image attachment and priority setting capability
–– Percent of alarm level setting
–– Auto scaling
–– Cursor micro-manipulation
–– Auto-linking of displays and active hierarchy
–– Linear or log scaling
–– Grid
–– Orders, frequency scaling
–– Amplitude threshold %
–– Waterfall slant angle setting in all directions
–– Date range setting
–– User selectable color settings
–– Waterfall spacing (time / date, speed or process data)
–– Spectrum data post processing (integration / differentiation)
–– Zero Padding
–– Inverse FFT
–– Baseline spectrum storage
–– Run-out compensation
–– User-individual display settings
Database
• Microsoft SQL Server 2005, 2008, 2012 or 2014
• ODBC, SQL and TCP/IP protocol compliant database opens the
database content
• User friendly database management
–– Back-up scheduling
–– Database upgrade
• Full support in Local Area Network (LAN), Wide Area Network
(WAN), and Thin client (Terminal) environments
• Unlimited number of:
–– Hierarchies
–– Hierarchy levels
–– Workspaces
–– Collection points
–– Measurements
• Smart data storage
–– Data storage based on time, speed variation, process data variation, alarm status, and trend variation
–– Exception based storage
• Capability of data reduction due to aging
• Database supports
–– XML data importing and exporting
–– Binary importing and exporting
–– Data export to Image file, Text, XML, HTML, Microsoft Excel
• Database libraries
–– Bearing library
–– Machine template library
–– Multi-folder image library
12
General
• Multiple languages available
• Windows-based functionality
–– True multi-processing operating environment allowing simultaneous background and foreground processing
–– Complete right click functionality (drop down menus)
–– Drag and drop
–– Cut/Copy/Paste
–– Complete integration of third party applications
• User preferences allow customization
• Context sensitive help
• Complete user manual on installation CD-ROM
Measurements
The following measurements can be entered manually or automatically
• Acceleration
• Amps
• Displacement
• English or metric units
• Enveloped acceleration
• Flow (GPM, LPM)
• High Frequency Detection (HFD) and Digital High Frequency
Detection (DHFD)
• Multi-channel
• Operating hours
• Operating time (elapsed and cumulative)
• Peak, Peak-to-peak, True peak, True peak-to-peak and RMS
• Pressure (PSI and bars)
• RPM
• Speed
• Temperature (°C and °F)
• Triax
• User-specific units
• Velocity
• Volts (AC or DC)
• Torsion
• Time difference
• Simultaneous speed, process and digital storage together with
vibration, speed or process measurement
• Derived point – user definable mathematical formula to calculate
a derived value from data collected on multiple points across all
type of devices.
Features and capabilities
Transient analysis
Multiple gating points
• Run up/Coast down measurements
• Run up/Coast down measurement point groups
• Vector, polar, shaft centerline, orbit, profile
• Adaptive alarming
• Run-out compensation
• Live data display update for multiple graphs
• MGP references values from up to five other points
• Uses logical gating to determine when to store a measurement
• Output indicates the operating condition that the data has been
collected
• Output two distinct operating conditions, which can reference
speed, process, and digital parameters
Event capture
Security
• Enables a long time waveform to be captured
• The duration of the waveform is user configured based selected
pre/post event trigger
• An Event Capture can be configured to trigger on any of the
following:
–– Based on an alarm in the Event Capture group for simple
alarms
–– When an alarm in the same alarm group as the Event Capture
exceeds a threshold, allowing for more complex alarms conditions
–– Manually started from the software at the press of a button
• Post processing calculates spectra and 3D (waterfall plot) based
on user selectable bands
• Utilizes SKF @ptitude Observer Diagnostic tools to aid analyis of
fault frequencies from the Machine Parts tool set
• Fully configurable user rights that allow you to read only or have
full access
• Pre-configured user roles (analyst, super user, operator)
• Password encryption for database login
Reports
• Preserved reports – enables you to maintain a history of reports
• Shared reports – allows you to share and pre-configure reports
for selected users
• Send reports to screen, PDF file, Word document, RTF, open
Office or printer
• Report file can be posted to internet, intranet or e-mailed
• Customizable report content
• Data plots, supplemental information, and digital images can be
included in reports
• Report types
–– Last measurement
–– Exception
–– Collection status
–– History
–– Work notification
–– Blank (user defined)
• Report templates allow quick and easy report configuration for
use and reuse
Monitoring system supervision
• BIAS range setting and alarm upon failure
• Measurement range setting and alarm upon failure
• SKF @ptitude Observer Monitor supervision
• On-line device supervision (automatic hardware reset)
• System supervision alarm distribution using e-mail and SMS
• On-line device and SKF @ptitude Observer Monitor device restart
upon failure
• Automatic remote firmware upgrade of all on-line devices (SKF
MasCon, SKF Multilog On-line System IMx)
• System event recording for all parameter modifications including
date/time and user information
Templates and wizards
• Machine parts creation wizard
• Multiple point update wizard
• Statistical alarm wizards use historical data to help refine machine
diagnostic alarms
• Hierarchy template wizard allows for rapid hierarchy creation and
machine templates for reuse
• Report template allows for the custom configuration of reports
and report templates for reuse
• Machine expert wizard
13
Hardware requirements
Stand alone configuration
• Running SKF @ptitude Observer
• Running Microsoft SQL Server database management system
• Storing data
Configuration
Minimum
requirements
Recommended
requirements
Operating system
(Note 1)
• Windows XP
Professional with
Service Pack 3
• Windows 7
• Windows 8
• Windows Vista
• Windows 2003
Server with Service
Pack 1
• Windows 2008
Server
Any of the specified
operating systems in
the minimum
requirements with the
latest service pack
available installed
Processor (Note 2)
Pentium IV, 1.0 GHz
Pentium IV, 2.4 GHz
or better
RAM
2.0 GB
2.0 GB or more
Disk space
available for
standalone
computer (Note 3)
1.2 GB
1.2 GB or more
DVD drive
One (1) required
One (1) required
Video display
(Note 4)
1366 ™ 768
1600 ™ 1200 or
larger
Microsoft SQL
Server
SQL Server 2005,
2008, 2012 or 2014
SQL Server 2005,
2008, 2012 or 2014
Network configuration – Server
• Running Microsoft SQL Server database management system
• Storing data
Minimum
requirements
Recommended
requirements
Operating system
(Note 1)
• Windows 2003
Server with Service
Pack 1
• Windows 2008
Server
Any of the specified
operating systems in
the minimum
requirements with the
latest service pack
available installed
Processor (Note 2)
Pentium IV, 2.0 GHz
Pentium IV, 3.2 GHz
or better
RAM
2.0 GB
2.0 GB or more
Disk space
available (Note 3)
1.2 GB
1.2 GB or more
Microsoft SQL
Server
SQL Server 2005,
2008, 2012 or 2014
SQL Server 2005,
2008, 2012 or 2014
Configuration
14
Network configuration – Network Client
• Running SKF @ptitude Observer
• Running database client software
Configuration
Minimum
requirements
Recommended
requirements
Operating system
(Note 1)
• Windows XP
Professional with
Service Pack 3
• Windows 7
• Windows 8
• Windows Vista
Any of the specified
operating systems in
the minimum
requirements with the
latest service pack
available installed
Processor (Note 2)
Pentium IV, 1.0 GHz
Pentium IV, 2.4 GHz
or better
RAM
1.0 GB
2.0 GB or more
Disk space
available for each
network client
500 MB
1.0 GB or more
DVD drive
One (1) required
One (1) required
Video display
(Note 4)
1366 ¥ 768
1600 ™ 1200 or
larger
Note 1
Supports 64 bit operating systems.
Note 2
These requirements apply to SKF @ptitude Observer complete with database management system. Other applications running simultaneously may degrade performance.
Note 3
These requirements ONLY apply to SKF @ptitude Observer complete with database
management system. Additional storage disk space is required for data.
Note 4
SKF @ptitude Observer is designed for windows font size of 100% (Smaller). Using any
larger font size can cause some of the interfaces / forms in SKF @ptitude Observer to
not fit the contents.
Notice
If running other versions of Microsoft SQL Server, or other database management system are expected to run in the same PC environment, please contact your local SKF
Representative to inquire about compatibility.
Ordering information
SKF Product Support Plans
• SKF @ptitude Observer software for On-line Systems
[CMSW 7600]
• SKF Multilog On-line System IMx-M Manager software, Single
Client [CMSW 7600-MMGR-SC]
–– Each SKF Multilog On-line System IMx-M Protection system
must be ordered with at least one license for the
CMSW 7600-MMGR-SC. This software application enables a
single client software license which allows a single user the
ability to configure or change the SKF Multilog IMx-M Protection system.
SKF is committed to customer support excellence. The goal of a SKF
Product Support Plan (PSP) is to help you increase and optimize
your return on investment in SKF products. This includes extending
the life of their product and facilitating the success of their program.
This allows you to compete in your industry, save downtime and be
on the cutting edge of technology.
SKF Product Support Plans give you full confidence that your
equipment is maintained to the SKF quality standards. Condition
monitoring products are an investment and there is no better way to
protect your investment for years than with a SKF Product Support
Plan.
The SKF @ptitude Observer is available in Single and Multi Client
configurations. Please contact your local SKF representative for
Multi Client model information.
Installation and training
Installation and training is available through your local SKF sales
representative.
Greater peace of mind
• Unlimited telephone technical support
• E-mail/web-based technical support
• Live chat technical support
• Software maintenance releases
• Software updates
• Remote Workstation access
• SKF Knowledge Centre subscription
• SKF Technical Support Self-Help Portal access
• Live webinar training notifications
• Web-based e-Learning courses
15
Please contact:
SKF Condition Monitoring Center – Luleå
Aurorum 30, S-977 75 • Luleå, Sweden
Tel: +46 (0) 31 337 10 00 • Fax: +46 (0) 920 134 40
Web: www.skf.com/cm
®SKF, @PTITUDE, MASCON and MULTILOG are registered trademarks of the SKF Group.
Microsoft, Windows, Excel, SQL Server, Internet Explorer, and Windows Vista are either registered
trademarks or trademarks of Microsoft Corporation in the United States and/or other countries.
All other trademarks are the property of their respective owners.
©SKF Group 2015
The contents of this publication are the copyright of the publisher and may not be reproduced (even
extracts) unless prior written permission is granted. Every care has been taken to ensure the accuracy
of the information contained in this publication but no liability can be accepted for any loss or damage
whether direct, indirect or consequential arising out of the use of the information contained herein.
SKF reserves the right to alter any part of this publication without prior notice.
PUB CM/P8 10253/5 EN · November 2015
skf.com