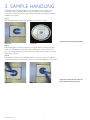
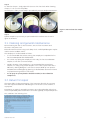
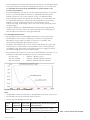
1
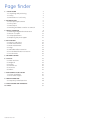
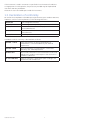
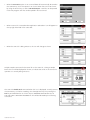
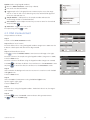
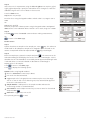
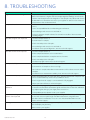
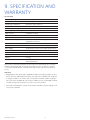
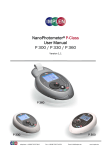
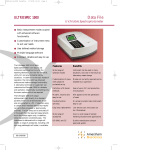
SimpliNano™
Product User Manual
Codes:
29061711 SimpliNano
29061712 SimpliNano with printer
29061713 SimpliNano (North American version)
29061714 SimpliNano with printer (North American version)
Page finder
1.INSTALLATION3
1.1. Unpacking and positioning
3
1.2. Safety
3
1.3. Declaration of conformity
4
2. INTRODUCTION5
2.1. Your Spectrophotometer
5
2.2. File system
5
2.3. Data export 6
2.4. Working with data stored on a USB stick 8
3. SAMPLE HANDLING9
3.1. Cleaning and general maintenance
11
3.2.Return for repair
11
3.3. Lamp replacement
12
3.4. Replacing the printer paper
12
4. APPLICATIONS13
4.1. Nucleic Acid Theory13
4.2. DNA measurement
15
4.3. RNA measurement
16
4.4. Oligo
17
4.5. Absorbance/Concentration
19
4.6. Protein determination at 280 nm20
4.7. Protein A280
20
5. METHODS FOLDER22
6. UTILITIES23
6.1. Date and time
23
6.2. Regional
23
6.3. Printer
24
6.4. Preferences
24
6.5. Contrast
24
6.6. About
24
7. ACCESSORIES INSTALLATION25
7.1. Printer installation
25
7.2. After Sales Support
27
8. TROUBLESHOOTING28
8.1. Frequently Asked Questions
29
9. SPECIFICATION AND WARRANTY
31
10. LEGAL32
29088793 AB 05-2014
2
1. INSTALLATION
1.1. Unpacking and positioning
• It is recommended that users read through this manual prior to use.
• Remove the instrument from its packaging and inspect it for signs of damage.
If any are discovered, inform your supplier immediately.
• The instrument must be placed on a stable, level surface that can take its weight
(~ 4.5 kg) and positioned such that air can circulate freely around the casing.
• Ensure your proposed installation site conforms to the environmental conditions
for safe operation.
• The instrument is designed for indoor use only, temperature range 5°C to 35°C
and should be kept away from strong draughts.
• If you use the instrument in a room subjected to extremes of temperature
change during the day, it may be necessary to recalibrate (by switching off and
then on again) once thermal equilibrium has been established (2–3 hours).
• A temperature change of no more than 4°C/hour and a maximum relative
humidity of 80% at 31°C, decreasing linearly to 50% at 40°C are required.
• If the instrument has just been unpacked or has been stored in a cold
environment, it should be allowed to come to thermal equilibrium for 2–3 hours
in the laboratory before switching on. This will prevent calibration failure as a
result of internal condensation.
• The instrument must be connected to the power supply with the power adaptor
supplied. The adaptor can be used on 90–240 V, 50–60 Hz supplies. It will become
warm once plugged into the power supply and should not be covered up.
• Switch on the instrument via the keypad ( ) after it has been plugged in.
The instrument will perform a series of self-diagnostic checks.
• Contact your supplier if you experience any difficulties with this instrument.
1.2. Safety
Spectrophotometer Health & Safety Document including General Operating
Instructions are available as a booklet provided with each instrument. The
booklet is translated into the European languages and is available on the User
Manual CD supplied with each instrument. The instructions cover basic operation,
troubleshooting and how to use the instrument in a safe manner.
CAUTION
The instruments contain a UV source which generates a light beam that
traverses the sample chamber and is accessible in the lamp chamber.
Under normal use the lamp beam is confined within the instrument.
The unit should not be operated with the lamp housing lid removed as
prolonged exposure to the beam may cause permanent eye damage.
WARNING
High voltages exist inside the SimpliNano instruments. Repair and
maintenance should only be carried out by individuals trained specifically
to work on these instruments.
29088793 AB 05-2014
3
If the instrument is used in a manner not specified or in environmental conditions
not appropriate for safe operation, the protection provided may be impaired and
instrument warranty withdrawn.
There are no user-serviceable parts inside this instrument.
1.3. Declaration of conformity
GE certifies that SimpliNano UV/Visible Spectrophotometers; part numbers 29061711,
29061712 conform to the requirements of the following Directives :-
2006/95/EC
Low voltage directive (LVD)
2004/108/EC
Electromagnetic Compatibility (EMC) directive
2012/19/EU
Waste Electrical and Electronic Equipment directive
recast (WEEE Recast)
2011/65/EU
Restriction on the use of certain hazardous substances
(ROHS) directive
2006/42/EC
Machinery directive
Standards to which conformity is declared are as follows:
EN61010 - 1:2010
Safety requirements for electrical equipment for
measurement, control and laboratory use. General
requirements
EN61326-1:2006
Electrical equipment for measurement, control and
laboratory use - EMC Requirements
EN50581:2012
Technical documentation for the assessment of electrical
and electronic products with respect to the restriction of
hazardous substances
EN ISO 12100:2010
Safety of machinery - General principles for design, risk
assessment and risk reduction
29088793 AB 05-2014
4
2. INTRODUCTION
2.1. Your Spectrophotometer
SimpliNano is a simple-to-use UV/Visible instrument with twin CCD array
detectors (1024 pixels). It has no moving parts, which is the basis of the rapid
scanning operating system.
Display
On/Off key
USB A connector
USB B connector to PC
Power input
Sample Port
Figure 1: SimpliNano Spectrophotometer
The SimpliNano is fitted with a micro volume sampling port with a fixed 0.5 mm
pathlength for measuring low volumes of highly absorbing life science samples
such as DNA, RNA and proteins.
2.2. File system
After switch on and automatic checking the instrument defaults to a home page
entitled ‘SimpliNano‘. This page displays seven folders which form the topmost
layer of a simple file tree which is the basis of the user-interface. The folder
screens are reached by pressing the appropriate number on the keypad, with
return to the top level by means of the ‘Esc’ key. The folders group various facilities
together as follows:1. DNA: Concentration and purity check for DNA samples
2. RNA: Concentration and purity check for RNA samples
3. Oligo: Concentration and purity check for Oligonucleotide samples
4. Absorbance Concentration measurement at a single wavelength based on
Concentration:a factor entered or calculated from a single standard.
5. Protein A280: Concentration and purity check for protein samples
6. Methods: Saved methods
7. Utilities: Instrument set up options
29088793 AB 05-2014
5
2.3. Data export
An integral printer is available for the instrument; this may be either supplied
pre-installed or as an optional accessory. The installation procedure is described
in section 7.1.
Figure 2: SimpliNano with Printer
Data can be transferred to a PC via a USB™ cable using the supplied software
“PVC” (Print Via Computer).
PVC can store data either in a common directory or can be configured to save
to independent directories by both file format and connection. The data may be
stored as an Excel spreadsheet, an EMF graphics file, a comma delimited (csv) data
file, a tab delimited (txt) data file or in native PVC format.
Some users may find it convenient to use PVC to “print through” the PC directly to
a local or networked printer.
Datrys Computer control software is also available for SimpliNano as an optional
extra.
The SimpliNano USB has the option to save data onto a USB stick in 2 different
formats, both formats save Method details, all measured results and all scan data
(if available in the application).
1. P
VC format that can only be opened by Print via Computer software from GE
Healthcare. Once a file has been opened in PVC it can be exported into ASCII
(comma or tab separated), text, Extensible meta format or Excel format (only if
Excel is installed on the PC).
2. Tab Separated Variable (TSV) allowing the data to be opened directly into Excel.
Please note that the USB stick needs to be placed into machine BEFORE
measurements are made and encrypted sticks & external hard drives are not
compatabile with this instrument.
• Insert USB memory stick into the connector on the right hand side of the
instrument. An audible click will be heard as the stick is recognised.
• On main menu screen choose Utilities option by pressing 7 on the keypad.
• T hen choose Printer option, by pressing 3 on the keypad, to choose Data
Export Options.
Data output can then be made from the Printer screen. Use arrow keys to
scroll down and choose settings.
29088793 AB 05-2014
6
• W
hen the Auto-Print option is set to OFF all data will automatically be saved to
the USB memory stick. The operator can choose either the TSV or PVC format
by using the arrows keys to select USB Stick Output – PVC files can be opened
in the PVC program. TSV files can be opened in Microsoft Excel.
• W
hen a USB stick is inserted and an application selected an icon will appear on
the top right hand side of the status bar.
• When the USB stick is being written to the icon will change as shown.
Multiple samples are stored in the same file on the USB stick – during a sample
batch the icon will be displayed as shown, to indicate that a file on the USB stick is
open but not currently being written to.
The USB stick should not be removed when this icon is displayed. To safely remove
the USB memory stick after a reading, close the application by first pressing the
ESC key and withdraw the stick from the port WARNING DATA MAY BE LOST IF
THE USB STICK IS REMOVED INCORRECTLY. This will be indicated by the following
notification.
29088793 AB 05-2014
7
Data transfer to USB can be carried out simultaneously with printing to a built in
printer (if fitted) or export to a PC running PVC software (if connected).
• T o transfer data simultaneously to PC, enter Printer options screen, use arrow
buttons on keypad to scroll th change settings as follows:
• Auto-Print setting: ON
• Printer: Computer (USB)
• USB Stick Output: TSV or PVC
• T o transfer data simultaneously to Printer, enter Printer options screen, use
arrow buttons on keypad to scroll th change settings as follows:
• Auto-Print setting: ON
• Printer: Built-in
• USB Stick Output: TSV or PVC
2.4. Working with data stored on a USB stick
For data stored in PVC fromat please refer to the PVC user manual or help file
within PVC software.
For data stored in TSV format insert the USB stick into a PC and use Windows
Explorer to navigate to the saved file which will be located in a folder named as
the instrument serial number. The file can then be opened in several ways:
1.Double clicking on the .txt file will open the file into Windows Notepad as follows.
2.Select the file, right mouse click and select Open With from the Menu and
select Microsoft Excel. Data will then open directly into Excel.
29088793 AB 05-2014
8
3. SAMPLE HANDLING
SimpliNano uses a simple sample port which enables users to quickly and
accurately measure samples without any moving parts. The sample port
comprises of 2 fibre optics which are fixed 0.5 mm apart. The sample should be
loaded into this space.
Step 1
Before measurement, inspect the sample port to ensure it is clean.
Figure 3a
Figure 3a and 3b: Sample port area
Figure 3b
Step 2
Pipette the reference solution into the port. A good reference will use the same
solvent as the sample. To ensure the correct placement of the solution in the
port, touch the pipette tip to the bottom of the sample reservoir and then slowly
dispense the solution.
Step 3
The sample or reference should be pipetted into the centre of the port and be in
contact with both port probes. Take care not to introduce bubbles into the sample.
Figure 4a
29088793 AB 05-2014
Figure 4a and 4b: How to correctly
load sample onto sample port
Figure 4b
9
Figure 5: The images display the
incorrect loading position of samples
Figure 5
Figure 6: The position and shape of
the drop shown in the image is the
optimum position for the sample
measurement to be made.
Figure 6
29088793 AB 05-2014
10
Step 4
To clean the the port, simply wipe with tissue or a lint free cloth. When cleaning
the port, it is ok to touch the probes.
Once the port is clean, you are ready to proceed with your next sample measurement.
Figure 7: How to clean the sample
port
Figure 7
Step 5
Pipette sample into port exactly as performed with the reference as shown in
figure 4a, 4b and 6.
3.1. Cleaning and general maintenance
Before cleaning the case of the instrument, switch off the instrument and
disconnect the power cord.
Clean all external surfaces using a soft damp cloth. A mild liquid detergent may be
used to remove stubborn marks.
The sample port can be cleaned as follows:
• It is recommended that, before starting, the sample port is wiped with a lint
free tissue dampened with distilled water.
• For routine use, wiping the sample port with a dry, lint-free tissue between
samples, is sufficient to remove sample.
• Periodic cleaning of the sample port is recommended after around 100
samples, or if using sticky protein samples. In this case, a quick wash with a
laboratory cleaning detergent is sufficient to remove build up from proteins
and DNA. Remove detergent by pipetting on distilled water (maximum volume
25 μl) and removing with a lint-free tissue.
• Use of spray or squeezy bottles should be avoided, as these flood the
sample area.
3.2. Return for repair
The responsibility for decontamination of the instrument lies with the customer.
The case may be cleaned with mild detergent or an alcohol such as ethanol or
Isopropanol.
Examination or repair of returned instruments cannot be undertaken unless they
are accompanied by a decontamination certificate signed by a responsible person.
This could be of the following form:-
29088793 AB 05-2014
11
3.3. Lamp replacement
The Xenon lamp should not need replacement until used for several years. In the
unlikely event that it fails, this should be undertaken by a service engineer from
your supplier.
3.4. Replacing the printer paper
Paper for the printer (20 rolls) is available from your supplier under part number
28918226.
Step 1 Keep the power on. Lift off the printer cover.
Step 2 Lock the platen (horizontal position) and feed the paper into the slot.
The drive will engage automatically and take up the paper.
Step 3 It may help to release the platen lock (turn flat green catch clockwise) and
turn the green knob manually.
Step 4 Replace the cover.
29088793 AB 05-2014
12
4. APPLICATIONS
SUMMARY:
Function
Keypad
Number
Description
1
Concentration and purity check for DNA samples.
2
Concentration and purity check for RNA samples.
3
Concentration and purity check for
Oligonucleotide samples.
4
Concentration measurement at a single wavelength
based on a factor entered or calculated from a
single standard.
5
Concentration and purity check for protein samples.
6
Saved methods.
7
Instrument set up options.
4.1 Nucleic Acid Theory
• Nucleic acids can be quantified at 260 nm because at this wavelength there
is a clearly defined maximum peak. A 50 µg/ml DNA solution, a 40 µg/ml RNA
solution and 33 µg/ml solution of a typical synthetic Oligonucleotide all have an
optical density of 1.0 A in a 10 mm pathlength cell. These factors (50, 40 and 33
respectively) can be inserted into the formula (1) below, although they do vary
with base composition and this can be calculated more precisely if the base
sequence is known.
(1) Concentration = Abs260 * Factor (where * means “multiplied by”)
• SimpliNano will default to factors 50 for double stranded DNA, 40 for RNA
and 33 for single stranded DNA and Oligonucleotides. It also allows manual
compensation for dilution - aided by a dilution calculator.
• Nucleic acids extracted from cells are accompanied by protein and extensive
purification is required to remove the protein impurity. The 260/280 nm
Absorbance ratio gives an indication of purity, however it is only an indication
and not a definitive assessment. Pure DNA and RNA preparations have expected
ratios of ≥ 1.8 and ≥ 2.0 respectively. Deviations from this indicate the presence
of impurity in the sample, but care must be taken in the interpretation of results.
• The 260 nm reading is taken near the top of a broad peak in the Absorbance
spectrum for nucleic acids, whereas the 280 nm reading naturally occurs on
a steep slope, where small changes in wavelength will result in large changes
in Absorbance. Consequently, small variations in wavelength accuracy have
a much larger effect at 280 nm than at 260 nm. It follows therefore that
the 260/280 ratio is susceptible to this effect and users are warned that
spectrophotometers of different designs may give slightly different ratios.
• In practice, concentration also affects the 260/280 ratio as the individual
readings approach the instrument’s detection limit. If a solution is too dilute, the
29088793 AB 05-2014
13
280 nm reading shows a greater proportional interference from background and
as the divisor becomes smaller, has a disproportionate effect on the final result.
It is advisable to ensure that the Abs260 value is greater than 0.1 A for
accurate measurements.
• An elevated Absorbance at 230 nm can also indicate the presence of impurities. 230 nm is near the Absorbance maximum of peptide bonds and may also
indicate interference from common buffers such as Tris and EDTA. When
measuring RNA samples, the 260/230 ratio should be > 2.0. A ratio lower than
this is generally indicative of contamination with guanidinium thiocyanate, a
reagent commonly used in RNA purification, which absorbs over the
230–260 nm range. A wavelength scan of the nucleic acid is particularly useful
for RNA samples.
• SimpliNano displays the individual Absorbance values and the 260/280 and
260/230 ratios on the left side of the screen and attention should be given to
these as well as the final result on the right hand side.
Use of Background Correction
• Background Correction at a wavelength well away from the nucleic acid or
protein peaks is often used to compensate for the effects of background
absorbance. The procedure can adjust for the effects of turbidity, stray
particulates and high-Absorbance buffer solutions.
• SimpliNano uses background correction at 320 nm by default for nucleic acid
measurements. It is particularly recommended since very small samples are
susceptible to stray particulates. The background function toggles On and Off
with either left/right arrows from the relevant page.
• When background correction is on, the results will be different from when it is off
as Abs320 is subtracted from Abs260 as shown in the equations below:
Concentration
=
(Abs260 – Abs320) * Factor
Abs ratio 260/280
=
(Abs260 – Abs320) / (Abs280 –Abs320)
Abs ratio 260/230
=
(Abs260– Abs320) / (Abs230 –Abs320)
Typical spectral scan of a Nucleic Acid:Note:
• The Absorbance maximum near 260 nm and Absorbance minimum near 230 nm.
• The flat peak near 260 nm and steep slope at 280 nm.
• There is very little Absorbance at 320 nm.
Sample
Type
Lower limit Upper Limit Reproducibility (Based on 10 replicate
of Detection of Detection measurements)
dsDNA
4.0 ng/µl
29088793 AB 05-2014
2500 ng/µl
<100 ng/ul: Tolerance of +/- 2 ng/ul
100 ng- 2500 ng /µl: Tolerance of +/- 2%
14
Table 1: Limits of Detection for DNA
4.2. DNA measurement
The procedure is as follows:
Step 1
Press 1 to select DNA-Parameters mode.
Step 2 (dilution factor known)
Enter the dilution factor using the keypad numbers. (range 1.00 to 9999).
Use the C button to backspace and clear the last digit entered.
OR
Step 2 (calculate dilution factor)
Press
to enter the Dilution Factor screen (see second parameter screen to
the right).
Enter the volume of the sample using the keypad numbers (range 1.00 to 9999).
Press the down arrow.
Enter the volume of the diluent using the keypad numbers (range 1.00 to 9999).
Press OK
screen.
to calculate the dilution factor and return to the DNA-Parameters
OR press Cancel to cancel the selections and return to the DNA-Parameters
screen.
Step 3
Background Correction at 320 nm will be as default. It may be turned off with the
left or right arrows.
Press the down arrow.
Step 4
Select the units of measurement using the left and right arrows.
Options: μg/ml, ng/μl, μg/μl.
Press the down arrow.
Step 5
Enter the factor using the keypad numbers. Default value is 50, the range is 0.01 to
9999.
Step 6
Press OK
to enter the Results screen and begin taking measurements.
OR Esc to return to the Home screen.
Results Screen
Step 7
Pipette the reference sample into the sample port. Press
Key. This reference
will be used for all subsequent samples until changed. If QA is switched on the
reference sample will need to be replaced and the
key pressed again.
Step 8
Clean the sample port, pipette the sample into the port. Press
at the selected wavelengths and displays the results.
. This measures
Repeat step 8 for all samples.
Press
Esc
OR press
to return to the Home page.
to display the following options.
29088793 AB 05-2014
15
Options (select using keypad numbers)
Return to DNA-Parameters screen (step 1 above).
Print result via selected method.
Toggle Graph on/off. The graph shows a wavescan plot across the range
220 nm to 320 nm with cursors denoting 230, 260, 280 and (if Background
Correction selected) 320 nm.
Sample Number – add a prefix to the sample number and reset the
incrementing number to the desired value.
Save Method – use the alpha-numeric keys to enter a name for the method
and press Save
.
Auto-Print – toggles Auto-Print on/off.
Exit Options by pressing
Esc
or wait.
4.3. RNA measurement
The procedure is as follows:
Step 1
Press 2 to select RNA-Parameters mode.
Step 2 (dilution factor known)
Enter the dilution factor using the keypad numbers. Range 1.00 to 9999. Use the
C button to backspace and clear the last digit entered.
OR
Step 2 (calculate dilution factor)
Press
to enter the Dilution Factor screen (see second image to the right).
Enter the volume of the sample using the keypad numbers. (range 0.01 to 9999).
Press the down arrow.
Enter the volume of the diluent using the keypad numbers (range 0.01 to 9999).
Press OK
OR press
to calculate the dilution factor and return to the Parameters screen.
Esc
to cancel the selections and return to the Parameters screen.
Step 3
Select whether the background correction at 320 nm is used or not with the left
and right arrows.
Press the down arrow.
Step 4
Select the Units of measurement using the left and right arrows.
Options: µg/ml, ng/µl, µg/µl.
Press the down arrow.
Step 5
Enter the factor using the keypad numbers. The default value is 40, the range is
0.01 to 9999.
Step 6
Press OK
OR
Esc
to enter the Results screen and start taking measurements.
to return to the Home page.
29088793 AB 05-2014
16
Results Screen
Step 7
Pipette the reference sample. Press
Key. This reference will be used for all
subsequent samples until changed. If QA is switched on the sample will need to be
replaced and the
key pressed again.
Step 8
Clean the sample port and pipette sample. Press
wavelengths and display results.
to measure at the selected
Repeat step 8 for all samples.
Press
Esc
to return to the Home page.
OR press
to display the following options.
Options (select using keypad numbers)
Return to Parameters screen (step 1 above).
Print result via selected method.
Toggle Graph on/off. The graph shows a wavescan plot across the range
220 nm to 320 nm with cursors denoting 230, 260, 280 and (if Background
Correction selected) 320 nm.
Sample Number – add a prefix to the sample number and reset the
incrementing number to the desired value.
Save Method – use the alpha-numeric keys to enter a name for the method
and press Save
.
Auto-Print – toggles Auto-Print on/off.
Exit Options by pressing
Esc
, or wait.
4.4. Oligo
The procedure is as follows:
Step 1
Press 3 to select Oligo mode.
Step 2 (dilution factor known)
Enter the dilution factor using the keypad numbers (range 1.00 to 9999). Use the
C button to backspace and clear the last digit entered.
OR
Step 2 (calculate Dilution Factor)
Press
to enter the Dilution Factor screen.
Enter the volume of the sample using the keypad numbers (range 1.00 to 9999).
Press the down arrow.
Enter the volume of the diluent using the keypad numbers (range 1.00 to 9999).
Press OK
OR press
to calculate the dilution factor and return to the Parameters screen.
Esc
to cancel the selections and return to the Parameters screen.
Step 3
Select whether the background correction at 320 nm is used or not with the left
and right arrows.
Press the down arrow.
29088793 AB 05-2014
17
Step 4
Select the units of measurement using the left and right arrows. Options: μg/ml,
ng/μl, μg/μl and pmol/μl. If pmol/μl is selected the factor changes to a selection
table denoting the ratios of the 4 bases in the structure.
Press the down arrow.
Step 5 (units not pmol/μl)
Enter the factor using the keypad numbers. Default value is 33, range is 0.01 to
9999.
OR
Step 5 (units pmol/μl)
Enter the proportions of bases present using the keypad numbers and up and
down arrows to move between boxes. Default is 10 for each, range is 0 to 9999.
Step 6
Press OK
to enter the Results screen and start making measurements.
OR
Esc
to return to the Home page.
Results Screen
Step 7
Pipette the reference sample into the sample port. Press
Key. This reference
will be used for all subsequent samples until changed. If QA is switched on the
reference sample will need to be replaced and the
key pressed again.
Step 8
Clean the sample port, pipette the sample and press
. This measures at the
selected wavelengths and displays the results. The ratio of wavelengths 1 and 2
absorbencies are calculated (both corrected by the background wavelength value
if selected). Gives concentration based on absorbance at wavelength 1.
Repeat step 8 for all samples.
Press
Press
Esc
to return to the Home page.
to display the following options.
Options (select using keypad numbers)
Return to Parameters screen (step 1 above).
Print result via selected method.
Toggle Graph on/off. The graph shows a wavescan plot across the range
220 nm to 320 nm with cursors denoting 230, 260, 280 and (if Background
Correction is selected) 320 nm.
Sample Number – add a prefix to the sample number and reset the
incrementing number to the desired value.
Save Method – use the alpha-numeric keys to enter a name for the method
and press Save
.
Auto-Print – toggles Auto-Print on/off.
Exit options by pressing
29088793 AB 05-2014
Esc
, or wait.
18
4.5. Absorbance/Concentration
The procedure is as follows:
Step 1
Press 4 to select Absorbance/Concentration mode.
Step 2
Select the wavelength using either arrow or alphanumeric keys.
Press the down arrow.
Step 3
Enter the measurement mode Absorbance/Concentration using factor or single
standard. If Absorbance selected press OK
to enter the Results screen.
If Factor or Standard selected press the down arrow.
Step 4 (if factor selected)
Enter relevant factor and units. Press OK
to enter the Results screen.
Step 5 (If Standard selected)
Enter the concentration and units of the standard to be measured using the
keypad numbers. Press OK
to enter the Results screen.
Step 6
Pipette the reference sample. Press
key. This reference will be used for all
subsequent samples until changed. If QA is switched on, the sample will need to
be replaced and the
key pressed again.
Step 7
Pipette the sample and press
. This measures at the selected wavelength and
displays the results. Repeat step 7 for all samples.
Step 8 (if Standard selected)
Insert standard, and press
if necessary and press OK
.
. Change the concentration value of the standard
to measure the standard. Insert sample and press
This measures at the selected wavelength and displays the results. Repeat for all
samples.
Press
to display the following options.
Press Cancel
Esc
to cancel selections and return to the Home page.
Options (select using key pad numbers).
Return to Parameters screen (step 1 above).
Print result via selected method.
Run Standard.
Sample number – add a prefix to the sample number and reset the
incrementing number to the desired value.
Save method – use the alpha-numeric keys to enter a name for the method
and press Save
.
Auto-print – toggles auto-print on/off.
Exit options by pressing
29088793 AB 05-2014
Esc
or wait.
19
4.6. Protein determination at 280 nm
Sample
Type
Lower limit Upper Limit
of Detection of Detection
Reproducibility (Based on 10 replicate
measurements)
BSA
0.12 mg/ml
<1 mg/ml: Tolerance of +/- 0.06 mg/ml
1 mg/ml- 5 -mg/ml: Tolerance of +/- 2%
50 mg/ml
Proteins can be determined in the near UV at 280 nm due to absorption by
tyrosine, tryptophan and phenylalanine amino acids. The Abs280 varies greatly for
different proteins due to their amino acid content and consequently the specific
Absorption value for a particular protein must be determined.
• T he presence of nucleic acid in the protein solution can have a significant effect
due to strong nucleotide Absorbance at 280 nm. • T he Protein A280 application, has three modes, which can be selected
depending on the extinction coefficient of the reference protein being used.
A) For BSA the extinction coefficient is 6.7 AU (E1%) at Abs 280 for a 1% ww
solution
B) For IgG the extinction coefficient is 13.7 AU (E1%) at Abs 280 for a 1% ww
solution
C) For lysozyme the extinction coefficient is 26.4 AU (E1%) at Abs 280 for a 1%
ww solution.
• R
apid measurements such as this at Abs280 are particularly useful after the
isolation of proteins and peptides from mixtures using spin and HiTrap columns
by centrifuge and gravity, respectively.
Use of Background Correction
• Background Correction at a wavelength well away from the protein peak is
used to compensate for the effects of background Absorbance. The procedure
can adjust for the effects of turbidity, stray particulates and high-Absorbance
buffer solutions.
• S
impliNano uses background correction at 340 nm by default protein
measurements. It is particularly recommended since very small samples are
susceptible to stray particulates. The Background function toggles On and Off
with either left/right arrows from the relevant page.
• W
hen background correction is on, the results will be different from when it is
off as Abs340 is subtracted from Abs280 prior to reporting.
4.7. Protein A280
Step 1
Press 5 to select Protein A280.
Step 2
Select the Mode. Options are, BSA, IgG, Lysozyme.
Press the down arrow.
Step 3 (dilution factor known)
Enter the dilution factor using the keypad numbers (range 1.000 to 9999).
Use the C button to backspace and clear the last digit entered.
29088793 AB 05-2014
20
Table 2: Limits of Detection for BSA
OR
Step 4 (calculate dilution factor)
Press
to enter the dilution factor screen, shown to the right.
Enter the volume of the sample using the keypad numbers (range 0.001 to 9999).
Press the down arrow.
Enter the volume of the diluent using the keypad numbers (range 0.001 to 9999).
Press OK to calculate the dilution factor and return to the Parameters screen.
OR press
Esc
to cancel the selections and return to the Parameters screen.
Step 5
Select whether Background Correction is to be used or not with the left and
right arrows.
Press the down arrow.
Step 6
Select the Units of measurement using the left and right arrows.
Options: mg/ml, μg/ml, ng/μl and μg/μl.
Step 7
Press OK to enter the Results screen.
OR
Cancel
Esc
to return to the Protein screen.
Results Screen
Step 8
Pipette on the reference sample and press the
key. This reference will be used
for all subsequent samples until changed. If QA is switched on, the sample will
need to be replaced and the
key pressed again.
Step 9
Clean the sample port, pipette the sample and press
selected wavelength and displays the results.
. This measures at the
Repeat step 9 for all samples.
Press
to display the following options.
Options (select using keypad numbers)
Return to Parameters screen (step 1 above).
Print result via selected method.
Toggle Graph on/off. The graph shows a wavescan plot across the range
250 nmto 350 nm.
Sample Number – add a prefix to the sample number and reset the
incrementing number to the desired value.
Save Method – use the alpha-numeric keys to enter a name for the method
and press Save.
Auto-Print – toggles Auto-Print on/off.
Exit Options by pressing
29088793 AB 05-2014
Esc
,or wait.
21
5. METHODS FOLDER
Press 6 to enter the Methods folder. This folder is the storage locations for any user
modified applications (Methods) that are saved using the Options menu and is
accessible from the Home page.
Up to 9 Methods may be stored, saved methods can be locked, unlocked and
deleted using the Options menu. Select the method by pressing the relevant key
pad number and then press the
key.
Delete Method
Press 1 to select Delete Method.
Select the method to be deleted using the left and right arrows.
Press
folder.
to delete the method OR Cancel
Esc
to return to Favourites/Methods
Lock Method
Press 2 to select Lock Method.
Select the method to be locked using the left and right arrows.
Press the down arrow.
Select a pass code using the keypad numbers or left and right arrows.
Press
to lock the method OR Cancel
Esc
to return to the Methods folder.
Unlock Method
Press 3 to select Unlock Method.
Select the method to be unlocked using the left and right arrows.
Press the down arrow.
Enter the pass code using the keypad numbers or left and right arrows.
Press
to unlock the method OR Cancel
29088793 AB 05-2014
Esc
to return to the Methods folder.
22
6. UTILITIES
Press 7 to enter the Utilities folder.
Summary
Function
Keypad number
Description
1
Set correct date and time
2
Select preferred language and number format
3
Printer/output options
4
Select screen layout (themes) and history
5
Adjust screen contrast & brightness
6
Serial number and software version
6.1. Date and Time
Enter the day using the keypad numbers or left and right arrows.
Press the down arrow.
Enter the Month.
Press the down arrow.
Enter the Year.
Press the down arrow.
Enter the Hour.
Press the down arrow.
Enter the Minute. Seconds are zeroed when OK is pressed.
Press OK
to store the settings and return to the Utilities screen.
OR
Press Cancel
Esc
to return to the Utilities screen without storing the time.
6.2. Regional
Sets Language and Number Format.
The procedure is as follows:
Select a Language. Options are English, French, German, Spanish, Italian, Chinese
or Japanese.
Press the down arrow.
Set the decimal point style. Options are “,” or “.”.
Press OK
to store the settings and return to the Utilities screen
OR
Press Cancel
Esc
29088793 AB 05-2014
to return to the Utilities screen without storing the settings.
23
6.3. Printer
Sets up printing options.
The procedure is as follows:
Select whether Auto-Print is on or off using the left and right arrows. When
Auto-Print is on, the results are automatically printed after a measurement is
taken. When it is off, printing has to be initiated manually. This can also be set
using the Options key
in each application or method. The default is Off.
Press the down arrow.
Select how the data are sent. Options are Built in (internal printer), or to a
computer via USB port.
Press OK
to store the settings and return to the Utilities screen.
OR
Press Cancel
Esc
to return to the Utilities screen without storing the settings.
6.4. Preferences
Sets user Preferences.
Define the screen layout of folders. Options are either a grid format (default)
or a list.
Press the down arrow.
Select whether to use previously entered parameters when the instrument is
switched on or to use defaults.
Press the down arrow.
Select whether to use a standby mode after defined periods. Options are 1 hour,
2 hours, at night or off.
Select whether you want Quality Assurance mode on/off. QA mode prompts you
to run a 2nd Reference and checks that both references agree within a specified
tolerance.
Press OK
to store the settings and return to the Utilities screen.
OR
Press Cancel
Esc
to return to the Utilities screen without storing the settings.
6.5. Contrast
Ambient temperature can affect the display. This function can optimise the display
for local conditions.
The procedure is as follows:
Adjust the contrast using the left and right arrows to scroll though the levels.
Press the down arrow. briefly to move down.
Adjust the brightness similarly.
Press the down arrow.
Press OK
to store the settings and return to the Utilities screen.
6.6. About
Displays the instrument serial number and software version.
Press OK
to close the window and return to the Utilities screen.
29088793 AB 05-2014
24
7. ACCESSORIES
INSTALLATION
7.1. Printer installation
The user can install a printer.
Step 1. Remove the power cable and turn the
instrument over onto a soft surface,
taking care not to damage the
sampling head.
Release the outermost screws using the
Allen key provided.
Step 2. Turn the instrument back over and
remove the accessory covers.
Step 3. Attach the printer cable.
29088793 AB 05-2014
25
Step 4. Lower the printer onto the locating
bosses.
Step 5. Replace the top cover plate, invert the
instrument and replace the cap head
screws at locations A and B shown in
step 1.
Step 6. Switch the instrument on and go to
utilities/instrument/preferences and
select the Built-in printer.
29088793 AB 05-2014
26
7.2. After sales support
For all technical support and advice on SimpliNano please contact your supplier.
GE Healthcare’s website is:
http://www.gelifesciences.com
orhttp://www.gelifesciences.com/contact
Support agreements that help you to fulfil the demands of regulatory guidelines
concerning GLP/GMP are available.
• Calibration, certification
• Certificated engineers and calibrated test equipment
• Approved to ISO 9001 standard
Choice of agreement apart from break down coverage can include;
• Preventative maintenance
• Certification
Accessories
Built-in Printer accessory Spare paper for printer (20 rolls) 29088793 AB 05-2014
28-9182-27
28-9182-26
27
8. TROUBLESHOOTING
Problem
Possible cause
Negative absorbance readings
Sample measurements will be negative absorbance reading if the absorbance
value of the reference is higher than the sample. Negative readings can also result
if reference and sample are interchanged or if the sample is very dilute and close to
the absorbance of the reference. Contact your supplier for advice on the minimum
concentrations that can be measured.
Unexpected results
• Bubbles or contamination in the sample or reference can result in considerable
errors.
• Use of incompatible buffers (UV Absorbing) as a reference.
• Ensure background correction is switched on.
• Trying to measure sample volumes/concentrations outside of the instrument
working ranges.
Absorbance higher than expected
• Incorrect sample reference.
• Contamination in sample.
• Check size and position of droplet.
• Ensure background correction is switched on
• Possible incorrect optical alignment. Contact technical support.
Absorbance lower than expected
• Incorrect sample reference.
• Check sample and reference for contamination.
• Check sample and reference samples are not the same.
• Check size and position of droplet.
• Possible stray light issue. Contact technical support.
Poor reproducibility
• Insufficient sample volume – check pipette calibration.
• Concentration of sample too low or too high.
• Particulates in sample. Absorbance measurements will not be accurate in turbid
samples.
• Possible noise or measurement stability issue. Contact technical support.
Instrument start up reported failure
• Check all sample paths are clear and clean – dried on DNA/Protein sample on the
Micro-volume head may cause start up calibration errors.
• Check original 18 V dc supply is connected and is fully engaged.
• Report persistent failures to technical support.
Instrument switches off after
calibration
• You may be keeping you finger on the ON/OFF button too long, so that the
instrument receives both ON and OFF signals and switches off after the calibration.
• Try adjusting the timing of your finger press at switch on.
• If the problem persists please contact your supplier.
Absorbance readings stable but
different than expected
Remember that the Absorbance displayed is being normalized to a path length of
10 mm. With a 0.5 mm path length the ideal measurement range becomes
equivalent when normalised to 2 A to 50 A. For unresolved Absorbance issues
contact technical support.
No image on screen
If the lamp can be heard buzzing at startup but there is no image on the screen
then the display may be faulty.
Please contact your supplier.
29088793 AB 05-2014
28
8.1. Frequently asked questions
Q. What is the Pathlength of SimpliNano?
A. 0.5 mm.
Q. How accurate is SimpliNano?
A. Typically within 2%.
Q.
Does SimpliNano produce results for a continuous spectrum or just selected
wavelengths?
A.
Within The DNA, RNA, Oligo and protein A280 methods a continuous spectrum
is produced.
Q. Do nucleic acids require purification before being measured?
A.
Yes. Absorbance measurements are not specific for a particular nucleic acid
and will be affected by the presence of other molecules which absorb at
260 nm.
Q. How should the sample port be cleaned?
A.
The sample port is easy to clean. Simply wipe with a lint free tissue or cloth.
If a difficult or sticky sample or dye was used, the port can be cleaned with a
dilute (2%) detergent solution followed by water or isopropanol. See Section 3.1
Cleaning and General Maintenance, Step 4 for details.
Q. Is a simple wipe with a lint free tissue or cloth enough to prevent carryover?
A.
Yes. A sample carryover study using 25 mg/ml BSA with successive alternative
additions of water and BSA, was repeated 50 times. The data showed no
significant change in absorbance readings throughout the study for the water
samples or the BSA samples, indicating that there was no carryover. See
SimpliNano Datafile 29-1028-98 for details.
For more difficult, sticky, or strongly coloured samples, the port can be cleaned
with a dilute (2%) detergent solution, followed by water or isopropanol.
Q. Are there any solvent restrictions?
A.
Most common laboratory solvents, including dilute acids, may be used but
they should be immediately wiped off the sample head after measuring.
The SimpliNano has been tested with methanol, isopropanol (2-propanol), and
acetone. However, these solvents may affect the accuracy of the measurement
due to their volatility & are therefore not recommended.
Q. Why does the reference (blank) require 2 samples?
A.
To set the reference, the software will ask for 2 separate samples to ensure the
quality of the reference baseline instrument.
Q. What kind of light source does the SimpliNano use?
A. A pulsed Xenon flash lamp.
Q. How often will the lamp require changing?
A.
The lamp should last for several years of use & comes with a 3 year warranty.
If it does need changing, this should be done by a service engineer from your
supplier.
Q. Is the flash lamp on continuously, or only when performing a measurement?
A. The lamp is only on when taking measurements.
Q. Does SimpliNano require a computer to operate?
A.
No, SimpliNano operates as a stand alone instrument and data can be
transferred via USB stick. If operation via a computer is critical it can be
connected to a PC and operated using either PVC or Datrys software.
Q. Can I get data exported in Excel format?
A.
Using the PVC software application, data may be stored either manually
or automatically in a variety of data formats which include : as an Excel
spreadsheet (Excel must be installed on the PC), Extensible Meta Format (an
EMF) graphics file, a comma delimited (csv) data file, a tab delimited (txt) file,
Rich Text Format (RTF) or in native PVC format.
29088793 AB 05-2014
29
Q. What volume of sample can I use with the SimpliNano?
A.
Volumes as low as 1 μl can be used. A sample volume of 2 μl is recommended
to minimize pipetting errors affecting results.
Q. What calibration does the SimpliNano require?
A. The SimpliNano has no moving parts so calibration is not required.
Q. How reproducible is the Absorbance data?
A.
Specifications for precision and accuracy are below.
Absorbance Precision Between 0 & 1 A; < 0.005 A or 1% of measurement
(whichever is greater)
1 to 2 A – 2% of reading; above 2 A - 5% of reading
Absorbance Accuracy± 1% at 257 nm, Potassium Dichromate solution,
0.7 – 0.8 A.
Q. What are the detection limits for SimpliNano.
A.For dsDNA the range is 4.0 ng/µl 2500 ng/µl and for BSA
0.12 mg/ml 50 mg/ml .
Q. What sort of reproducibility should I expect with the SimpliNano?
A.Typically ± 2 ng/µl for dsDNA samples < 100 ng/µl- 2500 ng/ul and ± 2% for
samples > 100 ng/µl. For BSA, typically +/- 0.1 mg/ml for samples 1-50 mg/ml
and for >1 mg/ml tolerance of +/- 2%.
Q. What purity ratio measurements are available on the SimpliNano?
A.The SimpliNano measures 260/280 and A260/A230 ratios for Nucleic Acids and
A260/A280 ratios for proteins.
29088793 AB 05-2014
30
9. SPECIFICATION AND
WARRANTY
Specification
Wavelength range
190–1100 nm
Monochromator
Flat Grating
Wavelength calibration
Automatic upon switch on
Spectral bandwidth
5 nm
Wavelength accuracy
±2 nm
Wavelength reproducibility
±1 nm
Light sources
Pulsed Xenon lamp
Detector
1024 element CCD array
Photometric range
- 0.300 to 2.500 A, 0 to 199%T
Photometric linearity
±0.005 Abs or 1% of the reading, whichever is
the greater @ 546 nm
Photometric reproducibility
±0.003 Abs (0 to 0.5 Abs), ±0.007 Abs (0.5–1.0 Abs)
Stray light
<0.5% at 220 nm and 340 nm using NaNO2
Zero stability
±0.01 Abs/hour after 20 min warm up @ 340 nm
Noise
0.005 pk to pk 0.002 RMS
Digital output
USB B port for connection to PC
Dimensions
260 × 390 × 130 mm
Weight
<4.5 kg
Power input
18 Vdc from a 90–250 V, 50/60 Hz, Max 30 VA
mains power pack
Specifications are measured after the instrument has warmed up at a constant
ambient temperature and are typical of a production unit. As part of our policy
of continuous development, we reserve the right to alter specifications without
notice.
Warranty
• GE guarantees that the product supplied has been thoroughly tested to ensure
that it meets its published specification. The warranty included in the conditions
of supply is valid for 24 months only if the product has been used according to
the instructions supplied. GE can accept no liability for loss or damage, however
caused, arising from the faulty or incorrect use of this product.
• The lamp is warranted for 3 years if the product has been used according to the
instructions supplied.
29088793 AB 05-2014
31
10. Legal
GE, GE monogram and imagination at work are trademarks of General Electric
Company.
SimpliNano is a trademark of General Electric Company or one of its subsidiaries.
Windows 2000, Windows XP and Windows Vista are trademarks of Microsoft
Corporation in the United States and/or other countries.
All other third party trademarks are the property of their respective owner.
© 2013-2014 General Electric Company – All rights reserved.
First published October 2013
All goods and services are sold subject to the terms and conditions of sale of the
company within GE Healthcare which supplies them. A copy of these terms and
conditions is available on request. Contact your local GE Healthcare representative
for the most current information.
http://www.gelifesciences.com
GE Healthcare UK Limited
Amersham Place, Little Chalfont,
Buckinghamshire, HP7 9NA UK
GE Healthcare Bio-Sciences AB
Björkgaton, 30 751 84,
Uppsala, Sweden
GE Healthcare Europe GmbH
Munzinger Strasse, 5 D-79111,
Freiburg, Germany
GE Healthcare Bio-Sciences Corp
800 Centennial Avenue, PO Box 1327,
Piscataway, NJ 08855-1327, USA
GE Healthcare Japan Corporation
Sanken Bldg 3-25-1, Hyakunincho Shinjuku-ku,
Tokyo, 169-0073, Japan
29088793 AB 05-2014
32
Page left intentionally left blank
Page left intentionally left blank
Page left intentionally left blank
GE Healthcare offices:
GE Healthcare Bio-Sciences AB
Björkgatan 30, 751 84 Uppsala,
Sweden
GE Healthcare Europe GmbH
Munzinger Strasse 5, D-79111 Freiburg,
Germany
GE Healthcare Bio-Sciences Corp.
800 Centennial Avenue, P.O. Box 1327,
Piscataway, NJ 08855-1327,
USA
GE Healthcare Japan Corporation
Sanken Bldg. 3-25-1, Hyakunincho,
Shinjuku-ku, Tokyo 169-0073,
Japan
For contact information for your local office,
please visit: www.gelifesciences.com/contact
GE Healthcare Limited
Amersham Place
Little Chalfont, Buckinghamshire,
HP7 9NA, UK
http://www.gelifesciences.com
imagination at work
29088793 AB 05-2014