1
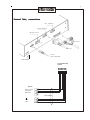
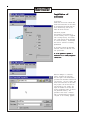
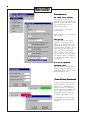
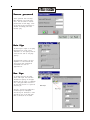
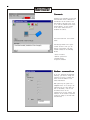
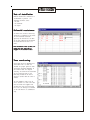
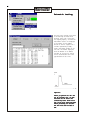
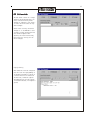
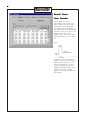
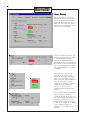
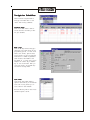
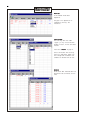
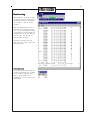
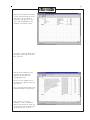
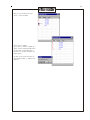
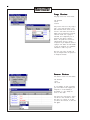
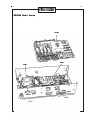
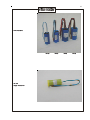
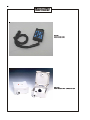
1
PROCOM - USER HANDBOOK
Rev.:1/08FEB01
2
PROCOM System Layout
PC
Serial Port
Mains
Transformer
TWC-500
Serial Port
Optocoupler
24 V AC
Line Termination Box
LTB-500
Rain Sensor
2 wires
Line
Decoder
Solenoid
Valve
Sensor
Decoder
Sensor
Line
Decoder
Solenoid
Valve
Ground
Rod
Pump Alarm
3
Central Unit, connections
Aux. connector
Serial connector
ON/OFF switch
From LTB
From PC
24VAC
from transformer
Fuses 4 A/T
Line Termination Box
LTB-500
1 2 3 4 5 6
TWC-500
Sensor common
Pump Alarm
Rain Sensor
Cable 6xAWG18
Line B
Line A
4
Installation of
software
PC-program:
Insert the CD with the software and
follow the instructions on the screen.
If the Installation program does not
start automatically, use the command <CD-drive>:Install.
Controller program:
The software in the Controller is
stored in memory which is supplied
from a backup battery. This means
that a new version can be delivered
on a disk and easily “downloaded”
from the PC. Software is normally
preinstalled.
If you need to install the Controller
software, select the COM Port from
the System menu.
It is not possible to perform a
download via a modem/telephone
connection!
When the COM-port is selected,
Select “Download CU Software”.
This will open a file window where
you select the Controller Software file
(procom.hex), click on <Open> and
follow the instructions on the screen.
The progress can be monitored in
the messages on the screen. The
steps are transfer of the data and
storing (“flashing 4 times”) of data in
the permanent memory. The
procedure takes about 8 minutes
and is finished when the message
“Program is now running” appears.
5
Menu Tree
Setup
The program has two main sections,
the Installation Data and the Irrigation Part.
The Installation Data is a database
which contains all information about
Pumps, Pipes, Decoders and
sensors. To write Schedules the
names/addresses of the decoders
must be in the data base and
detailed information about the
hydraulic properties of the system is
necessary for the “Flow Optimizer” to
work.
Pipes
Main Pipe
New Pipe
Valves
Type of valves
Line Decoder
Pumps
Pump Decoder
Sensors
Sensor Inputs
Installation Data
To enter the installation section,
either select “Installation Data” from
the Main Menu or click on the icon:
System
Irrigation
Manual
Main Menu
Setup
Note: Menus in italics are not yet
available
Parameters
Password
Delete all Data
Printer setup
Print Preview
Print
Open
Download CU Software
Select COM port
Exit
Irrigation Schedules
Sectors
Pump Status
Sensor Status
Display/Modify Sectors
Display all Decoders
Turn Decoder on/off
Start/Stop Irrigation
Display Man. started Decoders
Installation Data
Date and Time
Password
Test
Weather Station
Language setup
View
Status
Monitor Irrigation, Screen
Help
Contents
About PROCOM
Manual Test
Automatic Test
ET values
ET default value
Get Weather Data
Weather Station setup
Connection setup
6
Parameters
Max. number active Solenoids.
The Controller is rated for 40*
simultanesouly active solenoids (28
Ohms/2 W). If the resistance is lower,
the maximum number must be
reduced proportionally.
*2 sections with 20 each, more
about this later.
Legal Characters. Do not change see
Line Decoders.
Power Off time.
If a power failure occurs during
irrigation, the controller is able to
resume the watering where it was
interrupted. If the time is set to zero,
irrigation will not be resumed. If the
power outage is less than the set
time, watering will resume exactly
where it stopped. If the outage is
more than the set time, the schedule
will resume with what is scheduled
for that time (there will be a “hole” in
the schedule).
ET is not yet implemented.
Measurement Units.
The data are not converted when
other unit systems are selected. It is
therefore important to select the units
before entering the data.
(Installers)Password
To protect the Installation Data from
being changed by unauthorized
persons, it is recommended to use
password protection. When password is used the field changes from
grey to colored. If you click on a
green password field, protection is
on and the field changes to red.
To remove protection, click on the
red field and enter the password as
prompted.
7
Remove password
Select password from the Setup
Menu and enter the current password. The two boxes for the new
password must be left empty. Click
the OK button and the password is
removed. Accordingly the field
becomes grey.
Main Pipe
The Main Pipe is equal to the pump
manifold and no valves can be
connected to it. The capacity shall of
course be the same as the pump
capacity.
The pipe model used by the Flow
Organizer is a tree structure and
other layouts must therefore be
transformed into such an
approximation.
New Pipe
To add pipe sections the model,
select “New Pipe” from the menu
and enter the capacity of that pipe.
Observe that the layout is completed
with a new pipe marked “Section 1”.
You may drag Section 1to a position
that suits you.
Section 1 can only be connected to
the Main Pipe but subsequent
sections may be connected to other
sections by use of the drop down
menu at the bottom of the table.
8
Type of Valves
A Valve Type is determined by the
following:
-Capacity (which is needed by the
Flow Optimizer)
-Precipitation rate (which is neede
for ET control of irrigation)
-Resistance (of solenoid which is
needed by the System Tests)
-Electric code (which is necessary
to operate the valve)
-Number of solenoids (which is
necessary not to overload the
system)
If just one of these factors changes it
is necessary to create a new Valve
Type. Up to 100 Valve Types may be
created.
Line Decoders
The table is the link between the
Name you want to use for the
decoder and the Address on the
decoder label. For the names you
can use up to 8 characters. You may
use any letter/digit combination, but
if you want to use the Field Access
Unit (FA-100) your choice is limited
to the “Legal Characters” (see page
6).
If a number is already used by
another Decoder, a warning will be
shown. Duplicate numbers are
permitted, but should normally be
avoided.
For each Line Decoder you must
also list the following:
-Valve Type
-Decoder Type: 1=LD-100
2=LD-200
4=LD-400
6=LD-600
This information is needed for the
Test Program to calculate correctly
the standby current.
-Pipe Section
The button with the “down arrow”
takes you to the end of the list.
9
Pump Decoder
Up to 16 pumps may be defined,
each with its own capacity and Pump
Decoder. Line Decoders may be
used to control pumps but they must
be defined as Pump Decoders.
For each Pump number, the system
suggests an Address
Address. The Pump
numbers are created automatically
and correspond to the switch
positions on the Pump Decoder:
P1: 284 P4: 292
P2: 286 P5: 293
P3: 287 P6: 295
P7: 296 P8: 310
Priority can range from 0 to 6.
Priority 1 is the highest, i.e. this
pump is started first. More pumps
with the same priority take turns to
start first. Priority 0 corresponds to
no Pump Decoder installed. A slave
(booster) pump must be installed
with priority S.
A slave pump is a pump that must be started whenever valves on a
certain pipe section are turned on. When the slave pump has been
defined in this table, open the window for that pipe section and enter
the pump number in the “Slave Pump” field. The capacity of a slave
pump is not included in the total pump capacity.
On-delay is the time in seconds from
the pump is turned on and till a
following pump can be started.
Off-delay is the time in seconds from
the end of demand and till the pump
is actually stopped.
Sensor Inputs
Rain Sensor
When the sensor is activated by rain,
all Line Decoders and pumps are
immediately stopped and the
message RAIN is displayed in the
status field. Decoders may be started
manually. When the Sensor returns
to the passive mode, Irrigation will
resume.
Alarm Sensor
Input may come from a pump, a
pressure gauge or similar. When the
sensor is active, Line Decoders can
not be started neither by Irrigation
Schedules nor manually. The status
displays ALARM
A Sensor that is not installed shall be set to NOT INSTALLED. To use a
sensor it shall be installed as either ON, CLOSED (Normally Open) or as
ON, OPEN (Normally Closed). A Rain Gauge which acts as an offswitch during rain and as a short-circuiter during dry periods, shall be
installed as ON, OPEN. Sensors 1 and 2 may be disabled by changing
their status to NOT USED in the Sensor Status menu. All sensors have a
response time of about 1 minute from the physical activation till the
status changes on the screen.
10
Line Voltage & Short Circuit
These two sensors are internal (in
the Line Control Module). They
monitor the conditions on the Lines
and their status can not be changed.
The Line Voltage Sensor monitors the voltage between the 2-wire and
ground. If a fault is detected, a relay automatically disconnects the Line
and the message ERROR is displalyed in the status field. This will cause
all decoders and pumps to stop. After the fault is removed, the Central
Unit must be turned off and on again to restore operation. Sensor 3 is
by default ON,OPEN.
The Short Circuit sensor monitors
the voltage on the line. If the voltage
drops below the set limit (default 25
Volts), the line voltage is set to zero
and the message SHORT is displayed in the status field. Every 10
minutes the Line voltage will be
applied again for one minute to
check if there is still a short. Sensor 4
is by default ON,CLOSED.
Date and Time
Select from the Installation Data
menu “Date and Time”. Note that
Military Time is used. 6:13 PM must
therefore be entered as 18:13.
Flow Sensor
From the Sensors menu select Edit
Sensor Decoder. Now you have to
key in the informaiton needed to set
up the flow sensor.
11
Sensor Decoder
The address of the Sensor Decoder
is printed ont he decoder label.
Calibration Data
This information is necessary for the
Controller to convert the
measurement into GPM. In the
example 917 pulses counted over 10
seconds correspond to 250 GPM.
The actual numbers depends on the
flow sensor and the pipe size.
Pulse/10 seconds are mostly used
with impeller type flow meteres.
ms/pulse (milli-seconds between
pulses us used with sensors that
give a small number of pulses per
second.
mA (4-20 mA) is an industrial type of
sensor.
High Flow alarm
If the flow exceeds 50 GPM for more
than 2 minutes, an alarm will be
triggered. The controller reacts by
stopping all decoders in the current
step and calling the pager (phone)
712 223 1221 which will display the
message 1111
Leakage alarm
If the flow exceeds 5 GPM for more
than 2 minutes the Controller will
activate the decoder MV and call the
pager to display the message 0000.
The action can be “Activate” or
“Deactivate” and the decoder can
be any decoder in the installation or
all decoders.
If your controller is connected to
more than one Flow sensor you can
set up the others in the same way by
pressing “Next”.
If you check this box all
flow measurements will
be logged in the monitor
file.
12
Necessary to get
flow measurements
in the Logviewer
When you have defined all Flow
sensors, press “Done” and this
window wil appear. Here you can
sum the measurements from all
sensors and set up the total flow to
trigger alarms and log the
measurements to the montor file in
the sam e way as for the individual
flows.
When you press “Finish”, the data
setup for the sensor decoders will be
stored in the database on the PC.
Flow Monitoring
The flow measurements
made by a specific Flow
Sensor is stored in the
monitor file only if you
check this box.
Measurements from the Sensor
Decoders are used in two different
ways:
Alarm trigger
trigger, i.e. if a certain event
happens, the controller will react in a
certain way (refer to the previous
pages).
Monitoring the system
system, i.e. the
water flow. The controller stores in
memory all events : Start a Decoder ,
stop a Decoder, reading of a Flow
Sensor. This is useful if you have
several wataer sources an dyou want
to keep track of the flow rates reom
each water source. The
measurements are sored in the
monitro file and can be seen in the
Monitor screen. If you use the
“Extract and View
View” function the data
are presented with the “Show Data”
funtion.
13
Using the Flow summing will allow
you to monitor the sum of several
flow sensors (in this example 3
sensors are installed but we only
want to sum number 1 and 2).
The sum as defined here is stored in
the monitor file where it is used to
calculate the water consumption.
Can be viewed in “Extract and view”
using the “Show overview” function
(Refer to page 32 Monitoring Data for
more details.)
Transfer of Data
All changes of data are stored in the
PC. For the controller to irrigate
according to these data they must be
transferred from the PC to the
controller. There are 3 buttons like
this:
which may be used to initiate transfer
of data. When transfer is necessary
the 3 buttons change appearance as
shown in the left picture. When
transfer is complete, the buttons
change as shown in the right picture.
If you want to use the flow
measurements to calculate
the water consumption, you
must check this box.
14
Connect
Transfer is not possible if the PC and
the Controller are not connected. If
the indicator on the toolbar of the
main screen is “Off line” (red), click
on it and the Communication Status
window appears. In this window,
click on the connect button to
establish the contact.
The Status Field will show current
status.
The Message Window will report
current actions so that you can
monitor the progress. The data
transfer consists of the following
blocks:
-Sensor Decoders
-General System Data
-Installation Data
Irrigation Schedules
Modem connection
If you are operating the Controller
remotely, you need to change the
Connection setup to Modem and
enter the Phone number of the
remote installation.
When operating the system via a
telephone line it is too costly to be
connected all the time. When you
want to disconnect, click on the
Disconnect button in the
Connumication Status window. The
indicator on the toolbar of the main
screen wil change to Off line when
disconnected.
15
Test of installation
When the installation is finished it is
recommended to perform the
following (automatic) tests:
- LD short
- GF solenoids
- GF sognal
Solenoid resistance
To enable the automatic measuring
facilities it is necessary to key values
for the soleonoids resistaces.
Typically the resistance is 28 Ohms.
If two such solenoids are parallelled
the resistance must be set to 14
Ohms.
With the default value (0 Ohms) all
valves with that valve type is
skipped in the automatic tests.
True monitoring
Valve types which are defined with a
resistance from 1-50 Ohms are
checked for proper operation when
activated in Irrigation Schedules. If
the solenoid does not respond
correctly, the valve will be closed and
an error message shown in the
monitoring. Instead of the flow is
shown the current when the valve is
started.
In this example L6 and L7 has an
error. Current is 59 and 60 mA. Note
that the valves are stopped a few
seconds after they are started and
note also the message IS STOPPED
at the time where L6 is scheduled to
stop.
16
Automatic testing
This test will go through al the valves
in the order they are listed in the
database. Every time a valve does
not respond properly, the name and
measurement results are displayed
in the window. In this example
decoder L6 did not respond: The 3
currents representing standbyinrush- and holding currents are all
the same. The number displayed
after the decoders is its address.
Decoders L4 through L12 and MV
are not tested because their valve
type resistance is set to zero.
Important!
Before you perform the “GF” and
the “LD thorough” test, you must
have done the “LD short” and
corrected any faults found in that
test. If you do not correct the faults
before proceeding the decoders
will fail in the other two tests as
well.
17
GF Solenoids
The test offers a choice of 3 voltage
levels for the testing.Test level 1 (15
Volts) will search for only severe
leakages as compared to test level 3
(35 Volts) which will search for very
small leakages.
Unless there are many and severe
leakages it is recommended to start
at level3. If there are many faults the
test should be repeatet after
repairing the faults because many
heavy faults may cover up for the
minor leakages.
Reprogramming
After selection of the test voltage the
test will start with reprogramming of
all decoders followed by a period of
5 minutes where the two linees are
automatically connected together
and supplied wotih the line voltage
(of the level selected), with respect to
ground.
18
After the 5 min’s period the normal
line voltage is applied again, and the
test “LD short” is run automatically.
During this rest all leaky positiona
are displayed with measurements
result on the screen . The three
curent values represent (as before)
standby-, inrush- and holding
currents.
GF signal
In this case there is a leakage of 18
mA on the lines. See Line Survey on
page 22.
19
LD Thorough
This test checks the standby current
of each Line Decoder. After
programming of all decoders, the
Line Voltage is interrupted for
approximately one minute. Line
voltage is then reestablished and all
Decoders are tested for correct
response.
Any Decoder that foes not respond
has an abnormal comsumption and
should be replaced.
20
Manual Tests
Line Decoder
A given number of current
measurements will be made each
time a decoder is tested. The time
interval will set the time between
each measure taken. The value of
the time interval is user definable and
can be set from 5 ms to 100 ms. The
default value is 20 ms. In our
example you may verify the standby,
inrush and holding to 34, 482 and 56
mA.
If you want to start with a specific
decoder, click on the button with the
question mark and select the one
from the drop down list. If you do
not select a specific one, the test
program will start with the first in the
installation. When the readings
appear you may stop the valve and
start the next.
21
The necessary instruments for servicing the irrigation system is a digital
voltmeter and a clampmeter. If the voltmeter is used only to check
voltages on the system, a resolution of 1 V is sufficient.
Digital Voltmeter
Clampmeter
Short Finding
Select “Electrical Measurement”
From the manual Test Menu. When
you press “Run Test” the AC Line
voltage will change form 1 cycle/sec
to 50 cycles/sec which can be
meeasured with a clampmeter.
Start with measuring the currents on
the Lines at the LTB-500. If more
thatn one Line has shorts, check one
at a time by disconnecting the
others. In cas eof a loop, disconnect
one end. Follow current through the
Line until it disappears indicating that
you have passed the shortening
point. A precise “as built” diagram
saves time.
The clampmeter can be either a probe connected to a voltmeter or a
separate instrument. In the first case the voltmeter must have a
resolution of 1 mV (AC). Observe that although the resolution is 1 mV
the accuracy is typically +/- 3 mV. The probe must have a resolution of 1
mA. For the probe a conversion of 1 mA to 1 mV would be normal. As a
separate instrument, it is difficult to find one with a measuring range
down to 1 mA. Most of these are designed for power applications and
minumum ranges of 1 A are the usual. Normally clampmeters register
only AC current but it is possible to get meters that register DC currents
as well, but those are more expensive.
A problem common to both the voltmeter and the clampmeter is the
frequency of the AC in the system. AC meters are normally designed for
frequencies from 50 Hz to 1000 Hz (mains frequency is 60 Hz). The
frequency of the Flowmaster system is 1 Hz, but more about this in
connection with the individual measurements.
22
Line Survey
This screen gives an overview of
voltages and currents in the system.
Values are updated every second,
but not all at the same time. This
means that when values are varying
with time, the readings shown on the
screen does not correspond.
This part contains Line current. The
limit is the current where the voltage
is reguylated down to prevent
overload. The expected current is
calculated on basis of the nubmer of
Line Decoders in the installation data
base. The difference between single
and multiple Decoders is of course
considered.
The voltage is the Line voltage
measured on the output of the
controller. When the voltage drops
below the high threshold, the line
power is shut off. The low theshold is
used when the Field Access unit
communicates. The Line 1 and Line
2 fields alternates red/green to
simulate the AC but are not
synchronized with the actual Line
Voltage.
This box shows values of the Ground
Voltage system for corrosion
protedtion. Voltage “@ the case” is
the Ground Voltage referenced to the
negative line. When this voltage
reaches the threshold, Line Voltage
is shut off. The current is the leakage
current. Internal voltage is the
reference for the Ground Voltage
regulator.
23
Irrigation Schedules
Select from the Irrigation Menu to
bring up the window which is the
“base” when writing schedules.
Schedule Name
Click on the Name field to make it
active and write the name you want
for your schedule.
Week Days
Click on the days field to bring up a
table with the 2 weeks which are the
programming period. To know which
week is the current, open the View/
Status window. In the Date and Time
field there is a number in parentesis
after the date. That number is the
day number in a 14 day cycle. In the
example the current day is Wednesday of the second week. When you
close the window, the marked days
are shown in the days field.
Start Times
click on the “Start Times” field to
open the table and key in the desired
start time. You may enter up to 12
start times for each Schedule.
Note that Military Time is used. 20:00
therefore equals 8:00 PM.
24
Methods
In the “Method” field select
Sequential.
See page 26 for explanation of
“Sequential”,“Priority” and
“Automatic”.
Line Decoder
From the drop down list under
“Types” you may choose between
Decoder or Sector, in this case select
Decoder.
Read about Sectors on page 24.
Select the Decoder from the drop
down list under Name. Names that
have already been included in the
schedule are removed from the list.
Minutes
Click on the “Min” field and enter the
desired run time (in minutes) for the
valve.
25
Delete Decoder
If you want to delete a Decoder from
a schedule, click on the grey “border
field” left to the Decoder. The line is
now marked with a black arrow. The
press the delete button.
To complete the deletion, click the
Yes button in the Warning window.
Dry Run (Simulation)
When a new schedule is created or a
schedule is changed, the duration in
the field “Sim Time” is marked with a
star. Click on the field to (re)calculate
the run time. This will bring up the
Dry Run table shown below.
In the table all times are shown
relative to the start time (00:00).
Notice that there is a delay of one
minute from the schedule is started
and till the first decoder starts. Also
valves start/stop at the full minute
only. The first minute is used by
theFlow Optimizer to calculate how
the valves must be started. If you
click on the leftmost button, marked
graph, you will get the pump load
curve (See the next page.)
26
The graph shows how the flow varies
during the schedule. The heading
shows total flow and total time. When
the sursor is moved in the graph, the
coordinates are shown in the field in
the bottom of the window.
Irrigation Methods
The Irrigation method is by default
sequential when you create an
Irrigation schedule, but you will
probably prefer to use automatic or
priority because they lead to shorter
watering times.
Sequential Method
The valves are activated one at a
time, in order as listed in the Demo
program and beginning at the top of
the list. The graph on top shows
sequential method for our TEST
schedule. Note that the total duration
is 2:06. The Flow Optimizer is not
used and even if you make the
mistake to place a valve that requires
more water than the pipe’s capacity,
the schedule will run.
Priority Method
Again the valves are activated in
order as listed, but this time as many
as the flow data allows for. Note that
the total duration is 0:47. If there are
mistakes in the flow data (too large
valve on too small pipe) the schedule
will not run! This method is of course
more efficient than the sequential but
still has the advantage that the order
in which the valves are started is well
known.
27
Automatic Method
The Flow Optimizer calculates the
optimum number and order in which
to activate the valves, trying to utilize
fully, as much of the time as possible, the maximum water capacity of
the system. Note that the total
duration is now 0:32. The only
problem is that the valves seems to
come on at random, which make it
hard to figure out which will come on
next.
Start Irrigation
Schedule status
Select the status field to get the drop
down menu and select “Active” to
change the schedule status from
passive to active. Only active schedules will run when Irrigation is turned
ON.
When you set schedules to “Passive”, they are stored for later use
and will not be executed when
Irrigation is ON.
Irrigation ON
Even schedules with status “Active”
will not run until the Irrigation is
turned ON.
Select “Status” from the View-menu
and click on the “ON” button. The
field with Irrigation Status will now
change to “Irr On”.
Irrigation OFF
Irrigation may be turned off in two
ways. By clicking on the “Off”-button
the system is reset to Irrigation Off
immediately and execution of all
schedules are stopped. By clicking
on the “Off when idle”-button,
system is changed to Irrigation Off
but the current schedule will be
completed as programmed.
28
Updating window
Some fields, f. inst. the Sim. Time,
are not updated automatically. Press
<F5> to get the window completely
updated. This will also rearrange the
schedules so that active schedules
are moved to the top of the list (and
in alphabetical order).
Schedule overlap
TWC-500 can only run one schedule
at a time. If you have overlapping
schedules only the one already
running when the second comes to
start, will be executed, the second
will be rejected.
To test that click the “Dry Run, All”
button.
The table shows clearly which
Schedules are overlapping and
which one is rejected.
Te resolve the conflict, change start
time for one or more schedules.
In the graph the schedules that run
are blue and the rejected are marked
with red.
29
Water Budget
Water budget allows you to adjust
the watering time from 0-300 %. a
Water Budget of 100 % means that
the irrigation will be carried out as
initially programmed. In this TEST
schedule you will 3 get times the
minutes that you keyed in with the
decoders. The 100 % should correspond to normal watering time. In
dry periods, setting WB to 150 %
would give you 50 % more water.
Time Window
Time Window prevents schedules
from watering within a certain time
frame called the Window. This
means that a running schedule will
be terminated when the Time
Window starts. Manual operation of
schedules and decoders are still
possible. Note that the Irrigation
Status field changes to “Closed”
when within the window (and
Irrigation is ON).
Manual Start/Stop
Decoder Start
Select from the “Manual” menu
Decoder Start/Stop. In the control
window select the desired Decoder
from the list. The list is sorted in
alphabetical order. Enter the duration
and click on the Start button.
Decoder Stop
Select from the list the desired
Decoder and click on the Stop
button.
Stop All Decoders
Click on the Stop All button. This will
also stop all decoders that are
activated by a schedule.
30
Schedule Start/Stop
Select the schedule and click on the
Start or the Stop button.
Display Man. started
Decoders
31
Monitoring
This window lists all events in order
of time. Use the scroll slider to move
up and down in the list. All events
are recorded to a file on the PC’s
harddsik
When the PROCOM Central unit is
“Off line” (not in contact with your
PC), it still records events to memory
in the TWC-500. The recordings are
transmitted to the PC next time they
are “On line”. The TWC-500 can
store at least 2.500 lines.
The monitor window shows the
name of the unit, action, date & time
and the flow total.
Print Monitoring
If you click on the “copy” button the
content of the monitor log is copied
to the Windows clipboard. From
there it can be pasted to the
wordprocessor of your choice, and
then printed.
32
Logviewer
To work with the monitoring data you
must use the function Extract and
view monitor log.
The data can not be extracted
unless you are connected with the
controller.
When you select this menu point, the
program “Logviewer” which is an
Excel macro will be started. If your
security system prompts you that the
program contains macros that might
contain virus, you must say yes to
start these.
For this to run properly you need
Excell 7 or later and Windows 98
or later.
If you are connected to the controller
the TWC program will look for the
spreadsheet program Excel. If it is
installed on your PC, the program
“Logviewer” which is an Excel macro
will be started. (If your security
system prompts you that the
program contains macros that might
contain virus, you must say yes to
start these.) The monitoring data will
automatically be imported into Excel.
Activity bars will keep you informed
of the progress in the import and
conversion of the data.
33
When the data treatment is finished,
click on the Overview button on the
Front Page to get the report os
shown here. The report will show
start times and gallonage for the
Schedules and eventual alarms.
If you want to check the deails of the
monitoring, select from the “Excel”
menu “data.xls”
This will open a window that lists
which valves were operating
together, the times and the
corresponding flows.
Notice that each Schedule has its
own sheet with a separate tag in the
data window.
Any of the monitoring sheets may be
printed from Excel in the usual way.
When you want to close the
“Logviewer”, select “logviewer972000.xls and click the exit button. All
the data sheets will automatically be
stored when you exit this way.
34
Sector
Sectors are groups of Decoders that
should be treated in the same way. It
is a tool to expedite data input when
you set up an Irrigation schedule.
In this example a sector (BEDS) is
created with 4 Decoders that will
normally run together and for the
same time.
Though a Decoder is included in a
sector it may still be included in
schedules as an individual.
Select Display/Modify Sector. In the
Sector Edit window select the first
field (with Total) and wirte the sector
name.
Now click on the Decoders field in
the “BEDS” line. This will open a
new window, “Decoders display”
Click on the first field (Total) and
write the name of the first Decoder.
To add another Decoder, press
<Enter> until the next field becomes
selected and write the next name.
If you key in a non existing name,
this message will occur.
35
When you are finished with your
sector, close the window.
Delete Sector member
If you want to remove a member of a
sector, click on the grey border left to
the The line is now marked with a
black arrow. Decoder and press the
Delete button.
You must click on the Yes button in
the warning window to complete the
deletion.
36
Pump Status
The pump status has three modes:
-Not installed
-Active
-Passive
The picture shows that only Pumps 1
and 2 (with Pump Decoders) have
been installed. Their status are now
“Active”. This means that these two
pumps will be used during irrigation.
“Passive” means that a pump is
installed, but is temporarily out of
operation (for repair or maintenance). The system will correct for
reduced pump capaicty during
irrigation. If you change the status of
a pump it will affect the time needed
to carry out irrigation. It is thererfore
advisable to make a Dry Run.
Note that the status of pumps can
only be changed while the system is
in Irrigation off mode.
Sensor Status
The sensors status has three modes:
-Not installed
-Used
-Not used
If, for example, you want to prevent
your Rain sensor from stopping the
irrigation, it is not necessary to
disconnnect it. Just change the
status to “Not used”.
The table also shows when a sensor
was ON last time and when it went
OFF again. If a sensor is on when
you select this function, no OFF time
will appear.
37
User password
The User password is set up in
exactly the same way as the Installers Passwork, see page 6-7.
Once the User Password is activated,
the system asks for it before
changes can be made in the following:
-Irrigation Start/Stop
-Start/Stop of valves
-Password
-Date and Time
-Sectors
-Pump and Sensor status
-Modify Irrigation Schedule
-Time Window
38
This page is intentionally blank.
39
PROCOM Main Parts
MCM3
LCM3
PSM3
40
System Components
LTB-500
Line Terminatin Box
LTB-500/CB
Circuit Board for LTB-500
41
Line Decoders
LD-100
SP-100
Surge Protection
LD-200
LD-400
LD-600
42
SD-100
Sensor Decoder
PD-100
Pump Decoder
43
MOP-1
Modem cables
OC-100
Optical Isolator
MOP-1
44
FA-100
Field Access Unit
FAB-100
Field Access Unit connection box
45
PROCOM Specifications
Hardware specifications:
System capacity
Valves operating simultaneously
Electrical input
Electrical output
Signal cable
Main processor
Storage components:
Main system program
Installation Data
Working memory
Battery Backup
Environment
50, 100, 200, 300, 400, 500 decoders
40
24 VAC from security transformer, 50-60 Hz, 100 VA
33 V square wave
2-wire double insulated
NEC type V40, 16 bit microprocessor
128 kB EPROM +´256 kB FLASH-ROM
64 kB S-RAM
512 kB RAM
Clock/calendar and Installation Data
Office: 41 F to 86 F
20 to 80 % humidity
Software specifications:
Irrigation Schedules
Start times
Timing
Programming cycle
Operation methods
Sectors
Dry Run
Monitoring
Manual operation
Main Pipe sections
Valve types
Pump control
Sensors
Field Control
Languages supported
Measurement units
30
Each schedule: 12 times per day
0-999 minutes, in one minute steps
14 days
Sequencial, Priority, Automatic
150
Simulation on screen
Monitoring on screen and with Logviewer to print/reports
Full manual operation of Decoders/Schedules
100
100
Full automatic control of 6 Main Pumps + 9 Booster pumps
Special Pump Decoder available
Direct wired sensors:
Rain Sensor
Aux. Sensor
Line monitoring:
Line current
Leakage current
Sensor decoder:
10 Sensor Decoders for flow
monitoring with high-flow and
leakage alrams
Operation of Field Access Unit FA-100 supported
Currently english only, other languages available on request.
Gallons , inches, m3, liters, mm
46
Index
A
Monitoring 31
Automatic Method 27
Automatic testing 16
N
C
New Pipe 7
Central Unit, connections 3
Connect 14
D
Date and Time 10
Decoder Start 29
Decoder Stop 29
Delete Decoder 25
Delete Sector member 35
Dry Run 25
F
P
Parameters 6
Print Monitoring 31
Priority Method 26
Pump Decoder 9
Pump Status 36
R
Remove password 7
S
Installation of software 4
Installers Password 6
Irrigation Methods 26
Irrigation OFF 27
Irrigation ON 27
Irrigation Schedules 23
Schedule Name 23
Schedule overlap 28
Schedule Start/Stop 30
Sector 34
Sensor Inputs 9
Sensor Status 36
Sequential Method 26
Short Circuit 10
Short Finding 21
Simulation 25
Solenoid resistance 15
Start Irrigation 27
Start Times 23
Stop All Decoders 29
System Layout 2
L
T
LD Thorough 19
Line Decoder 20, 24
Line Decoders 8
Line Survey 22
Line Voltage 10
Logviewer 32
Test of installation 15
Time Window 29
Transfer of Data 13
True monitoring 15
TWC-500 Main Parts 39
TWC-500 Specifications 45
Type of Valves 8
Flow Monitoring 12
Flow Sensor 10
G
GF signal 18
GF Solenoids 17
I
M
Main Pipe 7
Man. started Decoders 30
Manual Start/Stop 29
Manual Tests 20
Menu Tree 5
Methods 24
Minutes 24
Modem connection 14
U
Updating window 28
User password 37
W
Water Budget 29
Week Days 23
47