1
Establishing a Diode Laser Absorption
Spectroscopy Laboratory in Quito, Ecuador
Master's Thesis
by
Christoffer Bjorkwall and Marta Cassel-Engquist
Lund Reports on Atomic Physics, LRAP 347
Department of Physics, Lund Institute of Technology
Lund, September 2005
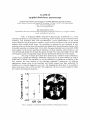
Abstract
Diode laser absorption spectroscopy has many useful applications and has
the advantage that the equipment in most cases is small: cheap, and easy
to handle. A laboratory in this field of research and education has been
established at the Department of Physics at Escuela Politecnica Nacional in
Quito, Ecuador as a Master's project.
The laboratory equipment was sponsored by the International Science Programme in Uppsala, Sweden. It includes two systems, one for studying rubidium absorption and one utilizing the GASMAS technique; GAs in Scattering
Media Absorption Spectroscopy. This technique has been used for in-situ
studies of free molecular oxygen embedded inside scattering media, properties unique for this technique. The GASMAS technique was introduced
in 2001 at the Division of Atomic Physics, Lund Institute of Technology,
Sweden.
The scope of the project was to prepare the equipment for transportation,
transfer technology and knowledge about it on site in Quito, assemble the
set-ups, and finally make experiments on topics of high potential for Ecuador.
Measurements on fruits, polystyrene foam, volcanic rocks, and balsa wood
were performed.
Contents
1
2
Introduction
1.1 Background
1.2 Purpose
1.3 Goal
1.4 Achievements
1.5 Outline .
Theory
2.1 Light propagation in matter
2.1.1 Reflection
2.1.2 Absorption
2.1.3 Scattering
2.2 The diode laser
2.2.1 History.
2.2.2 Advantages
2.2.3 Basic principles
2.2.4 Optical properties .
2.2.5 Mode jumps .
2.2.6 Tunability
2.3 Absorption spectroscopy
2.3.1 Line shapes
2.3.2 Analysis
2.4 Modulation
2.4.1 Advantages
2.4.2 Basic principles
2.4.3 Lock-in amplifier
2.5 GAS~L~S
2.5.1 Basic principles
2.5.2 \' ormalization .
2.5.3 Standard addition .
7
7
8
9
9
9
11
11
12
12
13
14
14
14
15
17
18
18
19
20
21
21
22
22
23
25
25
27
28
4
CONTENTS
2.5.4
Restrictions . . . . . . . . . . . . . . . . . . . . . . . . 29
3 Equipment
3.1 Diode lasers
3.2 Laser controllers . . .
3.3 Function generators .
3.4 Detectors . . . . . .
3.4.1 Photo detector
3.4.2 Photomultiplier tube
3.5 Lock-in amplifier
3.6 Oscilloscope
31
31
32
33
33
34
34
34
35
4
Preparations
4.1 Finding suitable lasers for oxygen
4.2 Finding suitable lasers for rubidium
37
37
39
5 Technology and knowledge transfer
5.1 Poster . . . . . . . .
5.2 Presentation . . . . .
5.3 Laboratory exercises
5.4 Manual .
5.5 Website
41
42
42
43
43
43
6
45
45
46
48
49
52
Assembly
6.1 Rubidium set-up . . . . . . . . . .
6.2 GASMAS set-up . . . . . . . . . .
6.2.1 Optimizing the parameters .
6.2.2 Situation specific noise
6.3 Lab VIEW . . . . . . . . . . .
7 Experimental work
7.1 Standard addition . . . . . . . . . . . . . . . . . . . . .
7.1.1 Sample dependency . . . . . . . . . . . . . . . .
7.1.2 Lock-in amplifier sensitivity setting dependency
7.2 Polystyrene foam . . . . .
7.2.1 Different width . .
7.2.2 Different thickness
7.3 Drying balsa ;vood
7.3.1 .\Iethod .
7.3.2 Results ..
7.3.3 Discussion
55
55
56
57
58
58
60
61
61
61
62
COXTEl\TS
7.4
Fruit and vegetable overview .
7.4.1 ~Iethod
7.4.2 Results .
7.4.3 Discussion
7.5 Cutting a papaya
7.5.1 Method
7.5.2 Results .
7.5.3 Discussion
7.6 Cutting a banana
7.6.1 Method
7.6.2 Results .
7.6.3 Discussion
7. 7 Peeled apple ..
7.7.1 Method
7.7.2 Results .
7. 7.3 Discussion
7.8 Nitrogen exposed tree tomato
7.8.1 Method
7.8.2 Results . . . .
7.8.3 Discussion ..
7.9 Volcanic rock overview
7.9.1 Method
7.9.2 Results .
7.9.3 Discussion
5
62
63
63
63
65
65
67
67
67
67
68
68
68
69
69
69
70
70
70
70
71
71
71
73
8 Summary and conclusions
8.1 Results of the project ..
8.1.1 Preparations . . .
8.1.2 Technology transfer .
8.1.3 Assembly . . . . . .
8.1.4 Experimental results
8.2 Future work . . . . . . . . .
75
75
75
75
76
76
77
Acknowledgements
82
Bibliography
83
A Work responsibilities
87
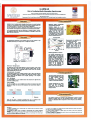
B GAS MAS poster
89
C Presentation abstract
91
co;,;TENTS
6
D Rubidium laboratory exercise
93
E GAS MAS laboratory exercise
95
F Manual
97
Chapter 1
Introduction
Before the beginning of this project there were only two laboratories in
the world with GASMAS set-ups; GAs in Scattering Media Absorption
Spectroscopy [1]. The original set-up is located at the Division of Atomic
Physics at Lund Institute of Technology (LTH) in Lund, Sweden. Another
one, donated by International Science Programme and assembled by the
Lund diode laser spectroscopy group at LTH, is located at the University of
Zimbabwe in Harare, Zimbabwe. As a result of this Master's project, there
is now also one at the Department of Physics, at Escuela Politecnica Nacional (EPN) in Quito, Ecuador. This report will describe the full process
of preparing, mounting, and testing a diode laser spectroscopy laboratory,
containing both a GASMAS set-up and an absorption set-up for rubidium
gas, from its beginning in Lund to its conclusion in Quito.
1.1
Background
In 1961 an organization named International Science Programme, ISP, was
founded at the Uppsala University, Sweden, in order to improve research in
developing countries in mathematical, physical, and chemical sciences. Its
philosophy is to help build up research on site in the countries in long-term
cooperations. After an application from Prof. Edy Ayala at EPN, the organization decided in 2004 to finance a laboratory for absorption spectroscopy
research at EPX. The Division of Atomic Physics at LTH was made responsible for ordering the equipment. The equipment was bought, and parts were
manufactured in the mechanical workshop at LTH.
8
Chapter 1. Introduction
?viSe. Gabriel Somesfalean, who had pursued the Harare Project including a
visit for integration at University of Zimbabwe, also did these arrangements
for the project in Quito. Although, due to his upcoming PhD dissertation,
the project could not be completed.
In discussions with Prof. Sune Svanberg at the Division of Atomic Physics
at LTH, a Master's project for the authors was formed with the aim of finalizing the original Quito project. With the different study background of the
authors, Electrical Engineering and Engineering Physics, useful knowledge
could be brought from a wide range to the project. MSc. Linda Persson,
graduate student in the Lund diode laser spectroscopy group was involved in
the project. She functioned as a mentor, providing very valuable guidance
and inspiration to the project. She also made a visit to the Quito site to
contribute in the project.
With the completion of the present project and with the inclusion of an
already existing diode laser set-up for laser-induced fluorescence spectroscopy
in Quito, being the result of a previous development project f2], diode laser
spectroscopy is now firmly established in Ecuador.
1.2
Purpose
The purpose of the project was to establish a diode laser research and teaching laboratory at EPN for diode laser absorption spectroscopy. In the future,
this laboratory will allow the possibility to perform research and have a good
environment for education in the area of absorption spectroscopy.
Our task was to prepare the equipment in Lund before transport, assemble the experimental stations on site in Ecuador, and initiate experimental
studies. It became clear that there was also a need to perform informational
activities about the equipment and its applications, for the students and
possible cooperation partners, on site.
The purpose of this report is not only to leave a detailed report about the
\Jaster's project, but also to produce a good source of information for the
people 'vho "'"ill continue the work on the absorption spectroscopy set-up at
EPX.
1.3 Goal
1.3
9
Goal
The goal of the project was to leave a well functioning absorption spectroscopy laboratory, both for education and research, together with the knowhow about it for future researchers and supervisors. Another goal was to investigate a research field of interest to the country of Ecuador, possible to be
investigated with the GASMAS technique, and to pursue initial experimental
studies with the equipment.
1.4
Achievements
After checking and preparing in Lund, the equipment was successfully delivered to EPN, after about a two months delay at the customs of Ecuador.
This time of delay was partially spent by performing information activities
such as making a poster, holding a presentation, and making connections
with possible research partners. Once the equipment arrived, it was assembled and optimized as planned. During this part a local Diploma student,
Ms. Yolanda Angulo, was taught about the systems and was step-by-step
involved in the mounting and investigation processes.
Together with our local supervisors at EPN, Prof. Edy Ayala and Dr. Cesar
Costa ,different investigations were planned and performed. Measurements
were made on fruits, balsa wood, volcanic rocks, and polystyrene foam with
promising results.
Additionally, an introductory laboratory exercise was created for GASMAS
and applied. A laboratory exercise for the rubidium set-up was also translated from a corresponding activity used at LTH. A program was developed
in Lab VIEW making it possible to perform automated and unattended longtime measurements. As a help for future researchers on GA.SMAS at EPN, a
user manual was made. In order to make information about the systems and
laboratory exercise instructions easily accessible, a website was constructed
and uploaded on the EPN website.
1.5
Outline
This report contains a theory chapter, Ch. 2, that treats the basic component
of diode laser absorption spectroscopy: interaction between light and matter,
10
Chapter 1. Introduction
diode lasers: and modulation techniques. The theory chapter ends with a description of the GASMAS system and method. Ch. 3 describes the different
parts of the equipment. The other chapters are placed in chronological order
as they followed in the project; Ch. 4 describes the preparations in Sweden:
Ch. 5 the informational activities performed when the authors arrived to
Quito, Ch. 6 the assembly and Ch. 7 the experimental part. The report
ends with a summary and a conclusion, Ch. 8, including a brief discussion
of future work.
Chapter 2
Theory
To understand absorption spectroscopy, knowledge of how light interacts with
matter is needed. Useful tools in absorption spectroscopy contexts are the
diode lasers. Many times in absorption spectroscopy the signals obtained
are very small, and a way to increase the sensitivity is to use modulation
techniques, which for example the GASMAS technique uses.
2.1
Light propagation in matter
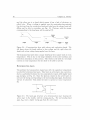
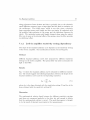
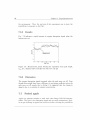
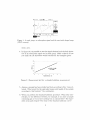
When an incident beam of light strikes a material, different interactions take
place. In general, there are three possibilities: the light can be reflected,
absorbed and/or scattered, see Fig. 2.1. Depending on the specific material,
one or two of these actions dominate over the other.
REFLECTION
ABSORPTION
SCATTERING
Figure 2.1: The three possible interactions between light and matter; reflection, absorption, and scattering.
12
Chapter 2. Theory
2.1.1
Reflection
A light beam that hits a surface between two media will be partially reflected,
due to the change in refractive indices, n. The reflectance, R, is calculated
as
(2.1)
where n 1 is the refraction index of the medium where the light beam travels
from and n 2 is the refraction index of the medium being hit by the light
beam. The reflectance is the fraction of the incident light being reflected [3].
2 .1. 2
Absorption
Atoms and molecules absorb energy at certain frequencies or wavelengths.
This is an effect of their electronic shell structure and the vibrational and
rotational energy levels. If the photon energy, i.e. its frequency or wavelength, is suitable to the atom or molecule, it may absorb the energy and
get excited. Every atom and molecule has a unique set of absorption lines,
i.e. a "fingerprintt'. This makes it possible to identify for example a gas with
absorption analysis [4, 5].
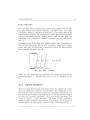
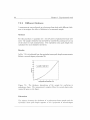
When the absorption is much greater than the scattering, it is theoretically
described by the Beer-Lambert law
I(v, x) = Io(v)e-a(v)c·x.
(2.2)
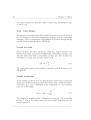
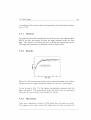
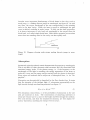
It states that the intensity of the incident light, ! 0 , is attenuated exponentially
through an absorbing material, see Fig. 2.2. The cross section of absorption,
cr, is the probability of absorption with a unit of area per molecule or atom.
The concentration of absorbing molecules or atoms is c, and x is the length
traveled through the medium. When no scattering occurs, this length is the
same as the physical thickness of the sample. The cross section is frequency
dependent, matching the energy level structure [4, 5].
A derived property a(v) is called the absorbance. It is defined as
a= cr(vo)c · x,
(2.3)
where cr(v0 ) is the absorption cross section at the frequency v0 , the center
of the line [5]. It is usually absorbance that is measured in absorption spectroscopy experiments.
13
2.1 Light propagation in matter
Intensity
x Length
Figure 2.2: The absorption of a beam with the intensity 10 , according to the
B eer-Lambert law.
All materials absorb differently depending on the physical state and composition. Solids, liquids, and gases all have different absorbing features. Gases
have much sharper absorption lines t han solids or liquids, for which t he atoms
or molecules undergo complex interactions [1].
2.1.3
Scattering
Scatt ering occurs when an incident beam interacts wit h a particle and the
reemission of t he energy, or parts of it, is in many directions. This effect is
a result of t he emission of t he forced oscillating electric charges, from t he
alternat ing electrical fields [3]. T he scattering process results in t he path
length, t he distance t he photons t ravel, being different from t he t hickness of
t he sample, see Scattering in Fig. 2. 1.
There are different scattering processes and which one of t hem t hat occurs
depends on t he material and t he wavelength of t he incident light beam . If
t he particles causing t he effect are small compared to t he wavelength , it
is called eit her R ayleigh or Raman scattering. If t he particles are large in
comparison wit h t he wavelength, it is called Mie scattering. T he Rayleigh
and Mie scattering are elastic effects, t he energy is conserved in t he processes.
The Raman scattering is inelastic, meaning the energy is changed in t he
process, and thus t he wavelength is shifted [3, 4].
14
Chapter 2. Theory
2.2
The diode laser
Since the introduction of diode lasers, they have become a common component in our daily life. Their size, price, and ability to easily tune in wavelength
have also made them common in absorption spectroscopy. Their semiconductor structure allows them to lase at low power and room temperature.
However, the diode lasers also have product-specific disadvantages like beam
divergence and mode jumps.
2.2.1
History
The first version of the diode laser was developed simultaneously in 1962 by
four different and independent science groups. The first diode lasers developed were homojunction-based units and had to operate at temperatures of
only a few Kelvin. Later during the same decade, the heterojunction-based
lasers were discovered and made more or less the homojunction-based lasers
obsolete. The heterojunction lasers function at room temperature, which
opened possibilities for many new applications [7]. During the 1980's this
laser type experienced a rapid increase in commercial use, particularly regarding telecommunications [8]. One application, among many, that became
more available because of this was laser spectroscopy [4].
2.2.2
Advantages
Diode lasers are the most commonly used lasers in the world today. It is
possible to find them in products such as CD players, bar-code readers and
within optical communication systems [8]. The wide use of diode lasers has
made them mass produced and thus relatively cheap, with prices ranging from
$1 a piece [9]. Although, since they are normally produced for commercial
application purposes and not for research experiments, they might not have
exactly the wavelength or features sought for. They also have a property
referred to as mode jumps, see Sect. 2.2.4, which limits the wavelengths
available [8]. There are custom made diode lasers on the market, guaranteed
not to have mode jumps. However, these Distributed Feedback lasers, or DFB
lasers, are more expensive [10]. By testing several mass produced lasers, it
is possible to find lasers suitable for research, at a low price.
Another advantage of diode lasers, in comparison to other laser types, is
their size. The diode lasers, including shielding and connectors, are normally
2.2 The diode laser
only the size of a green pea, see Fig. 2.3. This enables possibilities to build
compact equipment .
Figure 2.3: A diode laser and a green pea.
Other attractive features of diode lasers are t heir energy efficiency and easy
operation. The major advantage of diode lasers for spectroscopic purposes,
however , is their ability to be tuned in wavelength. The ability to scan
the wavelengths around an absorption line is a key feature for absorpt ion
spectroscopy [4] .
2.2.3
Basic principles
Diode lasers, or semiconductor lasers, are produced using advanced material
processing techniques, as a compound of different materials. The materials
used depend on which wavelength the laser is intended for. It is today possible
to reach wavelengths between 0.4 to 29 f.Lm . The majority of the diode lasers
are made of doped mat erials from group III (e.g. Al, Ga, In) and group V
(e.g. N, P, As, Sb) in the periodic system . Diode lasers made from these
materials emit light in t he wavelength range 600-1600 nm [7]. There are two
general types of diode lasers; homojunction lasers and het erojunction lasers.
Homojunction lasers has a more simple construction than heterojunction
lasers and will be described as a mean to understand t he function of diode
lasers.
Homojunction lasers
A homojunction diode laser is created by joining semiconducting materials,
doped in different ways. One part is n doped, has an excess of electrons,
15
16
Chapter 2. Theory
and the other one is p doped which means it has a lack of electrons, so
called holes. When a voltage is applied over the semiconducting material
the electrons from the conduction band and holes from the valence band will
diffuse and be able to recombine, see Fig. 2.4. Photons, with the energy
corresponding to the band gap, will be emitted [7].
Depletion
C
---.~~--...area
.
'·~.
,
onductiOn
band
p-region
n-region
n-region
Valence
band
Figure 2.4: A homojunction laser with valence and conduction bands. The
left figure shows the bands without a bias voltage and the right shows the
bands with a bias voltage being applied over the laser.
The homojunction lasers have a major drawback; they cannot work at room
temperature. This is due to the large thickness of the active medium and
losses from absorption in the junction. This results in the need of a very high
current at room temperature for the diode to be able to lase [7].
Heterojunction lasers
The problem the homojunction lasers have with the operation temperature
is solved for heterojunction lasers. They have an active layer, also a semiconductor, sandwiched between the two semiconductor layers with higher band
gap energies, see Fig. 2.5. Since the photons created in the active layer do
not have the energy corresponding to the surrounding band gaps, the photons
will not be absorbed. This allows the laser to operate at room temperature
[7].
]~ ~ --~
. . . . . . . . . . . . . . . . . . . . . . ol__________i___l
Figure 2.5: The band gap structure of a heterojunction laser showing the
active layer in the middle, with the energy gap E 91 . The surrounding band
gaps, E 92 , have a higher energy gap than the active layer.
2.2 The diode laser
17
Laser production
First, the light will be spontaneously emitted and amplified with the help
of a gain medium in an optical resonator, a so called cavity. The cavity
is formed by having a reflectance of about 30 % on the cleaved faces of the
semiconducting material. The spontaneously emitted photons being mirrored
will cause stimulated emission, emitting photons with the same phase and
wavelength, and if population inversion is provided, the laser will start to
lase [7].
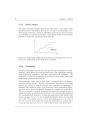
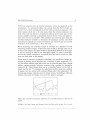
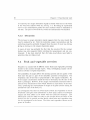
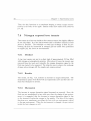
The output power of the diode laser rapidly escalates once a threshold current, Ith has been reached, see Fig. 2.6. Exceeding a certain level of output
power, will cause the laser beam to irreversibly destroy the semiconductor
facets, and thus the entire laser [7].
lth1
lth2
lth3
Current
Figure 2.6: The output power as a function of the injection current for different temperatures, T. The diode laser starts to lase at a threshold current,
fth·
2.2.4
Optical properties
There are some disadvantages with diode lasers; for example the output
beams are astigmatic, assymetric, and divergent. The astigmatism is a result of the fact that the refractive index has a directional dependence. The
assymetrical and divergent properties are due to the assymetrical shape of
the diode laser (normally rectangular 1 pm x 3 pm in the active layer). This
results in a 30-40° x 10-20° divergence. The beam, however, resembles a
Gaussian profile minimizing the problem. The problem with divergence of
the laser beam can rather easily be handled with a collimating lens [8].
18
Chapter 2. Theory
2.2.5
Mode jumps
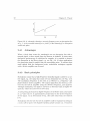
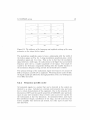
The major drawback of diode lasers is that they tend to mode jump. These
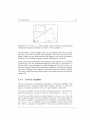
discrete jumps in wavelengths, see Fig. 2.7, are due to a shift in gain curve.
Mode jumps constitute a hazzle in absorption spectroscopy since they limit
the possibility to tune the wavelength. They severely limit the wavelengths
possible to reach with a particular diode laser [8].
Mode jump
I,T
Figure 2. 7: Mode jump.c; making discrete jumps in wavelengths when the current or the temperature to the diode laser is changed.
2.2.6
Tunability
The great advantages of diode lasers for spectroscopy overshadow the disadvantages. Diode lasers have high spectral purity, high wavelength stability,
great modulation capabilities, and most important of all; tunability. The
possibility to tune the wavelength of the laser is what makes diode laser
spectroscopy possible and simple [8].
The wavelength output from a diode laser, is dependent on both temperature and injection current. There is a temperature dependency of the band
gap and by varying the current, the gain curve and thus the wavelength is
changed. The refractive index of the band gap is also temperature dependent and can be altered by directly changing the temperature of the diode.
Thus, it is possible to use both temperature and injection current as tools to
change the output wavelength of a diode laser. The methods differ regarding
the wavelength shift produced. A band gap temperature shift makes a difference of about 0.25 nm;oc and a change in refractive index of about 0.06
nm/°C [8]. The relation between current and wavelength is in the order of
10- 3 nm;'mA [11]. Practically, this means that temperature is used for coarse
tuning and the injection current is used for fine tuning of the wavelength.
19
2.3 Absorption spectroscopy
However , there are problems involved in tuning diode lasers. The standing
wave in the laser cavity determines t he wavelength sent out from t he diode
laser. In order to have a well-defined wavelength, the diode laser has to
operate in a single mode. Single-mode operation means that there is only
one standing wave in the cavity and thus only one wavelength being emitted.
The opposite condition , multi-mode operation, occurs when there are more
than one standing wave simultaneously in t he cavity. This is due to the
frequency separation between the modes being smaller than the width of the
gain profile of the laser [7]. A multi-mode behavior results in more t han one
wavelength competing in the output .
2.3
Absorption spectroscopy
With absorpt ion spectroscopy it is possible to investigate a sample quantitatively and qualitatively. Every material has its own fingerprint created by
the energy levels in the atom or the molecule. From t he results of absorption spectroscopy the concent ration , temperature, and pressure of a gaseous
sample can be quantified [4].
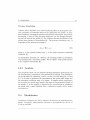
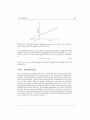
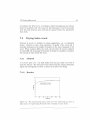
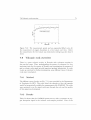
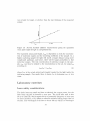
An absorption spectroscopy set-up consists of t hree main parts; a light source,
an absorbing sample, and a detector. The light is sent through t he sample
and the output light is detected and measured as shown in Fig. 2.8.
Light source
Absorbing material
Detector
Figure 2.8: Figure showing the three main parts of an absorption spectroscopy
set-up for gas samples; a laser source, a sample absorbing the laser beam, and
a detector.
When diode lasers are used in absorption spectroscopy it is referred to as
TDLAS, Tunable Diode Laser Absorption Spectroscopy. By letting the injection current to the diode laser have a saw-tooth shape, it is possible to
repetively sweep over the absorption line and detect it in real t ime. The
wavelength in the diode laser needs to be narrow and operate in single mode
to be able to detect the absorption lines. Lasers have a finite line width, and
20
Chapter 2. Theory
it is of great importance that this width is smaller than the absorption line,
to detect it [5].
2.3.1
Line shapes
An absorption line always has a finite width. How wide it is and the shape of
the line depends on the sample temperature, pressure, and the surrounding
materials. A way to characterize the broadening of the line is through stating
the Full Width at Half Maximum, FWHM [4].
Natural line width
Every absorption line has a natural line width, flvn. This is related to the
lifetime of the state as indicated by Heisenberg's uncertainty principle. The
principle states that with an uncertainty in time, flt, there is always an
uncertainty in energy, fl.E, and thus frequency [4]
fl.E · flt
n
>
-.
- 2
(2.4)
The natural line width is under standard conditions only at an order of 0.1100 MHz [5].
Doppler broadening
At low pressure, under 10 Torr, the thermal motion of the atoms or molecules
dominates over the broadening of the natural lines. This is called the Doppler
broadening, flvD, and is dependent of the temperature, T, and molecular
mass, M, of the sample
flvD =canst· vo{f;.
(2.5)
The Doppler broadened line has a Gaussian line shape [4]. This broadening
is about 1 GHz in the visible region and thus strongly dominates over the
natural line width.
21
2.4 Modulation
Pressure broadening
Collision effects dominate over other broadening effects at atmospheric pressure, producing a Lorent1,ian shape on the absorption line profile. At standard conditions, atmospheric pressure and ambient temperature, the pressure
broadening is about 3 GHz and thus dominates over the Doppler broadening and the natural line width [5]. The collisions shorten the lifetime of the
excited state because of deexcitation [4]. The pressure broadening, D.vL, is
dependent of the pressure according to
(2.6)
where Pi is the partial pressure and 'Yi is the partial pressure broadening
coefficient [5].
At intermediate pressures, 10- 100 Torr, the resulting profile is a convolution
of a Gaussian and a Lorentzian profile. This is called a Voigt profile and has
to be computed numerically [5].
2.3.2
Analysis
The properties which can be achieved through absorption spectroscopy are
the concentration, temperature, and pressure of the sample. The absorbance
can be calculated by measuring I and ! 0 , see Fig. 2.9, and using Eqs. 2.2 and
2.3. To be able to determine the concentration, the optical path length and
the absorption coefficient need to be known. In samples where scattering is
not an issue, the optical path length is the same as the geometrical length of
the sample. It is also possible to determine the concentration by comparing
the signal with a signal obtained from a calibration sample, with a known
concentration.
2.4
Modulation
\{adulation techniques are used to enhance the detection of small absorption
signals. Frequently, phase-sensitive detection is accomplished by the use of
a lock-in amplifier.
22
Chapter 2. Theory
Figure 2.9: A schematic showing a sweep in frequency over an absorption line
at v 0 . I is the recorded intensity at v0 and ! 0 is the intensity if no ab.cwrption
would take place.
2.4.1
Advantages
When a diode laser scans the wavelength over an absorption line with a
ramped signal, a direct signal from the detector is obtained. In some cases,
absorption spectroscopy on rubidium for example, it is possible to observe
the absorption in the direct signal, e.g. see Fig. 2.9. In other applications
the absorption signal is smaller than the surrounding noise. To extract these
small signals from the background noise, modulation techniques together
with a lock-in amplifier can be used.
2.4.2
Basic principles
Modulation means that a high-frequency sinusoidal signal is added to a carrier signal, e.g. the ramp that scans over an absorption line, see Fig. 2.10.
The modulation frequency is also sent as a reference to a frequency- and
phase-sensitive lock-in amplifier. The output signal from the detector, is filtered by the lock-in amplifier using the reference frequency, and analyzed.
Through modulation, the signal is moved to a detection band at higher frequencies, where the noise level is lower [13].
A noise getting attenuated at higher frequency is the flicker noise, also known
as 1/f-noise since it is approximately proportional to the inverse frequency
of the signal. In an electronical set-up, this noise stems from the resistors
[14].
::'viodulation with the use of a lock-in amplifier could be explained as sitting in
a noisy cafe in Quito with Spanish-speaking people around you. If someone
2.4 Modulation
Figure 2.10: A ramp, i.e. a direct signal, with an arbitrary super-positioned
modulation frequency including a zoom-in on the modulation.
talks Swedish a couple of tables away, you can probably hear that, through
the noise, if you are a Swedish native speaker. Your brain (the lock-in amplifier) singles out the characteristics (the signal at the specific modulation
frequency), the Swedish language, and the information is retrieved.
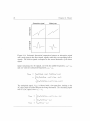
Using modulation in absorption spectroscopy is also referred to as derivative
spectroscopy, since the modulation signal gets the form of a derivative of a
certain order, if the modulation is small in amplitude [15, 16]. In Fig. 2.11
the direct signal is shown for an absorption signal and a mode jump together
with their resulting lock-in signal if the second harmonic output is studied.
The lock-in signals are then proportional to the second derivative of the direct
signals [16].
2.4.3
Lock-in amplifier
The key instrument in modulation techniques is the lock-in amplifier. This
instrument uses a technique called phase-sensitive detection to detect AC
signals, as small as nanovolt, with a very good signal-to-noise ratio.
The lock-in amplifier uses an external reference frequency to modulate the
experimental system WR 1 and to create an internal signal W£ 1 thus WL = WR·
The lock-in amplifier creates an internal signal 1 VLsin(wLt + 'PL), from the
input reference signal from the modulation generator. The input signal to
the lock-in amplifier 1 obtained from the modulated experimental system,
"Vsi 9sin(wRt + 'PR), is amplified with a pre-amplifier on the lock-in amplifier. The two signals are multiplied by the lock-in amplifier leading to a
23
24
Chapter 2. Theory
Absorption signal
Mode jump
roc::
0)
+
"iii
c::
"T
~
(.)
0
..-I
Figure 2.11: Schematic theoretical comparison between an absorption signal
and a mode jump in the direct signal, together with their corresponding lock-in
signals. The lock-in signals correspond to the second derivative of the direct
signal.
signal containing two AC signals, one with the added frequencies,
and one with the subtracted frequencies, wR- W£.
wR
+ WL,
Vsi 9 sin(wRt + <pR) · VLsin(wLt + <p£)
VPsD -
1
2Vsi9 VLcos((wR- wL)t + (<pR- <pL))
1
-2 Vsi 9 VLcos((wR + wL)t + (<pR + <pL))
The multiplied signal, VPsD, is filtered with a low-pass filter, leading to the
AC signal with the added frequencies being eliminated. The remaining signal
will be a DC signal, since WR ---,- W£.
1
2Vsi9 VLcos((c.v·R- wL)t + CfR- '{h)
1
2VsigVLcos(cpR- 9£)
x
Vsi 9 cos(cpR- ...pL)
2.5 GASMAS
This DC signal, "Vsi 9cos( cp R- cp L), can be adjusted to its maximum amplitude
by changing the phase to: cpR = cp£. The DC signal, VPsD, is proportional
to the sought signal and denoted in this report as the lock-in signal.
There are three important properties of the lock-in amplifier when optimizing
the signals; the phase, the sensitivity setting, and the time constant. The
phase setting changes i.pL and thus also the amplitude of the obtained lock-in
signal. The sensitivity setting changes the amplification of the pre-amplifier.
The time constant refers to the time constant of the slope of the low-pass
filter.
2.5
GASMAS
GASMAS, GAs in Scattering Media Absorption Spectroscopy, has common
features with other types of gas absorption spectroscopy. It uses the three basic modules: the light source, the absorbing sample and the detector. What
makes GASMAS unique is that it permits in-situ measurements of free gas
inside a scattering solid or liquid. The GASMAS method can also give information about the pressure, temperature, internal structure, and diffusion
characteristics of the investigated material [12]. The technique has, since its
first appearance in 2001, been used to investigate a wide range of applications
and subjects such as, polystyrene foam [12], gas exchange in fruits [17, 18],
wood [6], packaging plastics [18], and diagnostic measurements on human
sinuses [19].
2.5.1
Basic principles
In the GASMAS set-up the light from a diode laser, with a sharp spectral
output, is sent into a scattering medium through an optical fiber, see Fig.
2.12. The light is scattered in the sample and the pores of the target gas
absorb the light at its specific wavelength. This results in a signature in the
output signal. This signal is detected with a photomultiplier tube, PMT,
whose output signal is analyzed with modulation techniques. For GASMAS,
two different measurement geometries are possible; transmission and reflection through backscattering [1, 18].
25
26
Chapter 2. Theory
Laser
Driver
mod 1
T
Diode
......
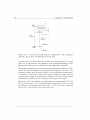
Figure 2.12: Schematic picture of the GASMAS set-up.
What enables the GASMAS method to sort out the absorption line from
the free gas embedded in the scattering material, is the line characteristic.
Gases have many times more narrow absorption lines, typically 104 times,
than liquids or solids [6]. Thus , the narrow absorption gas line occurs in
a background of a broad absorption feature that comes from the scattering
material. Hence , it is possible to assume that these background properties
are constant over the range the wavelength is tuned [12].
Due to the scattering, the path length of the photons is not the same as
the thickness of the sample. This results in a more difficult approach to
the Beer-Lambert law. There are ways of estimating the real distance the
light has traveled. For this purpose, spatially resolved , time-resolved, or
frequency-domain methods have been introduced. Then, by analyzing the
scattering and absorption properties and using the Beer-Lambert law , the
distance traveled by the average photon , can be calculated [1] . In some
applications, it is not necessary to know this. In these cases it is enough
to int roduce a unit called equivalent mean path length , Leq, as a relative
measure of the concentration of gas inside the sample, see Sect. 2.5.3 . This
unit, however, also depends on the scattering properties of the sample [1].
For the modulation techniques, in GASMAS , it is convenient to use the
second derivative of the signal due to the fact that the second derivative is not
sensitive to the general slope of the direct signal. The GASMAS technique
uses a modulation frequency in the kilohertz range, so called wavelength
2.5 GASMAS
27
modulation spectroscopy, since the frequencies are much smaller t han the
half width of the absorption line [13] .
So far, GASMAS has only been used studying molecular oxygen embedded
in scattering materials. The narrow absorption lines studied in molecular
oxygen belong to the so called A band, see Fig. 2.13, at wavelengths around
760 nm. The absorption is due to transitions between vibrational and rotational states [5]. In theory, the only thing that needs to be changed to study
another gas is the wavelength, hence the laser [6] . The detector might also
have to be changed to be sensitive in the specific wavelength range.
>..
(nm)
Figure 2.13: Th e narrow absorption lines belonging to the A band of molecular
oxygen {20}.
2.5.2
Normalization
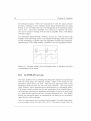
When dealing with absorption spectroscopy it is of great importance to normalize t he signals to be able to compare results. In GASMAS, normalization
is calculated by taking the height of the lock-in signal divided by t he interpolated DC intensity of the direct signal at t he location of the absorption
signature, see Fig. 2.14 and Eqs. 2.7 and 2.8. The normalized signal is
referred to as the GASMAS signal, and denoted GMS [15].
(2.7)
GMS
(2.8)
28
Chapter 2. Theory
Figure 2.14: An illustration of a theoretical direct signal and a lock-in signal
as they appear on the oscilloscope screen. The definitions used for normalization are given in the figure.
2.5.3
Standard addition
In GASMAS, the standard-addition method is introduced to determine an
equivalent mean path length. The method is well known in physical chemistry and it relates the absorption signal to that of absorption in free air.
The basis of this calibration technique is that a linear relationship between
the absorption signal and the oxygen concentration is expected since the
absorption signal is only a few percent of the signal.
An equivalent mean path length, Leq, can be extrapolated by letting the
laser light travel a known distance through a well-characterized oxygen-rich
medium, such as normal air, and determining the increase in absorption signal, see Fig. 2.15. For a scattering sample, this would correspond to the
distance the light would have to travel through air to obtain the same signal.
For this reason the equivalent mean path length ean be longer, or shorter,
than the thickness of the measured sample [1]. The reason for using the
standard-addition method and the equivalent mean path length unit is to
transfer the rather abstract oxygen absorption into a tangible unit.
The equivalent mean path length depends on both the concentration of
molecular oxygen and the scattering coefficient of the sample. In a highly
scattering sample, the light will travel a longer distance along more compli-
29
2.5 GASMAS
::i
cci
._
L/cm
Figure 2.15: Several standard addition measurements giving the equivalent
mean path length through an extrapolated line.
cated pathways. Hence, there will be a larger probability to find molecular
oxygen. The real concentration of molecular oxygen in the sample, c8 m, can
then be related to the concentration in free air, cair, by using Leq according
to
(2.9)
where Lsm is the actual optical path length traveled by the light inside the
sample [12].
2.5.4
Restrictions
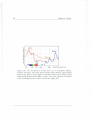
A very important limitation one has to deal with when performing gas absorption measurements in the general case, is the absorption of other compounds. The interferences depend on the sample type and the spectral region being analyzed. Among the most important interferences is the ubiquitous water vapor. Water is widely distributed in all types of biological
tissue and strongly absorbs light for wavelengths larger than 1400 nm [1].
Hemoglobin absorption practically eliminates all light transmission for wavelengths shorter than 600 nm. The oxygen absorption lines that GASMAS
uses are between these wavelengths, around 760 nm, making it possible for
the light to penetrate human tissue without substantial absorption by these
compounds, see Fig. 2.16. The wavelength range between 600 nm and 1400
nm is called the tissue optical window.
30
Chapter 2. Theory
.....
c
.~
u
&::
<11
0
u
c
0
-~
~
0
"'
.0
~
~
Q)
0
-'
300
500
700
1000
2000
3000 Wavelength (nm )
Figure 2.16: The absorption in human tissue due to hemoglobin (Hb02 ),
melanin, and water. The tissue optical window ranges between approximately
600 nm and 1400 nm where light can penetrate human tissue without being
substantially absorbed by the Hb0 2 or water. The arrow indicates the location
of the wavelength for the A band of molecular oxygen {21 j.
Chapter 3
Equipment
There were two different absorption spectroscopy set-ups sent to Ecuador;
one studying rubidium gas and one using the GASMAS technique. The setups consist of mechanical, optical, and electronical parts. Many of these parts
are shared between the set-ups. This results in that both set-ups cannot be
used at the same time.
The rubidium set-up is a good and simple example of absorption spectroscopy
and is therefore often used in laboratory exercises in absorption spectroscopy.
The essential parts are a diode laser, a glass cell containing rubidium gas,
and a photo detector. The GASMAS system, see Fig. 2.12, is more complex
and uses modulation techniques, hence it also needs a modulation generator
and a lock-in amplifier. Since it handles smaller signals, it also needs a
photomultiplier tube as a detector.
3.1
Diode lasers
In the GASMAS set-up, a 5 mW commercial diode laser from Roithner
LaserTechnik (RLT7605MG) is used. These diode lasers lase nominally at
around 760 nm. They are commercially used for laser printers [22] and thus,
the supply is good and the diode lasers are relatively cheap. The diode lasers
used in the GASMAS project cost around $100 each [9].
The diode laser used for the rubidium set-up has to be able to scan either
the D 1 line at 794.7 nm or the D 2 line at 780.2 nm, see Fig. 4.2 [23]. The
diode lasers tested and used in the Quito set-up only range over the D 1 line.
Chapter 3. Equipment
32
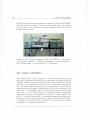
The diode lasers are physically attached to a laser head (Thorlabs TCLDM9).
This laser head also contains a TE cooler element which either cools or heats
the diode laser to the constantly monitored temperature given by the temperature controller [24].
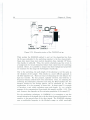
Figure 3.1: The electronical equipment used for GASMAS; 1. Laser driver,
2. Temperature controller, 3. Modulation generator, 4. Lock-in amplifier, 5.
PMT voltage supply, 6. Ramp generator, 7. Oscilloscope.
3.2
Laser controllers
Two essential parts of the equipment to control the diode laser are the
laser driver (ThorLabs LDC202) and the temperature controller (ThorLabs
TED200). The laser driver provides the current needed to drive and tune the
diode laser. The temperature controller is used to determine the temperature
and then steadily keep the temperature at this given limit. This limit is important since a small change in temperature will shift the wavelength of the
diode laser. The controller is able to regulate the diode laser temperature
from -40°C to + 150°C [25]. However, for practical reasons in the experiments with our set-up , the temperature was limited to values between l5°C
and 55°C. Outside of these limits, the temperature regulation mechanism for
reaching the extreme temperatures was too slow to be functional. Normally,
it is advised not to go below lOoC or above 50°C because of risk for water
condensation or thermal degradation [8].
3.3 Function generators
3.3
Function generators
Two function generators are used; one to ramp the current to the diode laser
and another one for the modulation frequency. In this report they are defined
as the ramp generator and the modulation generator in order to differentiate
between them.
The ramp generator (Thurlby Thandar TG215) is used to sweep the injection
current with a saw-tooth signal sent to the diode laser. The frequency limit
of the generator, for the set-ups used, depends on the lock-in amplifier and
the oscilloscope see Sect. 6.2.1.
The modulation generator (Thurlby Thandar TG 1010) is used to produce
the high frequency modulation signal which is added to the slower ramp,
see Fig. 2.10. It provides the reference signal for the lock-in detection.
The upper frequency limit is set by the frequency range of the reference
channel in the lock-in amplifier. The modulation frequency cannot be higher
than half the reference channel frequency limit, since the second harmonic,
2j, of the modulation signal is studied. The lock-in amplifier used has an
upper reference channel frequency of 102 kHz [26]. Therefore, a modulation
frequency higher than 51 kHz cannot be used when the second harmonic is
studied.
The two signals from the generators are added. This is done by a power
splitter (Mini-circuits ZFRSC-2050). Depending on how the device is used it
can either take one signal and make two exact copies of it, or add two signals
into one. However, using the device in this last manner, the amplitudes of
the input-signals are halved.
3.4
Detectors
Because of the various needs of the two set-ups, two different detectors are
used; a solid-state photo detector and a photomultiplier tube (PMT), both
creating a current proportional to the detected light. The PMT is a more
sensitive detector and has a larger detection area, which is preferable when
absorption in scattering materials is studied. Each detector could be used
for both set-ups, but normally the P:\IT is preferred for the GA.S:VIAS set-up
and the photo detector is preferred for the rubidium set-up.
33
34
Chapter 3. Equipment
3.4.1
Photo detector
A battery driven photo detector (Thorlabs DETllO) is used to detect the
laser light in the rubidium set-up and for the process of selecting usable lasers.
The photo detector uses a photodiode to create a current proportional to the
detected light. The detector can be saturated by a too high intensity of light.
3.4.2
Photomultiplier tube
In the GASMAS set-up, the intensity of the detected light is normally very
weak since it is attenuated in a scattering medium. In order to detect this
small intensity of light, a photomultiplier tube (Hamamatsu R5070A) is used
since it is an extremely sensitive detector. The large detection area is also
an advantage since the light is scattered.
A photomultiplier tube consists of a photocathode, an electron collection
system, an electron multiplier section (dynodes in a cascade manner), and
an anode. When the incoming light hits the photocathode electrons are
emitted. If a high voltage is put over the PMT the electrons get directed and
accelerated towards the dynodes and the anode. When striking a dynode, the
electrons produce secondary electrons, creating a cascade. The anode will
receive the electrons and create a current [27]. The high voltage is provided
from an external high-voltage supply in the GASMAS set-up.
It is of high importance not to let the signal current from the PMT reach
too high values, since this can destroy the device. For the setup, the output
current was measured over a resistance and displayed with an oscilloscope.
The maximum output current from the PMT is generally 100 J-lA and it is
usually linear up to 10 J-lA. With a too high current, the PMT gets destroyed
because of ohmic heating.
3.5
Lock-in amplifier
The lock-in amplifier used in the GASl'viAS set-up (Stanford Research Systems SR810) is digital. It has a reference channel frequency that ranges
bet\veen 1 mHz and 102 kHz [26]. The properties; phase, sensitivity, and
time constant, see Sect. 2.4.3, are frequently used to optimize the properties
of the lock-in signal.
3.6 Oscilloscope
3.6
Oscilloscope
In order to observe the signals from the detector and lock-in amplifier, an
oscilloscope is essential. The set-up uses a 200 MHz digital oscilloscope
(Tektronix TDS360) with a GPIB port. This port can be used in order
to analyze signals using a computer program, such as LabVIEW.
A 100 MHz analogue oscilloscope (Tektronix 2235) was used in parallel with
the digital one for a short period of time. Analogue oscilloscopes are better
than digital oscilloscopes at showing fast signals superpositioned on slower
signals [28], as is the case when an absorption signal is studied in a ramp. It
was discovered that small features in the direct signal, like mode jumps and
absorption signals, were easier detected with the analogue oscilloscope.
35
Chapter 4
Preparations
The two set-ups require diode lasers operating at different wavelengths, according to the absorption wavelength of the target gas. Rubidium has strong
absorption lines and hence, they are relatively easy to find. Oxygen absorption lines studied in GASMAS, however, are weaker and need modulation
techniques. Because of this inequality, different methods were used to find
the absorption lines for the gases.
As described before, there are DFB lasers that can be used in absorption
spectroscopy. With these rather expensive lasers one do not have to perform
extensive testing of the lasers. One of the key features of the project was
low cost, so testing mass-produced diode lasers was the option chosen. It
was also important to send lasers to Ecuador that did not need to be tested
there. The facilities and equipment at EPN are not as suitable for exploring
and finding the correct lasers, as at LTH. Therefore these preparations took
place in Sweden. The preparations lasted for about six weeks.
4.1
Finding suitable lasers for oxygen
:VIolecular oxygen has many rovibrational absorption lines around 760 nm,
in the A band, see Fig. 2.13. In order to search and find these lines with a
tunable diode laser, the maximum current values for different temperatures
first needed to be determined not to destroy the laser. \Vhen knmving the
current values for which the laser could be operated safely, the search for the
molecular oxygen absorption signals could be done.
Chapter 4. Preparations
38
Determining the maximum currents
The maximum current, Imax: and threshold current, fth, had to be determined
for different temperatures. The threshold current is the injection current
where the diode starts to lase and the maximum current is the injection
current that gives the maximum power allowed. Between 100C and 45°C,
Imax and the fth were determined for every 5°C increment.
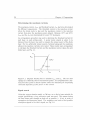
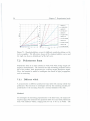
An extrapolation procedure was used to determine the threshold current for
each laser, at each setting point. A power meter, placed at about 5 em
distance from the laser, was used to measure the output power of the diode
laser. For two arbitrarily output powers, between lasing and the maximum
allowed, the injection currents were noted. These results were extrapolated
to calculate the threshold current and the maximum current values for each
diode laser, see Fig. 4.1.
p
Pmax
I
I
I
I
I
I
I
I
I
I
I
Ith
I max
Figure 4.1: Diagram showing how to calcv.late Imax and fth· The two stars
signify two arbitrarily chosen measurement points. An extrapolated line (dotted) from these points is shown together with a line indicating the empirically
estimated dependency of the power on the current.
Signal search
:VIolecular oxygen absorbs weakly at 760 nm, so to find a laser suitable for
oxygen spectroscopy a long absorption path was used. This means letting
the laser beam pass through as much air as possible ( > 10 m) in order to
strengthen the absorption signal. The technique was used to find possible
absorption signals in the direct signaL see Fig. 2.9.
4.2 Finding suitable lasers for rubidium
To investigate these possible absorption signals, a spectrometer was used.
The aim was to clarify if the signals were referable to absorption, mode
jumps or multi-mode operation. The spectrometer also showed the range,
around a certain wavelength, where the diode laser was operating in a single
mode. This is a requirement for working around a specific oxygen absorption
line.
The investigation was continued using a lock-in amplifier. The settings of the
lock-in amplifier were adjusted until a nice absorption signal was obtained.
With the help of the lock-in amplifier, additional investigations could be
performed to study the absorption signal. On both of the two diode lasers
tested, absorption signals were found, but one had nearby mode jumps.
Since oxygen is homogeneously spread throughout the air, a certain distance
of air is equal to a certain oxygen concentration. A linear relation procedure
was performed to determine that the absorption signal was linearly dependent
to the distance of air. By measuring the GMS signal at varying path lengths,
a linear relation was determined for the absorption signals obtained with the
two lasers tested.
Finally, a wavelength meter was used to determine the wavelength of the
laser and thus which line being responsible for the absorption of the light.
According to the wavelength meter, the operating wavelength for the best
absorption signal found, was 763.31 nm (at 38.08°C at an injection current
of 37.4 rnA) suggesting that the absorption line observed was P7Q6 [20].
4.2
Finding suitable lasers for rubidium
Rubidium is an alkali metal commonly used in absorption spectroscopy. Its
concentration in a sealed-off cell can be investigated by observing the so
called D 1 or D 2 lines, see Fig. 4.2. The search for absorption signals, either
the D 1 or D 2 line, was done by letting the light from a diode laser pass a
7 em glass cell containing rubidium gas and observe the output light with a
photo detector. The rubidium vapor pressure at room temperature is only
10- 7 mmHg, but due to the very high transition probability, a strong signal
is still expected [4]. Since the exact wavelengths of the absorption lines were
known, a wavelength meter was used to measure the wavelength during the
signal search to simplify locating the absorption signals.
\Iost of the diode lasers tested had a wavelength of about 785 nm at 25 ac
in accordance with the data sheets. Thus, it was necessary to cool the laser
39
40
Chapter 4. Preparations
F'
5 2P312
3
1
S2P112
2
0
1
F
2
02
780.2 nm.
01
794.7 nm
F=2
S'Su2
F"'1
Figure 4.2: A selection of energy levels for rubidium-87.
called D 1 and D 2 lines are indicated by arrows {2Sj.
The transitions
to around 10°C to reach 780.2 nm or heat it to around 45-50°C to reach
794.7 nm. It was, however, not possible to cool the lasers sufficiently to emit
light around 780 nm due to restrictions in the temperature controller.
During the investigations, very strong absorption signals were achieved. Thus,
neither the lock-in amplifier nor the spectrometer needed to be used. The
absorption signals were observed directly as an oscilloscope representation.
It was easy to verify that a signal really was an absorption signal, and not
a mode jump, simply be removing the rubidium cell and see if the signal
disappeared or heating the cell to observe the increase of the signal.
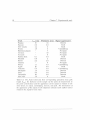
ac
and
Each laser, of the 18 examined, was tested between approximately 13
50°C with this method. At an acceptable diode temperature (42 oq two clear
and distinct D 2 absorption lines were found. A few other lasers, operating
around 49°C, also detected these absorption lines.
Chapter 5
Technology and knowledge
transfer
The task of the project was not only to assemble the equipment but also to
collaborate on the local level to build up a knowledge basis around it. Activities were started, aimed to help inspiring students to get involved in the
project. Since GASMAS is a rather new technique it was found necessary
to introduce it to researchers from other units at EPN, discussing potential
applications with them in their own fields of research, and invite them to participate in collaborative experimental studies. During the project a Diploma
student, Ms. Yolanda Angulo, was involved full-time. This was an excellent
opportunity to share the experience gathered by the authors in Lund during
the preparation phase. Ms. Angulo collaborated in all the aspects of the
installation and development, learning all the aspects of the set-up.
At institutes such as LTH, the academic and scientific structure is organized in a certain way to foster the education of new students. Graduate
students carry on, as part of their duties, the propagation of knowledge on
methods and instruments to newcomers. This is an efficient way to keep a
basis knowledge at home. However, at places like EPN this does not apply.
Undergraduate and Diploma students usually have to help others on their
same level to learn. As aid tools for this process, the following activities were
worked out:
1. Prepared a scientific poster and posted it together with other written
posters about GAS::VIAS on the walls of the department
2. Performed a presentation about absorption spectroscopy and GAS.\IAS
42
Chapter 5. Technology and knowledge transfer
to a general audience
3. Prepared and carried out a laboratory exercise on GASMAS and translated an already existing laboratory exercise instruction for rubidium
absorption
4. Wrote a user manual for the set-up
5. Created a website
These five items are described shortly below. We believe that as long as
people are made aware of the possibilities, the chances of making productive contacts with other local researchers and of attracting students to get
involved, grow significantly.
5.1
Poster
The goal of making a poster, see Appendix B, was to prepare a single-pieced,
fully comprehensive document, of high visual impact describing GASMAS,
the equipment involved, and some possible applications. Several copies of
this poster were made and posted on the campus, along with the invitation
to an oral introductory presentation, to stimulate the interest of potential
attendees.
5.2
Presentation
In line with our efforts to spread knowledge and inspiration to students and
potential collaborate partners at the university an oral presentation was held.
This presentation was carried out together with MSc. Linda Persson, from
the Lund diode laser spectroscopy group, who was visiting the EPN for about
10 days, supporting the project. The objective of this presentation was to
give a detailed and lively introduction to the system. The intention was to
present the possibilities of the system to specially invited researchers at the
university in order to start a discussion on possible future collaborations.
Appendix C shows an Abstract of this presentation.
5.3 Laboratory exercises
5.3
Laboratory exercises
Involving many students in the GASMAS activities, including getting handson experience with the equipment, was another important objective. By
having laboratory exercises, the system will be used by many people and
hopefully some students might get interested in continuing to work with the
system at the summer practice, Diploma and Master Thesis level.
A laboratory exercise made and frequently used in Sweden for rubidium absorption spectroscopy was translated from Swedish into English and further
modified, see Appendix D. A laboratory exercise for understanding the basics of GASMAS was prepared and carried out together with students at
EPN, see Appendix E.
5.4
Manual
The experiences from the establishment of the laboratory were discussed
and collected in a user manual, see Appendix F. This manual is meant to
facilitate the technique and the set-up to future users. It includes a brief
theoretical introduction, and a detailed description of the different parts of
the set-up at EPN and its operation. Also some basic standard procedures
and measurement methods are described. The manual should also be helpful
for the trouble-shooting of some possible problems with the equipment. The
manual is written with the intention of constant improvement. Hence, a
section of the manual was dedicated to instruct these updates.
5.5
Website
A website was set-up in order to have a constant and independent source
of information about the project. This website was put on the EPN web
server (http:/ /www.epn.edu.ec/Departamentos/fisicaProy.html). It presents
the project, gives important contact information, and contains the two laboratory exercise instructions. The website was also constructed in order to
be used in the future to present information about ongoing projects etc.
43
Chapter 6
Assembly
During the preparations in Sweden the entire rubidium set-up and the major
part of the GASMAS set-up were assembled and tested. The reason for doing
this was not only to test the equipment and to find possible missing parts,
but to get hands-on experience on the GASMAS technique and the set-up.
After arriving into Ecuador, there was a two months delay before the equipment could be cleared from the local customs, due to some unexpected problems. In Ecuador the rubidium set-up was mounted first. Because of its
simplicity this set-up could be used to test the other parts of the equipment.
After getting the rubidium set-up to function most of the equipment had actually been checked and verified, and the more complicated set-up for GASMAS could be assembled.
6.1
Rubidium set-up
The lasers suitable for rubidium absorption signals found in Sweden turned
out not to be so suitable after arriving in Quito. Eventually, the sought absorption signals were found at a ten degrees higher diode temperature than
in Sweden and with a significant difference in appearance. The system also
showed instability, a signal could suddenly disappear when no variables were
changed. After this, the signal took a long time to retrieve and had again
shifted in temperature. Parts of these problems were probably due to the
laser not working in a single mode. To ascertain that the signal was not a
spurious one, the gas cell was either removed to see the disappearance of
the absorption feature from the signal, or heated to observe the increase of
46
Chapter 6. Assembly
the absorption signal. When the temperature is risen the vapor pressure
increases, resulting in more rubidium atoms being released from the metal
deposit on the cell walls, and hence an enlargement of the absorption signal
can be seen. The lock-in amplifier was connected to optimi;~;e the detection and to practice working with the lock-in amplifier with a well-defined
absorption signal.
The absorption signals showed a W-form, see Fig. 6.1. This was due to the
hyperfine structure being visible. The Doppler broadening, which is 0.5 GHz
at this wavelength, is smaller than the separation between the transitions,
approximately 1 GHz [29], making it possible to see the hyperfine structure.
Figure 6.1: W-shape signals of two absorption lines in rv.bidium and their
corresponding lock-in signal.
6.2
GASMAS set-up
The same problem with not finding the absorption signals was experienced
with the diode lasers for molecular oxygen. Thus, a new search for the
absorption signals had to be done. This was once again done with a long
absorption path and with the use of a photo detector. The laser output
could, however, not be analyzed with a spectrometer or a wavelength meter.
This made it hard to know how far the wavelength of the emitted light of
the diode laser was from the absorbing wavelengths or how far a mode jump
or a multi-mode behavior was from a certain absorption line. After finally
finding the absorption signal. an optimization was made on the modulation
signal and the lock-in settings.
After the achievement of an optimized lock-in signal, the length dependency
;vas once again tested, this time with a P.\IT. The output current from the
47
6.2 GASMAS set-up
PMT was measured over an external resistance, 5 kD, and analyzed on the
oscilloscope. As mentioned before, the current from the PMT should not
exceed 10 JLA, which corresponds to 50 mV with the external resistance. The
direct signal turned out to be very noisy, when the external resistance was
used. The noise was found to probably be inherent of the input ports of the
lock-in amplifier, and had an amplitude of about 20 mV. Thus, the signal-tonoise ratio was not acceptable. This problem was solved by only using the
external resistance initially to determine the maximum current, but while
analy;,ing the signals the external resistance was removed and the internal
resistance of the oscilloscope, 1 MD, was used.
When measuring the molecular oxygen in a sample it is desirable to avoid
measuring ambient oxygen. If the laser beam would go through open air on
its way to the sample, the signal would be significantly affected by the oxygen
in the air, causing an offset to the absorption signal. In order to avoid this,
and for the overall convenience, an optical fiber was used to couple the light
from the diode laser to the sample.
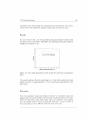
When using a sensitive modulation technique, the interference fringes appearing at certain optical interfaces are a problem of great magnitude. Every flat surface reflects some light which can be reflected again from a facing
surface, causing periodic intensity variations that overlaps the absorption
signals [5, 3]. These fringes show up as a wave-like feature on the lock-in
signal, see Fig. 6.2. To minimize the reflections, the fiber ends were polished
in angles, but the system still contained fringes after this adjustment. By
introducing random vibrations into the whole system, the different reflecting
surfaces move and the fringes even out if the signal is averaged.
·chl
·2v
g·
soomv-~· M is·.ns · Exf :f
1.s·v
'
Figure 6.2: Interference fringes appearing as a wavelike feature on the lock-in
signal.
Initially, the laser beam was focused into the fiber with a lens, but to pre-
48
Chapter 6. Assembly
vent reflections the lens was removed. This action caused a decrease in the
transmission intensity (from 75 % to 50-60 %), but removed the fringes substanstially, together with an offset caused by the air distance.
It was discovered that the ramp signal interfered with the modulation signal
in the lock-in amplifier, creating a low-frequency interference. In order to
remove this signal a pre-made high-pass filter with a cut-off frequency of
1.6 kHz was put just before the input of the lock-in amplifier.
When the high-pa..c;s filter was introduced in the circuit the direct signal
almost disappeared. This can be explained by the impedance of the high-pass
filter (10 kS1). Since the oscilloscope has a fixed input impedance of 1 MS1,
a voltage division occurred leaving the oscilloscope with approximately 1 %
of the signal. By making two other high-pass filters with the same frequency
response but other impedances (100 kS1 and 1 MS1, respectively), the fraction
of the signal to the oscilloscope could be improved.
6.2.1
Optimizing the parameters
The settings of the electronic equipment in general and the function generators in particular are important for a well functioning system. The optimal
amplitude and frequency settings for the function generators were systematically investigated by testing different settings from a minimum to a maximum
under which the signal could be obtained.
The time constant of the lock-in amplifier was investigated for an optimal
setting, which turned out to be 1 ms. Above this value, signals were broadened, and under this value signals were too noisy. This time constant was
used for all ramp frequencies.
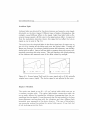
The amplitude of the ramp selects the observed wavelength range. With a
larger amplitude, the signal is less prominent than for smaller amplitude,
but more of the surrounding features can be seen. The frequency of the
ramp affects the signal if it gets too large, then the signal is smeared out,
see Fig. 6.3. This is due to the set time constant on the lock-in amplifier
and the sampling rate of the oscilloscope. The time constant averages the
signal during this time and hence decides the numbers of samples possible.
With a too large time constant or a too high ramp frequency there will be an
insufficient amount of samples to provide an accurate signal. The practical
frequency limit of the ramp \vas found to be 20 Hz for the lock-in signal. see
Fig. 6.3, but normally ramp frequencies around 5 Hz were used.
6.2 GASMAS set-up
49
..,... ...------ .....--~--\\··..
__-·-·~·--'
.-~·
20Hz
40Hz
60Hz
Figure 6.3: The influence of the frequency and amplitude settings of the ramp
generator on the output lock-in signal.
The modulation amplitude seems to have a relationship with the width of
the lock-in signal, see Fig. 6.4. A large modulation amplitude gives a wider
absorption signal and vice versa. This is due to fact that the modulated
signal observes a wider span. It is also shown in the figure that an increased
frequency gives rise to a smaller amplitude of the signal. This might be
caused by the electronic components slowing down the transfer function or
the modulation frequency being too fast for the diode laser to follow.
The optimal settings of the modulation signal were found to be around 10
kHz in frequency and 60 mV in amplitude. With frequencies under 10kHz,
the signal rapidly got affected by the high-pass filter (with a cut-off frequency
of 1.6 kHz) and noise.
6.2.2
Situation specific noise
All unwanted signals in a system that can be detected at the output are
referred to as noise. Included are external environmental noise and noise
due to certain characteristics of the equipment. Due to the situation of the
laboratory at EPN and the specific properties of GASMAS, some particular
types of noise were identified. Some of these noise sources were specific for
the environment at this very laboratory. As mentioned before, noise types
like interference fringes, interference of the ramp, and the noise from the
lock-in amplifier were detected and treated, but other types of noise were
also discovered.
Chapter 6. Assembly
50
Modulation frequency
10 kHz
20 kHz
30 kHz
40 kHz
50 kHz
~-CDDDD
Figure 6.4: The influence of the frequency- and amplitude settings on the
modulation generator on the output lock-in signal.
6.2 GASMAS set-up
Ambient light
Ambient light was detected by the photo detector and caused a noise signal,
detectable on the direct signal. Different types of indirect illumination, like
sunlight, caused different offsets to the signal. Light from light bulbs or fluorescent lamps caused a 60 H~>; noise to the signal and an offset. As expected
from the modulation detection theory, this signal did not affect the lock-in
signal as can he seen in Fig. 6.5.
The noise from the electrical lights in the direct signal was of course easy to
get rid of by turning off the lamps and cover the optical table. Turning off
lamps was, however, not always possible because the laboratory was initially
shared with an office. Later a wall was built to separate these two rooms, substantially removing this noise source. This wall together with black-painting
of the windows also removed most of the offset caused by sunlight.
Figure 6.5: Normal signal {left) and the .same .signal with a 60 Hz optically
coupled noi.se source (right). The lock-in signal is not affected by the noise.
Impact vibration
The optics was based on an 60 x 45 cm 2 optical table which was put on
a common wooden table. This rather light-weight construction made the
set-up easily affected by impulse-like vibrations, propagating from the surroundings into the signals. It was discovered that this was caused by the laser
beam alignment moving along with the vibrations and thus, different light
intensities were measured at the photo detector. This type of disturbance
was somewhat reduced by putting the optical table upon a 10 em thick bed
of soft isolating protection foam.
51
52
Chapter 6. Assembly
Bad electrical ground
Having a good electrical ground connection is very important when dealing
with scientific equipment. This was a concern at EPN and the set-up was
connected to the best possible ground point. A connection to a supposedly
better installation in a nearby laboratory with a long cable did not improve
the situation, but worsened the quality of the signals. Probably, the cable
that connected the two ground points functioned as an antenna and thus was
adding high-frequency noise to the system.
6.3
LabVIEW
A computer program was developed using LabVIEW (by National Instruments) to simplify the measurements and make data analysis faster. This
program made it possible to transfer the data from the oscilloscope directly
into a computer. The functions of the program include the ability to retrieve
data from the oscilloscope memory and make automatic calculations. The
program calculates the GMS value from the absorption signal and plots the
values as well as saves them into a file for further manual investigations.
The functions of the program opened up new possibilities for automated and
unattended long-time measurements. Measurements that was not possible
to perform earlier, could now routinely be accomplished.
There were three major functions of the program, called Standard addition,
Single step, and Continuous measurement. The Standard-addition function
was made for discrete measurements where the conditions were changed between each measurement. It calculates a GMS value from a signal by making
a zero-level measurement for each new measurement. A zero-level measurement is defined by us as the measurement of background light. It is measured
when the laser is turned off. The Standard-addition function is preferred for
measurements that need a high accuracy, such as standard addition. The
Single-step function was also made for discrete measurements and works very
similarly to the Standard-addition function. The difference is that it does not
make a zero-level measurement for each new measurement. Hence, this function is faster but less accurate than the Standard-addition function. The last
function, and maybe the most important one, is Continuous measurement.
This function is what allows the user to make automated and unattended
long-time measurements. The user measures the zero-level through the program, enters the elapsed time of the procedure together with the interval
53
6.3 LabVIEW
between each measurement, and starts the measurement. The user interface
during run-time can be seen in Fig. 6.6
~-~·
:-0.0'346'>
GSM~etr«
~Jl'OQI'ei$
,-----------·''"
•
l'ltM-($«)
j2:+~4--
Figure 6.6: The user interface of the Lab VIEW program during run-time for
the function Continuous measurement.
Chapter 7
Experimental work
Experimental work was only performed on the GASMAS set-up. Different
experiments were performed to test the functionality and show the possibilities of the system. The first primary test to verify the absorption signals was
a lengthy procedure. Before measuring on real samples, different standard
addition curves on atmospheric gas were measured to be able to calculate
the equivalent mean path length for different samples. With the standard
addition curves it was also possible to measure how much molecular oxygen
existed intrinsically in the set-up. This was due to small spaces of air in
between the optical surfaces in the light path. This resulted in a signal offset
that one had to take into account while performing measurements.
Measurements on polystyrene foam slabs were made to study the dependency
of the equivalent mean path length on the physical size: width and height,
of the scattering medium. Additionally, different types of measurements
on fruits, balsa wood, and volcanic rocks were made to evaluate possible
applications for the technique. All of these measurements were performed in
transmission mode and with a signal averaging 256 recordings per sample.
For all measurements the area of detection of the PMT was fitted to the size
of the sample. Thus, if the sample did not cover the diameter of the PMT,
25 mm, black paper was used as a mask to block out light.
7.1
Standard addition
As mentioned before, the GAS:VIAS technique estimates the equivalent mean
path length by using the standard-addition method. This could be performed
Chapter 7. Experimental work
56
with or without using a sample: comparing only the slopes. The PMT was
used as a detector for this method.
When the different slopes are known for different sensitivity settings on the
lock-in amplifier, a standard-addition measurement does not need to be done
for each measurement.
7.1.1
Sample dependency
The incoming laser light to the PMT was too intense, and thus saturated
the PMT, if an attenuator was not used. A standard addition measurement
was performed on polystyrene foam, a folded paper, and an optical filter to
investigate which sample that was the most suitable attenuator.
Method
The method to determine the standard-addition curves is nothing but a
length dependency test. The GMS signal was measured and calculated for
different distances of air for different types of samples attenuating the signal.
Results
Table 7.1 shows the different equivalent mean path lengths and the slopes of
the standard addition curves obtained for the different samples.
Sample
Polystyrene foam
Folded paper
Optical filter
Slope (a.u.jcm )
0.52
0.68
0.71
Leq
(em)
30.2
2.05
0.57
Table 7.1: The d~!Jerent standard addition slopes obtained and the calculated
equivalent mean path length for three di.fferent light-attenuating samples.
Discussion
Standard addition gave, as expected, different equivalent mean path lengths,
depending on which sample being used. The obtained slopes also varied,
but should theoretically be the same. Particularly the slope obtained \vhen
7.1 Standard addition
57
using polystyrene foam deviates and this is probably due to the relatively
small difference measured upon a large signal and the limit in resolution on
the oscilloscope. The folded paper, which is very thin, gives a relatively
large equivalent mean path length and this can maybe be explained with
the possibly high scattering in the paper and the reflections between the
sheets. The equivalent mean path length obtained when using the optical
filter can be seen as the internal offset of the system, since the filter provides
no additional offset.
7.1.2
Lock-in amplifier sensitivity setting dependency
The slope of the standard addition curve depends on the sensitivity setting
of the lock-in amplifier. This mathematical relation was investigated.
Method
Different standard addition curves were measured for different sensitivity
settings on the lock-in amplifier. The optical filter was used to attenuate the
light to the PMT.
Results
Fig. 7.1 shows the standard addition curves obtained for different sensitivities. The results suggest the following dependency between the slopes of the
standard addition curves and the corresponding sensitivity:
S2
51
ks1 = - · ks2
(7.1)
where ks 1 is the slope obtained with the sensitivity setting 51 and ks 2 is the
slope obtained with the sensitivity setting 52.
Discussion
The mathematical relation found between the different sensitivity settings
used does not correspond perfectly to the data, but well enough to believe
that the mathematical relation is correct. The small discrepancy is thought
to be the result of inherent inaccuracies in the measurements.
Chapter 7. Experimental work
58
•
-
=10
y = 1.4498x +0.86344
•
-
sensitivity = 20
y =0.71943x +0.4131
•
-
sensitivity = 50
y =0.32269x +0.1 8862
•
-
sensitivity= 100
y =0 .14512x +0.085225
•
-
sensitivity = 500
y =0.033071x +0.018341
•
-
sensitivity
sensitivity = 1000
y =0.01622x +0.010109
Figure 7.1: Standard-addition curves for different sensitivity settings on the
lock-in amplifier. The left picture shows all the standard addition curves and
the right one shows a detailed part of the left curve.
7.2
Polystyrene foam
Polystyrene foam is an easy material to work with when doing oxygen absorption measurements. The material has high scattering properties and is
full of air pockets, both propert ies give a strong oxygen absorption signal.
Thus, t he material is useful to investigate t he nature of light propagation,
such as scatt ering.
7.2.1
Different width
A measurement on different polystyrene foam slabs with varying widths was
performed. This was done to investigate how far the scattering reaches perpendicularly to the incoming beam for a certain thickness of the slab.
Method
To investigate t he scattering perpendicular to t he laser beam, t he oxygen absorption signal was measured for quadratic slabs of 11 mm thick polystyrene
foam with different widths, ranging from 0.5 em to 10 em in width. T he
7. 2 Polystyrene foam
59
equivalent mean path length was measured and calculated for every piece.
The detector was masked for samples smaller than the detector area.
Results
As can be seen in Fig. 7.2, the equivalent mean path length increases until
the piece with a 3 em width. Thereafter, the equivalent mean path length is
stabilized at around 17 em.
18
......
16
14
E
I >3 em
. _ _ Infinite slab
I
12
0
._ 10
0'
Q)
_J
8
0 o~~--7
2--~3--~4--~5--~6--~7~~~
Width of polystyrene square I em
Figure 7.2: The width dependency of the sample for scattering in polystyrene
foam.
The results indicates that the scattering in a 11 mm thick polystyrene foam
sample stretches to approximately 1.5 em to each side perpendicular to the
laser beam.
Discussion
Since the equivalent mean path length is shorter in the smaller slabs, this
suggests that the scattered light is prevented by the physical limits of the slab.
vVhen the equivalent mean path length values are stabilized, this suggests
that the sample could be seen as an infinitely vvide slab. A. source of error in
the measurement is that different detection areas were used.
60
Chapter 7. Experimental work
7.2.2
Different thickness
A measurement was performed on polystyrene foam slabs with different thickness to investigate the effect of thickness of a measured sample.
Method
For this procedure, 7 quadratic 25 x 25 cm 2 pieces of polystyrene foam were
used. The sample thickness was increased by successively putting one on top
of the other for each measurement. The equivalent mean path length was
calculated for each thickness increment.
Results
In Fig. 7.3, it is indicated how the equivalent mean path length measurements
follows a second-degree polynomial fit.
450
400
y= s.4e + 1s.2t- s.s
350
E
1
300
u
- 250
<T
Cl)
....J 200
150
100
50
0~~--~--~--~--~~--~~
0
2
3
4
5
6
Polystyrene foam thickness I em
Figure 7.3: The thickness dependency of the sample for scattering in
polystyrene foam. The measurement samples follow the second-degree polynomial .fit given in the .figure.
Discussion
The relation between the thickness of a polystyrene foam sample and the
equivalent mean path length appears to be a polynome of second-degree
61
7.3 Drying balsa wood
according to the fitted curve. According to earlier investigations this relation
should be quadratic [12]. The reason for this discrepancy could be stemming
from the large detection area used and the spaces between the polystyrene
foam slabs.
7.3
Drying balsa wood
Moisture in wood is a problem in certain applications, e.g. in residential
houses. Moisture is also a basic parameter of quality of the wood and is
normally estimated as the weight of moisture in the wood compared to the
wood. When moisture affects the wood, the air inside the wood is replaced
by water [30]. By measuring the decrease of oxygen it is possible to measure
the increase of water inside the wood.
7.3.1
Method
A 8x8 cm 2 piece of a 1 em thick balsa wood was put inside of a bowl of
water for 6 hours. The wood piece was removed and the oxygen absorption
signal was investigated for about 12 hours as the piece was drying.
7.3.2
Results
16,----~-~-~--r---~----,
14
.,; ..... ~
12
/
10
-------ITime constant= 155 min I
E
"
-rJ 8
Q)
...J
0 o~~~~00~~40~0-~6~00~~®7-~10=00~~1200
Time /min
Figure 7.4: The measurement points made over time while drying a piece of
balsa wood. An exponential fit and its time constant are also shown.
62
Chapter 7. Experimental work
As expected, the oxygen absorption signal increased with time as the water
in the wood was replaced with air, see Fig. 7.4. By fitting an exponential
curve to the measurement points the time constant could be estimated to
155 min. The piece of wood felt dry when the measurement was finished.
7.3.3
Discussion
The increase in oxygen absorption signal suggests that the water inside the
wood is replaced by air. Both the molecular oxygen concentration and the
scattering properties probably changed when the piece of wood was drying,
giving an increase to the oxygen absorption signal.
A source of error was probably the fact that the zero-level for the normalization was only measured before starting the measurement and not continuously. It has been observed that dry balsa wood allows more light to
penetrate than wet balsa wood.
7.4
Fruit and vegetable overview
Ecuador is a country full of different exotic fruits and vegetables providing
income to the country through export. Thus, investigating oxygen concentration in fruits is of great importance.
The availability of oxygen affects the ripening process and the quality of the
fruit since the gas is a part of the metabolic processes of respiration. The
respiration rate of the fruit is proportional to the organic breakdown. So,
if the oxygen concentration inside the fruit is decreased, the life time of the
fruit is prolonged. However, if the oxygen concentration decreases below a
critical level, fermentation starts which initiates a rapid decay of the fruit.
Thus, optimizing the concentration of oxygen is of great interest during the
postharvest time of the fruit r17].
An investigation was done on several types of fruit and vegetables to test if
GAS;viAS could give some information on their inner content of molecular
oxygen and their ability to be tested with the GAS::VIAS technique. This
information could be useful not only to give an idea about the limits of the
system but also to provide an idea about which fruits and vegetables that
can be investigated in the future. The fruits and vegetables chosen are all
grown in Ecuador.
7.4 Fruit and vegetable overview
Figure 7.5: The fruits and vegetables tested. Top row, from left: papaya,
bananas, tree tomatoes, potato, Hawaiian papaya. S econd row: coconut, avocado, passion fruit, physalis, horitos, cassava. Third row: pitaya, apple,
guayaba, naranjilla, taxa, granadilla. Bottom row: aloe vera.
7 .4.1
Method
First, different kinds of fruits and vegetables, see Fig. 7.5, were test ed to see
if useful oxygen absorption signals were obtained. Some of t he fruits that
gave a molecular oxygen signal were further analyzed which is described in
the following sections.
7.4.2
Results
Table 7.2 shows that t he majority of t he fruit gave a descent or good signal. Exceptions were the coconut, cassava, and avocado which complet ely
blocked out t he laser light, making it impossible to det ermine the oxygen
presence in t hese fruits and vegetables. In t he Hawaiian papaya t he laser
beam penetrated t he fruit , but still no absorption signal was obtained.
7 .4.3
Discussion
The results show t hat banana, tree tomato, passion fruit, physalis, horito,
apple, naranj illa, taxo, granadilla, and aloe vera all were possible to t est
63
64
Chapter 7. Experimental work
Fruit
Papaya
Banana
Tree tomato
Potato
Hawaiian papaya
Coconut
Avocado
Passion fruit
Physalis
Horito
Cassava
Pitaya
Apple
Guayaba
Naranjilla
Taxa
Granadilla
Aloe vera
Leq (em)
10
2.2
1.4
1.0
Thickness (em)
13
3.5
5
5
7
6.1
0.9
2.2
1.1
20
5.5
1.5
3.5
23
1.0
10
6
5.5
2
2.5
6
4.5
6.5
5.5
5.5
3.5
6.5
2
Signal appearance
Descent
Good
Good
Unsatisfying
No signal
No signal
No signal
Good
Descent
Descent
No signal
Unsatisfying
Good
Unsatisfying
Descent
Descent
Descent
Good
Table 7.2: The fruits tested and their corresponding equivalent mean path
length (Leq), the thickness of the sample (at the point of measurement to
the point of detection) and the appearance of the signal in relation to the
other fruits; no signal, 'u,nsatisfying, descent, and good. The denotations of
the appearance of the signal are the subjective estimate of the authors and is
related to the signal-to-noise ratio.
7.5 Cutting a papaya
further. However, some of these fruits only had a descent signal resulting in a
larger uncertainty in the GMS value. The GASMAS technique was not at all
able to determine the oxygen concentration in coconut, avocado, and cassava
since the laser light would not pass these samples. This is probably due to
the dense skin of the coconut and cassava and the large and dense kernel
of the avocado. It is possible to use the GASMAS technique to investigate
papaya, potato and guayaba but the signals are not ideal with respect to
signal-to-noise ratio, making possible measurements slightly unreliable. The
reason for why the papaya showed a signal, but not the smaller Hawaiian
papaya, could not be determined.
It is difficult to evaluate the equivalent mean path length measured on the
majority of these fruits and vegetables since they have never been tested
before with this technique. However, there has been measurements on apples
before, [17, 18], and the value obtained in our experiment is substantially
larger. The reason for this could not be determined, but may be related to
a difference in the fruits.
7. 5
Cutting a papaya
There are two types of papaya available on the markets in Quito. The smaller
one is called Hawaiian papaya and the other, larger one, is solely called
papaya. The larger papaya is cheaper per kilogram than the Hawaiian. It is
common to make juice from the larger papaya but the juice is slightly sour. A
common trick to sweeten the papaya is to cut it, either in superficial stripes
on the skin or cut the ends off, and leave it for the night making the sour
liquid leak out. By doing this, the papaya gets much sweeter.
7.5.1
Method
First, the oxygen absorption signal was measured in a fresh papaya for about
30 minutes. Thereafter long stripes were cut in the papaya, see Fig. 7.6, so
that there would be a contact between the pulp and the air. The measurement of the oxygen absorption signal was continued for 12 more hours after
making the cuts.
65
68
Chapter 7. Experimental work
the environment. Thus, the real aim of this experiment was to show the
possibilities to measure on the fruit.
7.6.2
Results
Fig. 7.8 indicates a rapid increase in oxygen absorption signal when the
banana was cut.
..·
.
'..
....
.,..
•J ..:. "". ,.. ; .... ·if·
3.5
.
..
.,.... ':: +: ! :.... " •
1•• ~ .• ....... ·:
25
E
u
-o-
w
...J
I'#.:':'::.... .:·.
2
r·. \
·~.
·-· ....
#)
.
.....
~.~.... ~·<·~'
lrB-'-an-an-a-wa-s-cut-,1
1.5
0.5
0 o~--~100~~2=oo--~~~0---4=00~~~~0--~600
Time/min
Figure 7.8: Measurement points showing the equivalent mean path length,
Leq, for a banana before and after its ends were cut off.
7 .6.3
Discussion
The oxygen absorption signal increased when the ends were cut off. Even
though there might have been a difference in scattering coefficient when the
ends were cut off, maybe due to drying, it is suggested that the change in
signal is due to a variation in oxygen concentration.
7. 7
Peeled apple
Apples are pleasant samples to work with vvhen doing GAS"\IAS measurements. They give a nice absorption signal and are easily manipulated. Studies on gas exchange in apples has been done before, showing the possibilities
7. 7 Peeled apple
69
to investigate this process using both transmission and backscattering geometry [17, 18].
7.7.1
Method
An apple was measured untreated for about 30 minutes, then approximately
60% of the skin was peeled off while the apple remained under the laser
light. The reason for the latter was not to change the measurement point.
The apple was measured for additional 10 hours without skin.
7.7.2
Results
06
.. :·
0.5
=i
-
0.4
"'
~
I Time constant= 80 m1n I
03
(!)
0.2
0.1
0 oL---10~0---20~0--~30~0---400~--50~0--~60~0--~700
Time/(min)
Figure 7.9: The measurement points and an exponential fitted wrve indicating the increase in oxygen absorption signal over time for a peeled apple.
As can be seen in Fig. 7.9, the oxygen concentration increased when the
apple was peeled. The measurement points are fitted with an exponential
curve and the time constant was estimated to 80 min.
7. 7.3
Discussion
There was a significant increase in G).IS signal after the apple was peeled.
This suggests that oxygen entered the apple when the skin was peeled off.
70
Chapter 7. Experimental work
Thus, the skin functions as a membrane keeping a certain oxygen concentration in the body of the apple. Similar results have earlier been observed
[17, 18].
7.8
Nitrogen exposed tree tomato
Tree tomato is a fruit very similar to the common tomato but slightly different
in size and shape. It is also much sweeter and is therefore common in fruit
juices in Ecuador. The technique to study gas exchange in fruit by pretreating the fruit by immersion in nitrogen gas has earlier been performed
on apples [17], but never on tree-tomatoes.
7.8.1
Method
A ripe tree tomato was put in a glass tank of approximately 25 liter filled
with nitrogen at atmospheric pressure. After about 5 hours the tomato was
removed from the tank and, instantly, the oxygen absorption signal in the
fruit was started to be measured. The objective was to observe the exchange
of gases when nitrogen left the sample and oxygen entered.
7.8.2
Results
The results, see Fig. 7.10, indicate an increase in oxygen absorption. The
measurement points were fitted with an exponential curve and the time constant was estimated to 25 min.
7 .8.3
Discussion
The increase in oxygen absorption signal increased as expected. Since the
fruit was not manipulated in any other way than the change of gas environment, it is suggested that the increase in oxygen absorption signal is due
to the increase of molecular oxygen in the sample. The skin of the tomato
functions as a membrane, providing the fruit with an environment related
to the gas environment. vVhen the environment is changed, the gas content
inside the fruit changes as well.
7.9 Volcanic rock overview
1
71
..
~·
0.8
. .
.
. .. .. ...... .... . ... .. ..
I Ttme constant= 25 mtn I
E
...
-.. 0.6
o<I)
-'
0.4
0.2
0
0
so
100
150
200
250
300
350
Time/min
Figure 7.10: The measurement points and an exponential fitted curve for
the measurement of oxygen absorption in a tree tomato over time. Before
the measurement, the tree tomato was immersed in nitrogen gas for about 5
hours.
7. 9
Volcanic rock overview
There is a great volcanic activity in Ecuador with volcanoes erupting in
the past few years. Thus, understanding the nature of volcanoes is a very
important issue for the country of Ecuador and investigating the presence of
gas in volcanic rocks might provide important geologic information. In order
to give an overview for further investigation, some different types of volcanic
rocks were investigated.
7.9.1
Method
The different types of rocks, see Fig. 7.11, were provided by the Department
of Geophysics at EPN. They also sliced the samples so that the samples
would be geometrically suitable for measurement with GASMAS. The rocks
were measured to see if a signal could pass through the rock and the quality
of this signal was determined.
7.9.2
Results
Table 7.3 shows that the GASMAS system was not able to measure an oxygen absorption signal in the volcanic rock samples provided. None of the
Chapter 8
Summary and conclusions
There have been four distinct parts involved in this project; preparations,
technology transfer, assembly, and experiments.
8.1
8.1.1
Results of the project
Preparations
The preparations took place in Sweden and resulted in the finding of different
diode lasers suitable for observing absorption lines for oxygen and rubidium.
The diode lasers were later used in Ecuador but different absorption lines
were observed due to changes in laser performance. The preparations also
allowed for a successful delivery of the equipment from Sweden to Ecuador
with the help of ISP in Sweden and Prof. Ayala in Ecuador.
8.1.2
~While
Technology transfer
waiting for the equipment to arrive and during the entire time spent at
EP:N, efforts were made to transfer the technology and know-how about the
equipment. This was done by holding a presentation, making a poster, creating a website, translating and modifying a laboratory exercise about rubidium absorption spectroscopy, creating and carrying out a laboratory exercise
for GAS:..IAS and, finally, creating a manual with the practical knowledge
gained by the members of the project during the entire project.
76
Chapter 8. Summary and conclusions
8.1.3
Assembly
After the arrival of the equipment, it was assembled and tested. The rubidium set-up was made functional but the signals found were weak and unreliable. The GASlVIAS set-up was assembled successfully and tests showed
promising enough results to allow for live experiments.
8.1.4
Experimental results
Experiments were made on fruits, balsa wood, and polystyrene foam after
verifying the signal and making an extensive standard addition procedure.
Standard addition
Standard-addition procedures were made to investigate the relation between
the standard-addition curve slope and the sensitivity setting of the lock-in
amplifier. A set of standard-addition curves were measured for six different
sensitivity settings and the relation could be calculated. The laser beam
needed to be attenuated so three different samples were tested for this purpose; polystyrene foam, a folded paper, and an optical filter. The optical
filter proved to be the most suitable attenuator.
Polystyrene foam
Measurements on polystyrene foam have been performed to investigate the
behavior of scattering in this material. An investigation was performed showing the influence of physical width of the sample. Another measurement
performed was to see the relation between thickness of a sample and the
equivalent mean path length. The results showed an effect of limited width
of the sample that became negligible after a certain dimension, suggesting
that the slab could be seen as infinitively wide. The results obtained between the thickness of the slab and the equivalent mean path length followed
a second-degree polynomial fit. However. according to earlier investigations,
this relation should be quadratic r12].
8.2 Future work
Balsa wood
A measurement of drying balsa wood was performed to investigate the supposed increase of oxygen in the wood as it was drying. The result showed an
increase in oxygen absorption signal, suggesting that when water vapori11ed
from the wood, oxygen entered.
Fruits
First, measurements were made on several different types of fruits to provide
an overview of which fruits that gave good enough signals for performing
measurements. Papaya, banana, tree tomato, and apple were further investigated. Measurements over time were made when the skin of the fruits was
partially removed. All fruits showed a change of oxygen inside the fruit over
time. Apple and banana increased their oxygen absorption signal, while the
opposite was observed for the papaya. The reason for this difference might
be stemming from an initially different oxygen content in the fruit. The exchange of gases in a fruit was also investigated. This was done by measuring
the change of the oxygen absorption signal over time, for a nitrogen exposed
tree tomato when placed in air.
Volcanic rocks
Measurements were made on two different types of volcanic rocks, pumice
and andesite, using six samples differing in color and thickness. Neither of
the rocks gave an oxygen absorption signal. This was probably due to the
fact that not enough light could pass through the rocks. Thinner samples
might give more promising results but the reason could also be a lack of
molecular oxygen in the samples.
8.2
Future work
The laboratory at EP:.J was successfully assembled and was made fully functional. However, necessary measurements on reproducibility and accuracy
were never made. These types of calibrations need to be done to make the
laboratory usable for advanced scientific studies.
77
78
Chapter 8. Summary and conclusions
A validation of the system by comparing the GASMAS system with an already validated equipment should be done. There are facilities at the Department of Food Science at EPN holding equipment for intrusive determination
of oxygen content inside matter. Contacts have been established with the
department to make this possible. The validation process is an important
part in the development of the GASMAS technique and is a challenging task
for future workers on GASMAS at EPN.
During the entire project, the aim has been to find solutions suitable for the
country of Ecuador. The survey measurements on fruits showed which fruits
that were suitable for future studies. Evidentially, we did not test all the fruit
types in Ecuador. While talking with the potential collaboration partners at
the Department of Food Science for example, we got to hear about a root
called jicama. This root has interesting sugar properties that might make it
possible to produce a sweetener that diabetics can use. Maybe it can also
be used to produce a sweetener for people who wants to diet. Hopefully, the
GASMAS system at EPN will be a tool in understanding the maturity stages
of the jicama root which is a problem at this moment.
The fruits we performed successful measurements on can be further and more
profoundly investigated in the future. We have full confidence in that the
staff at EPN will find out interesting and exciting experiments to be made.
Hopefully, the GASMAS system will help in solving the vast problem of
understanding the ripening process occurring while transporting the fruits.
This might provide the tools for increasing the possibilities to export the
fruits.
The gas content of volcanic rocks can give important and interesting geological information, so the investigation of these rocks will be an interesting
objective for the future. A new investigation needs to be done to determine
the thickness needed to be able to let enough laser light through the sample
to allow a gas measurement. Oxygen is not the most important gas in these
contexts so investigations to determine the concentration of SO 2 in volcanic
rocks should be a future challenge. Our hope is that the cooperation with
the Department of Geophysics will continue and bear fruit in the future.
\Iany different types of investigation have been thought of throughout the
project and many of them were never realized due to priorities on other fields.
Hopefully, these ideas will be investigated further in the future.
One of these ideas was to investigate wine bottles. The cork of wine bottles helps the wine to keep a slow and steady exchange of oxygen with the
environment, much like the skin of the fruits investigated. Some \vines are
8.2 Future work
held for decades to get the perfect taste and aroma. Maybe the GASMAS
technique could be used to determine how the wine is doing during this process. Perhaps the oxygen within the wine or within the air gap could provide
interesting information about the status of the wine.
79
Acknowledgments
First of all we would like to thank Prof. Sune Svanberg who made this project
possible. His great enthusiasm for physics has inspired us, his knowledge
about the field has helped us, and his friendliness towards us has been greatly
appreciated by us.
Linda Persson has been our practical supervisor who always took time to answer our numerous questions and inspire us when we felt down. She has been
our friend and mentor, providing us with tips and enthusiasm, throughout
the entire project. Special thank to your visit to Quito, where your presence
gave new inspiration to a project that sometimes felt impossible.
Prof. Edy Ayala and Dr. Cesar Costa both have been very helpful. Their help
extended far beyond their professional duties making us feel very welcome
to EPN and the country of Ecuador. Without Prof. Ayala, the equipment
would still be at the Ecuatorian customs. Thank you Dr. Cesar Costa for
your friendly welcoming and your help with corrections of the report. Also
thanks to Christian Santa Cruz who helped us with many practical issues
and questions.
A very special thanks goes to Yolanda Angulo who was with us every day
during the project in Quito. Her questions made us stay on our toes, her
help in the lab (and with the Spanish) was most welcome, and her presence
always cheerful.
Mats Andersson and Mikael Sjoholm helped us many times in Sweden. Mats
was also very generous with his knowledge about Lab VIEW and electronics. He made the task of making a Lab View program possible to handle by
creating a start program for us and then kept on helping us with problems
occurring during the development.
Thanks to our Ghanaian friend Benjamin Anderson who was always very
eager to help us while we where doing our preparations in Sweden. \Ve wish
you good luck on the project of assembling your own GAS\IAS setup in
82
Chapter 8. Summary and conclusions
Ghana.
We would also like to thank ISP for not only sponsoring the whole project
itself but also our plane tickets to Ecuador. Thank you Lennart Hasselgren
and AnnaKarin Norling also for all administrative help.
We would like to thank Applets Hus at Kiviks Musteri for a scholarship. We
hope you will have use for the GASMAS technology in the future.
Our thanks also goes to Mats Lundqvist for helping us getting started with
Latex (the program this report is written in) and Olle Carlsson at ThorLabs,
bringing the words Product Support to a new dimension. We also thank
Ake Bergquist for preparing the equipment for the Ecuatorian line voltage
system and our Spanish teachers with whose help we could actually manage
to speak Spanish in the end.
Last, but not least we would like to thank family, friends and our beloved
ones; Vannesa and Magnus. Thank you for understanding the need of working far away and long hours. A special thanks to Ake, the father of Marta,
who with his visit to Quito shared different ideas and guidance.
Bibliography
[1] M. Sj()holm, G. Somesfalean, J. Alnis, S. Andersson-Engels, and S. Svanberg: Analysis of gas dispersed in scattering media. Optics Letters 26,
16-18 (2001)
[2] S. Svanberg:
News (2001)
Laser spectroscopy in development, EPN. Europhysics
[3] F. L. Pedrotti, S. J. Pedrotti: Introduction to Optics, 2nd. ed. (Prentice
hall, New Jersey 1993)
[4] S. Svanberg: Atomic and Molecular Spectroscopy - Basic Aspects and
Practical Applications, 2nd. ed. (Springer-Verlag, Berlin Heidelberg
1992)
[5] G. Somesfalean: PhD Thesis, Environmental Monitoring using DiodeLaser-Based Spectroscopic Techniques, (Lund Reports on Atomic
Physics, LRAP-329 2004)
[6] J. Alnis, B. Anderson, M. Sjoholm, G. Somesfalean, and S. Svanberg:
Laser spectroscopy of free molecular oxygen dispersed in wood materials.
Applied Physics B77, 691-695 (2003)
[7] 0. Svelto: Principles of Lasers, 4th. ed. (Kluwer Academic / Plenum
Press, New York 1998)
[8] U. Gustafsson:
PhD Thesis, Diode Laser Spectroscopy in Krtended
Wavelength Ranges, (Lund Reports on Atomic Physics, LRAP-253 2000)
[9] Roithner LaserTechnik Price List,
sep 2005. Available
http:/ /www.roithner-laser.com/All_Datasheets/Pricelists/
at
[10] DFB-Laser
diodes,
nanoplus
GmbH,
sep
2005.
Available
at
http:/ /www.nanoplus.com/content/view/23/61/DFBLaser diodes.html
84
BIBLIOGRAPHY
[11] An overview of laser diode characteristics, sep 2005. Available at
http:/ /www.ilxlightwave.com/ appnotes/overview _laser_ diode
_characteristics. pdf
[12] G. Somesfalean, M. Sjoholm, J. Alnis, C. af Klinteberg, S. AnderssonEngels, and S. Svanberg: Concentration measurement of gas embedded
in scattering media by employing absorption and time-resolved laser
spectroscopy. Applied Optics 41, 3538-3544 (2002)
[13] U. Gustafsson, G. Somesfalean, J. Alnis, and S. Svanberg: Frequencymodulation spectroscopy with blue diode lasers. Applied Optics 39,
3774-3780 (2000)
[14] P. Horowitz, W. Hill: The Art of Electronics, 2nd. ed. (Cambridge University Press, Cambridge 1989)
[15] M. Sjoholm: Diploma Thesis, Development of a laser spectroscopic technique for gas in scattering media, (Lund Reports on Atomic Physics,
LRAP-271 2001)
[16] P. Kluczynski, J. Gustafsson, A. M. Lindberg, 0. Axner: Wavelength
modulation absorption spectroscopy - an extensive scrutiny of the generation of signals. Spectrochimica Acta B56, 1277-1354 (2001)
[17] L. Persson, H. Gao, M. Sjoholm, S. Svanberg: Diode laser absorption
spectroscopy for studies of gas exchange in fruits. Optical and Laser
Engineering, in press (2005)
[18] L. Persson, B. Anderson, M. Andersson, M. Sjoholm, and S. Svanberg:
Studies of gas exchange in fruits using laser spectroscopic techniques.
Frutic05, Montpellier (2005)
[19] L. Persson, K. Svanberg, and S. Svanberg: On the potential of human sinus cavity diagnostics using diode laser gas spectroscopy. Applied
Physics B, in press (2005)
[20] The HITRAN database, sep
www.harvard.edu/HITRAN /
2005.
Available
at
http:/ /cfa-
[21] Modified from: J-L. Boulnis: Photophysical processes in recent medical
laser developtments, a review. Lasers in Medical Science 1, 47-66 (1986)
[22] Laser Applications, sep 2005. Available at http:/ /hyperphysics.phyastr.gsu.edu/hbase/optmod/lasapp2.html.
[23] A.V. Otieno, B.;\I..J. :viuthoka: Diode laser absorption spectroscopy for
teaching undergraduate physics. African 2, 1247-1232 (1999)
I3IBLIOGTIAPHY
85
[24] ThorLabs: Operation manual TCLDM9, aug 2004
[25] ThorLabs: Operation Manual Thermoelectric Temperature Controller
TED 200, jun 2003
[26] Stanford Research Systems: Operating Manual, Model SR810 DSP
Lock-in amplifier. (2000)
[27] W.R. Leo: Techniques for Nuclear and Particle Phy.Jics E.rperiments,
2nd. ed. (Springer-Verlag, Berlin Heidelberg 1994)
[28] P. Carlsson, S. Johansson:
(Liber, Eskilstuna 2000)
Modern Elektronisk Miitteknik, 1st. ed.
[29] G. Belin, L. Holmgren, S. Svanberg: Hyperfine interaction, Zeeman and
Stark effects for excited states in rubidium. Physica Scripta 13, 351-362
(1976)
[30] V.P. Negodiaev, E.V. Sypin, E.S. Povernov: The monitoring system
of wood moisture and air temperature in the drying cell of wood. 5th
International Siberian Workshop and Tutorial IV, 225-228 (2004)
Appendix A
Work responsibilities
The project was performed by one student at the LTH Engineering Physics
branch, Marta Cassel-Engquist, and one from the Electrical Engineering
branch, Christoffer Bjorkwall. This made marks in the way the work responsibilities were divided. Below follows an approximate division of work
for these two project participants.
The preparatory work took place in Sweden and includes preparational experiments and arranging for shipping the equipment.
Administrative work included booking plane tickets, buying fruit samples
etc.
Experimental work includes mounting the equipment, searching for and fixing
errors, calibrating the equipment, and doing experiments.
Report writing includes everything having to do with producing the written
report, such as information searching, picture making and of course, the
Task
Preparatory work
Administrative work
Experimental work
Report writing
Technology transfer
Lab VIEW programming
:VIiscellaneous
Table
~-\.1:
Marta
Christ offer
50%
50%
60%
50%
50%
0%
50%
50%
50%
40%
50%
50%
100%
50%
The distribution of work for the two participants of the project.
88
Chapter A. Work responsibilities
actual writing of the report. This post also includes the preparation for the
presentation.
Information activities include making the two laboratory exercise instructions, having presentations, making a poster, making a website and writing
a user's manual.
Lab VIEW programming includes the development of a computer program,
using LabVIEW, to be used together with the equipment.
Miscellaneous includes everything not possible to put under the other subjects, such as meetings, study visits, building shelves for the electrical equipment etc.
Table A.l shows the different parts of the project and the percentage performed for the participants. As can be seen the majority of the parts are
performed by both of the authors. However, different aspects of the parts
have been done, dependent on the specific backgrounds.
The project was started January 24th and ended September 7th 2005. During
this period, there was a break in the hands-on work with the equipment
between March 6th and May 12th, since the equipment was held at the
customs of Ecuador.
Appendix B
GAS MAS poster
GASMAS
GAs in Scattering Media Absorption Spectroscopy
Mlimc..sd-Ea,pst.Cioridrdl'ecBjiDbnii,.LiodaPasma...ts-s....m.g
AJo..;cl'bJsicsDnWoo. L"""._otTeclmoloBJ. P.O. Jia>.llii.SJ>.22100Luad.s-kn.JimdS....S~se
lldy A ,ala""" C<sorCaola.
no.-- doF;.;,. liscaclal'ulitttmca N1rima1. Ladnmdo Gao,.,. E 11-153 Qoma. -
- Jimd ~c
leclrique
~MAS, GAs in ~g Media Absorption Spectro9capy, is a novel developed
reo- 1111!8SU11!menls of gas coo1ents inside porous, sc--.g media such
as fluitllllcl..., body J1-6J. This leads 1o a wide lllllge of appicatians.
llolecaltK CII)I!1M concentnman
IIINSIII8III8II inside fnlit
The key carplllenl in 111e setup is a diode laser, which llllll<es it srnal, cheap and
easy 1o handle. These aspects are of frl1lorlance 1br commercial use in 111e future.
component in 111e respntion pnxess
of bioklgical tissue, such as apples.
So far rneasu"'ments have only been pabmed on molecular oxygoo. However,
by changing lle diode Jasar-, and 111us 111e wawleng111, it is possille 1o delscl o111er
gases, such as C02 and H,O.
A high concenlra1ion inaeases 1lle
,._ing
and
1oo low stal1s
oxygen
Molecular
is
a
key
~
"
fennelolatiou pnxesses. This llllll<es
it very .,...,._ 1o be allle 1o conTol
111e molecular oxygen cone--.
Inside 111e bioklgical1issue J4,5J.
The setup
.....,...,_on~
co.,..,.,...,ms
The fundamental
of 1lle GASUAS setup, and o111er methods 1br gas
absolption spectroscopy. are a lght source, a SIIIT4*> 1111d a deleclcr.
l7l1e
and CII)I!1M COIJSIImption
~
/lledicaJ applit:atjolls
By
measuling
111e
oxygoo
concentnJiion as a fi.onc:1icn of &ne
conclusion can be made on gas
1ransport These 18SUiis can be
h~l 1o invent a new way of
pacl<aging food 1o last longer J4.5].
on_,_,
Very recently measu"'ments have
been pelfDmled on 111e ll'llnlal and
rna~ sinuses by using , . . _ . ,
delec:lion. Normaly. 1o dll1ien1Wie if a
person has a sinusoidal infection a
doctcr needs 1o choose either 1o
perlbml an expensive CT-<lC8II a
just presclile ......,.,._The I1!9UIIs
suggest 111at by rneasuling 111e
amount
of
u- fondRclly
by
measuling oxygen) diagnosing 111e
ilness can be made cheaper J6J.
Diode laser- -light saun:e
The diode laser used in bl setup depends on 111e gas of intslesl In 111e cunerrt
setup a diode laser at 760 nm is used lbr molecular oxygen studies. The gas
content can be estimated by wa-g111 tuning 111e laser across 111e extremely
sllalp absolpllon lne of 111e flee gas.
~media--sample
The laser lght is guided 1o 111e ~g SIIIT4*> by using a tllre. Wlloo lght has
passed 111e ,.,.._g
111e distance 111e photoo has 1nM!Ied is always
equal a larger 111an 111e 111icllness of 111e ~- depending on 111e sa"'*''s
.,.....rn.
~g
propelties.
PIIT- - dlallllc:mr
The pholcmulllpler is a very SerJsllle deleclcr 111at measu...s 111e lght 111at has
passed 111e ~g media.
Lock
in..,_
11rJ1111ier is a very esserrlial tool 1o delscl and measu111 very smal
signals, even 111ough 111e noise and 111e bacl<ground are Slllll!l3l onlers larger in
The loc:t in
magnilude.
Potential applications
The body contains m1111y gases and
111e ~MAS 1echnique can be used
1o olllaln ~ diagnostic
infamlllion.
A
certain
gas
concenlralion can be an indicator of
an aoess or llorueostallc 1..-.ce.
Oomeslic indusllies 11<e 111e llower,
banana and alpaca induslly can
have gn>at use of GASIMS
technique since IIIey al deal lWII
bioklgic materials.
Detector
Acknowledgments
Them are two types of delec:lion geomellies bit can be consideted When
pl!l1brnWog GASMAS measu........ms;- and "'tleclion J5,6J.
The ~MAS equipment was don- 1o 111e Departamento de Fosita in Escuela
Polllllcnica Nacional, Quiln, from 111e lnlsmational Science Program, Uppsala,
~oo. in colalxlralion -.t11111e Department of A1Dn*: Physics at LWld Univer.llly,
SWeden.
REFERENCES
G
.._...in ..-,;.g
_1. M. _o,ms.__.
...16(-.20111)
- d ... -in..-....--------·"""""'o,ms•1.
SjiiboOn.
J . Abo. S . -.....&gols. and S . - . ,. ~of ...
2. G. , . . _, M. - . J. Aa., C.
.t~.
S. -
. and S. - - ..
~
l!illll20112)
l . J. - . o. - - .. M.-.G. -
.... S. -'!1. '--- -dfloe"""""""""""""
- i n - - . - - B T 1. ...1(21111l)
.C. L Persson, H. Gam, M. ~ tal S. 9mmi!IJI, Dfode lsaer sb:lotpbon ~for aG.6ee d gaa ~e in
- · ._ .......... ~_ ,._...(20116)
5. L. - .. 1 1 - . M. MSjiiboOn,,......dgBOe>t<:hwlge in .......... laeer ...............
...........FAildS.-.-(20116)
0. L. · K ............. and S . -og. C>l the pdonlial d ' - ' ..... ...., - - - - _ . , . .
~-"""""'"'- 8. ~(20116)
Appendix C
Presentation abstract
GAS MAS
Applied diode laser spectroscopy
Linda Persson, Marta Cassel-Engquist, Christoffer Bjorkwall, and Sune Svanberg
Atomic Physics Division, Lund Institute ofTechnology, P.O. Box 118, SE-221 00 Lund, Sweden
e-mail: /[email protected]
http://www-atom.fysik.lth.se
Edy Ayala andCesar Costa
Departamento de Fisica, Escuela Politecnica Nacional, Ladron de Guevara, E 11-253 Quito, Ecuador
e-mail: [email protected]
GAs in Scattering Media Absorption Spectroscopy (GASMAS) is a novel
technique developed at Lund Institute of Technology by the research group of Professor Sune
Svanberg. This technique deals with non-destructive, in-situ measurements of gas inside
porous materials such as polymers, ceramics, wood, our body and fruits using narrow-banded
radiation from tunable diode lasers. The possibility to measure the gas contained in such
materials relies on the fact that solid materials and liquids have broad absorption features with
linewidths normally not sharper than 10 nm while free gases typically have a linewidth 10000
times sharper. In the porous materials the radiation is heavily scattered, which results in a not
well-defined path length for the light that passes through. The mean path lengths for the light
are frequently orders of magnitude longer than the geometrical dimensions of the sample.
The setup is based upon diode laser spectroscopy, with three main components;
a light source, sample and detector. Molecular oxygen has so far been studied, by using a
diode laser at 760nm. The possibility to use the technique for postharvest monitoring in the
fruit industry has been studied by the technique presented. Furthermore, for medicine
applications, human trials on the maxillary and frontal sinuses have been preformed for
possible use in sinusitis diagnostics, see Fig 1. By changing the diode laser, it is possible to
study other gases, such as C0 2 and H2 0. The equipment will very soon be available in Quito
for research and education purposes.
-..
-
1.5
:::l
co
......,
1
s::::
Q)
......,
s::::
0
0
0.5
s::::
Q)
0')
~
><
0
0
- 0.
I
Off On
Fig 1. Oxygen concentration measurements of the frontal sinuses.
Appendix D
Rubidium laboratory exercise
Laboratory exercise
Diode laser absorption spectroscopy
in atomic rubidium
Originally written at the Department of Physics,
Lund Institute of Technology, Sweden*
Translated from Swedish and modified by
Christoffer Bjorkwall and Marta Cassel-Engquist
September, 2005
Introduction
The purpose of this laboratory exercise is to give a basic knowledge about
diode laser spectroscopy. With the use of laser techniques it is possible to
study very detailed structures of the energy levels of atoms. Hyperfine structure, isotopic shifts and Zeeman splittings arc examples of detailed structures
that can be studied. However, in this lab, we are going to focus on the experimental techniques. Experimental skills of course also include evaluating the
results from the measurements. In this laboratory exercise this specifically
means understanding the definition of line width (for the subject studied and
for the light source) and its effect on resolution and measurements of small
energy differences.
Regarding the technique of measuring, the goal of this laboratory exercise
is to show how to determine gas concentrations by using lasers. Laser techniques can be used to determine everything from the oxygen concentration
in a respirator to the air pollutions at a certain level above ground. Dur*Copyright for the text and all the picture belongs to the Department of Physics. Lund
Institute of Technology, Sweden
1
ing this laboratory exercise we will investigate the gas in a rubidium cell by
using an absorption signal. ·when the principle is understood, it is easily
comprehended how the absorption path could be a part of a respirator hose
or a couple of kilometers of atmosphere.
Preparatory problems
First, read through this laboration manual and do the tasks below thereafter.
1. At room temperature (20°0), the vapor pressure of rubidium is about
2 x 10⁻⁵ Pa. How many atoms per m 3 does the rubidium cell contain?
2. The distance between the mirrors in a Fabry-Perot etalon is 10.90 em.
The index of refraction is n = 1.511. Determine the free spectral range
(the distance in frequency between the transmission maxima) of the
etalon.
3. A diode laser cavity works in the same way as a Fabry-Perot interferometer. The free spectral range is 130 GHz and the index of refraction
in the resonator is 3.5. How long is the laser?
4. How do you change the frequency of a diode laser? (Practically, there
are two ways).
5. Which natural frequency width does the D2 line of rubidium have if
the excited state has a lifetime of 26.0 ns? "Which Doppler width does
this line have at 20°C and 120°C, respectively?
6. In Fig. 2 there is a Doppler free experimental diode laser recording
of a spectrum from the D2 line of rubidium. Calculate the frequency
separations between the 87 Rb peaks. Put the 87 Rb peak furthest to
the left (number 1) as the zero of the frequency scale. (The frequency
distance between the 'peaks' in the upper part of the figure is 141 J\IHz.)
Calculate the corresponding frequency separation with the use of Fig.
1 and compare the results with each other. Also determine the Half
Width at Half Maximum (HWHl\I) (~f, measured at half the height)
at the highest peak of 87 Rb. Compare your result with the natural
HWHM (task number 5).
7. Sketch the shape of the spectrum in Fig. 2 if the peaks are Doppler
broadened. Use the result from task 5. Is it then possible to see something from the hyperfine structure of the ground state (5s 2 8 1; 2 ) and
2
the excited state (5p 2 P 3; 2 ), respectively? Estimate the HWHM of the
peaks with the help of the separations in Fig. 1 and the Doppler width.
Theory
Hyperfine structure of rubidium
During this laboratory exercise we are going to study the so called D 1 line.
Sometimes however, the D2 line is studied. The original laboration instruction which this instruction is translated from is focused on the D 2 line for
example. Thus, the theory and the examples in this instruction will be focused on the D 2 line.
The D2 line is an historical denotation for the transition between 5s 2 8 1; 2 and
5p 2 P 3; 2 . The denotations D 1 and D 2 do not mean anything. They only refer
to that the resonance transitions are appearing in pairs for all alkali atoms.
Think about the yellow double line of sodium at 589.6 and 589.0 nm for
example. In fact, rubidium has two naturally existing isotopes: 85 Rb (73 %),
which is stable, and 87 Rb (27 %), which, in principle, is radioactive but whose
half life is longer than the age of the earth! The resonance (transitions to
the ground state from the lowest excited configuration) has the wavelengths
794.7 nm for the D 1 line: 5s
780.2 nm for the D 2 line: 5s
2 81;22 8 1;2 -
5p
5p
2 P1;2
2 P3/2
In Fig. 1 it is shown how the hyperfine structure looks for the ground state
denoted 5s 2 8 1; 2 and the excited state denoted 5p 2 P 3; 2 for 87 Rb. The energy by the different hyperfine structural levels is denoted by the resulting
quantum number F resulting from the coupling between the total angular
momentum quantum number of the electronic (J = 1/2 or 3/2) and the
nuclear spin I (87 Rb has I = 3/2). In Fig. 1 the separations in frequency
(b..Ejh) between nearby hyperfine structural levels have been marked out.
If laser light is to be absorbed, the quantum state F cannot be changed
arbitrarily. For allowed transitions the following rules pertain:
b..F = 0, ±1 (F=O to F= 0 is forbidden)
Thus, we get six spectral lines lying very close to each other in frequency. In
Fig. 2 a recording is shown over the six transitions in 87 Rb. The numbers at
the transitions in Fig. 1 and the peaks in 2 belong together. Consider what
will happen when the frequency of the laser is increased. In Fig. 2, even the
3
F'
F
~:
o,
780.2 nm.
o,
794.7 nm
F=2
5
s,
Figure 1: The energy levels for the rubidium isotope 87 Rb. The transitions
called D1 and D2 are indicated. Transitions between the hyperfine structural
levels follow the ntle ~F = 0, ± 1.
corresponding transitions at
visible.
85 Rb
(two groups with close lying peaks) are
With rubidium, the separation in frequency between the spectral lines are at
most 7 GHz (0.014 nm). It can be seen in both the experimental recording,
Fig. 2, and in the energy level diagram, Fig. 1.
Practically, it is not very easy to detect the small differences in wavelengths
caused by the hyperfine structure. To better understand the problem, we
will briefly discuss line widths.
Line widths
During the laboratory exercise we are using a cell containing a dilute rubidium gas. The laser light getting absorbed by the rubidium gas will be more
or less Doppler broadened. Full Width at Half Maximum (FWHl\1) ~fD for
a Doppler broadened spectral line is determined by the temperature of the
gas, T, according to
~fD
c
4
.0
:X:
Figure 2: A laser recording of the D2 line of rubidium (3 5 Rb and 87 Rb) made
with a collimated atom beam. In the figure there are also interference fringes
from a Fabry-Perot etalon with a free spectral range of 141 MHz.
5
where M is the molecular weight and fo the frequency of the transition. Since
each line has an individual Doppler profile, small structures are often hidden
(in our case the hyperfine structure) because of the lines merging. Thus, it
does not help if you have access to a narrow band tunable laser unless you
can eliminate the Doppler width.
Even if we successfully and thoroughly eliminate the Doppler width, the spectral lines still have a certain frequency width as a consequence of Heisenberg's
uncertainty relation, the so called natural line width. States where the atoms
are for a long time (the ground state and meta stable levels), will become
very narrow in energy. The frequency width, !:::..fN, of an optical transition
to the ground state is determined by the lifetime, r, of the excited state. For
transitions to (or from) the ground state, a spectral line will get a FWHM
!:::..fN determined by
1
/:::..fN=-
21fT
With a tunable dye laser, with a frequency width of a couple of l\!IHz, it
is possible to measure, spectrally, really sharp lines without the bandwidth
of the laser broadening the recorded lines. A diode laser, however, has a
bandwidth of round 50 ~Hz which rarely becomes neglible in relation to the
natural line width (and the separation between the spectral lines). Thus, we
have to pay attention if it is the line profile of the atoms or an instrumental
broadening (or a combination of them) that is being observed.
The diode laser
During the laboratory exercise we will be studying 87 Rb with the use of a
diode laser emitting infrared light at the D 1 line (794.7 nm). A diode laser
is shown in Fig. 3 and is an GaAlAs diode laser of the same type as in,
e.g., CD players and laser printers. It gives a maximal output of 10 mW,
which is enough to be harmful to our eyes (lasers are considered harmful
above 0.4 mvV). The wavelength 794.7 nm lies just within the limit of the
infrared region, and the usual sensibility of the eye is therefore very low.
Thus, the light from the laser can seem very weak but still be so intense that
it is harmful!). At the laboratory there are safety goggles and an IR carcl.
With the help of the IR card it is possible to localize the IR laser beam.
Please, consider the fact that wrist watches and other reflecting parts can
cause hazardous reflexes when adjusting the laser beam.
6
..~···
·...__.....·
. . . ..J·
Figure 3: The diode laser is mounted within a hermetically sealed capsule.
The photo diode is used to monitor the laser intensity.
The laser is of the single-mode type, i.e. it emits light with only one frequeney and it has a line width of about 50 MHz. The emission wavelength
of the laser (about 794.7 nm) is determined primarily by the band gap in
the pn transition. By changing the temperature, the band gap is changed
and also the optical path length is changed a bit. Due to the shape of the
resonator (the cavity) and the amplification profile the laser sometimes does
a jump in frequency (a so called mode jump). This means that the wavelength is changed completely, for diode lasers of GaAlAs-type, with about
0.3nm;ac. Between the mode jumps the wavelength is changed 0.06 nm;ac.
(or in another words -30 GHz;aC). In Fig. 4 it is shown how the wavelength
depends on the temperature.
jl.:.nm
780.2
rrr
.'. . .-.. ,. . .R.utiak.1m
. . . . . . ,. . . . ."'. . . .aos:::rption
. . . . . . . . . . . . . . . . . . . . . . . . . ,. .
__
co.n~,r.oL;s
wavelen~ shift
r~-
J
r--__;
1
··~--_Mode .ump
.....
i
T: C
Figure 4: The emission wavelength of the diode laser is dependent of 'its
temperature. Nate the sudden changes in wavelength.
The light intensity of a diode laser depends on the injection current, Fig. 5.
As long as the injection current is small the component functions as a regular
light emitting diode (LED). \Vhen the injection current exceeds a certain
threshold value (denoted Ith), light amplification occurs through stimulated
emission, i.e. laser action. The injection current needed to generate this
7
effect varies a bit between lasers. The recommended injection current Uap)
is, together with other types of data, given in a data sheet for each diode
laser. The laser in this lab can normally be used up to 10 mW, but the life
time of the laser will be shortened at this power and if this value is exceeded
the laser might be destroyed.
-~
..
P - .''ll'vV
3 •
2·
1 ;_ --- --
:::
10
20
30
40
50
Figure 5: The output power of the diode laser P0 as a function of the injection
current IF, for different temperatures.
The emission wavelength of the laser can also be changed by varying the
injection current, which is clue to the fact that the temperature is changed
locally in the pn junction. We will use this effect to sweep the wavelength of
the laser with the help of a function generator.
The function generator can generate a current ramp of which the frequency
and slope can be varied. A fast current ramp gives a fast sweep in wavelength,
which makes it possible to observe an atomic spectrum in real time with an
oscilloscope.
Thus, the wavelength of a diode laser can be altered by varying the temperature of the laser capsule or by varying the injection current. In the laboratory
exercise, temperature sweeping is used to coarse tune, and the injection current is used to fine tune the vvavelength. The temperature regulator can
vary the temperature of the laser between l5°C and 60°C with the help of a
Peltier element. This allows for a sweepable range of about 11 nm.
8
The Fabry-Perot interferometer
To be able to determine the frequency separation between the spectral lines
that the laser light interacts with, we have to generate a frequency scale. A
small part of the laser light is sent through a so called Fabry-Perot etalon.
When the frequency of the laser is changed we get a number of interference
fringes equally spaced, see Fig. 2. The distance in frequency is called the free
spectral range of the Fabry-Perot interferometer. In the laboratory exercise,
an etalon of diffraction index n and the length L is used whose both end
surfaces have a highly reflecting layer. The condition for constructive interference is 2nLcos(e) = m>. which reduces to 2nL = m>. =me/ f for e = 0.
The free spectral range, i.e. the separation in frequency D.!Jsr between 2
orders (m and m -:-1), is then
c
D.ffsr = 2nL
The lock-in amplifier
Noise can degrade (or even completely hide) the signal you want to study in
a measurement. A signal-to-noise ratio (S/N ratio) is given to describe the
situation. If, for example, the S/N ratio is 10 it means that the top of the
measured signal is 10 times higher than the average background signal. When
the S/N ratio becomes really small it is hard to separate the peaks of the
signal from fluctuations of the noise (the background signal). Although, there
are measurement methods making it possible to improve the S/N ratio and
sometimes even detect signals completely hidden by noise. It is important
in some way to reduce the background noise from the measurement for the
useful signal to appear.
In the lab a function generator is used. This generator superimposes a modulation frequency upon the injection current. Since the emitted light is directly
dependent on the injection current, the light will contain the modulation
frequency as well. The signal is then detected phase sensitively at the modulation frequency with the help of a so called lock-in amplifier. With lock-in
techniques a mixer (also known as multiplier) is used generating the sumand difference frequencies out of two incoming frequencies.
One in-signal to the lock-in amplifier (the reference signal) is the modulation
frequency !ref and the other one is our detector signal fdet. Both of the signals
arc mixed in the lock-in amplifier and the result is !ref+ fdet· Since both of
9
the signals have the same frequency the result will be a DC-level Uref- !det),
which will be amplified, and a high-frequency signal Uref + !det), which will
be filtered away. The DC-level depends on the phase relation between the
two incoming signals and their amplitudes. It is possible to adjust the phase
relation on the lock-in amplifier so that a maximum DC-level can be achieved.
The detector signal and reference signals are then in phase with each other.
To sum up, it can be said that the lock-in amplifier works like a filter, stops all
signals not marked with the modulation frequency !ref and amplifies signals
modulated at this frequency.
Procedure
Fig. 6 shows schematically how the equipment will be connected, and what
your experimental set-up will look like after you performed the tasks 1 to 10.
:--:1\l
''h<:~:>
~:'t'~(I'C":C''"
T::,-,pr.r;oL·";
•;ont-: :,,
L>:tjt? las::.- ~ --·
!· 1:.-~·yl'
~
..rt>l
,~,~,::n
.o'
d:.vt!l
-tr--,~-=~-~·---- f
::_.,..:>-----'
Figure 6: A schematic of the experimental set-up used in the absorption
measurement.
1. First, get accustomed to the function generator by connecting it to
the oscilloscope and make sure you can generate a saw-tooth wave. A
suitable ramp frequency is 100 Hz and a suitable voltage amplitude is
about 40 mV (peak-to-peak value). When you have set the frequency
and amplitude, you connect the generator signal to the diode laser
driver modulation input (MOD IN).
CAUTION! DIODE LASERS ARE EXTREMELY SE~SITIVE FOR
TRANSIENTS (i.e. electrostatic discharges, cable reflexes etc.). Never
shut off the current to the function generator or disconnect it from the
laser driver unit as long as the diode laser is turned on. Make it a habit
to always turn off the injection current (the button at the upper right,
not the main current button at the lower left) to the diode laser before
you make a change in the experimental set-up.
10
2. Put on the safety goggles. Adjust the injection current to the recommended value lop· The laser is now ready to be used.
3. Focus the laser beam with a lens onto the detector (a photo diode).
Connect the detector via the current/voltage-amplifier to the oscilloscope and investigate the detector signal. You will sec how the laser
intensity varies with the injection current to the diode laser. It is possible that the light intensity becomes so great that the detector becomes
saturated (saturation will happen if you really focus the laser beam
onto the detector!). Place a grey filter, attenuating the laser intensity
100 times (OD = 2.0), in the beam path.
4. Insert the rubidium cell in the beam path. Be careful with reflexes.
The wavelength of the diode laser can now be coarsely tuned by altering
the temperature of the entire diode laser capsule. This is done using a
Peltier element, in contact with the diode laser. The Peltier element is
handled with the help of a temperature controller.
5. Vary the laser temperature ± (10-25)oC around 25°C at the same time
as you observe the signal on the oscilloscope. The information in the
data sheet will give you a hint around what temperature you will find
794.7 nm. The temperature regulator works slowly, have patience and
give it time to settle at the temperature you set. If you are lucky you
will directly see that the rubidium cell absorbs laser light at a specific
wavelength. If not, the absorption lines can be hidden in a mode-jump
(see Fig. 4). By changing the injection current a bit the positions of the
mode-jumps can be moved. It can take a while even for an experienced
experimentalist to find the absorption lines. If you are really unlucky,
the entire laser might have to be exchanged.
If the oscilloscope has problems with triggering, i.e. difficulty giving
a stable signal, you can connect the trig output of the function generator (SYNC OUT or AUX OUT) to the external trig input of the
oscilloscope.
6. First, control where the level is for 100 % absorption on the oscilloscope
screen. Thereafter, put a 50 % grey-filter (OD = 0,3) in front of the
detector. Keep the grey-filter with 100 times damping in the beam
path. If the signal, i.e. the ramp, on the oscilloscope is damped with
50 % as well, the detector part functions linearly.
7. Investigate what happens with the absorption from rubidium if you
place the grey-filter with 100 times damping in the beam path before
and after the absorption cell. Try to explain the difference. ::VIake sure
11
that the absorption is linearly dependent on the laser intensity.
8. Investigate and explain what happens with the absorption signal if
you change the injection current to the diode laser and the voltage
amplitude on the function generator, respectively. Adjust the injection
current and the voltage amplitude so that the largest possible part of
the wavelength sweep (for the absorption signal) is being used.
9. Split off laser light from the beam path before the rubidium cell and
aim it through the Fabry-Perot etalon. The laser light should hit a
detector (with a built-in amplifier) after the etalon, connected to the
oscilloscope. When the reflecting surfaces of the etalon are perpendicular to the laser beam, interference fringes ean be observed. The angle of
the etalon in relation to the laser beam can be fine tuned with the help
of two alignment screws on the etalon holder. The length of the etalon
is imprinted on its side. The index of diffraction of the etalon glass
is 1,51118 (BK7) and 1,51075 (K8) 1 , respectively, at the wavelengths
of interest. Thus, it is easy to calculate the separation in frequeney
between the interference fringes (the free spectral range).
10. Now save the oscilloscope signal from the detector (both from Rb absorption and the Fabry-Perot fringes) to a floppy disc. This will later
be used for an analysis of the spectra. To be able to calculate the absorption, the zero level must be present in the figure, you will obtain
this zero level by blocking the laser beam (100% absorption).
11. Evaluation of the spectrum
a) Calculate the linewidths (f~.fabs)·
b) Calculate the distances between the absorption lines to get the level
splittings.
c) Calculate the absorption, in percent of the light intensity, of the two
Rb lines and determine the linear absorption coefficient p,, if we know
that I(x) = I0 e~-'x, where xis the path length through the gas and ! 0
is the intensity before the gas cell.
d) Calculate the atom density in the cell. Usc the following approximate
relation:
where f-lmax is the value of f1 at the peak of the absorption profile, and
T is the lifetime for the excited state. The statistical weights can be
1 These
values were used for the Swedish laboratory exercise. They might not apply for
this laboratory exercise.
12
calculated with the results
at the strong and the weak absorption signal, respectively.
12. Think about your results. Do your values make sense? Compare with
the results of earlier laboratory exercises (ask your laboratory supervisor for these results) and the values you calculated in the preparatory questions (atom density, Doppler width, line width and distance).
Comment/explain possible differences. How is the precision and accuracy of the measurement?
13. Rearrange the equipment in the same status as it was when you arrived.
13
Appendix E
GAS MAS laboratory exercise
Laboratory exercise
GAS MAS
GAs In Scattering Media Absorption
Spectroscopy
Christoffer Bjorkwall, Marta Cassel-Engquist, Yolanda Angulo
September, 2005
Introduction
This laboratory exercise will introduce a spectroscopic technique called GASMAS. Scattering, absorption, and modulation technique will be introduced
and studied. During the laboratory exercise investigations on polystyrene
foam and balsa wood will be done. A suitable calibration method, standard
addition, will also be introduced.
Preparatory problems
Please read through the entire laboratory instruction, then solve the following
preparatory problems.
1. What could happen if the diode laser gets a too high injection current
input? If the current output from the PMT gets too high?
2. The current from the PMT is measured over an 5 kS1 external resistance. What should be the maximum voltage measured on the oscilloscope?
3. In Fig. 1 there is an example of an absorption signal and a ramp (PMT
current). Calculate the GMS signal. The figure indicates the zero-level
1
Tek.Run: lk.Sts
:
_ _ ,f
,-...,J\_
'/ .~~:
-,; ,.. v:>'\
~~
I\
iI
I
-<· ..
'-~
I
/
\
..:""
I
_-
1,,.··
Figure 1: A mode jump, an absorption signal and the saw-tooth shaped ramp
(PMT current).
with a zero.
4. In figure 16 it is possible to see the signal obtained and the 2nd derivative of an absorption signal and a mode jump. Make a sketch of how
you think the 1st derivative would look like for the examples given.
2.5
··-·-·-····-·-----------··-··-··-·---------·----------------·
2
~ 1,5
.,
~
,
y =0,3227x + 0,1886
R" ".0.9997
0,5
0 ~----------·--------------------------------
0
2
6
7
Added disbo nee f em
Figure 2: Measurement plot for a standard addition measurement.
5. Assume a sample has been studied and data according to Fig. 2 was obtained. What would be the equivalent mean path length of the sample
according to this function? Use centimeters.
6. When you perform the standard-addition procedure: What will, theoretically, be the difference between, for example, if you have a sample
containing gas or if you have nothing but an optical filter? The equivalent mean path length? The slope of the standard addition curve?
2
GAS MAS
GASMAS, GAs in Scattering Media Absorption Spectroscopy, is a technique that estimates the gas content inside scattering materials such as
polystyrene foam, fruits, and the human body. The GASMAS method uses
the fact that gases specifically absorbs light with a very sharp and distinct
wavelength in comparison with liquid or solid components, such as for example water, which has broad absorption features. The basic components in the
GASMAS set-up are a diode laser, a photomultiplier tube, and electronics
for the signal detection, including equipment for the use of modulation techniques, see Fig. 3. Currently, GASMAS is focused on measuring molecular
oxygen which absorbs light at around 760 nm. Thus, this laboratory exercise
is also focused on molecular oxygen.
Laser
Driver
mod 1
T
Diode
Figure 3: Figure showing a schematic GASMAS setup.
Molecular oxygen
Every molecule has, in addition to electronic energy levels, also vibrational
and rotational energy levels. During the laboratory exercise an absorption
line, resulting from the vibration and rotation energy levels, in the so called
A band of molecular oxygen will be studied, see Fig. 4. The A band consists
of many narrow absorption lines, around 760 nm, with a typical width of
GHz in atmospherical pressure.
3
8
7
t-6
·- 5
~ 4
]
3
2
>.
.>"9 (nrn)
Figure 4: The absorption lines in the A band of molecular oxygen.
Diode laser
Diode lasers were introduced about 40 years ago. Since then, they have
become the most important type of laser and a daily part of our life, such
as in CD players, bar-code readers and printers. They are small and cheap
but more important in absorption spectroscopy experiments is that they are
possible to tune in wavelength. Fig. 5 shows a diode laser together with a
match, pea and a peanut.
~(~)..
'•,,
...>-
Figure 5: The size of a diode laser in comparison with a match, a green pea
and a peanut.
Diode lasers, or semiconductor lasers, are produced as a compound of different materials. The materials used depend on which wavelength the laser is
manufactured to produce. It is today possible to reach wavelengths between
0.4 to 29 f-Lm with different types of diode lasers. The majority of the diode
lasers are made of doped materials from group III (e.g. AI, Ga, In) and group
V (e.g. N, P, As, Sb) in the periodic system. The first types of lasers produced were the homojunction lasers but they are obsolete today in favor to
heterojunction lasers. Homojunction lasers have a more simple construction
4
. .1
•
than heterojunction laser and will be described as a mean to understand the
function of a diode laser.
Homojunction lasers
A homojunction diode laser is created by joining semiconducting materials.
One of the materials is n doped, has an excess of electrons, and the other one is
p doped which means it has an excess of positive carriers, called holes. When
a voltage is applied over the semiconducting material the electrons from the
conduction band and holes from the valence band will diffuse through the
interface and be able to recombine, see figure 6. As a result, photons will be
emitted with the energy corresponding to the band gap.
Depletion
_____
-.-~-~:,---r
p-~eglon
n-reglon
con:a~~ion
•••••••._ ..........:•••••••••:••mm•••--y-~---,--Valence
IHII9ion
I
I
n-reglon
band
Figure 6: The band structure of a homojunction diode laser. The left picture
is without a voltage put over the junction and the right with an applied voltage.
The homojunction lasers have a major drawback; they cannot work at room
temperature. This is partially due to losses from absorption in the junction.
Heterojunction lasers
Losses from for example absorption of the photons in the cavity, can be
reduced in heterostructure diode lasers. Heterojunction lasers are much more
used nowadays than homojunction lasers because they can operate at room
temperature and do not need to be cooled. The laser used in this laboratory
exercise is of the heterojunction type.
The heterojunction lasers have an active layer, which is a semiconductor,
sandwiched between the two semiconductor layers with higher band gap energies, as shown in figure 7.
5
,--~--------Eg2
Eg1
Eg2
!
····································-······--·· ·-·····!.......................
L . __ _....L__ __
Figure 7: The band structure of heterojunction diode lasers.
Laser production
In a diode laser the emitted light will first be spontaneously emitted and with
the help of a gain medium and reflectance on the cleaved facets, the photons
will be mirrored and a so called cavity is created. As the emitted radiation
is able to bounce back and forth this will cause stimulated emission and the
diode will start to lase, i.e. emit light with the same wavelength and phase,
if inverted population is provided.
The wavelength output, and the intensity from a diode laser is dependent
on both the temperature and the injection current. At low currents, the
output intensity will be low and the diode will only work as a light emitting
diode, a LED. When the current exceeds a specific threshold current, Ith, the
diode laser starts to lase, see figure 8. This threshold current depends on
the temperature. By changing the temperature of the diode, the band gap
and the optical length change. The wavelength for GaAlAs-type diode lasers
changes approximately 0.3 nm;oc. This is the physical reason why diode
lasers are possible to tune in wavelength. Hence, the tunability of the diode
laser can be done by changing either, or both, the injection current and the
temperature. In this laboratory exercise we will try to keep the temperature
constant and use the current to sweep the wavelength.
Disadvantages
There are some disadvantages with diode lasers; their output beams are
astigmatic, assymetric and divergent. The astigmatism is a result of the fact
that the refractive index has a directional dependence. The assymetric and
divergent properties of the beam is due to the assymetrical shape of the diode
laser (normally rectangular 1 f..Lm x 3 f..Lm in the active layer). This results
in a 10-20° x 30-50° divergence, see figure 9. The beam, however, resembles
a Gaussian profile, which helps to handle this problem.
6
lth1 lth2 lth3
Current
Figure 8: The output power as a function of the injection current for different
temperatures.
Figure 9: The divergence features of a diode laser.
7
Another more important disadvantage of diode lasers is that they tend to
mode jump, i.e. making discrete jumps in wavelength, see figure 10. As with
any laser, the output wavelength is the one corresponding to the standing
wave in the laser cavity. When the laser is tuned in wavelength the gain
curve is shifted, resulting in mode jumps. To fully use the laser properties,
it is always important to only have one wavelength in the output from the
diode laser, a so called single-mode laser. Multi-mode operation occurs when
more than one standing wave in the cavity can lase equally well.
Mode jump
I,T
Figure 10: Diagram showing mode jumps making discrete jumps in wavelength.
Absorption
Atoms and molecules absorb certain characteristic frequencies or wavelengths.
This is an effect of their electronic shell structure and the vibrational and
rotational energy levels. If the photon energy, i.e. if the frequency or the
wavelength of the light is matching the energy separation of the atom or
molecule, it may use the energy and get excited, and the photon is absorbed.
Every atom and molecule has a unique set of absorption lines, i.e. its "fingerprint".
Absorption can theoretically be described by the Beer-Lambert law. It states
that the intensity of the incident light, ! 0 , attenuates exponentially as the
light travels through an absorbing material, see figure 11.
h(v, x)
=
Ia(v)e-u(v)c·x
(1)
The absorption cross section, O", is the probability of absorption in the unit
area per molecule or atom. The concentration of absorbing molecules or
atoms per volume unit is c, and x is the length traveled through the medium.
The cross section, and thus the transmitted intensity, are both highly frequency dependent, matching the energy level structure.
8
x Length
Figure 11: The absorption of a beam with intensity 10
Absorption spectroscopy
An absorption spectroscopy set-up consists of three main parts; a light source,
a sample, and a detector. The light is sent through the sample and the output
light is detected and measured as shown in figure 12. There are different types
of absorption spectroscopies. We will focus on the one used by GASMAS.
Light source
Absorbing material
Detector
Figure 12: The three main parts of an absorption spectroscopy set-up for gas
samples.
The properties which can be achieved through absorption spectroscopy is the
concentration, temperature and pressure of the sample. The concentration
can be calculated from the Beer-Lambert law, equation 1, by measuring h
and 10 , see figure 13, and knowing the path length and the absorption cross
section.
The light source
In GASMAS, a diode laser is used as a light source of the laser light. By
letting the injection current have a saw-tooth shape, the wavelength will
be repetively swept. The use of diode lasers in absorption measurements
is abbreviated TDLAS, which stands for; Tunable Diode Laser Absorption
9
Ill
Figure 13: A sweep in frequency over the absorption line at v0 • I states the
recorded intensity at v0 and ! 0 the intensity if no absorption would take place.
Spectroscopy. The diode laser has to be operated with a narrow, single-mode
profile to be able to detect the absorption lines.
The sample
In GAS MAS the free gas of molecular oxygen inside scattering materials is
studied. Scattering occurs when an incident beam interacts with a particle
and the reemission of the energy, or parts of it, is in many directions. This
effect is a result of the emission from the oscillating electric charges forced
by the alternating electrical fields. This scattering process results in the
path length, the distance the photons have traveled, being greater than the
thickness of the sample, see figure 14.
Figure 14: The distance the light travels zn a scattering sample is highly
dependent on the scattering of the sample.
This scattering process complicates the use of Beer-Lambert law, since the
actual trajectory is more difficult to correlate with the sample thickness. A
unit called equivalent mean path length, Leq, can be used to describe the
signal. This quantity is obtained by the so called standard-addition method
discussed further ahead.
10
The detector
The detector used in GASMAS is a very sensitive instrument, a photomultiplier tube, PMT (Hamamatsu R5070A). The incoming light releases electrons, from a photosensitive material, which are successively and substantially amplified, thus producing a measurable current. Amplification occurs
due to the presence of a high voltage difference between the anode and cathode of the PMT, which is supplied by an external high voltage generator. A
series of intermediate dynodes divide the full voltage and the amplification
is performed in an avalanche through the dynode chain.
It is of high importance not to let the output current from the PMT be too
high, since this might destroy the PMT. In order not to exceed the maximum,
the output current is measured over a resistance to create a voltage that can
be measured with the oscilloscope. The maximum output current from the
PMT is 100 j.tA but it is only linear up to 10 j.tA.
Modulation
In some applications, the absorption signal is smaller than the surrounding
noise. To find these small signals, modulation techniques together with a
lock-in amplifier can be used.
When a diode laser scans the wavelength over an absorption line with a
ramped signal, a direct signal, from the detector is obtained by reading directly the output of the PMT. In some cases, if the absorption is strong
enough, it is possible to see the absorption signal in the direct signal, see
Fig. 13. In other cases the absorption is small and modulation techniques
need to be used. The modulation techniques enable to measure a signal
which is only at an order of 10- 4-10- 5 of the direct signal.
Modulation means that a high-frequency sinusoidal signal is added to a carrier signal, e.g. the ramp that scans over an absorption line, see figure 15. The
modulation frequency is also sent as a reference to a frequency- and phasesensitive lock-in amplifier. The output signal from the detector, is filtered by
the lock-in amplifier, using the reference frequency, and analyzed. Through
modulation, the signal is moved to a detection band at higher frequencies,
where the noise level is lower according to noise theory.
Modulation in absorption spectroscopy is also referred to as derivative spectroscopy, because the modulation signal gets the form of the derivative if the
11
Figure 15: Ramp with a modulated high frequency sinus function, including
a zoom-in on the modulation.
modulation is small. Figure 16 shows the direct signal for a mode jump and
an absorption signal and their resulting lock-in signals.
Absorption signal
Mode jump
roc:
0)
+
"ii5
c:
·;~
(.)
0
....J
Figure 16: A comparison between an absorption signal and a mode jump
in the direct signal, together with their corresponding lock-in signals. The
lock-in signal corresponds to the second derivative of the direct signal.
Normalization
When dealing with absorption spectroscopy it is of great importance to normalize the signals, in order to be able to compare results. The measured
12
intensity can vary depending on the sample geometry, the alignment and
some other things. In GAS~AS, normalization is performed by taking the
height of the lock-in signal divided by the intensity of the direct signal at the
location of the absorption signature, see figure 17. The normalized signal is
referred to as the GASMAS signal, and is denoted GMS.
0----------~-------------------
s,
Figure 17: Diagram showing the normalization measurement p'oints.
821
s1 + s2
-
2
s2 1
sdir
GMS -
(2)
(3)
Standard addition
There are many ways of estimating gas content. GASMAS uses standard
addition to determine an equivalent mean path length, which relates the
measured signal to that of absorption in free air. In the standard addition
procedure, the absorption signal is measured for different distances between
the sample and the fiber. With this procedure a calibration line can be
drawn and the equivalent mean path length, Leq, can be extrapolated, see
Fig. 18. The equivalent mean path length defines how much a certain oxygen
absorption corresponds to the distance the light would have to travel through
air to obtain the same signal. For this reason the equivalent mean path length
13
can actually be longer, or shorter, than the real thickness of the measured
sample.
Figure 18: Several standard addition measurements giving the equivalent
mean path length through an extrapolated line.
The equivalent mean path length, Leq, is dependent on both the concentration of molecular oxygen and the scattering coefficient of the sample. In a
highly scattering sample the light will travel a longer distance along more
complicated pathways, and hence, there will be larger probability to find
molecular oxygen. The real concentration of molecular oxygen in the sample, Csm, can then be related to the concentration in free air, by using Leq
according to
(4)
where Lsm is the actual optieal path length traveled by the light inside the
scattering sample. One needs, then, to know Lsm to determine C8 m, or vice
versa.
Laboratory exercises
Laser safety considerations
The diode lasers are small and have a relatively low output power, but the
laser beam can still be harmful to your eyes. The diode laser used in this
lab is of class IIIb, which means that it is potentially dangerous to your eyes
by direct incidence, or by diffuse or reflected incidence lasting longer than 10
seconds. The wavelength of the laser is about 760 nm which is a wavelength
14
where the human eye has low detection ability. But, even if the laser beam
seems to be really weak, it might still be powerful! There is an IR card in the
lab. With this detection device it is possible to see laser beams at infrared
wavelengths.
The diode laser we are using has an output power of about 5 rnW. This
power is enough to damage the human eye and thus, we need to take certain
precautions:
• You should under no circumstances ever look straight into the laser
beam. Use the IR card if you need to investigate the path of the
laser beam but make sure the reflected light from the card is aimed
downwards.
• Take off rings and wristwatches that might reflect the laser light. They
can cause hazardous reflections when working with the laser beam.
• Make it into a habit to always turn off the laser when not making
experiments.
• There are laser protection goggles (two pairs) in the lab.
• Remember that when working with dimmed light your pupils are larger
and more light can come inside. So these recommendations should be
considered with attention. Thus, it is advisable to work at a reasonable
light level in the laboratory.
Photomultiplier tube
1. Turn off channel 2 on the oscilloscope.
2. Make sure the 5 H1 external resistance is connected on the input of
channel 1.
3. Make sure the voltage from the power supply for the PMT is set to
zero. Turn on the laser, and set the temperature and current values if
they are not set to the given values.
4. Raise the voltage for the PMT to achieve 10 J-LA according to your
preparatory calculation, but do not let it exceed this value. What this
corresponds to on the oscilloscope was calculated in the preparations.
A large noise will probably be seen on the screen, depending on amplification etc.
15
5. Remove the external resistance, without changing anything on the
power supply for the PMT voltage. What docs the 10 J-lA current
corresponds to now? Remember this value and never let the PMT
current exceed this value.
6. Lower the PMT voltage to zero.
Producing a calibration curve for standard addition
Follow the next instructions to generate a standard-addition curve.
1. Put a piece of polystyrene foam on the sample board in between the
fiber and the filter to the PMT.
2. Lower the fiber so there is no gap of air between the sample and the
fiber, but without deforming the sample.
3. Raise the voltage slowly over the PMT so the current out from the
device is 10 J-lA. Use the value obtained.
4. Turn on channel 2 with the modulation signal.
5. Move the signal with the injection current to the laser so the signal is
centered.
6. Press Harm on the lock-in amplifier and change it to one. This selects the harmonic studied. The first harmonic corresponds to the first
derivative of the direct signal and the second harmonic to the second
derivative. Compare with the preparations. Change back to the second
harmonic.
7. Change the sensitivity setting on the lock-in amplifier to achieve an
optimal lock-in signal, e.g. the highest sensitivity setting achievable
without overloading the lock-in amplifier (note that clicking the down
arrow will increase the sensitivity setting).
8. :.vleasure and normalize to obtain the GMS signal.
9. Raise the fiber 1 em each time and measure, up to 5 em. All together
6 measurements.
10. Make a table of GMS vs. height in em, and from it, make a standard
addition curve on the computer and calculate the equivalent mean path
length for the sample.
16
Measurements on polystyrene foam
Different thicknesses
Measure and calculate Leq for different thicknesses of polystyrene foam.
What does the dependency look like?
Different widths
You will be given a set of rectangular pieces of polystyrene foam, with different side sizes. Measure and calculate Leq for different widths of polystyrene
foam. How do you think the graph would look like? Why do you think you
observe a difference in GMS signal for different sizes? Explain.
Measurements on balsa wood
Measure and calculate the Leq for a piece of balsa wood. Consider the actual
size of the sample and compare with the measured Leq· Does the actual size
correspond to the measured Leq? Why or why not?
17
Appendix F
Manual
A user's manual named Manual for the GASMAS set-up at EPN, Quito was
made with the following table of contents:
1. Introduction
2. Background
3. GAS:viAS
4. Equipment
5. Noise
6. The LabVIEW program
7. GAS:viAS
8. Procedures
9. Frequently asked questions and common problems
10. Appendix A: Updating this manual
11. Appendix B: Further information