1
«DINAMIKA», the research laboratory
SYSTEM OF COMPLEX COMPUTER-AIDED INSPECTION
OF THE FUNCTIONAL CONDITION OF A HUMAN ORGANISM
«DINAMIKA MEDICINE»
User’s Manual
Saint-Petersburg, Russia
2007
www.dyn.ru
2
Table of contents
1. INTRODUCTION ..........................................................................................................................5 1.1. Common Info .............................................................................................................................................................. 5 1.2. Application areas........................................................................................................................................................ 5 1.3. System Capabilities .................................................................................................................................................... 6 1.4. System features........................................................................................................................................................... 6 1.5. What’s new in current version .................................................................................................................................. 7 2. DELIVERY SETS ..........................................................................................................................8 2.1. Basic Set ...................................................................................................................................................................... 8 2.2. Portable Set................................................................................................................................................................. 8 3. TECHNICAL DESCRIPTION .....................................................................................................8 3.1. Remote ECG registration module with embedded blood pressure measurer ...................................................... 8 3.2. Technical Features ..................................................................................................................................................... 9 3.3. Requirements for a PC .............................................................................................................................................. 9 3.4. Warranty Statement .................................................................................................................................................. 9 4. GETTING STARTED .................................................................................................................10 4.1. Software installation ................................................................................................................................................ 10 4.2. Preparation for the first start and the first start ................................................................................................... 12 4.2.1. For Windows Vista Users........................................................................................................................ 12 4.2.2. First start Dinamika Medicine software ............................................................................................ 13 4.3. Plugging the Remote Module .................................................................................................................................. 14 4.3.1. Installation the USB-device drivers. .................................................................................................. 14 5. OPERATION ORDER ................................................................................................................16 5.1. Starting Software ..................................................................................................................................................... 16 5.2. Creating a Group of Patients .................................................................................................................................. 17 5.3. Adding a Patient into the Database ........................................................................................................................ 18 6. ECG REGISTRATION ...............................................................................................................19 6.1. Plugging the remote module of ECG registration ................................................................................................. 19 6.2. Blood pressure measuring ....................................................................................................................................... 20 3
6.3. ECG Recording ........................................................................................................................................................ 21 7. SCREENING AND DIAGNISTICS ...........................................................................................26 8. DYNAMICAL MONITORING AND FORECAST..................................................................30 9. SYSTEM ANALYSIS ..................................................................................................................32 9.1. Variation analysis of heart rhythms ....................................................................................................................... 32 9.2. Neurodynamic analysis ............................................................................................................................................ 37 9.3. Charting of brain biorhythms ................................................................................................................................. 40 9.4. Fractal analysis of the organism's biorhythms ...................................................................................................... 43 9.4.1. Biological age ............................................................................................................................................. 44 10. MONITORING ..........................................................................................................................45 10.1. Recording ................................................................................................................................................................ 45 10.2. Analysis ................................................................................................................................................................... 47 11. CONTROLLED RESPIRATION IN THE “BILOGICAL FEEDBACK” MODE .............48 12. WORKING WITH DATABASE ..............................................................................................49 12.1. The “Card-Box” window ....................................................................................................................................... 49 12.2. Working with groups ............................................................................................................................................. 50 12.2.1. Creating a new group ........................................................................................................................... 50 12.2.2. Editing ........................................................................................................................................................ 51 12.2.3. Deleting ...................................................................................................................................................... 51 12.2.4. Processing ................................................................................................................................................. 52 12.2.5. «Group Report» ...................................................................................................................................... 52 12.2.6. “Into Archive / From Archive » ......................................................................................................... 54 12.2.7. Group from network .............................................................................................................................. 55 12.3. Working with patients’ files .................................................................................................................................. 56 12.3.1. Search Patient ......................................................................................................................................... 56 12.3.2. Adding new patient................................................................................................................................ 57 12.3.3. Editing Data .............................................................................................................................................. 59 12.3.4. Copying/Moving to other group ........................................................................................................ 60 12.3.5. Deleting ...................................................................................................................................................... 61 12.3.6. PROCESSING ........................................................................................................................................... 61 12.3.7. “Into Archive / From Archive” ........................................................................................................... 62 12.4. Working with ECG Records ................................................................................................................................. 63 13. ECG EDITOR ............................................................................................................................64 14. COMPLEX PRINT ....................................................................................................................65 15. USEFUL FUNCTIONS..............................................................................................................67 4
15.1. Search patient by name ......................................................................................................................................... 67 15.2. Web-cam usage....................................................................................................................................................... 67 15.3. Selective report ....................................................................................................................................................... 67 15.4. Network support .................................................................................................................................................... 67 16. TROUBLESHOOTING.............................................................................................................68 16.1. Problems with recording ....................................................................................................................................... 68 16.1.1. The selected device type is incorrect ............................................................................................. 68 16.1.2. AC power noise ....................................................................................................................................... 69 16.1.3. Incorrect AC frequency is used ......................................................................................................... 69 16.2. Database problems ................................................................................................................................................. 70 16.3. Security violation.................................................................................................................................................... 70 16.4. 3D-breath mode doesn’t work............................................................................................................................... 70 17. MULTI-CHANNEL SYSTEM “CRAB” FOR SIMULTANEOUS OBSERVATION OF 7
PATIENTS ........................................................................................................................................71 17.1. Delivery package .................................................................................................................................................... 71 17.2. PC hardware requirements ................................................................................................................................... 71 17.3. Plugging “CRAB” system to a PC ........................................................................................................................ 72 17.3.1. USB-device driver installation ........................................................................................................... 73 17.4. The “CRAB” system usage .................................................................................................................................... 74 17.4.1. Plugging the remote modules of ECG registration .................................................................... 74 17.4.2. ECG recording .......................................................................................................................................... 74 17.4.3. Monitoring-recording............................................................................................................................. 77 5
1. INTRODUCTION
1.1. Common Info
“Dinamika Medicine” - the digital analyzer of biorhythms – is a hardware-software complex, intended to analyze
human heart and brain rhythms extracted from an electrocardiosignal in the broadband frequency. The system
is based on a new information analysis technology of non-linear signals of a different physical nature – a socalled "Fractal Neurodynamics".
Designing the system, the latest achievements in theoretical and clinical medicine and physiology were used,
and a number of new highly informative health evaluating indices are offered.
“Dinamika Medicine” allows:
- in the screening mode - to estimate a level and reserves of a cardiovascular, vegetative and central regulation, and to evaluate deflections of these parameters from normal values;
- to estimate a level of indemnification and power resources of an organism at various levels of a regulation;
- in the “biological feedback” mode – to estimate capabilities of the self-regulation, to evaluate and forecast
psycho-physical condition of a patient;
- in the dynamical monitoring mode - to monitor a functional condition of the patient and to estimate the effectiveness of various methods of therapy at realization of treatment-and-prophylactic measures;
- to create a medical report and give necessary recommendations as the results of a computer-aided analysis.
The “Dinamika Medicine” system helps doctors of any field of medicine to monitor all parameters of the functional condition of a patient, to predict their changes, to estimate the organism's resources and to evaluate the
effectiveness of the treatment. In cooperation traditional and non-traditional therapy, the hardware-software
complex “Dinamika Medicine” allows to create the unique diagnostically-therapeutic mini-studies with the completed cycle “diagnostics – therapy – monitoring – forecast” in various environmental conditions.
1.2. Application areas
{
The profile medical research institutes, hospitals, private clinics, first-aid posts of the industrial
enterprises and establishments:
- dynamic observation over parameters of the functional condition of a patient during therapeutic treatment;
- selecting schemes and optimization of the different methods of treatment;
- multi-functional monitoring in surgeries, resuscitations and intensive care chambers;
- monitoring and forecast of the functional condition parameters during an aftertreatment.
{
Polyclinics, centers of preventive medicine, studies of functional diagnostics, private medical
studies:
- express-diagnostics of the functional and psychophysical condition of a patient with printing of a computer
report by results of survey;
- detection of the patients requiring for additional clinical survey at the doctors in profile medical establishments;
- detection of the patients of an oncology types, including at early stages of disease;
- evaluation of effectiveness of traditional and non-conventional methods of therapy during a treatment.
{
The specialized medical departments of atomic stations, airlines, police, banks etc.:
- selecting the staff for operating work with completing a personal database of physiological parameters;
- screening and diagnostics during medical observations of staff;
- monitoring and forecast of a psychophysical condition of operators, dispatchers, pilots, drivers, and other
persons in requirements of a nervous-emotional strain and monotonic work;
- individual choice of optimum agents of regeneration at overwork and chronic overstrain: vitamin balance,
normalization of dream etc.;
- detecting drug-users, including using drugs at a working place.
6
{
The scientific - practical centers of sports medicine, sports clubs, sports schools, health centers:
- Express - monitoring of acclimatization of the sportsman to exercise stresses training level and power resources estimation;
- Evaluation of a level of a self-regulation in the “biological feedback” mode and monitoring of the psychoemotional condition of a sportsman during competitions;
- Dynamic observation over parameters of the sports form during post-trauma aftertreatment and during
bolstering and corrective medicament and physiotherapeutic treatment.
1.3. System Capabilities
{
ECG registration in any standard lead and real-time monitoring of the functional condition parameters.
{
Blood pressure measuring while ECG registration.
{
Self-regulation level estimating in the biological feedback mode.
{
Screening and diagnostics of the functional condition of a patient.
{
Dynamical monitoring of changes of the functional conditions parameters – health calendar and clock.
{
Daily forecast of the psycho-physical activity in the “biological clock” mode.
{
Estimation of the cardiovascular condition and neuro-humoral regulation according to the “golden section”
on the ECG timing parameters.
{
Estimation of the vegetative regulation parameters using statistic, time and spectral methods of heart
rhythms analysis.
{
Estimation of the central regulation parameters and the endocrine system by the methods of neurodynamics analysis of the human biological rhythms.
{
Estimation of the psycho-physical condition o f the patient by the methods of the phase analysis and the
brain biorhythms mappings.
{
Estimation degree of a harmonization of biorhythms of an organism and evaluation of an information parameter of the immune status by the fractal analysis method.
{
Controllable psycho-physiological therapy (“the dope effect”) in the biological feedback mode.
{
Sequential 12-leads ECG registration with the visual monitoring of the recording quality.
{
Automatic evaluation of the PQRST parameters with the ability of manual correction.
{
Giving the complex medical report as the results of computer-aided analysis. Saving and printing the results of survey.
{
Individual medical card-file of an ambulatory with a built-in database on 15000 diagnoses.
{
Electronic patients file which can be exported, imported and archived.
1.4. System features
ECG registration at any standard lead during 5 minutes is completely enough to get all necessary information. A
patient may sit or lay.
Brain rhythms are extracted from the ECG signal registered in a wide range of frequencies. No encephalogram
is needed.
Monitoring of the parameters of the functional condition is implemented exactly during the ECG registration.
The “biological feedback” mode is applied to evaluate parameters of self-regulation and to correct psychoemotional state of a patient.
Printed report of the observation can be completed with a patient’s photo (in case of using a digital camera).
Independent power supply allows examining patients in any environment and conditions.
7
1.5. What’s new in current version
New type of the remote module of signal registration was developed for the “Dinamika Medicine” complex. It is
supplied with embedded blood pressure measurer. A new photon-coupled cable is used for transmitting an ECG
signal. New model distinguishes:
- improved noise stability;
- high quality of a registered signal;
- reliability in maintenance;
- longer session of continuous work.
At development of the software the experience of five years' operation of system in medical establishments of
Russia and abroad, and wishes and notes of the users was taken into account.
Software of the “Dinamika Medicine” complex is designed for Windows 98 and uses all capabilities of modern
operation system.
Modules of real-time monitoring, biological feedback, screening and diagnostics, 12-leads ECG registration and
analysis were developed for the new version.
The electronic medical card-file of the patient ensuring an intrusion in medicine of paperless technology was
designed.
A specially designed converter-program provides usage the medical database of the previous versions.
The system designers will appreciate any comments and recommendations on the software and documentation.
Due to constant up-dating of the software, this manual may differ to some extent from its later versions.
8
2. DELIVERY SETS
2.1. Basic Set
1. ECG remote module;
2. Software on a CD;
3. The Skintact F 9024 AC cardiographic electrodes;
4. Blood pressure cuff on a forearm;
5. Interface cable USB;
6. Medical bag.
2.2. Portable Set
Basic Set (2.1.);
Portable PC – Notebook Pentium-IV;
Ink-jet color printer;
Computer bag.
3. TECHNICAL DESCRIPTION
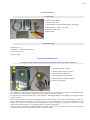
3.1. Remote ECG registration module with embedded blood pressure measurer
2
1. Lead cable plugging socket.
2. Interface cable plugging socket.
4
5
3. Blood pressure cuff socket.
1
4. ECG registration mode display.
5. Blood pressure and pulse display.
6. Power on/off button
3
6
The computer’s USB-interface with photon-coupled junction is used as the power supply of cardiograph card.
Four batteries of “AA” type are used as the power supply of built-in tonometer.
In case turning on the tonometer there is the symbol of discharged battery on the display, then replace of batteries is needed.
Note: With some lap-top models, operating by means of outer source, not by means of accumulator, while writing the ECG some noise appears. To remove this noise it is recommended to turn off the alternating current
adapter from the outer source and to use accumulator as a power supply for the lap-top. In case there is hum
while using a desk computer, it is recommended to use ground connection.
Also the printer, connected via USB-interface, can be the origin of hum. To avoid the noise it is recommended
to disconnect printer from the computer while recording the ECG.
9
3.2. Technical Features
Input voltage range ………………………………………………………………………………………………………………………….…0.03 - 5 mV
Input impedance not less than ............................................................……………………………..……………..... 5 MΩ
Internal noise level not more
..........……………………………………………………..…….10 mkV
Attenuation factor of co phased signals on 50 Hz frequency not less ......………………………………………………… 110 dB
Direct current in a chain of the patient, not more ............................................……...…………………...... 0.1 mkA
Bandwidth ........................................................................………………………………………………..….. 0.03 - 500 Hz
Stationary value of time ..................................................................................………..………….........3.2 sec.
Input signal sampling rate ..............................................….……………………..……………………………………... 1000 Hz
Number of the discharges of quantization ......................................................................………………..….. 12
Transmission rate on a sequential data link RS232C …................................................................. 38 Kbod
Independent power supply voltage …………………………………………………………………..……………………………….……….…+ 5 V
Time of continuous operation without recharging ……………………………………………………………………………...…... 20 hrs.
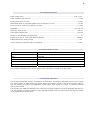
3.3. Requirements for a PC
Recommended configuration
CPU
Intel Celeron M 1.7 ГГц
RAM
1024 Мб
Display Adapter
ATI Radeon 9000; nVidia GeForce 5200
Free disk space
over 200 Мб
Operating system
Windows XP, Windows Vista
Any windows-compatible printer device can be used for printing the results of an observation.
3.4. Warranty Statement
The warranty operational period is 36 months from installation. All warranty operations will be held in company's Service Center in Saint-Petersburg, Russia. Within the warranty period, in case of the system's malfunction, the Company provides a free replacement of the system either in part or in whole, in conformity with the
delivery set checklist.
The Company will adapt the software to the Customer's working conditions. During the applicable warranty period, the Company will inform Customer of the upgraded software versions, and in case of interest, the Company will install them at a lower price.
10
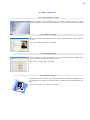
4.GETTING STARTED
4.1. Software installation
1. Turn the PC on.
2. Insert the software CD.
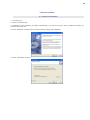
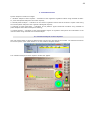
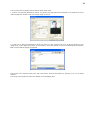
Installation of the software will begin automatically, if it has not occured, start installation manually by
means of file Setup.exe.
3.
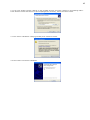
4. In the “Welcome” window press the “Next” button to begin the installation.
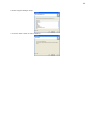
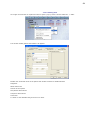
5. Select Destination Location.
11
6. Select Program Manager Group
7. Press the “Next” button to start installation.
12
4.2. Preparation for the first start and the first start
4.2.1. For Windows Vista Users
1.
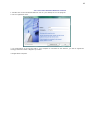
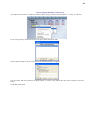
The program should be started with the administrator rights.For this purpose click the right mouse button on a program icon in the desktop and in the appeared menu choose "Property" item. Further, in the
opened window first choose a "Shortcut" tab and then press button "Advanced".Check the item "Run as
Administrator" in the appeared window and press button "OK".
2.
Now you can go to 4.2.2.
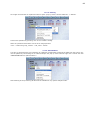
Note: Another way and also for more comfortable work in Windows Vista, it is possible to turn off the
"User Account Control (UAC)".For that, press a combination of "WinKey + R" in the and type "msconfig"
in the appeared window. In the opened window "System Configuration", press the "Tools" tab, choose
the "Disable User Account Control" list item, press the "Start" button and restart the Windows. After
switching-off of the "User Account Control" you can go to 4.2.2.
Remember, that the given action lowers safety of your computer!
13
4.2.2. First start Dinamika Medicine software
1. Double-click on the “Dinamika Medicine” icon on your desktop to run the program.
2. Fill the registration form.
3. For continuation of work press «ОК» if your computer is connected to the Internet, you can be registered
having pressed the button «Register by E-mail».
4. Registration Complete.
14
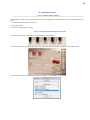
4.3. Plugging the Remote Module
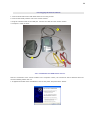
1. Connect electrodes to the lead-cable and fix them using screws.
2. Connect the blood pressure cuff to the remote module.
3. Plug the interface cable to the USB port. Connect the cable and the remote module.
4. Complex is ready to work!
3
2
1
4.3.1. Installation the USB-device drivers.
After the connection of the remote module to the computer is done, the new device will be detected and new
devices installing master will run.
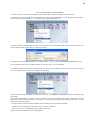
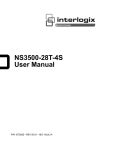
1.In appeared window check “Installation from current place” and push “Next” button.
15
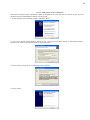
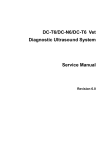
2. In the next window uncheck “Search on the portable sources” and check “Search in the following folder”.
Press “Browse” button and choose “D:\Drivers\Omega5.drv” directory, then press “Next” button.
3. In the “Device installation” notifying window press “Continue” button.
4. Press “Finish” to finish the installation.
16
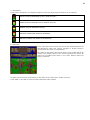
5.OPERATION ORDER
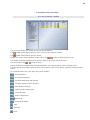
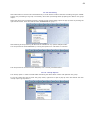
5.1. Starting Software
1. Double-click the “Dinamika Medicine2” icon on your desktop to run the program.
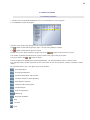
2. The database window will appear.
Left part of the window will display the list of groups of patients.
The
symbol means that the group is open – the list of the patients is shown.
The
symbol means that the group is closed.
Double click on the name of group or single click on the
/
symbol to open/close the group.
The number of patients contained in the group is show to the right of the group name.
The group without any
/
symbol is empty.
The list of patients is alphabetically sorted alphabetically. The selected patient name is colored yellow.
The right part of the window represent the list of the ECG’s of the current patient, sorted by the date of observation.
All functional buttons are in the upper string of the window:
- ECG Registration
- Screening-Diagnostics
- Dynamic Observation and Forecast
- Variation Analysis of Heart Rhythms
- Neurodynamic Analysis
- Charting of Brain Biorhythms
- Fractal Analysis
- ECG 12 Registration
- Monitoring
- Biological Feedback
- help
- minimize
- close
17
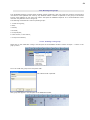
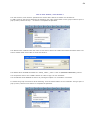
5.2. Creating a Group of Patients
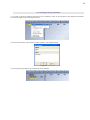
1. To create a group of patients right-click on the “Card-File” string in the left part of the window and choose
the “Groups->New” item in the pop-up menu.
2. Fill the “New Group” form and press “OK” (“Notes” is an optional field).
3. The new group will appear in the left part of the window.
18
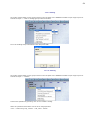
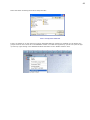
5.3. Adding a Patient into the Database
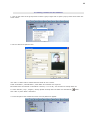
1. Click on the name of the group name to select a group. Right-clock to open a pop-up menu then select “Patients->New”.
2. Fill the “Add a new patient” form
Use “Tab” or “Shift+Tab” to switch between fields. Or use a mouse.
Fields “First Name”, “Second Name”, “Birth Date” and “Gender” are required.
Birth Date has to be entered in “DD.MM.YY” format (i.e. 17.01.45). You can also use a drop-down list.
To enter “Gender”, “City”, “Region”, "Group” please use drop-down list which are activated by
Click “OK” or press “Enter” when done.
3. In the left part of the window the name of a new patient will appear.
button.
19
6. ECG REGISTRATION
6.1. Plugging the remote module of ECG registration
1. Place electrodes onto patient’s wrists, contacts inside. It is also recommended to moisten the skin. A patient
should sit or lay still. You do not have to observe polarity.
Note: Sometimes, when the amplitude of R-peaks is too low, the red electrode should be placed on the right
wrist but the yellow one – on the left ankle, which also has to be moistened very well.
Attention! Please follow these reduce noise during the ECG registration:
a) patient’s arms have to be relaxed and lay still.
b) there should be nobody else in 1.5 – 2 meters around.
c) do not place the remote module near sources of magnetic and electrical fields (TV-Sets, old models of computer displays, etc.)
d) patient should try to be in most comfortable and relaxed position. It is NOT recommended to disturb a patient by talking or to demonstrate a computer display with ECG being recorded.
2. Cuff placing order:
20
a) Drag the edge of the cuff through the metal contour so, that the entry point of the air tube should be placed
on the outer side of an arm upon the elbow.
b) Pass the arm through the result ring to place the air tube towards the patient’s palm.
c) Place the cuff in 2-3 cm from the elbow.
Attention! The white line on the cuff (3 cm length) should be right upon patient’s arterial.
d) Densely but not hardly tighten a blood pressure cuff. The cuff should tightly fir an arm; otherwise the results
of observation would be incorrect. Do not place the cuff upon the clothes.
e) Place the arm on the table so, that the entry point of an air tube would be on the elbow and on the heart
height. Be sure that the tube is not over wound.
f) Ask patient to relax and sit still for 2 minutes before the ECG registration.
Attention! You can use either left or right arm. Anyway you should use only one arm.
6.2. Blood pressure measuring
After placing the cuff you can start measuring.
1. Press the “0/1 MEMORY" button. The device will be switched on. It will start pumping the cuff automatically
and the value of the cuff pressure will be shown on the display.
After reaching the estimated limit, the air will be releasing automatically. In the left part of the display the
speed of pressure decrease will be shown.
The pulsing sound signal will report of detecting a pulse and the symbol
♥ will be shown on the display.
The long sound signal means the end of measuring. All air will be released from the cuff automatically. The display will show values of the arterial pressure and pulse.
2. Press the "0/1 MEMORY" to switch the device off, otherwise it will be powered down automatically after 5
minutes.
3. Most frequent user errors:
Please take into account that all measuring should be done in the same conditions. As usual, blood pressure
measuring is carried out in a spacehold.
Every gain of a patient (i.e. horn on an arm) may cause the blood pressure to increase. Make sure that the patient’s body is relaxed, especially the used arm.
Incorrectly placed cuff may cause the incorrect measures.
To avoid incorrect results please make a 1 minute pause between two measuring.
4. Using the memory functions.
The device can keep the results of last measuring in its memory. Press and hold for 3 seconds the “0/1 MEMORY” button to view these results on a display.
5. Stop the measuring.
If it is required to stop the measuring (i.e. it’s causing pain to a patient), just press the “0/1 MEMORY” button.
The device will be switched off and all air will be released.
21
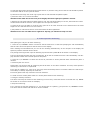
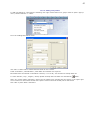
6.3. ECG Recording
1. Click to select a patient on the left panel. The selected patient’s name will be colored yellow. Press the “REC”
button to start recording the ECG.
2. The “ECG Registration window will open
3. Press “START” button. The ECG signal will appear in the upper window.
If no signal appears – see “TroubleShooting”
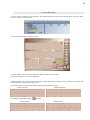
4. Before starting to record you have to achieve stable ECG signal in which precise R-peaks are marked with
vertical markers. Follow these steps to do it:
a) Choose positive polarity of the ECG by pressing the “POLARITY” button
Positive polarity
b) Establish appropriate scale by
Source signal
Negative polarity
regulator
Scaled signal
22
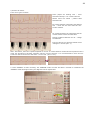
c) Remove all noises.
There are 3 types of noises:
Some people are walking near – there
should be nobody in 1.5-2 meters around.
Patient moves his hands – patient hand
should be still.
Be contact between electrodes and patients
skin – moist the skin and clean the electrode’s contacts.
No contact between the electrodes and the
remote module. Check the lead cable.
Remote module’s batteries are off – charge
the batteries.
Incorrect device type selected. Please select
“Omega 7.1” device (16.1.1).
Note: Sometimes, when the R-peaks amplitude is too low or contact between electrodes and a patient’s skin is
weak, the algorithms of R-peaks extraction may do not work properly. It is recommended to move the electrode from the left wrist to the left ankle – the 2nd lead. (see 7.1.4.1).
5. Press “RECORD” to start recording. The “PREPARE” mode will start and after 5 seconds of countdown the
“RECORD” mode will begin working. All diagrams will be regenerated.
23
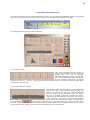
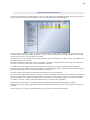
The “ECG” window
Time from the beginning of the record
(in minutes and seconds) is shown along
the abscissa axis. The axis of ordinates
represents amplitude of ECG. Vertical
lines are marking extracted R-peaks. By
default, the scale of ECG is 25 mm/sec.
To change the scale to “12.5 мм” – “25 мм” – “50 мм” please use the “SCALE” button. Use mouse to drag the
graph along vertical and horizontal axes.
The “Rhythmogram” window
This window shows the dependence of the RR-interval
duration from the number of the evaluation cycle. The
artifacts are marked with red color. Along the abscissa
axis the numbers of the evaluation cycles are shown.
The time, in seconds, is along the ordinate axis. Rhythmogram can be represented in two modes: 300 and 100
cycles. The button “100/300” is used to switch between
these modes.
The “PQRST” window
This window displays a cardio-complex, relevant to an RR-interval, selected on
the rhythmogram. Blue marks are reflecting P, Q, R, S, & T peaks. Select (with
the left mouse button) the necessary rectangle of the graph to zoom in. Click
right mouse button to zoom back. Double-click left mouse button to switch to
the manual measuring mode. For gauging amplitude-time parameters according to accepted standards it is necessary to place markers P and T of peaks on
a beginning and an end P and T peaks accordingly.
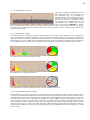
The “Histogram” window
The histogram represents the chart of a relation of quantity of RR-intervals in
different intervals of their duration. Duration of RR-intervals is shown along the
abscissa axis. Axis of ordinates represents probability of their occurrence (i.e.
number of RR-intervals in the relevant gamut). Artifacts are marked with red.
The “Scatterogram” window
R-R intervals scatterogram is a two-dimensional display of the heart rhythm,
which allows receiving the so-called “mnemopictures” characteristic of the
main types of the heart rhythm disturbances. Along the abscissa axis is the
value of RRi-interval in seconds. The ordinates axis represents the value of
RRi+1-interval in seconds. Artifacts are marked with red.
The “Functional condition” window
This indicator displays the normalized value of the current integral index of
the functional state of the patient. The first value of the index appears after
60 intervals of record and updates every 10 intervals.
24
The “Dynamics of indices of functional state” window
Click the 2 button to open this window. Colored graphs
represent changes of current indices of physical state
during the recording process: A, B, C, D & Health. The
abscissa axis shows numbers of RR-intervals from 50 to
300. The first value of the index appears after 60 intervals of record and updates every 10 intervals. The first
value of the index appears after 60 intervals of record
and updates every 10 intervals.
А – level of acclimatization of cardiovascular system
B – index of a vegetative regulation
C – index of a central regulation
D – psycho-emotional state
H ealth – integral index of a functional state
6. You have to control quality of the ECG signal periodically. If any noises noticed – stop the record by pressing
the “RECORD” button, figure out the reason of noises, press the “CLEAR” button to reset the record and repeat
record by pressing “RECORD” button.
The duration of record is controlled by the number or RR-intervals indicator, which is upon the “Rhythmogram”
window
(the first value is the number of recorded RR-intervals, the second value is the number of
artifacts). The record will stop automatically after 300 “clear” RR-intervals. You can interrupt the recording by
pressing the “RECORD” button.
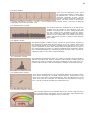
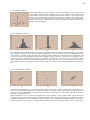
Attention!
If a patient has obviously expressed violations of a cardiac rhythm, such as extrasystole and different sorts of arrhythmias the calculation of metrics of a functional state will be yielded incorrectly.
Estimation of the functional state metrics and processing an ECG in all modes can be done only if
the patient does not have any violations of a cardiac rhythm!
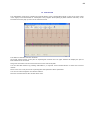
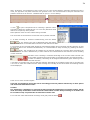
Typical view of the “Rhytmogram”, “Histogram” and “Scatterogram” windows when the patient has cardiac
rhythm violations are shown on the pictures below:
Fibrillation
Doubled rhythm.
7. If the patient’s blood pressure was measured before the ECG registration – it can be entered in the conforming window in the right-bottom corner of the window:
Use “Tab” key to switch between fields.
Click on the field to enter the values.
8. You can leave any comments during the recording. Click mouse button on the comment string to edit it.
25
9. The following dialog box will appear after finishing the recording:
Press “Yes” to save the record.
10. Press “EXIT” to close the window.
Note: to quit before the end of recording you have to press “RECORD” and “START” buttons sequentially and
the press “EXIT”.
11. After closing the “ECG Registration” window the right part of the display will contain the string with the
number, date and duration of the saved record.
26
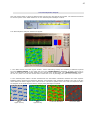
7. SCREENING AND DIAGNISTICS
Click left mouse button to select the patient’s ECG record in the right part of the database window. The selected
record will be colored yellow. Press the “SCR” button to run the “Screening-Diagnostics” module.
The “Screening-Diagnostics” window will appear.
1. The “ECG” window
Time from the beginning of the record (in
minutes and seconds) is shown along the
abscissa axis. The axis of ordinates
represents amplitude of ECG. Vertical lines
are marking extracted R-peaks. By default,
the scale of ECG is 25 mm/sec. To change
the scale to “12.5 мм” – “25 мм” – “50 мм” please use the “SCALE” button. Use mouse to drag the graph along
vertical and horizontal axis.
2. The “Rhythmogram” window
This window shows the dependence of the RR-interval
duration from the number of the evaluation cycle. The
artifacts are marked with red color. Along the abscissa
axis the numbers of the evaluation cycles are shown.
The time, in seconds, is along the ordinate axis. Rhythmogram can be represented in two modes: 300 and 100
cycles. The button “100/300” is used to switch between
these modes. The RR-intervals counter is shown above
the rhythmogram
. It represents: total amount of recorded RR-intervals, number of “clear” intervals and number of artifacts. Click left mouse button to select an RR-interval. Selected interval will be colored
yellow and the “ECG” window will display the corresponding part of a cardio signal.
27
3. The “PQRST” window
This window displays a cardio-complex, relevant to an RR-interval, selected on the
rhythmogram. Blue marks are reflecting P, Q, R, S, & T peaks. Select (with the left
mouse button) the necessary rectangle of the graph to zoom in. Click right mouse
button to zoom back. Double-click left mouse button to switch to the manual measuring mode. For gauging amplitude-time parameters according to accepted standards it is necessary to place markers P and T of peaks on a beginning and an end
P and T peaks accordingly.
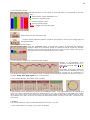
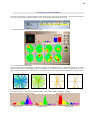
4. The “Histogram” window
А
В
С
The histogram represents the chart of a relation of quantity of RR-intervals in different intervals of their duration. Duration of RR-intervals is shown along the abscissa axis. Axis of ordinates represents probability of their
occurrence (i.e. number of RR-intervals in the relevant gamut). Artifacts are marked with red. Histogram's step
is 0.04 sec. Gamut of the histogram's basement is between 0.32 & 1.64 sec. In the state of a vegetative equilibrium columns are centered and the highest one (Moda) is between 0.7-1.0 sec. (fig. A). Columns are essentially biased to the left and the histogram's basement is not so wide (fig. B) in case of influence of the sympathetic department of the vegetative nervous system. And vice-versa in case of para-sympathetic influence (fig.
C).
5. The “Scatterogram” window
А
В
С
R-R intervals scatterogram is a two-dimensional display of the heart rhythm, which allows receiving the socalled “mnemopictures” characteristic of the main types of the heart rhythm disturbances. Along the abscissa
axis is the value of RRi-interval in seconds. Axis of ordinates represents the value of RRi+1-interval in seconds.
Artifacts are marked with red.
Uniform distribution (fig. A) means and equilibrium in the vegetative nervous system state. Higher density of
the scatterogram “cloud” and it's biasing towards the bottom left corner (fig. B) means the predominance of the
sympathetic department of the vegetative nervous system. And considerable straggling of points of scatterogram and biasing to the right (fig. С) speak about predominance of influences of a vagus nerve on a sine node.
28
6. The “FS Chart” window
This diagram show normalized values of index of a physical state.
А – adaptation level of cardiovascular system
В – index of a vegetative regulation
С – index of a central regulation
D – psycho-emotional state
Health – integral index of a functional state
7. The “Dynamics of indices of functional state” window
Double-click left mouse button upon the
histogram graph to open this window. Colored graphs represent changes of current
indices of physical state during the recording process: A, B, C, D & Health. The abscissa axis shows numbers of RR-intervals
from 50 to 300.
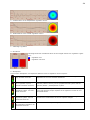
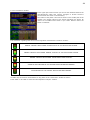
8. “Semaphore”
Colors of the “semaphore” correspond to different levels of functional state:
NORMAL FUNCTIONAL STATE. HIGHER ACTIVITY.
NORMAL FUNCTIONAL STATE.
INAPPRECIABLE DIVERSIONS OF A FUNCTIONAL STATE FROM A NORMAL STATE
IT IS RECOMMENDED TO REPEAT THE OBSERVATION
ABNORMAL FUNCTIONAL STATE.
FURTHER OBSERVATION IS RECOMMENDED
PRE-ILLNESS STATE. SIGNS OF PATHALOGICAL CHANGES.
CLINICAL OBSERVATION IS STRONGLY RECOMMENDED
29
9. The “Conclusion” window
Indices of a physical state are shown in the upper part of the window.
These parameters were calculated using unique methods of mathematical
analysis of human biorhythms. All indices are in per cents. Computer
conclusion is giver for each parameter separately and regarding an organism's
condition
in
common.
24-hours forecast of changes of level of psycho-emotional and physical
activity of a patient is given in the bottom part of a window.
“Green” – levels of psycho-emotional and physical activity are high; optimal
adaptation;
“Yellow”
–
medium
activity
levels;
normal
adaptation;
“Red”
–
low
activity
levels;
low
adaptation;
Use ↓ cursor key or PgDn key to switch to the second page; use ↑ or
PgUp to return to the first one.
Indices of a heart activity are shown on the second page of the window. These indices are calculated using
standard methods of the variation analysis of the heart rhythms. Normal values of each parameter are shown
to the right and a text conclusion regarding current state is shown below.
Coefficient of vegetative equilibrium (АМо/ΔХ) shows relation between
activity of the sympathetic and para-sympathetic departments of vegetative nervous system.
Index of adequacy of processes of a regulation (АМо/Мо) reflects correspondence between activity of a para-sympathetic department of vegetative nervous system and leading level of operation of the sinus node.
Vegetative Index of a Rhythm (VIR=1/Мо*ΔХ) allows to evaluate vegetative balance from a point of view of an estimation of activity of an
independent contour of a regulation. As this activity grows (VIR decreases), then the vegetative balance biases to the predominance of the parasympathetic department of the vegetative nervous system.
Stain Index (SI=АМо/2*ΔХ*Мо) of the regulation systems reflects a
level of centralization of a control of the heart rhythm.
The central part of the window is intended for entering the medical conclusion and name of a doctor. Click on a
field to enter the information. This data will be saved and used while printing the report.
Click left mouse button on any place of the window of hit “ECS” key to close the window.
10. The “Print” button
Pressing the “Print” buttons completes the full observation report which includes all current elements of window. Thus, it is recommended to choose the interesting ECG fragment, scale it, place all markers and calculate
the PQRST-complex parameters before starting to print.
After completing the report, the window “Print Server” will appear.
Use “ZOOM” button to preview.
Use “PRINTER” button to start printing.
Use menu “File” -> “Printer Settings” to configure parameters.
30
8. DYNAMICAL MONITORING AND FORECAST
The mode of dynamic observation is applied at nonsingular (two and more) surveys for comparison purposes of
exponents of a physical state of the patient. In this mode all discharged records an ECG are handled (excluding
artifacts), for which the pretreatment was yielded.
Choose a patient using mouse. The name of a selected person will be colored yellow. Select several ECG record
in the right part of the database window. Press “DYN” button to run this module.
The “Dynamical Observation and Forecast” window will appear.
1. The "ECG records" window
In the upper-left window the list of patient's ECG records is shown. To move across this list please use Home,
End, PgUp, PgDn buttons, or a mouse. The selected record is colored red. The last record in the list is selected
by default.
31
2. The "FS Chart" window
Normalized values of the indices of functional state are represented on this diagram.
А – Cardiovascular system adaptation level
В – Vegetative regulation index
С – Central regulation index
D – Psycho-emotional state
Health – integral functional state index
Blood pressure for the selected record.
- Dynamic gamut (difference between maximum and minimum values of the integral index of
the physical state).
3. The "Indices Trend" window
Press the "COMPARE" button to activate this window. It represents the difference
between indices of two selected records. By default two latest records are selected.
Selecting records to compare can be done in the "ECG records" window. During comparing previous record is subtracted from the next one.
4. The "Dynamics of indices of a functional state" window
Graphs of corresponding colors
represent normalized values of indices of a functional state: A, B, C,
D & Health.
Id numbers of the ECG records are
shown along the abscissa axis. Up to
26 records can be represented in
one window simultaneously. The selected record is marked red. Moving along the graph can be done using cursor keys, Home, End, PgUp, PgDn keys, or using mouse.
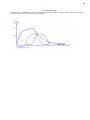
5. The "Health calendar” and “Health clock" windows
These windows can be activated by pressing the "CALENDAR" button. Color marked dates on the calendar and
time on the clock represent date and time of observations. The color corresponds to the health level. Digital
value in the center of the clock shows the average value of the integral index of the functional state. By scrolling calendar to the left one can see the history of observations and by scrolling to the right - forecast for the
next month.
6. EXPORT
This function allows to export all calculated indices to an Excel (*.xls) file.
7. Click “EXIT” button or hit “ESC” key to close the window.
32
9. SYSTEM ANALYSIS
System analysis includes four stages:
1. Variation analysis of heart rhythms – evaluation of the vegetative regulation indices using methods of statistic, time and spectral analysis of the heart rhythms;
2. Neurodynamic analysis – evaluation of the central regulation indices and the endocrine system state using
the neurodynamic analysis of the organism’s biological rhythms;
3. Charting of brain biorhythms – evaluation of the patient’s psycho-emotional condition using methods of
phase analysis and of brain biorhythms charting;
4. Fractal analysis – evaluation of the harmonization degree of organism’s biorhythms and estimation of the
immune status using methods of the fractal analysis.
9.1. Variation analysis of heart rhythms
Click left mouse button to select a patient’s EGC record in the right part of the window. The selected record will
be colored yellow. Press “VAR” button to run the Variation Analysis module.
The “Variation analysis of heart rhythms” window will appear.
33
1. The "Rhythmogram" window
This window shows the dependence of the
RR-interval duration from the number of
the evaluation cycle. The artifacts are
marked with red color. Along the abscissa
axis the numbers of the evaluation cycles
are shown. The time, in seconds, is along
the ordinate axis. Rhythmogram can be
represented in two modes: 300 and 100
cycles. The button "100/300" is used to
switch between these modes. Above the rhythmogram the RR-intervals counter resides. This counter shows:
the total amount of RR-intervals recorded, amount of clear RR-intervals, amount of RR-intervals filtered with
1st and 2nd level filters.
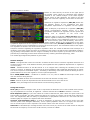
2. The "Spectrogram" window
The spectral analysis is based on a physical transformation of the heart rhythm oscillations of the simple harmonic oscillations with various frequencies. Thus the sequence of cardiac cuttings is conversed to a spectrum of
power of oscillations of duration of RR-intervals RR, frequencies, representing sequences describing dynamics of
heart rhythms, to each of which there corresponds particular density (amplitude) of oscillations. As measure of
an estimate the area, restricted curve of spectral power relevant to some particular frequency band is used.
a) Predominance of para-sympathetic activity
b) Predominance of sympathetic activity
c) Predominance of cerebral ergotropic and/or humoral-metabolic influences
3. The “Autocorrelation function” window
Click 2 button to activate this function. The autocorrelation function diagram is built according to the values of
a series of correlation factors between an initial dynamic series of RR-intervals and new series, obtained at sequential biases on one value. The steepness of wane of an autocorrelogram can be determined on value of a
correlation factor after the first detrusion (lk). Besides the exponent Mo is entered which displays through how
much of detrusions there is a first negative value of a correlation factor. At strong connection between central
and independent contours a dynamic series RR is more organized, the autocorrelogram damps slowly and value
lk and m0 above (fig. А). The prompt initial wane of the Autocorrelation function with the subsequent slow signal attenuation testifies to presence of confronting influences of an independent and central contour on a heart
rhythm (fig. В).
34
А – Predominance of the independent regulation contour
В - Predominance of the central regulation contour
С – Pathologic regulation
4. “VR indices”
This diagram shows normalized values of the integral indices of a vegetative regulation:
В1 – regulation level
В2 – regulation resources
5. “Semaphore”
Colors of the “semaphore” correspond to different levels of vegetative nervous system:
Normal vegetative regulation
High function resources.
Minimal or optimal exertion of regulation systems. Good organism's
adaptation to the environmental conditions.
Moderate strain of the vegetative regulation system.
Normal functional resources.
State of a physical strain manifested by mobilization of protective mechanisms, Raise of activity of the sympatho-adrenal system and the
"pituitary bodies - paranephroses" system.
Hard strain of the vegetative
regulation system. Low functional resources.
Overstrain. Lack of adaptation and protective mechanisms. Disability
to provide optimum proper response of an organism to action of environmental factors.
Malfunction of the vegetative
regulation system. Too low
functional resources.
Malfunction of the adaptation mechanisms. Attrition of the regulation
mechanisms. Predominance of the non-specific changes.
Functional malfunctions of
the vegetative regulation. No
functional resources.
Premorbidal state with prevailing of particular changes.
35
6. The “Conclusion” window
Indices of a heart activity are shown in the upper part of
the window. These indices are calculated using standard
methods of the variation analysis of the heart rhythms.
Normal values of each parameter are shown to the right
and a text conclusion regarding current state is shown below.
Coefficient of vegetative equilibrium (АМо/ΔХ) shows relation between activity of the sympathetic and parasympathetic departments of vegetative nervous system.
Index of adequacy of processes of a regulation (АМо/Мо)
reflects correspondence between activity of a parasympathetic department of vegetative nervous system and
leading
level
of
operation
of
the
sinus
node.
Vegetative Index of a Rhythm (VIR=1/Мо*ΔХ) allows to
evaluate vegetative balance from a point of view of an estimation of activity of an independent contour of a regulation. As this activity grows (VIR decreases), then the vegetative balance biases to the predominance of the parasympathetic department of the vegetative nervous system. Stain Index (SI=АМо/2*ΔХ*Мо) of the regulation
systems reflects a level of centralization of a control of the heart rhythm. The normalized indices of the vegetative regulation are shown in the center of the window.
Computer conclusion regarding the vegetative regulation is blow. The results of different kinds of analysis of a
variability of the heart rhythm are shown in the bottom of the window. All analysis meet “Standards of Measuring, physiologic interpretation and clinic usage of variability of the heart rhythm” by the Task Force of the European Society of Cardiology and the North American Society of Racing and Electrophysiology, 1996.
The medical-physiological interpretation is given below.
Statistic Analysis
RRNN – average duration of the R-R intervals. It reflects the final result of numerous regulation influences to a
sinoatrial rhythm of the usual balance between para-sympathetic and sympathetic departments of vegetative
nervous system;
SDNN – standard deviation of the NN interval. It is an integral index reflecting the variability of the heart
rhythm in common. It depends of the influences of para-sympathetic and sympathetic departments of vegetative nervous system to a sinoatrial rhythm ; Increasing or decreasing of this index shows the biasing of the vegetative balance to one of the vegetative nervous system departments.
CV = SDNN/RRNN*100% – Coefficient of variation. It is very close to SDNN but also helps to take 'pulse
rate' into account during analysis.
RMSSD – standard deviation of the subtraction of RR-intervals and their average value.
NN50 – amount of pairs of sequential RR-intervals which difference is more than 50 ms.
pNN50 – their percentage from the total amount of intervals being analyzed
Histogram Analysis
Moda (Мо) is the most frequent value of RR. It represents the dominant level of the sinoatrial node functioning. At sympathonia it is minimal, at vagotonia – maximal. Normal value of Moda is between 0.7 and 0.9.
Moda Amplitude (АМо) is a per cent relation of number of RR-intervals, which values are equal to Mo to the
total number of intervals. This index reflects the degree of a rigidity of a rhythm. Its normal value is about 3050%. The magnification АМо will testify to predominance of sympathetic influences on a sine knot and considerable rigidity of a rhythm. At vagotonia this index decreases.
Variation Total Amplitude (VTA) is a result of subtraction of maximum and minimum values of the RRintervals (width of the histogram basement). VTA is a para-sympathetic index. As it is higher, the valal influence on a heart rhythm is more expressed. The normal values of the VTA are from 0.15 to 0.45.
HRV-index is calculated upon a histogram built with 8 ms interval, by division of the total number of analyzed
RR-intervals to frequency of occurrence of RR-intervals, relevant to a Moda.
36
Spectrum analysis
HF – High Frequency: 0.15 – 0.40 Hz. Oscillations in the above frequency band are built by the parasympathetic department of the vegetative nervous system. The power in this frequency band is incremented
during respiration with particular frequency and depth, at cold influences. Sportsmen and well-trained people
have higher power of HF than others. Their HF power is much more than low frequency power. Decreasing of
this power means stain of the regulation heart systems, means over-training, though its excessive magnification speaks about danger of infringement of a sinoatrial rate.
Low Frequency – LF: 0.04 – 0.15 Hz. The physiological interpretation of this index is ambiguous. It is considered, that power in this frequency band is influenced by change of tone para-sympathetic and sympathetic
departments of nervous system.
The relation between sympathetic and para-sympathetic influences is reflected by LF/HF relation When tone
of a sympathetic department increases, this index increases rapidly. And vice-versa at vagotonia. Reciprocal
changes in powers of LF and HF were observed in many cases. Essential increment of the LF power was also
observed during orthostatic probe, psychological stress, and medium physical stain. Therefore point of view
recently wide-spreads, that power in a gamut LF, as well as exponent LF/HF, can serve an exponent of activity
of a sympathetic department of vegetative nervous system.
Very Low Frequency – VLF: 0,003 – 0, 04 Hz and Ultra Low Frequency – ULF: lower than 0,003 Hz. The physiological interpretation of this index is ambiguous. But there is an opinion, that the power of these frequencies
essentially increases at attrition of an organism's regulation systems.
Complete frequency spectrum (Total) – less than 0.40 Hz. It is an integral index and reflects both parasympathetic and sympathetic departments of an independent nervous system. Thus the intensifying of the
sympathetic influences gives the decrease of the total power of a spectrum, and the activation of a vagus gives
an inverse action. The given index is equivalent to a root-mean-square deviation and variation total amplitude.
At interpreting data of the time analysis of dynamics of heart rhythms of the sportsmen it is necessary to take
into account, that the considerable predominance of para-sympathetic influences to a sinoatrial rate is a normal
appearance for them. Therefore, the adjusting of boundaries of norm of numerical values of statistics is necessary at holding survey of the sportsmen. Namely, it is necessary to expand boundary of norm to those in a
state of a moderate vagotonia at the not trained people. At the same time, values close to moderate sympathonia will speak about the expressed infringement of system of a regulation of heart rhythm and drop of a reserve of acclimatization at the given sportsman.
37
9.2. Neurodynamic analysis
Click left mouse button to select a patient’s EGC record in the right part of the window. The selected record will
be colored yellow. Press “NDA” button to run the “Neurodynamic Analysis” module.
The “Neurodynamic analysis” window will appear.
1. The “Wave frame of an EGC signal” window - allows estimating visually the variability of different rhythms
from the PQRST-complex. In the upper-left corner the “Golden Section” parameter is shown, which is a relation of the duration of the whole complex to the period of the cardio-signal. The “Golden Section” parameter can vary from 0 to 0.62. Its normal value is more than 0.15. In pathology this value never exceeds 0.01.
2. The “Neurodynamic Matrix” window characterizes the information interaction between the heart rhythms.
Separate matrix elements correspond to different neurodynamic code exposition windows. The color of an element defines the failure degree of the code structure. The twelve grades of the color scale correspond to different degrees of the code structure failure, ranging from pathologic to optimal.
Norm
Hyper Activity
Norm
Hypo-activity
Functional disorders
Pre-illness state
38
3. The “Codes Histogram” window represents the distribution of neurodynamic codes according to the degree of
their structural failure. In the red field there are codes with defective structure, in the yellow field there are
codes with modified structure, in the green area are the codes, whose structure corresponds to the normal
functioning of the body.
Norm
Hyper Activity
Norm
Hypo-activity
Functional disorders
Pre-illness state
4. The “Energy Pyramid” window – the dynamic display of the energy balance in different control systems of the
body. The correlation between the right and left parts of the pyramid characterizes the dynamics of anabolic
and catabolic processes – the left part corresponds to the accumulation period, while the right one corresponds
to the consumption period by different organs and systems of the organism. The energy pyramid is characterized by the following indices: the anabolism index, the energetic resource, the energetic balance, the catabolism index. Examples of “energy pyramids” corresponding to different states of the organism are shown in the
picture below.
Optimal energy
balance
Norm
Lowered energy
resources
Signs of emaciation
Emaciation
5. The “CR Diagram” window
This diagram represents the normalized values of integral indices of the central regulation:
С1 – compensation level
С2 – compensation resources
39
6. The “Conclusion” window
In the upper part of the window you can see the relations between the
neurodynamical codes and normal, changed or broken structure
(normal limits are shown in the brackets).
The indices of the power resources are shown in the middle part of the
window. The integral indices of the central regulation are below. All
values are normalized and shown in per cents. Normal values are
shown in brackets.
The conclusion regarding state of the central regulation mechanisms includes 5 variants:
NORMAL CENTRAL REGULATION. SUPERACTIVITY OF THE REGULATION SYSTEM.
NORMAL CENTRAL REGULATION. NORMAL ACTIVITY OF THE REGULATION SYSTEM.
NORMAL CENTRAL REGULATION. LOWER REGULATION ACTIVITY.
SIGNS OF MALFUNCTION OF THE CENTRAL REGULATION MECHANISMS.
MALFUNCTION OF THE CENTRAL REGULATION MECHANISMS.
Hit “ESC” key of left-click mouse button on any place on the “Conclusion” window to close it.
Press “EXIT” or hit “ESC” to close the “Neurodynamic Analysis” module.
40
9.3. Charting of brain biorhythms
Click left mouse button to select a patient’s EGC record in the right part of the window. The selected record will
be colored yellow. Press the “EEG” button to run the Brain Biorhythm Charting module.
The “Brain Biorhythms chart” window will appear.
1. The “Phase Spectrum” window
Colors of the spectrum correspond to different rhythms. The width of sectors is defined according to the modulation indices of the correspondent parts of the spectrum. The maximum colors mean normal activity. In case
of functional and pathologic malfunctions of an organism the level of phase portrait saturation decreases rapidly.
2. Frequency spectrum.
The spectral power is calculated for gamut a delta, theta, alpha, beta1- and beta2- rhythms.
Hyper activity
Normal activity
Hypo-activity
41
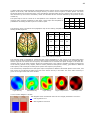
3. Spline maps are two-dimensional representations of the central nervous system biorhythms in the functional
spaces of the brain, and characterize integral activity of central nervous system in these spaces. The brain
functional spaces are formed discreetly in the periodically repeated spans of time, and are built in the brain cellular structure by the neuron ensembles, which are activated at the moments defined by the periods of their
refractivity.
The spline-map is built on results of an interpolation of the amplitude values of
common brain rhythms compared to each other. These maps are templates of
probabilities of shifting of basic rhythms in brain’s space.
δ-δ
θ-δ
α-δ
β-δ
θ-δ
θ-θ
α-θ
β-θ
δ-α
θ-α
α-α
β-α
δ-β
θ-β
α-β
β-β
Delta
Tetta
Alpha
Beta
Delta
8.3
5.4
3.2
9.1
Tetta
4.0
6.7
8.3
9.4
Alpha
5.9
6.9
6.2
7.1
Beta
The following figure represents the topographic map of the shifting template which shows the probabilities of
shifting of basic rhythms.
8.2
6.8
9.0
11.2
Topographic map of the shifting template
The charting mode is intended for monitoring and virtual visualization on the screen of the maps with power
spectrums of the brain biorhythms. The set of spline cards completes the visual analysis of a recorded total bioelectric signal of the central nervous system, and enables one to evaluate the space changes in the brain biorhythms' activity on 8 maps of power spectrums simultaneously. This makes it possible to locate the beginning
of the activity growth of any rhythm, observe solitary flashes of biorhythms' activity, generalized in different
brain spaces, and to analyze the biorhythms' power and frequency asymmetry.
The consecutively completed set of the spline maps corresponds to different functional spaces of the brain, and
their colors are conditioned by different levels of the electric activity in the brain. The color scale of activity is
given on the right-hand side of the window.
Hyper Activity
Normal Activity
Hypo-activity
Signs of depression
Pathologic state
4. The “Control Diagram” window
This diagram shows normalized values of the integral parameters of control:
D1 – self-regulation level
D2 – Self-regulation resources
42
5. “Semaphore”
Colors of the “semaphore” correspond to different levels of a psych-physical condition of an organism:
PERFECT PSYCHO-EMOTIONAL STATE. HYPER ACTIVITY.
GOOD PSYCHO-EMOTIONAL STATE. NORMAL ACTIVITY.
NORMAL PSYCHO-EMOTIONAL STATE.
NERVOUS STRAIN AND SIGNS OF WEAKNESS.
NERVOUS STRESS AND SIGNS OF DEPRESSION.
6. Conclusion.
In the upper part of the window you can see the relations between the
neurodynamical codes and normal, changed or broken structure
(normal limits are shown in the brackets).
The indices of the power resources are shown in the middle part of the
window. The integral indices of the central regulation are below. All
values are normalized and shown in per cents. Normal values are
shown in brackets.
Hit “ESC” key of left-click mouse button on any place on the “Conclusion” window to close it.
Press “EXIT” or hit “ESC” to close the “Brain biorhythm chart” module.
43
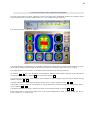
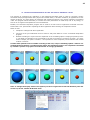
9.4. Fractal analysis of the organism's biorhythms
Click left mouse button to select a patient’s record in the right pane of database window. The selected record
will be colored yellow. Press the “FAB” button to run the “Fractal Analysis” program.
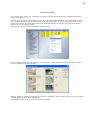
The “Fractal Analysis” window will appear.
The fractal analysis is intended for the evaluation of the harmonization degree of biorhythms at different control
levels and for definition and forecast of sporting form index for a relatively long period (up to 10 days).
The fractal portrait – in the center – is formed by the biorhythms of an examined patient.
In windows 1 – 8 there are standards corresponding to different harmonization degrees of the biorhythms
ranging from the maximum window 1 to the minimum window 8 .
The harmony of biorhythms at all levels of control testifies to high energetic resources and an optimal energy
balance, windows 1 – 2 .
A partial disharmony in biorhythms at certain control levels is seen in fractal portraits 3 – 4 .
A decrease of energy resources and changes in energy balance are characterized by the bio-rhythms' disharmony, windows 5 – 6 .
A complete emaciation of energy resources is shown in the fractal portraits of windows 7 – 8 .
If the fractal index is more than integral index in the “express-diagnostics” mode, then the health stat will improve, otherwise – it will be worse.
44
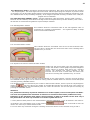
9.4.1. Biological age
Biological age is calculated by results of formation gerontological rhythm which is under construction a method
of transposing of the measured functional condition.
45
10. MONITORING
This mode is intended for ECG registration and real-time monitoring of the functional indices. Such monitoring
can be very helpful for the express control of patient’s condition in the following cases:
-
evaluation of the anesthesia depth;
-
evaluation of the effectiveness and dosage of physiotherapeutic procedures;
-
express-control of any kind of non-traditional therapies: stylostixis, bioreverberatory therapy, etc.
The only limiting factor is the condition of ainesia of the patient during a monitoring.
10.1. Recording
1. Left-click mouse button on the patient’s name in the left window to select a patient. The patient’s name will
be colored yellow. Press the “MON” button to run the Monitoring program.
2. The “ECG Monitoring” window will appear.
3. The “START” button. The ECG signal will appear in the upper window.
If no signal appears – see “TroubleShooting”
4. You have to achieve the steady signal before staring the recording. There must be clear R-peaks marked
with vertical markers. See 6.3.4.
5. Press the “RECORD” button to start recording. The mode selecting dialog will appear.
46
The “Monitoring” mode is intended for permanent ECG registration. Only values of RR-intervals are recorded
– the “Rhythmogram”. The cardio signal will not be saved. Use the special program “Analysis” to process results
of recording. You can also place special markers to distinguish beginning and end of different procedures. Press
the “PAUSE” button to stop recording temporary. Press it again to proceed recording. Duration of the “Analysis”
program has no limitations.
The “ECG Recording (300 RR)” mode – the ECG registration is also permanent, and the signal is saved in
blocks of 300 RR-intervals, which allows recording several consequent blocks (one after another). Then recorded data can be researched using different system analysis methods.
The “Self-Regulation” window
This indicator shows the normalized value of the self-regulation index. It
represents the “Vegetative Homeostasis” – the organism’s ability to adapt
to the environmental conditions.
The “Functional State” window
This indicator shows the normalized value of the current functional index.
The first value is shown after 60 counts from start of the recording and is
updated every 10 counts.
The “Dynamics of indices of functional state” window
Double-click left mouse button upon the histogram graph
to open this window. Colored graphs represent changes of
current indices of physical state during the recording
process. The abscissa axis shows numbers of RRintervals. The first value is shown after 60 counts from
start of the recording and is updated every 10 counts.
6. You have to control quality of the ECG signal periodically. If any noises noticed – stop the record by pressing
the “RECORD” button, figure out the reason of noises, press the “CLEAR” button to reset the record and repeat
record by pressing “RECORD” button.
The duration of record is controlled by the number or RR-intervals indicator, which is upon the “Rhythmogram”
window
(the first value is the number of recorded RR-intervals, the second value is the number of
artifacts). The record will stop automatically after 300 “clear” RR-intervals. You can interrupt the recording by
pressing the “RECORD” button.
Attention!
If a patient has obviously expressed violations of a cardiac rhythm, such as extrasystole and different sorts of arrhythmias the calculation of metrics of a functional state will be yielded incorrectly.
Estimation of the functional state metrics and processing an ECG in all modes can be done only if
the patient does not have any violations of a cardiac rhythm! See 6.3.7.
7. If the patient’s blood pressure was measured before the ECG registration – it can be entered in the conforming window in the right-bottom corner of the window:
values. Use “Tab” key to switch between fields.
Click on the field to enter the
8. You can leave any comments during the recording. Click mouse button on the comment string to edit it.
47
9. The following dialog box will appear after finishing the recording:
Press “Yes” to save the record.
10. Press “EXIT” to close the window.
Note: to quit before the end of recording you have to press “RECORD” and “START” buttons sequentially and
the press “EXIT”.
11. After closing the “Monitoring” window the right part of the display will contain the string with the number,
date and duration of the saved record..
10.2. Analysis
This mode is intended for processing data recorded during the ECG registration in the “Monitoring” mode. It can
also process records imported from the “Aelita” system.
Double-click on an ECG record to run the analysis program.
The “Monitoring-Analysis” window will appear.
Use the scroll bar in the upper part of the rhythmogram to choose the part of the ECG signal you a going to
investigate. The diagram of the dynamics of the functional indices updates simultaneously.
You can select a part of the rhythmorgam by dragging a mouse. The length of the selection must be more than
57 RR-intervals. Release the mouse button to calculate all indices of the selected part. The diagram to the left
will show the results of calculation.
48
11. CONTROLLED RESPIRATION IN THE “BILOGICAL FEEDBACK” MODE
The program of controlling the respiration in the biological feed-back mode is used for correction psychoemotional and physiological state after physical and mental loads, in stressful situations, at appearance of indications of fatigue, for rising efficacy of medicines and medical procedures. The regular respiratory gymnastics
under this program allows essentially to increase the basic parameters of health and, first of all, energy resources of an organism and parameter of immunodefence.
Besides, the controlled respiration program can be used as an active test of organism’s functional resources.
Please taka 5 min. pause before repeating the ECG registration after finishing the respiration session.
Order of work:
1.
Complete a “background” ECG registration.
2.
Left-click on the just made ECG record to select it and press “BFB” to run the “Controlled Respiration”
program.
3.
Breathe according the rhythm and the amplitude of the “breathing sphere” keeping all pauses precisely. The depth of respiration must correspond to the size of the sphere: the sphere is bigger – the inspiration is deeper, the sphere is smaller – the expiration is more completely. The duration of this session
is about 5 minutes.
Caution! Each patient have to breathe according to his own, unique “breathing sphere” which is calculated based on the ECG, recorded exactly before the breathing session. The respiration controlled
by another’s sphere or by sphere recorded earlier is strongly prohibited.
Note: to change the display mode of the sphere you have to right-click in the left database pane and
switch on/off the “Enable 3D Breath” item.
49
12. WORKING WITH DATABASE
12.1. The “Card-Box” window
Left part of the window will display the list of groups of patients.
The
symbol means that the group is open – the list of the patients is shown.
The
symbol means that the group is closed.
Double click on the name of group or single click on the
/
symbol to open/close the group.
The number of patients contained in the group is show to the right of the group name.
The group without any
/
symbol is empty.
The list of patients is alphabetically sorted alphabetically. The selected patient name is colored yellow.
The right part of the window represents the list of the ECG’s of the current patient, sorted by the date of observation.
All functional buttons are in the upper string of the window:
- ECG Registration
- Screening-Diagnostics
- Dynamic Observation and Forecast
- Variation Analysis of Heart Rhythms
- Neurodynamic Analysis
- Charting of Brain Biorhythms
- Fractal Analysis
- ECG-12 Registration
- Monitoring
- Biological Feedback
- help
- minimize
- close
50
12.2. Working with groups
The “Dinamika Medicine” system allows creating groups of patients. User can create any number of groups and
use them to store patients’ file unite by any common feature. Number of patients in one group is not limited
but too much patients in one group can reduce the speed of database response. It is recommended to store
less than 100 patients’ files in one group.
The following commands are used to operate groups:
1. Create new group;
2. Edit;
3. Delete;
4. Process;
5. Group Report;
6. Into archive / From archive;
7. Group from network;
12.2.1. Creating a new group
Right click on the “Card-Box” string in the left pane of the database window. Choose “Groups” -> “New” in the
pop-up menu.
Fill in the “Add new group” form and press “OK”.
The “Notes” field is optional.
New group will appear in the left pane of the database window.
51
12.2.2. Editing
Click right mouse button on the group’s name in the left pane of the database window to open a pop-up menu.
Choose “Groups” -> “Edit” to change group’s name and notes.
Fill in the “Editing Group Information” form and press “OK”.
12.2.3. Deleting
Click right mouse button on the group’s name in the left pane of the database window to open a pop-up menu.
Choose “Groups” -> “Delete”.
Confirm the operation by pressing “Yes” in the “Caution!” dialog.
Note! All operations listed above can be done using keyboard:
«Ins» - create new group, «Enter» - edit, «Del» - delete.
52
12.2.4. Processing
After observation of several users simultaneously in multi-channel mode of the ECG recording using the “CRAB”
system, the processing of a group is commonly used. Such processing allows preparing the data for the group
report.
Select the name of the imported group by clicking the left mouse button. Open the pop-up menu by clicking the
right mouse button. Then left-click the item “PROCESSING of group “…”.
After finishing of the processing all data will be available for any system analysis mode.
You can process the whole database by running this option over “Card-Box” in common.
This will process all records from the database, even records, processed earlier.
12.2.5. «Group Report»
The “Group report” is used to create tables containing the observation results of all patients of a group.
To run the report left-click to select the group name, right-click to open a pop-up menu and choose the item
“Group report <group name>”.
53
In the “Save As…” window choose the folder and the filename of the future report and press “Save”:
Please select the period of creating records for the report and press “OK”
The Excel 5.7 (*.xls) file will be created. This file will contain: patient’s name, birth date, record number,
record date, pulse rate, and indices of functional state for all patients of a group calculated upon the last record
of the selected period.
Note! To include information from all records into the report (not only the last one), please check the “All
Records” check-box.
54
12.2.6. “Into Archive / From Archive »
The “Into archive / From Archive” operations are used to store data or to transfer it to another PC.
To add a group to the archive please do the following: click right mouse button on the group’s name to open a
pop-up menu; choose “Group “…” to archive” to complete the operation.
The “New Archive” windows enter the name on new archive and in the “Path” field choose the folder where new
archive should reside. Press ”OK” to create new archive.
The default values of NAME and PATH are: “ARCH_<date>_<time>” and “C:\DINAMIKA MEDICINE2_Archive”.
You can split the archive into 1.44Mb volumes in order to copy it on 3.5’’ diskettes.
You can add the whole database to archive by running this option over “Card-Box” in common.
To extract the group from archive do the following: click left mouse button on the “Card-Box” string to open a
pop-up menu; choose “From archive” to complete the operation.
55
Select the folder containing the archive and press “OK”
12.2.7. Group from network
If there is another PC on the network on which “Dinamika Medicine” software is installed you can browse the
groups stored on this remote PC in the database window. To enable this opportunity you have to open the popup menu by right-clicking in the database window and switch on the “Enable network” item.
56
12.3. Working with patients’ files
The following commands are used to operate patients’ files:
1. Patient search;
2. Add new patient;
3. Edit patient’s data;
4. Copy/Move to other group;
5. Delete;
6. Processing;
7. “Into archive /From archive”;
12.3.1. Search Patient
To find a patient you can look through all groups or use a quick search by the name of a patient.
To see the list of all patients of a group just click on the symbol
on the group name. Look through the list to find a patient.
near the name of the group or double-click
To use a quick search just click in the database pane (left side of the window) and type the name of a patient.
Use Alt+Shift or Ctrl+Shift to switch between languages. Press and hold Shift for capital characters.
57
12.3.2. Adding new patient
To add new patient to a group do the following: click right mouse button on a group’s name to open a pop-up
menu; choose “Patients” -> “New”.
Fill in the “Adding New Patient” form.
Use “Tab” or “Shift+Tab” to switch between fields. Or use a mouse.
Fields “First Name”, “Second Name”, “Birth Date” and “Gender” are required.
Birth Date has to be entered in “DD.MM.YY” format (i.e. 17.01.45). You can also use a drop-down list.
To enter “Gender”, “City”, “Region”, "Group” please use drop-down list which are activated by
button.
Note: Our system allows importing a photo into the patient’s file. Double-click the square in the upper-right
corner of the form and choose the file with a picture. Picture should be in BMP, JPG or GIF format.
Click “OK” or press “Enter” when done.
58
You can also insert a patient’s photo into the observation card:
1. If there is a Web-cam attached to the PC, the picture from the Web-cam will appear in the image area of the
“Add new patient” window. Just click on this image to save it.
2. If there is no Web-cam attached to the PC you have to insert a photo from a file by double-clicking on the
image area (in the upper-right corner of the window). Then just browse for the file containing patient’s photo.
BMP, JPG and GIF formats are supported.
After filling in all required fields press “OK” and confirm entered information by pressing “Yes” in the dialog
window.
The string with the patient’s name will appear on the database pane.
59
12.3.3. Editing Data
Click right mouse button on a patient’s name to open a pop-up menu. Choose “Patients” -> “Edit”.
The window “Modify patient information” will appear.
Besides the “Individual card” of the patient this window contains six additional tabs:
Diagnoses
Observations tool
Advices of the experts
Out-patient observations
Computer observations
Conclusion
To switch to the desirable tab just click on its name.
60
12.3.4. Copying/Moving to other group
Click right mouse button on a patient’s name to open a pop-up menu. Choose “Patient -> “Copy” (or “Move”).
In the “Copy (Move)“ dialog choose the new group name and press “OK”.
If such name already exists in a new group, the following dialog will appear:
You can either add new records to existing patient or create a new patient with the name entered in the field
below.
Press “OK” when done.
61
12.3.5. Deleting
Click right mouse button on a patient’s name to open a pop-up menu. Choose “Patients” -> “Delete”.
Confirm the operation by pressing “Yes” in the “Caution!” dialog.
Note! All operations listed above can be done using keyboard:
«Ins» - create new group, «Enter» - edit, «Del» - delete.
12.3.6. PROCESSING
You have to implement the pre-processing of a patient’s records after importing the data from the archive. Select the patient by left-clicking on his name and open the pop-up menu with the right click. Choose the item
“PROCESSING Patient <patient name>”
After finishing of the processing all data will be available for any system analysis mode.
62
12.3.7. “Into Archive / From Archive”
The “Into archive / From Archive” operations are used to store data or to transfer it to another PC.
To add a group to the archive please do the following: click right mouse button on the patient’s name to open a
pop-up menu; choose “Patients “…” into archive” to complete the operation.
The “New Archive” windows enter the name of new archive and in the “Path” field choose the folder where new
archive should reside. Press ”OK” to create new archive.
The default values of NAME and PATH are: “ARCH_<date>_<time>” and “C:\DINAMIKA MEDICINE2_Archive”.
You can split the archive into 1.44Mb volumes in order to copy it on 3.5’’ diskettes.
To extract the patient from archive do the following: click left mouse button on the group string to open a popup menu; choose “From archive” to complete the operation.
Choose the folder that contains the desired archive file (C:\DINAMIKA MEDICINE2_Archive by default) and
press “OK”.
All operations listed above (copying, moving, deleting, processing, export/import, archive operations) can be
applied on several patients at once. All you need is to select several patients. Selecting multiple items can be
done by the following means:
- moving mouse pointer across the patients list with holding left mouse button pressed;
- clicking left mouse button with pressed “Ctrl” key on the keyboard;
- using cursor keys (↑ ↓ PgUp PgDn) with pressed “Shift” key.
Names of selected patients will be colored yellow.
63
12.4. Working with ECG Records
Click left mouse button to select patient’s name. The right pane of the database window will represent the list
of ECG registrations of the selected patient, sorted by the observation date (ascending).
The record string includes: number of a record, date and time of observation, duration of a record, number recorded of cardio cycles and number of artifacts. The “FS” column represents the level of functional state visually.
Comments are given in the right part of the string.
Records that were not processed are colored light-gray. These records have no “RR” and “FS” information and
can’t be analyzed by the system.
Incorrect records are colored red. These are too short records or records with too much noise. You have to delete these records or to edit them by the “ECG Editor” program.
12-leads records are colored green. Such records can be analyzed only by the “ECG-12 Analysis” program.
Records made by the “BOS Monitoring” program are colored magenta. These records have no source ECG signal
and can be analyzed only by the “Monitoring Analysis” program.
All other records are colored blue and can be processed by any kind of analysis.
Use cursor keys, PgUp, PgDn, Home, End key or mouse to navigate through the list of records. The selected
record is colored yellow. Press functional buttons in the upper string of the window to run the corresponding
analyzing method. The “Dynamical monitoring and Forecast” (the “DYN” button) analyzes all selected records.
To enter a comment – select a record and start entering a comment using keyboard.
Double-click or press “Enter” on a selected record to start the “Screening and Diagnostics” program.
Besides, running any kind of analyzing method is available from the pop-up menu (click right mouse button on
a record).
Use the “Del” key or “Delete” command from the pop-up menu to delete selected record.
64
13. ECG EDITOR
The “ECG Editor” program is intended for manual edition of the recorded ECG signal in case of too much noise
in the signal, too much artifacts or extrasyslies. This program allows placing R-peaks markers manually. It can
be started from the pop-up menu of the selected record.
The edition of the ECG record is as follow:
Click right mouse button on the part of rhythmogram colored red. The upper window will display the part of
ECG needed to be corrected.
Drag incorrect markers to the exact maximum on the nearest R-peak.
You can also add markers by pressing “Add Marker”, if required. Press “Delete Marker” to erase the incorrect
marker.
Move to the next “red” part of the rhythmogram and repeat the above operations.
You can use “Move Diagram” and “Scale” buttons.
Save the record and close the window when done.
65
14. COMPLEX PRINT
The “Complex print” program is intended for forming the complete observation card of a patient and printing
via any printing device.
Click left mouse button to select a patient in the left pane of the database window. The selected patient will be
colored yellow. If a patient has several records (in the right pane) select all of them in order to observe the dynamics of his indices. The observation card will be calculated according to the last record, but the dynamics
diagram will use all selected records.
Right-click over selected records and choose “Complex print”.
In the “Printing Settings” window press the “Auto All” button in order to form the report automatically. The report will contain all methods of analysis.
Different modes of analysis will appear on the screen sequentially. This process can take up to 2-3 minutes
(which depends on the hardware capabilities).
After completing the report “Print Server” window will appear.
66
Press “Zoom” button for preview.
Use menu “File” -> “Printer Settings” to configure printing parameters.
Turn the printer on and press “PRINTER” button. The device will start printing and you will see the following
window.
Please wait while printing the first page and move the paper from printer’s out box to inbox without inverting
the paper.
Click “OK” or hit “Enter” to print the second page.
You can also form the printing report manually by pressing sequentially icons of all required analysis methods.
Then press “Print” to send the report to the printer.
67
15. USEFUL FUNCTIONS
15.1. Search patient by name
You don’t have to look through all groups to find a person. Just use a quick
search by patient’s name (or by it’s part). See 12.3.1 “Search patient” for details.
15.2. Web-cam usage
If a PC has a Web-cam attached you can insert a patient’s photo into his individual card.
See 12.3.2 “Add new patient” for details.
15.3. Selective report
You can create a report for patients in a group containing basic indices of patient’s health for the selected period of time.
See 12.2.5 “Group Report” for details.
15.4. Network support
If other PCs on the network have “Dinamika Medicine” software installed there is
an opportunity to browse the group stored on remote PCs from the database window.
See 12.2.7 “Group from network” for details.
68
16. TROUBLESHOOTING
16.1. Problems with recording
The signal of the ECG record can be missing or can be displayed incorrectly because of one of the following reasons:
1. The selected device type is incorrect;
2. AC power noise;
3. Incorrect AC frequency is used;
16.1.1. The selected device type is incorrect
If a wrong device type is selected the signal looks like the following:
To solve this problem please double-click in the upper part “ECG Recording” window (in the caption area).
In the “Configuration” window select the device “OMEGA 7.1 PnP(USB)” and press OK.
69
16.1.2. AC power noise
If there are noises in power network the signal is as follows:
This problem occurs mostly when using a notebook plugged to an AC power. To solve the problem it’s recommended to unplug the notebook from the AC power supply and continue the ECG recording using notebook’s
built-in batteries.
Note: If the problem occurs while using a desktop PC it’s recommended to plug a PC through an AC
filter or an UPS.
16.1.3. Incorrect AC frequency is used
If the AC frequency is incorrect the signal is as follows:
To solve this problem please double-click in the upper part “ECG Recording” window (in the caption area).
In the “Configuration” window select the AC frequency 50 Hz (for Europe and Russia) and press “OK”
70
16.2. Database problems
If some patients or groups disappeared from your database you have to delete the file db.swp from the working
folder of Dinamika Medicine software (C:\Program Files\Dinamika\Dinamica.Medicine\ by default)
16.3. Security violation
If the software loads with the window “Security violation”:
That means that the software has been damaged or a hardware configuration has been changed.
To solve this problem you have to delete the License folder from the working folder of the software C:\Program
Files\Dinamika\Dinamica.Medicine\ and follow the instructions from 4.2 “Software registration”.
16.4. 3D-breath mode doesn’t work
To solve this problem you have turn on the 3D-breath mode. See 11 “Controlled respiration in the “biological
feed-back” mode” for details.
71
17. MULTI-CHANNEL SYSTEM “CRAB” FOR SIMULTANEOUS OBSERVATION OF 7 PATIENTS
The system “CRAB” based on “Dinamika Medicine” device is designed for ECG recordings of up to 7 patients
simultaneously.
17.1. Delivery package
ECG-recording module. “Omega-5.0 USB” ……………….…….……… 7 pcs.
Cardiograph electrodes Skintact F 9024 ……………………………… 14 pcs.
USB-hub D-Link (USB2.0) for 7 ports …………………………………..… 1 unit.
Medical bag …………….…………………………………………………………………. 2 шт.
17.2. PC hardware requirements
Recommended configuration
CPU
Celeron M 1,7 GHz
RAM
1024 Mb
Operation System
Windows XP? Windows Vista
72
17.3. Plugging “CRAB” system to a PC
1. Plug USB-hub D-Link to any free USB port in your PC.
2. Plug the first ECG-recording module «Omega-5.0 USB» to the first port in USB-hub D-Link.
3. Install USB-device drivers (see 17.3.1 «USB-device driver installation»).
4. After installation of the driver repeat the procedure described in items 3 and 4 for each six remained units of
registration of an electrocardiogram in ascending order of indexing
1
2
1
5. It is highly recommended to reboot a PC after drivers installation and check the “Device Manager” afterwards. Right-click on “My Computer” icon and select “Properties” in the pop-up menu. In the “System Properties” window switch to the tab “Hardware” and press the “Device Manager” button. Select “Ports (COM & LPT)
from the list of hardware
There should be 7 items named “USD Serial Port (COM)”. Make sure that all port numbers are unique and there
are no yellow questions or exclamation marks
73
17.3.1. USB-device driver installation
When ECG-recording module «Omega-5.0 USB» is plugged for the first time the new device will be found by
Windows and the “Add Hardware Wizard” will be started.
1. Select “Install from a specified location” and press “Next”
2. In the next window please deselect “Search on CD…” check-box and select “Search in the specified folder”.
Browse to the folder D:\Drivers\Omega5.drv and press “Next”
3. Press “Continue anyway” in the following warning window
4. Press “Finish”
74
6. After installing USB device drivers the new device “USB Serial Port” will be found by the system. The procedure of driver installation is the same as the above.
17.4. The “CRAB” system usage
17.4.1. Plugging the remote modules of ECG registration
Electrodes should be applied to patient’s wrists with the contact pads facing the inner side of the hand. The appropriate areas of patient’s skin should be vastly moistened with water or with physiologic saline. Patient can be
sitting or laying and should be in a calm position. An electrode with the red connector attached should be applied to the right hand. An electrode with the black connector attached should be applied to the left hand of a
patient.
Note: In some cases when the R-peak amplitude is too low, one electrode should be applied to the right wrist
and the other – to the left ankle, vastly moistened as well
Important notice! To reduce the noise during ECG recording it is necessary to follow the below
rules:
a) Patient’s hands should be still and relaxed. If a patient sits his hands should be placed over his lap. If a patient lays his hands should be placed along the body.
b) Unauthorized people should not walk within 1.5-2 meters around the patient.
с) During recording the ECG a patient has to be in a comfortable and relaxed state. A patient should NOT be
disturbed by any talking or by demonstrating him the computer display with the ECG recording.
17.4.2. ECG recording
1. Select the group of patients in the left pane of the database window by left-clicking (the name of the group
will be colored yellow). Press “REC” button to start recording ECG in multi-channel mode.
75
2. The window “Multi-channel ECG recording” will appear
3. Make sure that the ECG signal is stable for all patients before starting the recording process. R-peaks should
be well-marked with triangle marks. To achieve this you have to:
a) Choose a positive polarity of the ECG signal by pressing the button
Positive polarity
Negative polarity
b) Make sure that there are no noises and eliminate them if any discovered.
There can be several types of noises:
Some people are walking close to the patients – no one should walk in 1.5 – 2 meters distance from the patients
Patient is moving his hands – patient’s
hands should be relaxed and still.
Bad contact between an electrode and patient’s skin – moisten patient’s skin and
wash electrode’s contact pad.
There is no contact between electrodes and
a remote module. Check the connection cable.
Decoding file is missing. Copy the file Hardware.id from the CD folder D:\Dinamika
Medicine2.eng\Key\ into the working folder
of
the
software
C:\Program
Files\Dinamika\Dinamica.Medicine\.
76
Note: Sometimes, if an amplitude of the R-peak is low or if the contact between electrode and patient’s skin is
weak, the algorithm of R-peaks extraction can generate errors. It’s recommended to swap the electrode from
patient’s left wrist to his left foot - standard lead #2 (see 7.1.4.1 for details).
to open a drop-down list for selecting a patient’s name.
4. Click
Connection cables are numbered from 1 to 7 for easy detection which
channel is occupied by which patient.
Select patient’s name for each channel being recorded.
The record will not be saved for the channel with no patient selected.
5. To start recording all channels simultaneously press the button
in any window. The color of displayed signal will change
and the countdown of recorded cardio-intervals in each channel will start.
6. The quality of the recorded signal should be controlled periodically during the ECG recording process. In case
of noise in most of the channels simultaneously it’s recommended to stop recording by pressing the button
again. The recording will be stopped for all channels. Restart the recording after eliminating the
reasons of noise. If noise is detected only in some channels it’s recommended to wait until the end of recording
in other channels.
Duration of the recording is controlled according to the counter of RR-intervals (the
first number represents the total number of recorded intervals, the second number –
number of artifacts). Recording will be stopped automatically upon achieving of 300
clean RR-intervals.
7. Duration of recording may vary for different channels. Depending on the patient’s pulse rate it can take from
3 to 6 min to reach 300 cardio-intervals. After finishing the recording of the last channel the following window
will be displayed.
Press “Yes” to save recorded signals.
From the very beginning and to the end of recording process all patients should stay on their places
and should not disturb each other.
Caution!
If a patient has a fibrillation or pronounced extrasystole the estimation of functional indices will be
done incorrectly. Estimation of the functional state indices and the ECG processing in all modes can
be carried out only if a patient has no disorders of heart rate!
8. To close the “Multi-channel ECG recording” mode just press the button
.
77
17.4.3. Monitoring-recording
1. Select a group of patients in the left pane of the database windows. (The name of the group will be colored
yellow). Press the button “MON” to start multi-channel monitoring of the ECG.
2. The window “Multi-channel monitoring” will appear.
Click
, to open a drop-down list for selecting a patient’s name. Connection cables are numbered from 1 to 7 for easy detection which channel is
occupied by which patient.
Select patient’s name for each channel being recorded.
The record will not be saved for the channel with no patient selected.
3. To start recording all channels simultaneously press the button
.
4. To pause the recording press
5. To stop recording press
once more. Recording will be stopped for all channels.