1
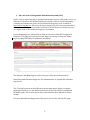
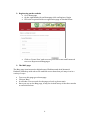
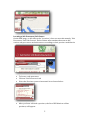
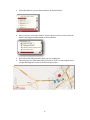
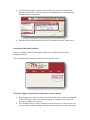
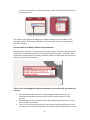
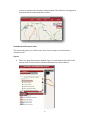
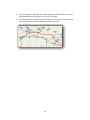
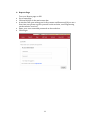
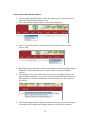
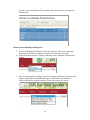
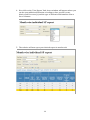
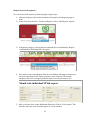
GIS for Salt Sector of Pakistan User Manual July 2013 1 Contents 1. An Overview of GIS Website 2. Registering on the website 3. The Map Page a. Locating a Salt Processor/Salt Source b. Function of the handy toolbox i. First Tab: Toggle salt processor/salt source overlay ii. Second tab: View Edible Iodized Salt Production iii. Third Tab: Calculating the distance between two or more salt processors or sources iv. Fourth Tab: View Full screen c. Layers 4. The Reports page a. How to access Baseline Reports b. How to access Monthly USI Reports c. How to access Lab reports 2 1. An overview of Geographic Information System (GIS) With a view to harnessing the Geographic Information System (GIS) to the service of Pakistan’s USI effort, the MI Pakistan has developed a website and all information related to the Pakistan salt sector and USI Pakistan Program is now available at http://pakusi.naqsha.net. Salt sector inventory prepared in 2010 has been uploaded to the system so that it can pinpoint the locations of all Salt Sources & Salt Processors on a digital map of the country through geo coordinates. On the homepage you will be able to find an overview of the USI Program in Pakistan. The page has exactly six items listed on the top, which are, Home, Reports, Map, Edit Data, User Manual and About. The Reports and Map Pages are the ones you will be most interested in. Data Entry and Edit Data Pages are for administrator to upload and edit data reports etc. The Tutorial, present as the fifth item on the main menu, helps you better understand how to use the different features of the GIS website on MAP and REPORT pages. The section has a video tutorial and a User Manual in Word format. For more detailed briefing on the GIS project, browse the ’About GIS’ page. .. 3 2. Registering on the website Go to Homepage On the right hand side on Homepage click on Register/Login Fill in the required fields on registration page as shown below: Click on ‘Create User’ and now use your User name and Password to access Reports and Map pages. 3. The MAP page The Map page isan interactive digital map of Pakistan and Azad Jammu & Kashmir-loaded up with salt sector and salt source data that you may view in a variety of ways. To access this page go to homepage Click on ‘Map’ It will take a few seconds for the page to load, so please wait. Once you are on the Map page, it may be viewed in any of the three modes as encircled below: 4 Locating a Salt Processor/Salt Source On the MAP page, on left side under ‘Locations’, there are two tabs namely, ‘Salt Processors’ and ‘Salt Sources’. Each of these tabs contains shortcuts to the various salt processors and salt sources according to their province and district. To locate a salt processor: Click on ‘Salt Processors’ tab Select the Province you are interested in as shown below: After you have selected a province, the list of USI districts of that province, will appear. 5 Select the district you are interested in, as shown below: Once you have selected a district, all the salt processors of the selected district will appear underneath as shown below: Now select the salt processor that you are looking for. The map on your right hand side performs a ‘fly to’ to that region and a red pin ball appears on the selected salt processor. 6 Click on that red ball, a small window will open up with multiple tabs, providing all details of the salt producer including his contact details as shown in the picture below. Follow the same directions as above if you want to locate a ‘Salt Source’. Function of the handy toolbox There is a handy toolbox in the upper right corner underneath the main navigation menu. The toolbox has four buttons as shown in the picture below: First tab: Toggle salt processor/salt source count overlay Based upon your selection in the ‘Locations’ and ‘Layers’ tabs, the first tab in the tool box provides you with the range of salt processors and salt sources around your selection For example, after you have selected a salt processor or a salt source, and you are interested in finding out about the total number of salt processors 7 or sources around your selected category, click on this tab in the tool box as shown below: The colour of the page will change according to the key as shown above. For example a pink colour means that there are 1-10 salt processors around your selected category. Second Tab:View edible/iodized salt production Similarly after you have selected a salt processor under Location’s tab, and if you click on the second tab in the tool box, it will tell you about the ‘ monthly edible and iodized salt production of that particular district to which the salt processor belongs as shown in the picture: Third Tab: Calculating the distance between two or more salt processors or sources The third tab in the tool box is a measuring tool that allows you to calculate the distance between two or more salt processors or salt sources. By pressing this tab you will activate the measuring tool between two or more points on the map. Once you’ve selected this tab you can click on any desired salt processor or salt source on the map and then click on the other salt processor or salt 8 source to measure the distance between them. The distance will appear in a small window underneath the toolbox. Fourth tab: Full screen view The fourth tab gives you a full-screen view. Press escape to return back to normal screen. Layers There is a drop down menu named ‘Layers’ on the bottom left side of the screen with six check boxes listed underneath it as shown below: 9 By checking/un-checking any of the boxes you will be able to control what information you want to see on the GIS map. For example if you only select Salt Processor, the map as shown below would only show that information and hide the rest. 10 4. Reports Page To access Report page on GIS: Go to homepage Click on Reports in the main menu bar A window will open asking you for User name and Password (If you are a first time user please register yourself on the website, read ‘Registering on the website’ section) Enter your user name and password as shown below: Click Login 11 How to access the Baseline Report 1. To access the Baseline Reports, Click the ‘Reports’ tab on the menu bar and wait for the Reports page to load. 2. Select the Baseline Report option in the first drop down. 3. In the second drop down select between Salt Processor Data or Salt Source data. 4. Based upon your selection of the second drop down, the third drop down window i.e. Report allows you to choose from a variety of available reports 5. For example, if you select Salt Processor Data in second drop down, the third drop down allows you to select from , Dynamic Baseline Production Data, District or Zonal Level Baseline Production data etc. Select the one you desire. 6. Click on the ‘Open Report’ link, the website will open your desired report in another tab. A window will appear where you can select duration, 12 province, zone and district. The website will open your desired report in another tab How to access Monthly USI Reports? 1. To access Monthly USI Reports, Click the ‘Reports’ tab on the menu bar and wait for the Reports page to load. Please wait a few seconds. 2. In the first drop down i.e. ‘Nature of Report’ select ‘Monthly USI Reports’ option. 3. The second drop down will give you four options, Month wise Dynamic SP Report, Month Wise Individual SP report and Zonal Level Iodization report and District Logistics Report. Select the report you desire. 13 4. Now click on the ‘View Report’ link, A new window will appear where you can do some additional filtration according to date, province, zone, district, Salt Processor(s) and the type of Iodization information from a list of columns. 5. The website will now open your desired report in another tab. 14 How to access ‘Lab reports’? You can access Lab reports by following the simple steps. 1. Click the ‘Reports’ tab on the menu bar and wait for the Reports page to load. 2. In the first drop down i.e. ‘Nature of Report’, Select ‘Lab Reports’ option. 3. In Reports Category, choose between Month Wise Lab Summary Report or Month Wise Individual SP Lab report 4. Now click on the ‘Open Report’ link, A new window will appear where you can select the date of the report, province, zone, district, salt sample category, salt source category and the type of result you want to see. 5. After you have done some additional filtration, Click on “view report” The website will open your desired report in a new window. 15