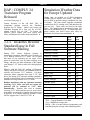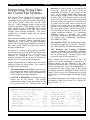
1
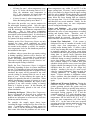
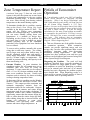
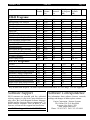
NEWS-II CARRIER SOFTWARE SYSTEMS Vol 14, No 3 SUMMER, 1995 In This Issue: News: Carrier Software Begins Migration to Windows .....................................................................................3 Two Classes Added to Basic Training Schedule .........................................................................................3 HAP / COMPLY 24 Translator Program Released.....................................................................................3 3-1/2” Diskettes Become Standard Issue in Fall Software Mailing ............................................................4 Simulation Weather Data for Europe Updated...........................................................................................4 Software: Interpreting Sizing Data for Cycled Fan Systems .......................................................................................5 Using the Zone Temperature Report to Troubleshoot Simulations..............................................................6 Pitfalls of Economizer Operation...............................................................................................................8 Configuring E20-II for Windows ..........................................................................................................10 Carrier Promotes Interoperability Carrier Corporation recently announced its participation in the Industry Alliance for Interoperability (“IAI”). This article will explain what the Alliance is and what it is trying to accomplish. INTEROPERABILITY - WHAT IS IT? Today’s building construction industry is a highly fragmented beast. This is reflected in the computer tools that various segments of the industry use. These tools are highly specialized to the task at hand, and do a terrible job of sharing information with other computer tools in the overall building design, construction, and operation process. Some computer software vendors have tried to address this by creating integrated “suites” of programs that know how to share their data. These suites have met with limited success for numerous reasons - the breadth of applications is limited, some of the applications are “weak sisters”, and the building industry is fragmented across individual companies, limiting the usefulness of the suite concept. The Industry Alliance for Interoperability (“IAI”) wants to address this problem by defining an underlying data standard that all software manufacturers can agree to. The key to making this happen is a relatively new technology known as object-oriented databases. This technology has a key feature that allows the creation of a “foundation-level” of data storage that individual software applications can extend for their own purposes. This allows separate software applications to share data at the foundation-level and still be able to manage their own specific data. What the IAI is striving for is the ability to pick and choose individual software applications from different vendors, while retaining the ability to share data among these varied applications. In the real world of many different companies using many different applications from many different vendors, this vision of “interoperable applications” is the only way to truly realize the productivity gains inherent in improved communications between all the partners in the building process. WHAT IS IAI TRYING TO ACCOMPLISH? Basically, the Industry Alliance for Interoperability has set 3 goals that are necessary on the road to interoperability. (continued on page 2) Copyright 1995 Carrier Corporation Page 1 Printed on Recycled Paper Page 2 NEWS-II Carrier Promotes Interoperability (continued from page 1) The first was to produce a prototype suite of demonstration software using the object technology. This suite has been completed and was demonstrated at the A/E/C SYSTEMS show in Atlanta in June. The purpose of the suite was to demonstrate the potential of the technology so as to interest both end-users and software developers in the concept of interoperability, thereby building the momentum necessary for the concept to succeed. Videos of the demonstration software will soon be available for viewing at your local Carrier sales office. The second goal is to produce a first draft definition of the data standards. This definition has been named the “Industry Foundation Classes” (“IFC”) and version 1.0 is slated to be available early in 1996. The IFC definitions and source code will be made available to any and all software developers, virtually as public domain software, in the hopes of encouraging the interoperability concept. The third goal is to establish an on-going, open association for the further development and promotion of interoperability and the IFC’s. This organization is the successor to the IAI, and has recently been incorporated under the name The IFC Association. The IFC Association will serve as a clearinghouse for revisions to the data definitions, as well as the central promoter of the interoperability concept. The initial organizational meeting will be held on August 21, at which technical committees will be set up on a discipline by discipline basis. INTEROPERABILITY: AN EXAMPLE So what does all this ultimately mean to the mechanical designer? Mainly this - better information flow with the your partners in the building design process. For instance, an architect may decide to use Intergraph to produce the plans for a project. Under interoperability, a mechanical designer could access and update the geometrical data in those plans using AutoCAD and various AutoCAD compatible tools. So, for instance, a duct layout tool would know about geometrical constraints and perform interference checking, without having to re-input the building geometry. A load-estimating program could extract geometric and materials data, without requiring that the architect enter the information in a specific format. Design information can then be passed directly, electronically, to the construction contractors and building owners. This information Summer, 1995 will be directly accessible for the computer tools that the contractors and owners use. For instance, let’s look at the specific case of an air handler. The architect has passed the mechanical designer a drawing database that includes a certain amount of space designated as a mechanical room. The designer’s software recognizes this space as such, and assists in placing an appropriately sized air handler in this room. Manufacturer’s software assists in creating a performance specification for the air handler, with specification text and performance criteria embedded in the electronic database. Other software components (of the designer’s choosing) assist in making connections to the ductwork, piping, plumbing, electrical, and control systems. Mechanical contractors bidding on the job can access the database with their estimating software to quickly and accurately estimate a price for the air handler. Once a specific air handler has been purchased, detailed installation information will be available from the database during the construction phase. Operating and servicing information will also be available electronically, so that facilities management software can be employed without a tremendous amount of data input. Of course, the scenario described above is still some way off, and the software described is not going to be written by the IFC Association. However, if the industry is ever going to see the sort of data sharing described above, the Industry Foundation Classes or a similar approach will be required. The trick is to define the underlying data structures so vendors can profitably write software that takes advantage of it. HOW CAN I FIND OUT MORE? In the next month or so, your local Carrier sales office will be receiving more information to share with you on Interoperability. This will include a videos that go into greater depth on the topic of interoperability, and demonstrate the prototypes exhibited at the A/E/C SYSTEMS show. You can contact your local sales office to view these videos. If you are interested in joining the IFC Association and helping define the Industry Foundation Classes, please contact the Association’s executive director: Mr. Ken Herold Executive Director, IFC Association Phone: 800-798-3375 or 314-692-2002 Fax: 314-432-3130 Internet: [email protected] Information both on the IFC Association and how you can participate in it are available. ♦ Summer, 1995 NEWS-II Page 3 Carrier Software Begins Migration to Windows Two Classes Added to Basic Training Schedule As reported in earlier issues of NEWS-II, Carrier Software Systems has begun the task of migrating the E20-II and Electronic Catalog programs to the Microsoft Windows operating environment. This article will give you an update on the status of this work, along with a glimpse of future directions. Two dates have been added to extend the E20-II Basic Training Class schedule through November. These classes will be held in Chicago and Honolulu. Dates are shown in the table below. The first of the E20-II programs being migrated to Windows is the Block Load program. Earlier NEWS-II articles gave some highlights of this new program, along with some unfortunately optimistic delivery dates. We’re happy to report that development is back on track. Block Load for Windows is currently in beta testing, and it will be distributed in the fall of 1995. We’re sure it will be worth the wait! If you currently license Block Load, you will receive the Block Load for Windows upgrade automatically. If you are not using the Windows operating environment, and wish to continue licensing the DOS version of Block Load, a right-touse renewal will be available for $10/year. All new Block Load licenses will be for the Windows version of the program. In addition to Block Load for Windows, Software Systems is also about to release the first of the Electronic Catalog for Windows programs. Advance release versions of the Commercial Split Systems and Rooftop Package Unit selection programs are currently being tested in Carrier’s sales offices, and will be included in the fall software mailing to E20-II licensees. These programs will replace their existing DOS counterparts, and set the stage for later migration of other E-CAT programs to the Windows operating environment. Looking beyond these immediate releases, Software Systems will continue the migration of E20-II and E-CAT programs to the Windows environment. Work has already begun on the Hourly Analysis Program, as well as the Packaged Chiller selection program. These and other E20-II and E-CAT programs will be released as replacements for their DOS predecessors as they are completed. ♦ For each city, separate classes will be offered for HAP v3.1, Block Load v2.1 and Duct Design v3.2. The HAP session is a full day class with an enrollment fee of $150 per person. This fee includes lunch. The Block Load and Duct Design sessions are half-day classes with an enrollment fee of $75 per person. Lunch is not included in this fee. For further information on the classes, please contact Software Systems at 315-432-6838. A complete training schedule for Fall 1995 through Summer 1996 was being arranged as this newsletter went to press. Full details about this schedule will be reported in the Fall issue of NEWS-II. ♦ City HAP Block Load Duct Design Chicago, IL Oct 25 Oct 26 Oct 26 Honolulu, HI Nov 14 Nov 15 Nov 15 HAP / COMPLY 24 Translator Program Released The HAP / COMPLY 24 Translator Program, discussed in previous issues of NEWS-II, was completed and released to customers in August. This program is used to electronically transfer data from HAP to the COMPLY 24 program. COMPLY 24 is used to demonstrate compliance with the California Building Energy Efficiency Standards, better known as Title 24. COMPLY 24 is produced and marketed by Gabel Dodd Associates of Berkeley, California, and is currently the only program approved by the California Energy Commission for demonstrating compliance via the performance path. The HAP / COMPLY 24 data translation software serves as a labor saving tool for engineers using HAP to design systems and using COMPLY 24 to perform compliance calculations. (continued on page 4) Page 4 NEWS-II HAP / COMPLY 24 Translator Program Released (continued from page 3) Current licensees of the old HAP Title 24 Compliance package received the Translator Program free of charge. Others may license the Translator Program for a first year fee of $395. Annual renewal fees are $80. To license the software, please contact your local Carrier sales office or distributor for license forms and details. ♦ Summer, 1995 Simulation Weather Data for Europe Updated During June, an updated set of HAP simulation weather data for Europe was issued. This data is used in HAP to perform energy simulations for sites in Europe. The data release upgrades simulation weather data for 19 existing cities, and adds data for one new city. These cities are listed in the table below. The updated data is designated version 3.01 and can be purchased for $10. To obtain this data, please contact your local Carrier sales office or distributor for license forms and details. ♦ City Name New Data Old Data 3-1/2” Diskettes Become Standard Issue in Fall Software Mailing Brussels, Belgium TRY Avg Helsinki, Finland TRY Avg Berlin, Germany TRY Avg Frankfurt, Germany TRY Avg During 1995, Carrier Software Systems is encouraging customers who still receive software on 5-1/4” disks to switch to 3-1/2” disks. We’ve found that many of our customers are not aware of the option to switch disk sizes for future mailings at no charge, and have not taken advantage of this option even though 3-1/2” disks would serve their purposes better. Hamburg, Germany TRY Avg Hannover, Germany TRY Avg Heidelberg, Germany *NEW* TRY - Munich, Germany TRY Avg Stuttgart, Germany TRY Avg Athens, Greece TRY Avg Milan, Italy TRY Avg Naples, Italy TRY Avg Rome, Italy TRY Avg Lisbon, Portugal TRY Avg Alicante, Spain Mixed Avg Barcelona, Spain Mixed Avg Bilbao, Spain Mixed Avg Madrid, Spain Mixed Avg Sevilla, Spain Mixed Avg Effective with the Fall 1995 mailing of Electronic Catalog and E20-II software, the standard media for software will become 3-1/2” diskettes. For those customers whose computers have only 5-1/4” disk drives, the Spring 1995 software mailing contained a prepaid postcard which allowed customers to elect to continue receiving software on 5-1/4” disks. Readers should note that any customer currently receiving 5-1/4” disks who did not return the postcard will be switched to 3-1/2” disks automatically. Readers who wish to continue receiving 5-1/4” disks and have not yet sent in their postcard are encouraged to send the postcard as soon as possible, or to contact Software Systems via the toll-free support line (1-800-253-1794). ♦ Valencia, Spain Mixed Avg Key: TRY = Typical Reference Year data. Avg = Simplified Average data. Mixed = Mix of actual observed temperature and humidity data plus average solar radiation profiles. Summer, 1995 NEWS-II must not be used for sizing or selecting the fan or the coil. However, this value is useful for determining the degree of fan cycling for the hour. In the sample output shown below the ratio of hourly average CFM (1760) to maximum possible CFM (1912) indicates the fan is cycled on for 92% of the hour for September 1400 when the peak cooling coil load occurs. When the fan is cycled on for less than 100% of the peak coil load hour, it is usually due to two things. First, the time of the peak zone load can differ from the time of the peak coil load. Second, fan air flow is sized assuming the room is kept precisely at the cooling thermostat setpoint. If a thermostat throttling range is specified, the room temperature will float in this throttling range and can slightly reduce conditioning requirements, thus leading to cycling. Interpreting Sizing Data for Cycled Fan Systems HAP and the System Design Load Program permit fan cycling to be considered in system design calculations for five types of air systems: Single Zone CAV, PTAC, WSHP, 4-Pipe Fan Coil and 2-Pipe Fan Coil. When designing systems which use fan cycling to modulate cooling during occupied system times, designers need to understand what various sizing values represent so the data can be used correctly when selecting equipment. This article explains how to interpret sizing data for systems using fan cycling. Most central air handling systems use continuous fan operation for occupied system operating hours. Consequently, sizing results represent continuous airflow and coil temperature conditions for the entire hour when a peak cooling coil load occurs and are therefore unambiguous. In contrast, in a system using cycled fan operation, the fan and coil may cycle on and off during the hour when a peak coil load occurs. As a result, it is important to distinguish which sizing results represent conditions for the portion of the hour the fan and coil were cycled on and which do not. Sample sizing results for a Single Zone CAV system using fan cycling are shown below. Key values in this table are discussed below: • Total and Sensible Coil Load represent the rate of cooling for the portion of the hour the coil and fan are cycled on. These values may therefore be used to select equipment components. • Coil CFM at Month/Hour is the hourly average airflow rate for the system. The average considers the portions of the hour when the fan was cycled on and off. Therefore, this value Page 5 • Max Possible CFM is the instantaneous airflow rate when the supply fan is cycled on. Therefore, this value should be used when selecting the coil. • Coil Entering and Leaving Conditions represent temperature and humidity conditions for the coil for only that part of the hour when the coil and fan are on. Therefore, these values can also be used for selecting the coil. When working with PTAC, WSHP or Fan Coil systems, coil sizing information is presented in a different format, but still conforms to the same conventions discussed above. The only exception is that an average hourly “Coil CFM at Month/Hour” is not provided for these system types so the cycling percentage cannot be determined directly from the output. However, the coil CFM needed for fan and coil selection is provided under the heading “design CFM”. For further information on this subject, please refer to Chapter 9 of the Design Load User’s Manual for HAP and SDL. ♦ CENTRAL COOLING COIL SIZING DATA ------------------------------------------------------------------------Total coil load (Tons)....: 4.1 Load occurs at....: Sep 1400 Sensible coil load (Tons).: 3.6 OA DB/RH (F/%)....: 87.4/ 44.8 Coil CFM at Sep 1400......: 1760 Entering Db/Wb....: 77.4/ 63.4 F Max possible CFM..........: 1912 Leaving Db/Wb.....: 54.3/ 53.6 F Design supply temp (F)....: 55.0 Coil ADP..........: 53.0 F sqft/Ton..................: 550.8 Bypass factor.....: 0.055 BTU/hr/sqft...............: 21.8 Resulting RH......: 46 % Water gpm @ 10F rise......: 9.81 Zone T-stat Check.: 1 of 1 OK ------------------------------------------------------------------------- Page 6 NEWS-II Using the Zone Temperature Report to Troubleshoot Simulations During air system simulations in a HAP energy analysis, the program continually checks zone temperature levels against thermostat specifications. When zone temperatures fall outside the cooling or heating thermostat throttling ranges, HAP reports these conditions on a special printout titled Zone Temperature Report. This article discusses the contents of the Zone Temperature Report and how to use the report to troubleshoot problems with the system simulation. Report Content. A sample Zone Temperature Report is shown below. In this report, columns contain temperature statistics for each zone served by the system. Rows in the report contain different types of statistics. Together the statistics provide a concise summary of the number of operating hours falling in different temperature ranges. Using data for zone 1 as an example, the following statistics are provided for the occupied system operating times: • • Maximum Zone Temperature is the warmest temperature occurring in the zone. For zone 1 the warmest temperature was 78.2 F. Cooling Setpoint + Throttling Range lists the Summer, 1995 upper limit of the cooling thermostat throttling range. In the example an occupied cooling thermostat setpoint of 75 F and a throttling range of 2 F were used. Therefore the upper cooling limit is 77 F. • Heating Setpoint - Throttling Range lists the lower limit of the heating thermostat throttling range. In the example an occupied heating thermostat setpoint of 70 F and a throttling range of 2 F were used. Therefore the lower heating limit is 68 F. • Minimum Zone Temperature lists the coldest temperature which occurs. For zone 1 this was 64.1 F. • Hours Above, Below, Within Operating Range list the hours when the zone temperatures were in various ranges relative to the upper cooling limit and lower heating limit. For example, there were: • • • 3571 hours for zone 1 in the comfort range between 77 F and 68 F. 116 hours for zone 1 when the temperature exceeded the cooling limit of 77 F by up to 5 F. Since the maximum zone temperature is 78.2 F, this represents 116 hours between 77 F and 78.2 F. 0 hours for zone 1 when temperatures exceeded the cooling limit by more than 5 F. ZONE TEMPERATURE REPORT FOR AIR SYSTEM SIMULATION System: Sample VAV/RH System 07-25-95 HAP v3.12 Page 1 ************************************************************************** -------------------------------------------------------------------------Zones >>> 1 2 3 4 5 -------------------------------------------------------------------------Occupied Period: Maximum Zone Temp. (F)........ 78.2 79.2 77.2 77.6 76.8 Hours > 5.0 F Above Op. Range. 0 0 0 0 0 Hours 0 to 5.0 F Above Op Rng. 116 142 6 12 0 Clg Setpt + Throt. Range (F).. 77.0 77.0 77.0 77.0 77.0 Hours Within Operating Range.. 3571 3561 3726 3688 3756 Htg Setpt - Throt. Range (F).. 68.0 68.0 68.0 68.0 68.0 Hours 0 to 5.0 F Below Op Rng. 69 53 24 56 0 Hours > 5.0 F Below Op. Range. 0 0 0 0 0 Minimum Zone Temp. (F)........ 64.1 64.4 65.2 64.5 71.7 Unoccupied Period: Maximum Zone Temp. (F)........ 83.8 85.0 84.4 85.0 80.2 Clg Setpt + Throt. Range (F).. 87.0 87.0 87.0 87.0 87.0 Htg Setpt - Throt. Range (F).. 58.0 58.0 58.0 58.0 58.0 Minimum Zone Temp. (F)........ 58.9 58.9 59.1 59.0 70.0 -------------------------------------------------------------------------- Summer, 1995 NEWS-II • 69 hours for zone 1 when temperatures were up to 5 F below the heating limit of 68 F. Since the minimum zone temperature is 64.1 F, this represents 69 hours when the temperature is between 68 F and 64.1 F. • 0 hours for zone 1 when temperatures were below the heating limit by more than 5 F. The report also provides very concise statistics for the unoccupied operating period. Only the upper cooling and lower heating limits are listed together with the maximum and minimum temperatures for each zone. This is done since maintaining conditioning requirements is usually not as critical for unoccupied system operating times. It is also done to keep the report to a reasonable length, particularly for systems with large numbers of zones. Statistics on the Zone Temperature Report are only reported for times when conditions are being controlled. For example, if cooling is shut down for one month in the summer (a school, for example), zone temperature levels for this shutdown period are not included in the report. Zone temperatures stay within 1.2 and 2.2 F of the upper cooling limit. For zones 3 and 4, temperatures stray a few tenths of a degree from the upper cooling limit for only a handful of hours during the year and thus are not significant. For heating, the number of hours below the lower heating limit are relatively few, but range from 3.5 to 4.9 F colder than this limit and therefore may merit attention. Finally, for the unoccupied system times, no zone temperatures exceed cooling and heating limits. Causes and Solutions. Air system simulation outputs do not provide sufficient data to directly determine the cause of zone temperatures exceeding cooling and heating limits. Therefore, work is required to infer causes and determine how the problems should be corrected. The most common causes and their solutions are described below. • System Was Undersized. If the system is undersized, for any of a number of reasons, it will usually cause zone temperatures to exceed cooling and/or heating limits. If airflow, reheat coil or zone heating unit capacity data was edited to manually undersize the system, rerun sizing calculations and either use the program calculated sizing data, or specify larger capacities than originally used. The other possibility is that load conditions during an energy simulation are more severe than during system design calculations. One common culprit is an internal heat gain schedule which specifies more severe heat gains (higher schedule percentages) for the typical day schedules than are used for the design day schedule. Another is the use of a more severe value for “typical infiltration” than was used for “cooling infiltration” or “heating infiltration” inputs. If these schedule or infiltration values cause a problem, this data should be corrected and the system should be sized and simulated again. • Pulldown and Warm-up Problems. During the transition between unoccupied and occupied system operating periods, the system may not have sufficient capacity to quickly bring zones to their new setpoints. For example, suppose the unoccupied cooling setpoint is 85 F and the occupied setpoint is 75 F with a throttling range of 2 F. During the unoccupied period the zone temperatures will be held in the 85 F to 87 F range, or zone temperatures will float freely below 85 F. At the start of the next occupied operating period, the system must lower the zone temperature to the 75 F to 77 F range. If sufficient capacity (continued on page 8) In addition, when a system does not contain cooling or heating capability, statistics will be listed as “na” for “not applicable”. For example, for a cooling-only system, all heating statistics will be listed as “na”. Unoccupied cooling statistics are also listed as “na” when unoccupied cooling is disabled. Finally, the Zone Temperature Report is triggered differently depending on how air system simulations are run. If a simulation is being run using options on the Air System Menu and only one air system is being simulated, the report will be generated if any zone exceeds cooling or heating limits for one or more hours of year. In this situation, the report can be displayed or printed at the end of a simulation. When running simulations for groups of systems or as part of a plant or building simulation, the report is only generated if any zone exceeds cooling or heating limits by 5 degrees or more. In this situation, the report is automatically printed at the end of the system simulation. Evaluating the Report. When a Zone Temperature Report is generated, the first task is to evaluate the data to determine its severity and frequency. If problems are infrequent or are not severe, corrective action may not be necessary. For example, the sample report shows hours exceeding the upper cooling limit for four of the five zones. A significant number of hours appear for zones 1 and 2, but the maximum temperatures for these zones show that the problems are not severe. Page 7 Page 8 NEWS-II Zone Temperature Report (continued from page 7) does not exist in the system, it may take the system one or more hours to bring zone temperatures to the new cooling thermostat operating range. A similar situation can occur when moving from heating setback temperatures to the normal heating setpoint. To determine whether this is a problem, examine data on the Hourly Zone Design Day Loads available in the design portion of HAP. This output will list 24-hour zone temperature histories for cooling design days. From this data you can assess whether pulling down zone temperatures is a problem on design days. Depending on the severity of the problem, this may imply that it is also a problem on typical summer operating days in the simulation, particularly after equipment has been shutdown over a weekend. To correct such a problem, manually edit system sizing data to add extra capacity. For cooling, specify larger zone and system airflow rates, or use the calculated airflow rates and specify a colder supply temperature. For central heating, specify a warmer supply air temperature. For terminal or perimeter heating, add capacity to the these zone heating coils. • Extreme Weather. In some situations, the simulation weather file will contain more severe conditions than were used for sizing the equipment. To some extent this is to be expected since a 1% or 99% design condition means that more severe conditions can exist. Usually such situations result in relatively few hours exceeding cooling or heating temperature limits. To determine if this is a problem, use the Weather Menu to generate the Simulation Weather Data Summary. This output provides maximum and minimum temperature statistics from the simulation weather file for each month. Compare this data with the summer and winter design temperatures used for your sizing calculations. If simulation weather data contains temperatures significantly warmer than the summer design drybulb or colder than the winter design dry-bulb, either editing sizing data to increase airflow and heating coil capacities, or rerun sizing calculations after specifying more extreme summer and winter design temperatures. ♦ Summer, 1995 Pitfalls of Economizer Operation Q. I am designing a single zone CAV air handling system which includes an integrated dry-bulb economizer. When I run design calculations with HAP I find athat the peak cooling coil load listed on the Air System Sizing Summary is 23.2 Tons. Further, it occurs at the peculiar time of July 0900. I also notice that an unusually large portion of this coil load is latent cooling. If I run the design calculations for the same system without an outdoor air economizer, the peak load is 17.0 Tons, it occurs at July 1500 and it has a more reasonable sensible heat ratio. This indicates that an economizer increases rather than decreases the load which is illogical. What is happening here? A. This case illustrates one of the pitfalls of outdoor air economizer operation. While economizer controls can provide significant energy and cost savings, they can also cause problems under certain conditions, increasing rather than decreasing mechanical cooling requirements. This article explains how these problems occur and how such problems can be diagnosed and corrected using HAP or the System Design Load Program. Diagnosing the Problem. The peak coil load conditions described above represent snapshots of system operation for single points in time. While such snapshots are useful for identifying a problem, such as an unusual peak load time or an unusual sensible heat ratio, diagnosing the problem requires more detailed data. When diagnosing results it is often useful to generate 24-hour profiles of data to gain a broader view of operating behavior. Summer, 1995 NEWS-II Figure 1 shows the 24-hour cooling coil load profiles for the system in this case study with and without an economizer. Data in the graph was obtained from the Hourly Air System Design Day Loads output. Figure 2 shows the 24-hour dry-bulb and wet-bulb profiles for the July design day. This data is for Chicago and was obtained from the Cooling Design Temperature Profiles output. In addition, the following outputs will be required to provide supporting data for our investigation: • • Air System Design Load Summary for July 0900. Hourly Zone Design Day Loads for July Figure 1 shows that the system with the economizer experiences an odd increase in cooling loads for 0700, 0800 and 0900. For the remainder of the day, coil loads for the systems with and without economizer have identical values. Page 9 the fully open position since it cannot eliminate mechanical cooling completely for this operating condition. While this will reduce the sensible cooling coil load by using outdoor air that is slightly cooler than return air, it introduces a large volume of outdoor air with a high moisture content. As a result the latent component of the cooling coil load soars. The increase in the latent load outweighs the reduction in the sensible coil load, and the ultimate result is a large increase in the total coil load. This case illustrates the fact that at marginal conditions in which the outdoor air dry-bulb is only slightly cooler than the return air temperature, and outdoor air is relatively humid, integrated dry-bulb economizer control can increase rather than decrease system cooling coil loads. This case also illustrates one of the benefits of the system-based design approach used by HAP and the System Design Load Program. By considering specific components and controls in the design calculation, potential problems can be identified while the system is being designed. Correcting the Problem. solutions to this problem: To determine the cause of this behavior, let’s focus on system behavior for 0900. The Air System Design Load Summary for the system with economizer shows that the ventilation and supply airflow rates are equal for this hour. Therefore, the outdoor air economizer is operating and is fully open. The Hourly Zone Design Day Loads output shows that the zone air is at 77.7 F and 44% RH for 0900. Using plenum load data from the Air System Design Load Summary the return air condition (after the plenum) can be computed. The return air condition is 80.2 F dry-bulb, 63.7 F wet-bulb for a specific humidity of 0.0091 lb/lb. The outdoor air condition for this hour is 79.8 F dry-bulb, 70.0 F wet-bulb for a specific humidity of 0.0138 lb/lb. An integrated dry-bulb economizer activates whenever the return air dry-bulb is equal to or warmer than the outdoor air dry-bulb. Therefore, for July 0900 the economizer control should be activated. The economizer damper will modulate to There are several • Use temperature cutoff limits on economizer operation. For example, if a cutoff of 75 F is used, the economizer will not operate when the outdoor temperature is warmer than 75 F, even if the return air temperature exceeds the outdoor temperature. This cutoff helps prevent economizer operation for marginal situations that lead to the problems discussed above. However, choosing a cutoff temperature which guarantees that all such problem conditions are avoided is difficult and is highly application-dependent. • Use an integrated enthalpy economizer control. With this control, return air enthalpy is compared with outdoor air enthalpy to determine when to activate the economizer. Because enthalpy accounts for both the sensible and latent heat of air, the marginal conditions that lead to operating problems will be avoided. • Use non-integrated control. This dry-bulb economizer control is only activated when the outdoor air is equal to or cooler than the supply air temperature. Since this control will not activate the economizer until all mechanical cooling can be eliminated, marginal situations involving partial free cooling are avoided. However, this solution sacrifices the large number of operating hours at warmer outdoor air temperatures for which an integrated economizer can reduce mechanical cooling demands. Page 10 NEWS-II Pitfalls of Economizer Operation Other Problem Situations. A similar sort of problem can occur for integrated enthalpy economizer controls used in hot, dry climates for marginal conditions. This type of control activates when the return air enthalpy is equal to or greater than the outdoor air enthalpy. In a hot, dry climate, it is possible for outdoor air enthalpy to be less than return air enthalpy, while at the same time the outdoor air dry bulb is warmer than the return air dry-bulb. The enthalpy economizer will activate for such a condition, and will open fully. Outdoor air will eliminate the latent component of the cooling coil load, but can cause the sensible component to increase significantly. The symptom of this problem in design load calculations is similar to that for integrated dry-bulb controls - a peak load at an unusual time of day. The problem can be diagnosed using the same procedures discussed for the dry-bulb economizer. And the solutions are similar: impose cutoff points for operation, or switch to a different type of control better suited for the climate. ♦ Configuring E20-II for Windows While the E20-II Configuration Program is currently a DOS program, it can be configured for Microsoft Windows so it can be started by clicking an icon on the Windows Program Manager screen. This article provides step-by-step instructions for configuring E20-II in Windows. A similar procedure can be used for the Electronic Catalog software. Configuring E20-II involves two major tasks: creating a program group and creating a program icon. Instructions for each task appear below. These instructions assume the E20-II Configuration Program has already been installed, either directly from DOS or from Windows using the Run option on the File Menu. A. CREATING A PROGRAM GROUP The program group in which you want to place the E20-II program icon may already exist. If so, open this group and continue to part B below. If a group does not exist, create one using the following steps: 1. On the Program Manager screen choose the New option on the File Menu. Summer, 1995 2. In the New Program Object dialog box, choose the Program Group item and click OK. 3. In the Program Group Properties dialog box specify a name for the group, such as Carrier Programs, in the Description input field. The Group File input can be left blank. A group file will be created automatically. Click on the OK button. A program group will then be created. When you are returned to the Program Manager screen, this group will be open. C. CREATING A PROGRAM ICON 1. On the Program Manager screen, with the desired program group open, choose the New option on the File Menu. 2. In the New Program Object dialog box, choose the Program Item option and click on OK. 3. In the Program Item Properties dialog box, specify the following: Description: E20-II Command Line: C:\E20-II\E20-II.PIF Working Directory: C:\E20-II Note: Don’t click the OK button yet. 4. In the Program Item Properties dialog box, click on the Change Icon button. When you do this a warning message will appear stating that “there are no icons available for the specified file.” Ignore this warning and continue by clicking on the OK button. 5. In the Change Icon dialog box, specify the icon file name as C:\E20-II\E20-II.ICO and click on the OK button. The E20-II icon image will then be displayed. Click on the OK button once more to return to the Program Item Properties dialog box. 6. In the Program Item Properties dialog box, click on the OK button. At this point you will be returned to the Program Manager screen. The program group will now contain an E20-II program icon. To start E20-II, simply double click on this icon. Windows will automatically open a DOS window and will run the E20-II Configuration Program. When you exit from E20-II Configuration, you will be returned to the Program Manager screen. Note that the procedure described above assumes the E20-II Configuration Program has been installed on C: drive. If a different drive has been used, substitute this drive letter in the file and path inputs described above. In addition, change the drive letter specified in the E20-II.PIF file. The E20-II.PIF file must be modified using the Windows PIF Editor. ♦ Summer, 1995 Program Name NEWS-II Page 11 Version 1st Year Number License Fee Annual Renewal Fee Disk Space Disk Space for Program for Data (kB) (kB) Note 1.10 2.11 2.12 1.00 3.24 2.14 1.40 2.10 3.12 3.0 1.00 1.12 3.00 2.00 2.01 1.12 1.10 3.03 $295 $350 $495 $195 $295 $595 NA $95 $1195 NA $395 $150 $95 $250 $250 $795 $95 $150 $60 $35 $100 $40 $60 $60 NA $20 $240 NA $80 $10 $10 $10 $10 $160 $10 $15 2,000 356 654 646 1,260 2,560 1,200 380 4,200 NA 536 154 66 352 256 2,300 64 860 min 2 36 326 236 min 200 min 348 0 50 min 126 NA 1 0 0 204 82 min 126 18 min 385 H H H H H H H H H,M H H H H H H H,M H H 1.83 1.12 1.12 2.30 1.41 2.15 5.50 2.10 2.20 2.01 NC NC NC NC NC NC NC NC NC NC NC NC NC NC NC NC NC NC NC NC 3,384 2,500 450 218 1,100 2,024 1,608 582 774 688 504 1 min 2 0 0 20 min 2 0 0 0 H,M H H H H H,M H H H H E20-II Programs: Applied Acoustics Bin Operating Cost Analysis Block Load Block Load Lite Duct Design DuctLINK E20-II Configuration Engr. Economic Analysis Hourly Analysis Program (HAP) HAP Simulation Weather Data HAP / COMPLY 24 Translator PsychGRAPH Refrigerant Piping Sheet Metal & Eqpt Estimating Sheet Metal Layout System Design Load Program U-Value Calculator Water Piping Design E-CAT Programs: ACAPS Acoustics Server Air Terminal Selection Commercial Split Systems Selection Electronic Catalog Configuration Reciprocating Chiller Selection Rooftop Packaged Units Selection Vertical Packaged Units Selection Water Source Heat Pump Selection 42 Series Fan Coil Selection Key: H=Hard Disk Required. M=Math Coprocessor Recommended NC=No Charge. NA=Not Applicable. Software Support Software Correspondence E20-II customers are provided with free, unlimited software support via your local Carrier distributor or sales office, the Carrier Regional Software Managers (RSMs) and the Syracuse software support staff. To obtain software assistance from an RSM or from Syracuse, call our toll-free support line listed below. For information about software licenses, renewals, mailings and changes of address please contact: Toll-Free Support Line: 1-800-253-1794 Carrier Corporation / Sotware Systems TR-1 Room 250 / P.O. Box 4808 Syracuse, New York, 13221 Attn: Joanne Sherwood Phone: 315-432-7072. FAX: 315-432-6844