1
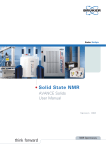
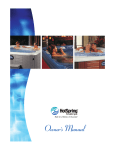
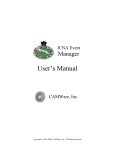
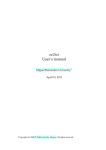
veDYNA Entry Example Book for Preconfigured Maneuvers Example Book Modification: August 22, 2014 For Software Version: General ve-DYNA Documentation 2014 TESIS DYNAware Technische Simulation Dynamischer Systeme GmbH. All rights reserved. This document and the described software are protected by copyright and license agreement. All rights are reserved. Neither the documentation nor software may be copied in any form, in whole or in part, without prior written consent of TESIS DYNAware Technische Simulation Dynamischer Systeme GmbH. This Publication and the contents hereof are subject to change without notice. TESIS DYNAware Technische Simulation Dynamischer Systeme GmbH makes no warranty of any kind with regard to this publication, including but not limited to the implied warranties of merchantability or fitness for a particular purpose or correctness of information. TESIS DYNAware Technische Simulation Dynamischer Systeme GmbH shall not be liable for errors contained herein or direct, indirect, special, incidental, or consequential damages in connection with the furnishing, performance, or use of this publication. Brand names or product names are trademarks or registered trademarks of their respective companies or organizations. TESIS DYNAware Technische Simulation Dynamischer Systeme GmbH Baierbrunner Straße 15 D-81379 Munich Germany Telephone: +49 89 74 73 77-0 Telefax: +49 89 74 73 77-99 E-mail: [email protected] Web: www.tesis-dynaware.com 2 TESIS DYNAware Contents 1 Introduction 4 2 General Handling of Simulation Procedures 5 3 Example Simulation Procedures for Standard Tests 7 3.1 go Static Equilibrium: Maneuver to Reach Static Equilibrium . . . . . . . . . . . . . . . . . . . . 8 3.2 go AxleKinematics: Analysis of Axle Kinematics . . . . . . . . . . . . . . . . . . . . . . . . . . . 10 3.3 go AccelerationTest: Acceleration and Brake Test . . . . . . . . . . . . . . . . . . . . . . . . . . . 13 3.4 go SteadyState Circular Drive: Self-Steering Behaviour . . . . . . . . . . . . . . . . . . . . . . . 16 3.5 go SteerStep: Steering Wheel Step . . . . . . . . . . . . . . . . . . . . . . . . . . . . . . . . . . 19 3.6 go Slalom: Slalom Test . . . . . . . . . . . . . . . . . . . . . . . . . . . . . . . . . . . . . . . . . 21 3.7 go Braking in a Curve: Braking in a Curve . . . . . . . . . . . . . . . . . . . . . . . . . . . . . . 23 3.8 go Braking on MuSplit: Braking on Mu-Split . . . . . . . . . . . . . . . . . . . . . . . . . . . . . . 25 3.9 go ISO DoubleLaneChange: ISO Double Lane Change . . . . . . . . . . . . . . . . . . . . . . . 28 3.10 go Uphill Driveaway: Starting on a Hill with mu-Split . . . . . . . . . . . . . . . . . . . . . . . . . 30 3.11 go MonteCarlo: Driving along the MonteCarlo Racetrack . . . . . . . . . . . . . . . . . . . . . . 33 3 1 Introduction veDYNA Entry incorporates the compiled version of the veDYNA vehicle model, comprising all relevant parts of the vehicle: n Vehicle body including aerodynamics n Tabled axle kinematics for front and rear axle n Tyre model TM-Easy n Generic Drivetrain model for front wheel drive, rear wheel drive and all wheel drive n Manual and automatic Transmission n Brake on every wheel This model approach is proven for a broad range of vehicle dynamics simulation tasks. veDYNA Entry comes with various ready-to-go procedures for the simulation of standard tests, such as steer step, double lane change, and many more. These procedures are coded in the MATLAB programming language and are based on pre-configured maneuver and road definitions. The entire MATLAB functionality may be used to specify preprocessing, execution and postprocessing. These so-called User Procedures are therefore a powerful means to control the execution of the simulation. Specifically designed Graphical User Interfaces allow comfortable variations of test parameters. As the User Procedures are delivered as open Matlab code, user specific code may be added in all supplied User Procedures. Please refer to the appropriate manuals for MATLAB programming instructions when you develop your own procedures, especially for graphical functions. This document contains detailed descriptions of the provided User procedures. By extending the example procedures and adopting the main ideas shown in this manual, you will be able to develop individual applications to meet your particular simulation requirements. 4 TESIS DYNAware 2 General Handling of Simulation Procedures Generally, all actions that can be performed via the veDYNA GUI (e.g. applying simulation parameters, running the simulation) are also available via specific functions of the MATLAB interface, which can be used in the Simulation Procedures. In addition, it is possible to set parameters and do all kinds of calculations for pre-processing and post-processing. A simulation procedure comprises the following steps: 1. Definition of a user interface for entry of simulation parameters 2. Launch of the dialogue 3. Retrieving the entered data from the user interface 4. Preprocessing: Preliminary calculations, setting of simulation parameters (vehicle, road, maneuver) 5. Specification and update of driving maneuver, road and trace variables 6. Execution of the simulation 7. Postprocessing: Evaluation or of simulation results 8. Plotting of simulation results To execute an existing procedure, select a file in the User Procedure area in the veDYNA GUI and click the button next to the pull-down menu. For most of the supplied example procedures a user data mask pops up, where some simulation parameters can be entered. If data entry is complete, click the OK button in the user data mask. If no user interface is available, the procedure is executed immediately. The default parameters set within the procedure are used. The procedures are available as a MATLAB m-file and can be edited using the button . The appearance of the data entry mask and the parameters to be entered is data driven and can therefore also be defined within the procedure. The easiest way to generate a new simulation procedure is to modify one of the provided examples. Alternatively, individual simulation procedures can be created from the currently selected settings for maneuver, road and trace by means of the menu function Simulation | Generate User Procedure with Current Simulation Settings. . . . The veDYNA functions vm apply and vlm apply are used to select and update the model data of the maneuvers, driver, road, and vehicle data, respectively. The effect is equivalent to the button in the veDYNA GUI. The functions can be used in Simulation Procedures or from the MATLAB Command Window. If no vehicle data is specified in the procedure, the currently active vehicle configuration is used (from the last parameter apply). If the procedure applies only parts of the vehicle data, veDYNA will read the remaining data sets of the previous data apply. For a comprehensive description of this function please refer to the veDYNA User Manual or type help vm apply in the MATLAB command window during your veDYNA session. The function vm load is used to read data files from the database. vm load returns the content of the data file in a local data structure. vm load and vm apply provide a mechanism to manipulate model data within a simulation procedure: 1. Read the data file (vm load) 2. Modify the local data structure 3. Put the modified data into operation (vm apply) 5 To define the tracing, use the function up trace(start time, stop time, ’trace file’). The simulation is started by means of the function vm runsim(0.0, stop time). The function res = vm results is used to access the current simulation output (trace variables). The function returns a structure containing the result data. The traced variables then are called with the structure prefix, e.g. res.tsim. Apart from the prefix, the variable names are the same as those in the trace file. The MATLAB interface is completely listed in the veDYNA User Manual. 6 TESIS DYNAware 3 Example Simulation Procedures for Standard Tests In this chapter selected examples of simulation procedures for standard applications are presented. The following procedures are collected in the Simulation Project tutorial: n go AccelerationTest: Acceleration and Braking n go AxleKinematics: Analysis of Axle Kinematics n go Braking in a Curve: Braking in a Curve n go Braking on MuSplit: Braking on a µ-Split surface n go Static Equilibrium: Reaching the Static Equilibrium n go SteadyState Circular Drive: Self-Steering Behaviour n go Steerstep: Steering Wheel Angle Step n go Slalom: Slalom Test n go ISO DoubleLanechange: ISO Double Lane Change n go MonteCarlo: Driving the Monte Carlo Race Track n go Uphill Driveaway: Starting from standstill on ascending road with µ-Split Please note that in all examples the vehicle remains at a standstill for the first second. As the spring stresses do not necessarily correspond to the stresses in the design position of the vehicle, an allowed transient effect will initially start in this phase. 7 go Static Equilibrium: Maneuver to Reach Static Equilibrium 3.1 go Static Equilibrium: Maneuver to Reach Static Equilibrium F IGURE 3.1: Data Entry Mask for Simulation Procedure go StaticEquilibrium The procedure go StaticEquilibrium calculates the transient behaviour of the vehicle reaching static equilibrium from the design position. For this purpose the vehicle is simply kept standing without driver inputs (i.e. with the steering wheel in zero position and without forward movements). In this example the interesting results are front and rear axle loads, spring lengths, spring forces, roll, pitch and yaw angles of the vehicle and the co-ordinates of the chassis reference point. This is a test that should be performed on every newly configured vehicle. Every simulation should start with the vehicle in the static equilibrium position to avoid transient phenomena. Therefore the first maneuver phase should always be a waiting phase of at least one second. The following table shows the maneuver definitions used in the go StaticEquilibrium procedure. 8 TESIS DYNAware Example Simulation Procedures for Standard Tests TABLE 3.1: Maneuver Definition to Reach Static Equilibrium Phase Longitudinal Dynamics Lateral Dynamics Constraints Static.m Accelerator Pedal Position (0) Static.m Absolute Steering Input (0) Static.m Neutral gear Time Maneuver definition Find Static Position 2s The procedure works as follows: 1. Display of data entry mask for defining the simulation parameters. The following parameters can be entered: TABLE 3.2: Maneuver Parameters of Finding the Static Equilibrium Specifier Expected time to reach steady state Description Time to reach the static equilibrium position from the design position 2. Load and update of the maneuver definition, road and trace files defining the Static Equilibrium test according to the given parameters. For this maneuver, a standard road without any features is used. 3. Execution of the simulation 4. Result evaluation: Calculation of axle loads, and display of spring and damper forces, spring deflections, tyre and axle loads the veDYNA Plot GUI, see Figure 3.2. F IGURE 3.2: Example Result Plot: Spring Deflection for Transient Oscillation to Static Equilibrium 9 go AxleKinematics: Analysis of Axle Kinematics 3.2 go AxleKinematics: Analysis of Axle Kinematics F IGURE 3.3: Data Entry Mask of Simulation Control Procedure go AxleKinematics The procedure go AxleKinematics simulates a hydropulse test rig for suspension kinematics by fixing the vehicle body while lifting and steering the wheels. Initially, high frequency sinusoidal wheel lift is combined with low frequency steering movement. Thereafter the wheels are steered at high frequency and at the same time lifted at low frequency. There are no maneuver constraints. With this procedure it is possible to inspect the complete range of axle positions. Interesting results are the axle kinematics tables for wheel center translation, and caster, camber and toe angles as functions of wheel lift and steer input. TABLE 3.3: Maneuver Phases of Axle Kinematics Phase Maneuver definition High frequency wheel lift, Low frequency steering Low frequency wheel lift, High frequency steering Time 30 s 30 s Longitudinal Dynamics Lateral Dynamics Axle Kinematics.m Fixed body, axle kinematics analysis Fixed body, axle kinematics analysis Axle Kinematics.m Sinusoidal wheel input Sinusoidal wheel input Constraints none.m Neutral gear Neutral gear The procedure works as follows: 1. Display of data entry mask for defining the simulation parameters. The following parameters can be en- 10 TESIS DYNAware Example Simulation Procedures for Standard Tests tered: TABLE 3.4: Maneuver Parameters of Axle Kinematics Specifier Duration of Phase 1 Left hand side pulse amplitude left hand side pulse frequency Right hand side pulse amplitude Right hand side pulse frequency Initial steering wheel amplitude Initial steering wheel frequency Final steering wheel amplitude Final steering wheel frequency Duration of Phase 1 Left hand side pulse amplitude Left hand side pulse frequency Right hand side pulse amplitude Right hand side pulse frequency Initial steering wheel amplitude Initial steering wheel frequency Final steering wheel amplitude Final steering wheel frequency Description Phase length of the first axle excitation mode wheel lift amplitude left wheel lift frequency left wheel lift amplitude right wheel lift frequency right Steering wheel amplitude at the beginning of the phase Steering wheel frequency at the beginning of the phase Steering wheel amplitude at the end of the phase, the amplitude is linearly interpolated in between Steering wheel frequency at the end of the phase, the amplitude is linearly interpolated in between Phase length of the first axle excitation mode wheel lift amplitude left wheel lift frequency left wheel lift amplitude right wheel lift frequency right Steering wheel amplitude at the beginning of the phase Steering wheel frequency at the beginning of the phase Steering wheel amplitude at the end of the phase, the amplitude is linearly interpolated in between Steering wheel frequency at the end of the phase, the amplitude is linearly interpolated in between 2. Load and update of the maneuver definition, road and trace files defining the Axle Kinematics test according to the given parameters. 3. Execution of the simulation 4. Result evaluation: The veDYNA variables describing the wheel orientation are transformed into the more common variables toe, camber and caster angles by use of the routine toe caster camber from ed. Wheel position and wheel orientation are arranged in result matrices and written to an ASCII file. This data is further processed in an evaluation routine (ax elakin prepro) and written to the files ‘front template.m’ and ‘rear template.m’ in the ∼\work .current directory to be used in veDYNA table kinematics. 5. Plot of wheel orientation angles according to DIN 70000 using the function vm plot din70000 angles (Matlab figures). 11 go AxleKinematics: Analysis of Axle Kinematics F IGURE 3.4: Example Result Plots: ISO 70000 diagram of caster, camber, and toe angles from Axle Analysis 12 TESIS DYNAware Example Simulation Procedures for Standard Tests 3.3 go AccelerationTest: Acceleration and Brake Test F IGURE 3.5: Data Entry Mask for Simulation Control Procedure go AccelerationTest The procedure go AccelerationTest determines acceleration and deceleration capabilities of a vehicle by applying full throttle and full brake over a given time or distance. Interesting results are wheel loads, spring lengths and forces, pitch, yaw and roll angle, vehicle acceleration, vehicle velocity, as well as rotational speeds and torques in the driveline. The specified time and distance for acceleration should be set high enough such that a velocity of at least 100km/h is reached. The braking scenario starts as soon as either the specified time or acceleration distance is reached and ends when zero speed is obtained. The specified brake time should be set high enough to fulfill this. Warnings are otherwise displayed in the Command Window. This is the third test (after go StaticEquilibrium and go AxleKinematics) that should be performed on a newly configured vehicle. 13 go AccelerationTest: Acceleration and Brake Test TABLE 3.5: Table of Maneuver Phases go AccelerationBrakeTest Phase Maneuver definition Duration Longitudinal Dynamics AcceleratorBrake Test.m Lateral Dynamics AcceleratorBrake Test.m Constraints Rev up the engine Acceleration at full throttle Operate Brake 1s s acc t acc 0.1s Acc. Pedal Input (90) Acc. Pedal Input (HOLD) Abs. Steering Input (0) Fixed Steering Wheel Acc. Pedal Input (0) Fixed Steering Wheel Deceleration with full brake t brk Acc. Pedal Input (HOLD) Fixed Steering Wheel Accelerator BrakeTest .m Neutral gear Gears 1-7 Brake Pedal Input (1) Brake Pedal Input (1) The procedure works as follows: 1. Display of data entry mask for defining the simulation parameters. The following parameters can be entered: TABLE 3.6: Maneuver Parameters of Acceleration - Brake Test Specifier Time allowed for acceleration Distance for acceleration Time allowed for braking Description Time for vehicle acceleration at full throttle Distance over which vehicle is accelerated at full throttle; the acceleration is terminated as soon as either the acceleration time has elapsed or the distance has been traveled Time for vehicle deceleration with brake pedal fully pressed down 2. Load and update of the maneuver definition, road and trace files defining the Axle Kinematics test according to the given parameters. 3. Execution of the simulation 4. Result evaluation: In the postprocessing additional characteristic values are generated, e.g. the time and distance required to reach 100km/h. Additional information, such as maximum speed, acceleration time and distances, is displayed in the Matlab Command Window. Results and additional characteristics are displayed in the veDYNA Plot GUI, see Figure 3.6 14 TESIS DYNAware Example Simulation Procedures for Standard Tests F IGURE 3.6: Example Result Plot: Vehicle Velocity from Acceleration and Brake Test 15 go SteadyState Circular Drive: Self-Steering Behaviour 3.4 go SteadyState Circular Drive: Self-Steering Behaviour F IGURE 3.7: Data Entry Mask for User Procedure go SteadyState Circular Drive In the procedure go SteadyState CircularDriving the vehicle is constantly accelerated on a circular course of radius r, until the defined lateral acceleration ay is achieved. This is the standard test to determine self-steering behaviour. Interesting results to estimate the self-steering behaviour are the steering gradient, yaw velocity amplification, and characteristic speed. Yaw velocity amplification is defined as the yaw angle over the average steering angle of the front axle. The steering characteristics show the steering wheel angle as a function of lateral speed. The neutral steering in the plot is shown as a line with constant gradient. Velocity amplification above the neutral steering line describes an oversteering tendency and below the line an understeering tendency. The characteristic speed is the maximum speed of an understeering vehicle and shows the speed at which the steering is most sensitive. In order to have approximately steady state conditions, the time allowed for acceleration should be reasonably long. If the maneuver time is too small, only transient states will occur and steady state is not reached. 16 TESIS DYNAware Example Simulation Procedures for Standard Tests TABLE 3.7: Description of Maneuver go SteadState CircularDrive Phase Maneuver definition Find Static Position Acceleration on circular drive with constant radius Time 1s t sim Longitudinal Dynamics Circle Drive.m Cruise Control (0) Nominal lateral acceleration control Lateral Dynamics Circle Drive.m Abs. Steering Input (0) Controlled steadystate circular run Constraints Start1s.m Neutral gear Gears 1-5 The procedure works as follows: 1. Display of data entry mask for defining the simulation parameters. The following parameters can be entered: TABLE 3.8: Maneuver Parameters of Steady State Circular Drive Specifier Radius of driving circle Maximum lateral acceleration Time to reach maximum acceleration Description Radius of the nominal circular driving trajectory The vehicle is accelerated linearly from zero to the maximum velocity given by circle radius and maximum lateral acceleration Time allowed for acceleration: should be set high enough to have steady state conditions 2. Load and update of the maneuver definition, road and trace files defining the Steady State Circular Driving test according to the given parameters. 3. Execution of the simulation 4. Result evaluation: A mean value of the effective steering ratio is calculated for lateral accelerations up to a user-specific limit for linearisation. Steering gradients for the linear model and the longitudinal velocity at which the sideslip angle crosses zero are calculated and displayed in the Command Window. Vehicle states and characteristic values are displayed in the Plot GUI, see Figure 3.12. 17 go SteadyState Circular Drive: Self-Steering Behaviour F IGURE 3.8: Example Result Plot: Steering Angle versus Lateral Acceleration for Steady State Circular Drive 18 TESIS DYNAware Example Simulation Procedures for Standard Tests 3.5 go SteerStep: Steering Wheel Step F IGURE 3.9: Data Entry Mask for Simulation Control Procedure go SteerStep The steering wheel step is a standard test used for the evaluation of vehicle handling characteristics. The vehicle is accelerated to a given speed, then the steering wheel angle is turned in quickly according to user specification. Interesting results are the yaw response and the wheel loads. TABLE 3.9: Maneuver Definition for Steering Step Phase Time Find Static Position Acceleration Stabilisation Steering wheel step Stabilisation 1s t = v/ax t = tstd t = dt t = tstd Longitudinal Dynamics SteerStep.m Cruise Control (0) Cruise Control (vtarget ) Cruise Control (vtarget ) Lateral Dynamics SteerStep.m Absolute Steering Input (0) Fixed Steering Wheel Constraints Start1s.m Neutral gear Gears 1-5 Absolute steering input (δh ) Fixed Steering Wheel The steering wheel step should produce a lateral acceleration of approximately 4 m/s2 for the selected speed. The procedure works as follows: 19 go SteerStep: Steering Wheel Step 1. Display of data entry mask for defining the simulation parameters. The following parameters can be entered: TABLE 3.10: Maneuver Parameters of the Steering Wheel Step Specifier Change in steering wheel angle Steering Rate Vehicle Speed Minimum longitudinal acceleration Description Amount of steering wheel turn Steering wheel turning speed Nominal velocity at which the steering wheel step is performed Maximum acceleration during the acceleration phase from standstill to the nominal velocity; used for the maneuver timing 2. Load and update of the maneuver definition, road and trace files defining the Steering Wheel Step according to the given parameters. 3. Execution of the simulation 4. Result evaluation: For post-processing of the simulation results a local function res extract has been added to the procedure. As only the range from the beginning of the steering angle step to the end of the maneuver is of interest, the initial phases (static equilibrium, acceleration and stabilisation) are skipped. Assuming that a steady state is reached at the end of the simulation, the relative (scaled) yaw rate and lateral acceleration are calculated as a percentage of the final values. A characteristic value is the time, at which 90 % of the steady yaw rate is reached. The time of the first maximum yaw rate . The values of the maximum yaw rate in relation to the steady yaw rate and the TB-value are calculated and displayed in the MATLAB command window. Finally vehicle states such as the calculated relative yaw rate, lateral acceleration, and tyre loads are plotted in the veDYNA Plot GUI, see Figure 3.10. F IGURE 3.10: Example Result Plot: Tyre Loads at the Front Axle for the Steering Wheel Step (two Vehicle Variants) 20 TESIS DYNAware Example Simulation Procedures for Standard Tests 3.6 go Slalom: Slalom Test The procedure go Slalom makes the selected vehicle drive at given speed through a series of cones positioned at a prescribed distance ds. F IGURE 3.11: Data Entry Mask for procedure go Slalom The vehicle is accelerated to the required velocity, then the Basic Driver follows a sinusoidal path through the cones at constant speed. TABLE 3.11: Maneuver Definition of Slalom Phase Maneuver definition Find Static Position Acceleration Drive Slalom Course Straight Line Driving Time 1s s acc+s stat n*ds s exit Longitudinal Dynamics Slalom.m Basic Driver (speed) Lateral Dynamics Slalom.m Fixed Steering Wheel (0) Basic Driver (QHOLD) Basic Driver (QSINE) Basic Driver (QHOLD) Constraints Start1s.m Neutral gear Gear 1-5 The procedure works as follows: 1. Display of data entry mask for defining the simulation parameters. The following parameters can be entered: 21 go Slalom: Slalom Test TABLE 3.12: Maneuver Parameters of Slalom Drive Specifier Distance between cones (ds) Number of cones Vehicle velocity Nominal longitudinal acceleration Maximum lateral displacement Description Spacing of cones for slalom drive, indicates the frequency of the sinusoidal curve through the cones Indicates the length of the slalom drive Nominal velocity for the slalom drive through the cones Maximum acceleration during the acceleration phase from standstill to the nominal velocity; used for the maneuver timing Maximum lateral amplitude to be driven, indicates the amplitude of the sinusoidal curve through the cones 2. Load and update of the maneuver definition, road and trace files defining the Slalom test according to the given parameters. 3. Execution of the simulation 4. Result evaluation: Calculation of cone positions and display of vehicle trajectory, vehicle states such as speed, yaw angle, yaw rate in the veDYNA Plot GUI, see Figure 3.12. F IGURE 3.12: Example Result Plot: Vehicle Trajectory for the Slalom Test 22 TESIS DYNAware Example Simulation Procedures for Standard Tests 3.7 go Braking in a Curve: Braking in a Curve F IGURE 3.13: Settings for Simulation Procedure go Braking in a Curve The procedure go Braking in a Curve simulates braking during a steady circular path with different constant braking pressures. The vehicle is accelerated on a circular course of constant radius until the desired lateral acceleration is achieved. Then a specified brake pressure is applied for 1 s to decelerate the vehicle. The maneuver phases can be described as shown in Table 3.13. TABLE 3.13: Description of Maneuver Braking in a Curve Phase Time Maneuver definition Find Static Position 1s Acceleration t acc Stabilisation t std Braking 1s Longitudinal Dynamics Brake in Curve .m Accelerator pedal input (0) Nominal lateral acceleration control (ay) Nominal lateral acceleration control (Hold) Accelerator pedal input (0) Lateral Dynamics Constraints Brake in Curve .m Abs. Steering Input (0) Controlled steadystate circular run (1/r) Brake in Curve.m Neutral gear Fixed Steering Wheel Neutral gear, Apply Brake Gear 1-7 Interesting results are normalized yaw rate, lateral acceleration and slip angle at the end of braking (w.r.t. their respective steady-state values at the end of the stabilization phase). These values are plotted against longitudinal vehicle deceleration. The procedure works as follows: 1. Display of data entry mask for defining the simulation parameters. The following parameters can be entered: 23 go Braking in a Curve: Braking in a Curve TABLE 3.14: Maneuver Parameters of Braking in a Curve Specifier Curve Radius Lateral Acceleration Longitudinal Acceleration Number of trials Description Radius of the Driven Curve Lateral Acceleration to be reached when braking starts Longitudinal acceleration for the acceleration to final velocity Number of simulations: The braking is performed for different brake pedal positions, logarithmically spaced between 0 and 1 2. Load and update of the maneuver definition, road and trace files defining the Brake Maneuver according to the given parameters. 3. Execution of the simulation One simulation run is required for the calculation of braking with different brake pressures. For each run loading of the maneuver files and the execution of the simulation need to be repeated. The brake pressure is increased at each simulation run until full brake pressure is attained. 4. Result evaluation: Yaw rate, lateral acceleration and slip angle at the end of braking are normalized w.r.t. their respective steady-state values at the end of the stabilization phase. These values are plotted against longitudinal vehicle deceleration (a diagram showing the results of all simulation run is generated as a Matlab figure), see Figure 3.14. F IGURE 3.14: Example Result Plot: Yaw Rate Ratio as a Function of Brake Deceleration 24 TESIS DYNAware Example Simulation Procedures for Standard Tests 3.8 go Braking on MuSplit: Braking on Mu-Split F IGURE 3.15: Settings for Simulation Procedure go Braking on MuSplit The procedure go Braking on Mu Split simulates full braking on a road with different friction coefficients on the right and left hand side of the road. The vehicle is accelerated up to the desired speed and is then decelerated with fully pressed brake pedal until standstill. This maneuver is a good test for comparing the driving behaviour of vehicles with and without ABS. The maneuver can be described by the maneuver phases in Table 3.15. 25 go Braking on MuSplit: Braking on Mu-Split TABLE 3.15: Table of Maneuver Phases go Braking on Mu-Split Phase Time Maneuver definition Longitudinal Dynamics Brake on MuSplit .m Lateral Dynamics Brake on Mu Split.m Abs. Steering Input (0) Controlled Straight Line Driving Fixed Steering Wheel Find Static Position 1s Acc. Pedal Input (0) Accelerate t acc Cruise Control (speed) Stabilisation t std Full brake application t brake Cruise Control (speed) Acc. Pedal Input (0) Constraints Brake on MuSplit .m Neutral gear Gear 1-7 Full brake Interesting results are yaw angle and yaw rate, acceleration and deceleration, distance to standstill. The procedure works as follows: 1. Display of data entry mask for defining the simulation parameters. The following parameters can be entered: TABLE 3.16: Maneuver Parameters of Braking on Mu-Split Specifier Lower friction coefficient Vehicle velocity Nominal longitudinal acceleration (traction) Description Friction coefficient of the left half of the proving ground, the friction of the right half is set to 1 Nominal velocity at which the brake is applied Nominal acceleration during the acceleration phase from standstill to the nominal velocity; used for the maneuver timing 2. Load and update of the maneuver definition, road and trace files defining the Brake test according to the given parameters. 3. Execution of the simulation 4. Result evaluation: The vehicle trajectory, yaw angle, yaw rate as well as vehicle speed, vehicle acceleration and deceleration are plotted in the Plot GUI, see Figure 3.16. 26 TESIS DYNAware Example Simulation Procedures for Standard Tests F IGURE 3.16: Example Result Plot: Lateral Vehicle Motion during Braking on a mu Split Surface 27 go ISO DoubleLaneChange: ISO Double Lane Change 3.9 go ISO DoubleLaneChange: ISO Double Lane Change F IGURE 3.17: Data Entry Mask of Simulation Control Procedure go ISO DoubleLaneChange This procedure implements the ISO double lane change using the Basic Driver. The target course is specified by means of lateral displacements defined in the Basic Driver submaneuvers. For the animation cones are positioned and displayed automatically. The procedure works as follows: 1. Display of data entry mask for defining the simulation parameters. The following parameters can be entered: 28 TESIS DYNAware Example Simulation Procedures for Standard Tests TABLE 3.17: Maneuver Parameters of ISO Double Lanechange Specifier Length of 1st lane (s 1) Distance between 1st and 2nd lane (s 2) Length of 2nd lane (s 3) Distance between 2nd and 3rd lane (s 4) Length of 3rd lane (s 5) Description Length of first lane Spacing between lane 1 and lane 2 Overall vehicle width Vehicle speed Vehicle width, used to set the lane width Vehicle speed for driving through the lanes Length of second lane Spacing between lane 2 and lane 3 Length of third lane 2. Load and update of the maneuver definition, road and trace files defining the ISO Double Lane Change according to the given parameters. 3. Execution of the simulation 4. Result evaluation: Successful maneuver completion is checked, and vehicle states, such as vehicle trajectory, steering wheel angle, lateral acceleration,roll angle, etc. are plotted in the veDYNA Plot GUI, see Figure 3.18. F IGURE 3.18: Example Result Plot: Steering Wheel Angle from an ISO Double Lanechange) 29 go Uphill Driveaway: Starting on a Hill with mu-Split 3.10 go Uphill Driveaway: Starting on a Hill with mu-Split F IGURE 3.19: Data Entry Mask for Simulation Control Procedure go Uphill Driveaway The procedure go Uphill Driveaway simulates pulling away at a hill ramp from standstill. For this purpose the vehicle is first driven to the ramp and stopped there, before the actual test begins. Different road friction coefficients can be prescribed for the wheels at both sides of the two lane road. This maneuver is useful for analyzing traction differences between various driveline configurations (i.e. rear wheel drive and four wheel drive) and also differential locking, see Table 3.18. 30 TESIS DYNAware Example Simulation Procedures for Standard Tests TABLE 3.18: Maneuver Description go Uphill Driveaway Phase Maneuver definition Static position Drive to ramp Stop on Ramp Wait for static position Start on ramp Time 1s t acc1 t acc1 t wait Longitudinal Dynamics Uphill Driveaway.m Cruise control (0) Cruise Control (vmax1) Cruise Control (0.0) Cruise Control (0.0) Lateral Dynamics Uphill Driveaway.m Abs. Steering Input (0) Fixed Steering Wheel Fixed Steering Wheel Constraints Uphill Driveaway.m Neutral gear Gear 1-2 Gear 1-2 Neutral gear t acc2 Basic driver (automatic speed) Basic driver (QHOLD) Gear 1-2 If the speed to drive over the ramp is set too high, the front axle may break while driving downhill. The procedure works as follows: 1. Display of data entry mask for defining the simulation parameters. The following parameters can be entered: TABLE 3.19: Maneuver Parameters of Uphill Driveway Specifier Road length in front of hill Length of hill ascent Length of hill top Length of hill decent Road length behind hill Ramp inclination Friction coefficient of left lane Friction coefficient of left lane Longitudinal dynamics controller Lateral dynamics controller Maximum velocity to drive onto ramp Maximum velocity to drive onto ramp Expected vehicle acceleration Length of smooth segment Description Distance from initial vehicle position to beginning of hill slope Length of uphill slope section Length of flat hill top Length of downhill slope section length of flat road part behind hill Hill slope in % Type of driver controller to control given speed Type of driver controller to control course control Maximum velocity to drive onto the ramp: there the vehicle stops and initiates the uphill driveaway Maximum velocity to drive over the ramp Used for the maneuver timing Used for smoothing the edges of the hill geometry 2. Load and update of the maneuver definition, road and trace files defining the Uphill Driveaway according to the given parameters. 3. Execution of the simulation 4. Result evaluation: Vehicle states, such as tyre loads, tyre forces (traction and lateral), tyre slips, the vehicle trajectory etc. are plotted in the veDYNA Plot GUI, see Figure 3.20. 31 go Uphill Driveaway: Starting on a Hill with mu-Split F IGURE 3.20: Example Result Plot: Vertical Vehicle Trajectory for Uphill Driveaway) 32 TESIS DYNAware Example Simulation Procedures for Standard Tests 3.11 go MonteCarlo: Driving along the MonteCarlo Racetrack F IGURE 3.21: Data Entry Mask for Simulation Control Procedure go MonteCarlo The procedure go MonteCarlo simulates driving along the Monte Carlo race track. The driver model guides the vehicle along the road centerline. For the speed setting the road geometry is considered (i.e. the vehicle brakes in curves). It is possible to drive only parts of the complete track, the simulation terminates after the given driving distance, see Table 3.20. The road is defined as a closed circuit, therefore it is necessary to provide an estimate for the time to drive. Otherwise the vehicle travels on the track for the given simulation time. It is possible to generate other road geometries from measurements using the GPS Data Converter. 33 go MonteCarlo: Driving along the MonteCarlo Racetrack TABLE 3.20: Description of Maneuver Drive MonteCarlo Phase Time Maneuver definition Find Static Position 1s Driver Control time Longitudinal Dynamics Driver.m Accelerator pedal input (0) Basic Driver (Automatic Speed) Lateral Dynamics Constraints Driver.m Abs. Steering Input (0) Basic Driver Start1s.m Neutral gear Gear 1-7 The procedure works as follows: 1. Display of data entry mask for defining the simulation parameters. The following parameters can be entered: TABLE 3.21: Maneuver Parameters of MonteCarlo Drive Specifier Time to drive Maximum speed for straight parts Description The time to drive on the track - the simulation terminated thereafter. Driver controller setting for maximum allowable speed. The speed in curves is computed automatically from maximum lateral acceleration (this is a driver controller parameter) 2. Load and update of the maneuver definition, road and trace files defining the Monte Carlo drive according to the given parameters. 3. Execution of the simulation 4. Result evaluation: Vehicle states, such as vehicle speed and acceleration, the vehicle trajectory compared to the target path, etc. are plotted in the veDYNA Plot GUI, see Figure 3.22. 34 TESIS DYNAware Example Simulation Procedures for Standard Tests F IGURE 3.22: Example Result Plot: Speed Profile for Monte Carlo Drive) 35 Imprint TESIS DYNAware Technische Simulation Dynamischer Systeme GmbH Documentation Baierbrunner Straße 15 D-81379 Munich Germany Telephone: +49 89 74 73 77-0 Telefax: +49 89 74 73 77-99 E-mail: [email protected] Web: www.tesis-dynaware.com