1
BlomDESKTOP ViewerTM
User Guide
Version 3.6
_____________________________
Audience:
Blom partners, clients and developers
Date
Blom Document
Jun 2012
BlomDESKTOP Viewer User Guide v3 6 r1 0a.docx
Blom, ASA. Proprietary and Confidential
BlomDESKTOP ViewerTM User Guide v3.5 r1.0a
Notices
Blom expressly retains all intellectual and other property rights with respect to this document and
all matters set forth herein.
Some technical assertions of capability included herein are estimates based on limited information
gathered from past experience.
The terms, conditions, specifications, and procedures described herein are subject to change in the
sole discretion of Blom, ASA and its affiliates. End-User is responsible for requesting and obtaining
the latest release of these terms, conditions, specifications, and procedures prior to any purchase
or deployment of the products described herein.
Confidentiality
This document and the information contained herein is the proprietary and confidential
information of Blom, ASA. It is provided under contract agreement, and may not be reproduced or
used for purposes outside the scope of such agreement.
Trademarks
Blom’s logo is a registered trademark of Blom, ASA in the Kingdom of Norway and other countries.
Other brands and their products are registered trademarks or trademarks of their respective
holders and should be noted as such.
Copyrights
2011, Blom, ASA • All Rights Reserved
i
BlomDESKTOP ViewerTM User Guide v3.5 r1.0a
Revision History
Document Number
BD_UG_1010
Issue Date
st
April 1 , 2011
th
BD_UG_1011
April 20 , 2011
BD_UG_1210
April 25 , 2011
th
Reason for Change
Original Document
Annotations and Overlay Export added
Inclusion of user-interface related new (i.e., non bug or performance
related) features in version 1.2
BD_UG_2010
th
June 28 , 2011
th
BD_UG_2011
June 30 , 2011
BD_UG_2012
July 7th, 2011
BlomDESKTOP v2 release
English revision and minor changes
Changes in chapter 12 due to modification in preferences dialog.
Changes in chapter 6.3.4. Rewording.
Included section 2.5.1 detailing manual Proxy configuration
BD_UG_2110
Sept, 29th, 2011
New chapter 13 with description of the BlomDESKTOP Viewer Remote
Invocation
BD_UG_3010
October 21st, 2011
BlomDESKTOP v3 release:
-
Initial splash screen can now be disabled
-
Section 4.1.1 modified to describe double clicking on *.wskx files
to open them
-
Added section 4.3 for opening workspaces from the main
window
-
Section 4.4.1 modified to include Dataview element name
renaming
-
Section 4.5.4 modified to include new Blocked and Synchronized
icons in Windows.
-
Section 4.5.5 modified to describe the possibility of changing the
projection system
-
New section 6.3 describing the access to Library Metadata
information
-
Modified section 6.5.3 to describe the possibility of drag and
drop vector and raster files into BlomDESKTOP to open them
-
Modified section 6.3.3. with a new Projection Selection dialog
box
-
Section 6.6 has been rewritten
-
Section 7 modified to include two new measurement tools:
diagonal and façade area
-
Chapter 8 modified to include vertex and feature editing modes.
New screenshots added.
ii
BlomDESKTOP ViewerTM User Guide v3.5 r1.0a
-
New chapter (9) dedicated to describe BlomSTREET™ data into
BlomDESKTOP.
-
Section 13.4 modified with new exportation formats and new
projection dialog
-
New chapter (12) dedicated to describe LiDAR datasets into
BlomDESKTOP.
-
Chapter 14 modified to describe the new Preferences dialog
BD_UG_3011
Nov 17th, 2011
English revision
BD_UG_3012
Nov 21th, 2011
Installation procedure modified in section 2.1 to specify the need of
admin privileges.
BD_UG_3110
Dec 1th, 2011
-
Section 2.4.1 modified to include selection of no automatic
updates
-
New section 6.6 describing labeling option for vector overlays
-
New section in chapter 14 describing activation/deactivation of
updates
BD_UG_3210
Feb 21st, 2012
-
New section 16.3 describing auto search for updates
-
Section 5.3.1 modified to include description of Intelligent Mode
for Obliques.
-
Added section 5.5 with description of the integrated magnifying
glass tool
-
Modified section 6.5.4 to add the Move/Copy overlay option
-
Added section 6.7 with description of the selection of valid zoom
level for overlays
-
Modified section 6.8 to allow typing the name of baselayers
-
New chapter 8 dedicated to Geocoding. Covering the original
options in section 5, and also the new geocoding capability based
in .SHP file information
-
Added section 6.10 to describe file association to BlomDESKTOP
-
Changes in section 9.3 to describe new options in Symbology
-
Chapter 10 rewritten to include full integration with the
Cyclomedia API for BlomSTREET™ data.
BD_UG_3511
May 7th, 2012
-
Added new LiDAR options and viewer in Chapter 13
-
Added magnifying tool options in chapter 15
-
Added Section 2.5.2 to configure proxy through pac file
-
Changes in section 13.4 including different ways to display LiDAR
data
BD_UG_3512
th
Nov 2 , 2012
-
Added section 13.5. Customizing Lidar data views
-
Added Master Workspaces
iii
BlomDESKTOP ViewerTM User Guide v3.5 r1.0a
iv
BlomDESKTOP ViewerTM User Guide v3.5 r1.0a
Table of Contents
1
2
What is BlomDESKTOP ViewerTM? ............................................................................... 1
1.1
What is in this document? ........................................................................................ 2
1.2
Supported Platforms (system requirements) ............................................................ 2
1.3
Document Organisation............................................................................................ 2
1.4
Naming conventions ................................................................................................. 3
1.5
Keyboard shortcuts ................................................................................................... 3
1.6
For more information................................................................................................ 3
Installation of BlomDESKTOP ViewerTM ....................................................................... 4
2.1
Installation procedure............................................................................................... 4
2.2
Running the application ............................................................................................ 5
2.3
Licensing the application .......................................................................................... 5
2.4
2.5
3
4
2.3.1
Obtain the application code ............................................................................................ 6
2.3.2
License the application .................................................................................................... 6
Updating BlomDESKTOP ViewerTM............................................................................ 7
2.4.1
Automatic update via public URL .................................................................................... 7
2.4.2
Automatic update via local Intranet ................................................................................ 8
2.4.3
Manual update ................................................................................................................ 8
Connection via Proxy................................................................................................. 9
2.5.1
Manual proxy configuration .......................................................................................... 10
2.5.2
Proxy auto config with PAC file: .................................................................................... 10
BlomDESKTOP ViewerTM Overview............................................................................ 13
3.1
BlomDESKTOP ViewerTM Features........................................................................... 13
3.2
How to start working with BlomDESKTOP ViewerTM .............................................. 14
3.2.1
Run the application ....................................................................................................... 14
3.2.2
Add data sources ........................................................................................................... 15
3.2.3
Start working! ................................................................................................................ 18
Workspaces ............................................................................................................. 19
4.1
Creating or opening Workspaces ............................................................................ 19
4.1.1
On start up..................................................................................................................... 19
v
BlomDESKTOP ViewerTM User Guide v3.5 r1.0a
4.1.2
4.2
Saving your work .................................................................................................... 21
4.3
Opening an existing Workspace ............................................................................. 21
4.3.1
4.4
4.5
5
Master Workspace ........................................................................................................ 22
Elements of a Workspace ....................................................................................... 22
4.4.1
Data sources .................................................................................................................. 22
4.4.2
Windows........................................................................................................................ 23
4.4.3
Window Groups ............................................................................................................. 23
Managing elements in a Workspace ...................................................................... 23
4.5.1
Dataviews ...................................................................................................................... 23
4.5.2
Data sources .................................................................................................................. 25
4.5.3
Window Groups ............................................................................................................. 25
4.5.4
Windows........................................................................................................................ 26
4.5.5
Coordinates visualisation .............................................................................................. 34
Navigating through the Map Interface ...................................................................... 35
5.1
Panning the map..................................................................................................... 35
5.2
Zooming in and out ................................................................................................. 35
5.3
Switching views (ortho – oblique) ........................................................................... 36
5.3.1
6
Disabling the initial splash screen.................................................................................. 21
A note on Oblique Images ............................................................................................. 38
5.4
Resizing the screen.................................................................................................. 42
5.5
Magnifying Glass .................................................................................................... 42
Data Sources ............................................................................................................ 44
6.1
6.2
Blom libraries .......................................................................................................... 44
6.1.1
Discrete Imagery............................................................................................................ 44
6.1.2
Mosaic Imagery ............................................................................................................. 45
6.1.3
Terrain Models .............................................................................................................. 45
6.1.4
Library Metadata ........................................................................................................... 46
6.1.5
Accessing a Blom Library from BlomDESKTOP Viewer ............................................... 46
TM
BlomURBEXTM.......................................................................................................... 47
TM
6.2.1
BlomURBEX
Datasets ................................................................................................. 47
6.2.2
Adding BlomURBEX
6.2.3
Different credentials...................................................................................................... 49
6.2.4
Base Layer...................................................................................................................... 49
TM
as a Data Source ........................................................................ 48
vi
BlomDESKTOP ViewerTM User Guide v3.5 r1.0a
6.3
Accessing libraries metadata .................................................................................. 51
6.4
Showing Library Extents.......................................................................................... 52
6.5
Raster and Vector Overlays .................................................................................... 53
6.6
6.5.1
Supported formats ........................................................................................................ 53
6.5.2
A note on projections .................................................................................................... 54
6.5.3
Adding an Overlay ......................................................................................................... 54
6.5.4
Managing overlays ........................................................................................................ 56
Labelling Overlays ................................................................................................... 59
6.6.1
6.7
Changing the label style ................................................................................................ 60
Defining the zoom level for overlays....................................................................... 60
6.7.1
A note on zoom levels ................................................................................................... 61
6.8
Editing the base layer ............................................................................................. 62
6.9
LiDAR and BlomSTREET™ overlays.......................................................................... 63
6.10 Associating file types to BlomDESKTOP Viewer™ ................................................... 63
7
8
Measurement Tools ................................................................................................. 64
7.1
Length measurement .............................................................................................. 64
7.2
Area Measurement ................................................................................................. 65
7.3
Bearing Measurement ............................................................................................ 66
7.4
Elevation Measurement.......................................................................................... 67
7.5
Height Measurement .............................................................................................. 67
7.6
Façade Area Measurement..................................................................................... 68
7.7
Diagonal (Ladder) Measurement............................................................................ 69
7.8
Erase Button ........................................................................................................... 70
7.9
Changing the style of the measurements ............................................................... 70
Geocoding................................................................................................................ 71
8.1
Searching for an address with OpenStreetMap...................................................... 71
8.1.1
Where am I? Option ...................................................................................................... 72
8.2
Search by coordinates ............................................................................................. 73
8.3
Searching for an address from SHP file information............................................... 74
8.3.1
Create shapefile based geocoding ................................................................................. 74
8.3.2
Delete shapefile based geocoding ................................................................................. 76
vii
BlomDESKTOP ViewerTM User Guide v3.5 r1.0a
8.3.3
9
Set active geocoding ...................................................................................................... 76
Annotation tools ...................................................................................................... 77
9.1
Annotation layers.................................................................................................... 77
9.2
Drawing elements ................................................................................................... 78
9.2.1
Adding points ................................................................................................................ 78
9.2.2
Drawing lines ................................................................................................................. 78
9.2.3
Drawing polygons .......................................................................................................... 79
9.2.4
Labelling annotations .................................................................................................... 79
9.3
Symbology............................................................................................................... 80
9.4
Symbology Editor .................................................................................................... 81
9.5
9.4.1
Points Symbology .......................................................................................................... 81
9.4.2
Multilines symbology .................................................................................................... 82
9.4.3
Polygon symbology........................................................................................................ 82
Editing symbology................................................................................................... 83
9.5.1
Editing vertices .............................................................................................................. 83
9.5.2
Editing features ............................................................................................................. 84
10 BlomSTREET™ data................................................................................................... 85
10.1 Accessing BlomSTREET™ data ................................................................................ 85
10.2 BlomSTREET™ Navigation ....................................................................................... 86
10.2.1
The map window ........................................................................................................... 87
10.2.2
The BlomSTREET™ window ........................................................................................... 89
10.3 Measuring on BlomSTREET™ data .......................................................................... 90
10.3.1
A note on measurement on BlomSTREET™ data ........................................................... 90
10.3.2
Measuring Points ........................................................................................................... 91
10.3.3
Measuring Lines............................................................................................................. 93
10.3.4
Measuring Heights......................................................................................................... 94
10.3.5
Plane measurements ..................................................................................................... 95
10.3.6
Volume measurements ................................................................................................. 96
10.3.7
Deleting measurements ................................................................................................ 96
10.4 Printing BlomSTREET™ data ................................................................................... 96
10.5 Export BlomSTREET™ data...................................................................................... 97
10.6 Vector data on BlomSTREET™................................................................................. 98
viii
BlomDESKTOP ViewerTM User Guide v3.5 r1.0a
11 Connection to external WMS Servers ........................................................................ 99
11.1 Adding a WMS layer ............................................................................................... 99
11.2 Modifying the list of services ................................................................................ 104
11.3 Low-performance WMS Servers ........................................................................... 104
12 3D capabilities ....................................................................................................... 105
12.1 Opening a 3D window........................................................................................... 105
12.2 Synchronizing views .............................................................................................. 106
12.3 Navigating through the 3D models ...................................................................... 107
12.3.1
Navigation Pad ............................................................................................................ 108
12.3.2
Mouse controls ............................................................................................................ 108
12.3.3
Keyboard controls ....................................................................................................... 108
13 LiDAR datasets ....................................................................................................... 109
13.1 Introduction .......................................................................................................... 109
13.2 Accessing LiDAR data ............................................................................................ 109
13.2.1
LiDAR data via BlomURBEX™ ....................................................................................... 109
13.2.2
LiDAR data from local files ........................................................................................... 111
13.2.3
Change LiDAR point size .............................................................................................. 113
13.2.4
Supported LiDAR Files ................................................................................................. 113
13.3 Navigating through the LiDAR models ................................................................. 114
13.4 Visualisation options ............................................................................................. 114
13.4.1
Classification-based ..................................................................................................... 115
13.4.2
Classification with intensity based. ............................................................................. 116
13.4.3
Height HSV based ........................................................................................................ 117
13.4.4
Height HSV with intensity based ................................................................................. 118
13.4.5
Height (rotating colour) based .................................................................................... 119
13.4.6
Height (rotating colour) with intensity based .............................................................. 120
13.4.7
Intensity based ............................................................................................................ 121
13.4.8
Real Colour .................................................................................................................. 122
13.4.9
Real Colour with intensity based ................................................................................. 123
13.5 Customizing LiDAR Views...................................................................................... 123
13.5.1
Custom Classification................................................................................................... 124
13.5.2
Custom Height ............................................................................................................. 125
13.5.3
Custom True Colour..................................................................................................... 126
ix
BlomDESKTOP ViewerTM User Guide v3.5 r1.0a
13.5.4
Custom Point Intensity ................................................................................................ 127
13.6 LiDAR profiles ........................................................................................................ 127
13.6.1
Toolbar in LiDAR profile ............................................................................................... 131
14 Image tools ............................................................................................................ 143
14.1 Opening images in a new window ........................................................................ 144
14.2 Searching images .................................................................................................. 144
14.3 Exporting images .................................................................................................. 146
14.4 Exporting layers .................................................................................................... 146
14.5 Printing ................................................................................................................. 148
14.5.1
Advanced Print Settings – Printing Ortho mosaic images. .......................................... 149
14.5.2
Advanced Print Settings – Printing discrete images. ................................................... 151
15 Customising your environment ............................................................................... 152
15.1 BlomDESKTOP ViewerTM Settings .......................................................................... 152
15.1.1
Oblique orientation ..................................................................................................... 153
15.1.2
Magnifying tool options .............................................................................................. 154
15.1.3
Selection of unit system in measurements ................................................................. 154
15.1.4
Projection to display coordinates ................................................................................ 154
15.1.5
Crosshair ...................................................................................................................... 154
15.1.6
Enabling workspace selection at start-up .................................................................... 155
15.1.7
Checking updates at startup ........................................................................................ 155
15.1.8
Manual/Automatic proxy configuration ...................................................................... 155
15.2 Change language .................................................................................................. 155
16 BlomDESKTOP Remote Invocation™ ....................................................................... 157
16.1 Introduction .......................................................................................................... 157
16.2 Available Commands ............................................................................................ 157
16.2.1
Command Syntax ......................................................................................................... 157
16.2.2
Valid Command Fields ................................................................................................. 158
16.2.3
Process Flowchart........................................................................................................ 158
16.3 Testing BlomDESKTOP Remote Invocation™ ........................................................ 160
16.4 Running BlomDESKTOP Viewer™ from a batch file .............................................. 162
16.4.1
Configuring the Batch file ............................................................................................ 164
16.5 Limitations ............................................................................................................ 165
x
BlomDESKTOP ViewerTM User Guide v3.5 r1.0a
16.6 Starting BlomDESKTOP Viewer™ with command-line arguments ........................ 165
17 The BlomDESKTOP ViewerTM Help menu ................................................................. 166
17.1 Open BlomDESKTOP ViewerTM user manual ......................................................... 166
17.2 What’s new? ......................................................................................................... 166
17.3 Check now for updates…....................................................................................... 166
17.4 About BlomDESKTOP ViewerTM… .......................................................................... 166
xi
BlomDESKTOP ViewerTM User Guide v3.5 r1.0a
INDEX of FIGURES
Figure 1: Blom Products Value Chain ............................................................................................................... 1
Figure 2: Admin rights are needed for installation .......................................................................................... 4
Figure 3: BlomDESKTOP License Agreement.................................................................................................... 5
Figure 4: Application Icons ............................................................................................................................... 5
Figure 5: About… Dialog box ............................................................................................................................ 6
Figure 6: License Manager................................................................................................................................ 7
Figure 7: Autoupdate on start .......................................................................................................................... 8
Figure 8: Proxy Configuration ........................................................................................................................... 9
Figure 9: Manual Proxy Configuration ........................................................................................................... 10
Figure 10: BlomDESKTOP Viewer™ icon in the windows start menu ........................................................... 14
Figure 11: BlomDESKTOP Viewer™ Main Screen ........................................................................................... 15
Figure 12: Adding Datasources ....................................................................................................................... 16
Figure 13: Introducing BlomURBEX™ credentials .......................................................................................... 16
Figure 14: Browse library ................................................................................................................................ 17
Figure 15: Initial Workspace selection ........................................................................................................... 19
Figure 16: Create new workspace .................................................................................................................. 20
Figure 17: Empty BlomDESKTOP Viewer™ screen ......................................................................................... 20
Figure 18: Opening a Workspace from the main window ............................................................................. 22
Figure 19: BlomURBEX™ credentials .............................................................................................................. 25
Figure 20: Moving windows ........................................................................................................................... 27
Figure 21: Docking arrows appear when moving a window ......................................................................... 28
Figure 22: Docking area appears when the mouse moves over a docking arrow ........................................ 28
xii
BlomDESKTOP ViewerTM User Guide v3.5 r1.0a
Figure 23: Moving a window over another window ..................................................................................... 29
Figure 24: window will dock to the right of window 1 .................................................................................. 29
Figure 25: Bring window to Front................................................................................................................... 30
Figure 26: Dual view screen ............................................................................................................................ 32
Figure 27: Blocking a window ......................................................................................................................... 33
Figure 28: Zoom in action ............................................................................................................................... 36
Figure 29: windowed zoom ............................................................................................................................ 36
Figure 30: Ortho View to be changed to North View .................................................................................... 37
Figure 31: North View ..................................................................................................................................... 38
Figure 32: South View ..................................................................................................................................... 38
Figure 33: Natural Oblique Image .................................................................................................................. 39
Figure 34: Orthorrectified Oblique ................................................................................................................. 39
Figure 35: Selection of Intelligent Mode for Obliques................................................................................... 40
Figure 36: Natural Oblique Mode ................................................................................................................... 41
Figure 37: Ortorectified oblique mode .......................................................................................................... 41
Figure 38: The Magnifying Glass tool ............................................................................................................. 43
Figure 39: Browse library folder ..................................................................................................................... 46
Figure 40: Guide map opened ........................................................................................................................ 47
Figure 41: BlomURBEX™ connection settings ................................................................................................ 49
Figure 42: Base layer year range selection..................................................................................................... 50
Figure 43: Accessing Library Metadata .......................................................................................................... 51
Figure 44: Available layers .............................................................................................................................. 51
Figure 45: Library Metadata ........................................................................................................................... 52
Figure 46: Selecting an extent to show .......................................................................................................... 52
xiii
BlomDESKTOP ViewerTM User Guide v3.5 r1.0a
Figure 47: Extent displayed ............................................................................................................................ 53
Figure 48: Add overlay data............................................................................................................................ 55
Figure 49: Selection of Projection System ..................................................................................................... 55
Figure 50: Projection Selection ....................................................................................................................... 56
Figure 51: Metadata view from a vector file ................................................................................................. 57
Figure 52: Several geometries are selected and shown on screen ............................................................... 58
Figure 53: Filtering Metadata ......................................................................................................................... 58
Figure 54: Labelling Vectors ........................................................................................................................... 59
Figure 55: Labelling Editor .............................................................................................................................. 60
Figure 56: Selection of Range of Zoom Levels ............................................................................................... 61
Figure 57: Resolution per zoom level ............................................................................................................. 62
Figure 58: Add overlay from data source ....................................................................................................... 62
Figure 59: Overlay named “Streets” on top of imagery ................................................................................ 63
Figure 60: Length Measurement .................................................................................................................... 65
Figure 61: Area Measurement ........................................................................................................................ 66
Figure 62: Bearing Calculation ....................................................................................................................... 66
Figure 63: Elevation Measurement ................................................................................................................ 67
Figure 64: Height Measurement..................................................................................................................... 68
Figure 65: Measuring façade area: Define baseline first… ............................................................................ 69
Figure 66: …Then continue defining the area ................................................................................................ 69
Figure 67: … Finally, double click to get the measurement........................................................................... 69
Figure 68: Diagonal Measurement ................................................................................................................. 70
Figure 69: Geocoding tool............................................................................................................................... 71
Figure 70: Geocoding results .......................................................................................................................... 72
xiv
BlomDESKTOP ViewerTM User Guide v3.5 r1.0a
Figure 71: Where Am I? .................................................................................................................................. 72
Figure 72: Configure Geocoding Options ....................................................................................................... 74
Figure 73: Geocoding options configured ..........................................................¡Error! Marcador no definido.
Figure 74: Annotation Tools ........................................................................................................................... 77
Figure 75: Annotation Layer created.............................................................................................................. 77
Figure 76: No annotation layer available ....................................................................................................... 78
Figure 77: Labelling Dialog Box....................................................................................................................... 79
Figure 78: New Label....................................................................................................................................... 80
Figure 79: Annotation layers with different symbology................................................................................ 80
Figure 80: Symbology Editor: Points .............................................................................................................. 81
Figure 81: Symbology Editor: Multilines ........................................................................................................ 82
Figure 82: Symbology Editor: Polygons .......................................................................................................... 82
Figure 83: A polygon to edit ........................................................................................................................... 83
Figure 84: The vertex is clicked....................................................................................................................... 84
Figure 85: The vertex is dragged to the new position ................................................................................... 84
Figure 86: The BlomSTREET™ data windows ................................................................................................. 86
Figure 87: BlomSTREET™ scenario.................................................................................................................. 87
Figure 88: Magnifying Glass on BlomSTREET™ image ................................................................................... 87
Figure 89: Filtering BlomSTREET™ data by date ............................................................................................ 88
Figure 90: The triangle rotates according to the BlomSTREET™ view .......................................................... 88
Figure 91: Date of the BlomSTREET™ image .................................................................................................. 89
Figure 92: Measurement principles (1) .......................................................................................................... 90
Figure 93: Measurement Principles (2) .......................................................................................................... 91
Figure 94: Point Measurement. Step 1 ........................................................................................................... 91
xv
BlomDESKTOP ViewerTM User Guide v3.5 r1.0a
Figure 95: Point Measurement. Step 2 .......................................................................................................... 92
Figure 96: Point Measurement results ........................................................................................................... 92
Figure 97: Line Measurement. Step 1 ............................................................................................................ 93
Figure 98: Line Measurement. Step 2 ............................................................................................................ 93
Figure 99: Line Measurement. Step 3. ........................................................................................................... 94
Figure 100: BlomSTREET™ Height Measurement .......................................................................................... 95
Figure 101: Surface Measurement ................................................................................................................. 96
Figure 102: Exporting BlomSTREET™ imagery ............................................................................................... 97
Figure 103: Vector data over BlomSTREET™ image ....................................................................................... 98
Figure 104: Adding a WMS Layer ................................................................................................................... 99
Figure 105: Add WMS Layer Dialog Box ....................................................................................................... 100
Figure 106: Adding a new WMS Server ........................................................................................................ 100
Figure 107: WMS server parameters introduced ........................................................................................ 101
Figure 108: Server ready for connection ...................................................................................................... 101
Figure 109: WMS Server connected ............................................................................................................. 102
Figure 110: Selecting layers .......................................................................................................................... 102
Figure 111: Changing layer order ................................................................................................................. 103
Figure 112: The WMS Service is displayed ................................................................................................... 103
Figure 113: Different servers on the list....................................................................................................... 104
Figure 114: Opening a 3D View .................................................................................................................... 105
Figure 115: 3D window created.................................................................................................................... 106
Figure 116: Synchronized 2D and 3D views ................................................................................................. 107
Figure 117: 3D Navigation Pad ..................................................................................................................... 108
Figure 118. LiDAR area button ..................................................................................................................... 109
xvi
BlomDESKTOP ViewerTM User Guide v3.5 r1.0a
Figure 119: Selecting the LiDAR area to visualise ........................................................................................ 110
Figure 120: LiDAR Model loaded .................................................................................................................. 110
Figure 121: The Projections dialog box ........................................................................................................ 111
Figure 122: LiDAR area shown over the baselayer ...................................................................................... 111
Figure 123: Fit the LiDAR area to the current viewport .............................................................................. 112
Figure 124: LiDAR file loaded in 3D Window ............................................................................................... 113
Figure 125: Menu with different ways of view ............................................................................................ 114
Figure 126: LiDAR data in classification-based view.................................................................................... 115
Figure 127: LiDAR data in classification with intensity based view ............................................................ 116
Figure 128: LiDAR data with height HSV colour ........................................................................................... 117
Figure 129: LiDAR data with height HSV colour with intensity based ........................................................ 118
Figure 130: LiDAR data in height-based view .............................................................................................. 119
Figure 131: LiDAR data with height HSV with intensity based.................................................................... 120
Figure 132: LiDAR data with intensity based ............................................................................................... 121
Figure 133: LiDAR data with True colour ..................................................................................................... 122
Figure 134: LiDAR data True color with intensity based ............................................................................. 123
Figure 135: Custom Classification................................................................................................................. 124
Figure 136: Custom Height ........................................................................................................................... 125
Figure 137: Custom True Colour ................................................................................................................... 126
Figure 138: Custom Intensity ........................................................................................................................ 127
Figure 139. LiDAR profile buttons................................................................................................................. 128
Figure 140: LiDAR profile .............................................................................................................................. 128
Figure 141: LiDAR Profile Options ................................................................................................................ 129
Figure 142: The Magnifying tool in the LiDAR Profile Viewer ..................................................................... 130
xvii
BlomDESKTOP ViewerTM User Guide v3.5 r1.0a
Figure 143: Add a new point......................................................................................................................... 132
Figure 144: Horizontal measurement........................................................................................................... 133
Figure 145: Vertical measurement ............................................................................................................... 134
Figure 146: Free measurement .................................................................................................................... 135
Figure 147: Fit to window ............................................................................................................................. 136
Figure 148: Printer Dialog ............................................................................................................................. 137
Figure 149: Save as dialog............................................................................................................................. 137
Figure 150: LiDAR profile .............................................................................................................................. 138
Figure 151: Mouse guides on........................................................................................................................ 139
Figure 152: Grids off...................................................................................................................................... 140
Figure 153: Stats on ...................................................................................................................................... 140
Figure 154: Max and Min lines ..................................................................................................................... 141
Figure 155: LIDAR point size 1 ...................................................................................................................... 142
Figure 156: LIDAR point size 3 ...................................................................................................................... 143
Figure 157: Search images ............................................................................................................................ 145
Figure 158: Exporting image ......................................................................................................................... 146
Figure 159: Select projection to export file.................................................................................................. 147
Figure 160: Exporting file to SHP .................................................................................................................. 148
Figure 161: BlomDESKTOP Viewer™ Preferences ........................................................................................ 152
Figure 162: PuTTY Configuration .................................................................................................................. 160
Figure 163: Server ready ............................................................................................................................... 161
Figure 164: Valid Command Received.......................................................................................................... 161
Figure 165: Invalid Command Received ....................................................................................................... 161
xviii
BlomDESKTOP ViewerTM User Guide v3.5 r1.0a
SECTION 1
BlomDESKTOP ViewerTM Overview
1
BlomDESKTOP ViewerTM User Guide v3.5 r1.0a
1
What is BlomDESKTOP ViewerTM?
BlomDESKTOP ViewerTM is a windows desktop application that allows its users to manage, visualize
and work with Blom image libraries and local data sources.
BlomDESKTOP ViewerTM offers advanced visualisation, geocoding and measurement capabilities
and also allowing connection to the BlomURBEXTM and the BlomURBEX 3DTM geoservers.
BlomURBEXTM and BlomURBEX 3DTM are two online services provided by Blom from several
computing centres worldwide, offering a revolutionary collection of geographical datasets showing
urban environments in high-definition imagery and 3D textured models, extracted from at least five
different views and accurately geo-referenced to fulfill both end consumer expectations and
professional/engineering requirements.
BlomDESKTOP ViewerTM provides a full integration of online and offline (local or intranet-based)
data sources, making it possible for its users to add new data sources to their image libraries in a
quick, convenient way. BlomDESKTOP ViewerTM is an end-user application and as such, is located on
top of the Blom Product Value Chain.
Applications
• BlomWEB™ Viewer
• BlomDESKTOP™ Viewer
Services
• BlomURBEX™
• BlomURBEX 3D™
Data Models
• Blom3D™
• BlomOBLIQUE™
• BlomORTHO™
• BlomHISTORICAL™
Figure 1: Blom Products Value Chain
Future versions of BlomDESKTOP ViewerTM will include additional tools and functionalities and will
allow for greater interface customisation capabilities.
1
BlomDESKTOP ViewerTM User Guide v3.5 r1.0a
1.1
What is in this document?
This document is a user guide for BlomDESKTOP ViewerTM. It provides a simple but detailed user
manual covering the installation and licensing of the application, the installation of new data
libraries, and a description of all of its features.
1.2
Supported Platforms (system requirements)
BlomDESKTOP ViewerTM is supported by the following operating systems:
•
Windows Server 2003 and 2008, windows XP, windows Vista and windows 7.
The software requires Microsoft .NET Framework 3.5. This package is included in the installer so
there is no need to install it before BlomDESKTOP ViewerTM.
Hardware requirements:
Minimum requirements for 32-bit windows versions:
•
Intel® Pentium® IV or AMD Athlon® XP or higher processor
•
512 MB RAM (1 GB recommended)
•
500 MB swap space (2 GB recommended)
•
Hardware-accelerated OpenGL® and Direct3D supported graphics device
•
Microsoft windows-compliant
IntelliMouse®)
pointing
device
(optimized
for
Microsoft
Minimum requirements for 64-bit windows versions:
1.3
•
Intel® EM64T, AMD Athlon® 64 or higher, AMD Opteron® processor
•
1 GB RAM (4 GB recommended)
•
500 MB swap space (2 GB recommended)
•
Hardware-accelerated OpenGL® and Direct3D supported graphics device.
•
Microsoft windows-compliant
IntelliMouse)
pointing
device
(optimized
for
Microsoft
Document Organisation
This document is divided in two sections.
•
Section 1 is this introduction, covering an overview of BlomDESKTOP ViewerTM, its role, and
its installation procedure.
•
Section 2 is the BlomDESKTOP ViewerTM User Guide, detailing all of its features and tools.
2
BlomDESKTOP ViewerTM User Guide v3.5 r1.0a
1.4
Naming conventions
Throughout this manual you will find several references to menu options. Menu options are usually
organized as drop-down menus. To specify a given menu option, it will be shown in bold text,
starting with the first menu option and going down to the final one, separating each option by an
“arrow” (->) symbol.
For instance, the Quit option to exit the application, located under the File menu, will be
referred to as:
File -> Quit
Common mouse actions are referenced in a simplified way.
When you need to press the right mouse button on a given point to do something, this
action will be described as Right-click the point.
In the same way, when you need to press the left mouse button on a given point to do
something, this action will be described as Left-click the point.
1.5
Keyboard shortcuts
The following keyboard shortcuts are defined in the application:
•
•
•
•
•
1.6
[CTRL + F]
[F11]
[CTRL + S]
[F2]
[CTRL + Q]
Toggle Fullscreen On/Off
Toggle Fullscreen On/Off
Save current workspace
Save current workspace
Quit application
For more information
The Product Roadmap for BlomDESKTOP ViewerTM detailing the content of future releases of the
product is available separately by request, as well as the Product Factsheet. Contact your local
Blom representative for access to these documents.
3
BlomDESKTOP ViewerTM User Guide v3.5 r1.0a
2
2.1
Installation of BlomDESKTOP ViewerTM
Installation procedure
BlomDESKTOP ViewerTM is a windows desktop client application that is installed on individual
desktop/laptop computers.
The installation information and the application files are contained within an installation package
commonly known as "MSI file", from their default file extension. There are two ways to access the
BlomDESKTOP ViewerTM MSI:
a) Provided to you by a Blom representative on an installation CD
b) Via a download URL.
To install BlomDESKTOP ViewerTM simply double-click on the MSI file to start the installation
process.
Please note that you will require administration privileges in order to install the application,
otherwise an error message will appear as shown below. Contact your local IT manager if the error
message shown below appears.
Figure 2: Admin rights are needed for installation
The installation process will require that you read and accept the BlomDESKTOP Viewer™ License
Agreement. Use the scroll bar to read the license terms, and click on the I Agree button to accept
them. The installation process will not resume unless the license agreement is accepted.
4
BlomDESKTOP ViewerTM User Guide v3.5 r1.0a
Figure 3: BlomDESKTOP License Agreement
The application will be installed at:
%ProgramFiles%/BLOM/BlomDESKTOP Viewer
2.2
Running the application
To run the application, just double-click on the icon located at:
a) Your computer desktop screen
b) The windows™ Start menu, inside the Blom programs group.
Figure 4: Application Icons
2.3
Licensing the application
In order to be able to use the BlomDESKTOP ViewerTM you will need a valid license file for your
computer and associated libraries. Licensing the application can be done in two simple steps:
5
BlomDESKTOP ViewerTM User Guide v3.5 r1.0a
•
•
Obtain your application code
Install the license file
2.3.1 Obtain the application code
The first step to license your copy of BlomDESKTOP ViewerTM is to obtain your application code.
Open the application and go to the Help -> About BlomDESKTOP Viewer… option. The following
dialog box will show:
Figure 5: About… Dialog box
Your application code is shown in the grey box. You can use the Copy to clipboard button to copy
this application code so you can paste it into an e-mail (or other document). Send this e-mail or
document to your local Blom sales representative including the following information:
•
•
•
Your name and company, along with e-mail and contact details.
Your application code
The Blom data libraries that you want to license (name and year of the library)
Your license file will be generated and send back to you via e-mail.
2.3.2 License the application
Once you have received your license file, save it on your computer in a safe location.
Then, open your copy of BlomDESKTOP ViewerTM and go to the Settings –> License Manager…
option. A dialog box will open showing all available license files on your machine.
6
BlomDESKTOP ViewerTM User Guide v3.5 r1.0a
Figure 6: License Manager
If your name does not appear on the list, click on the Add new license… button and browse your
computer to find the location of your licence file. Remember that license files have the .bfslic
extension. Once found, select it and click the Open button.
Your license will now be displayed and you can close the License manager dialog box. Your copy of
BlomDESKTOP ViewerTM is now ready to be used with your set of data libraries.
Note: License servers will be available on future versions of BlomDESKTOP ViewerTM.
2.4
Updating BlomDESKTOP ViewerTM
Blom is continuously updating its products, adding new features or improving functionality.
Whenever a new version of BlomDESKTOP ViewerTM is released, there are three possible methods
to update your current version.
a) Automatic update via public URL
b) Automatic update via your local Intranet
c) Manual update via installation file
2.4.1 Automatic update via public URL
BlomDESKTOP ViewerTM connects to a BlomURBEXTM service on start (if an internet connection is
available), to search for possible updates. If your company security policy allows for external
update of applications, then this service will point to a Blom public URL where the new MSI files are
located. Depending on the kind of update, these can be optional or mandatory.
7
BlomDESKTOP ViewerTM User Guide v3.5 r1.0a
If a new version is found, BlomDESKTOP ViewerTM will ask you if you want to update your current
one.
Figure 7: Autoupdate on start
If you want to update your current version, click on Install new version. The new MSI will be
automatically downloaded and installed. Otherwise click Continue… to update your application
later.
If you want to avoid the automatic update process, you can check the Check for updates at startup
option. You can later search manually for updates using the help menu (see chapter 17).
2.4.2 Automatic update via local Intranet
If your company policy does not allow the installation of software from the Internet, the possibility
of automatic updates still exists, but the location of the MSI files can be a shared folder on your
local intranet or a simple web service. This must be configured by your IT administrator.
In order for the individual BlomDESKTOP ViewerTM licenses to connect to the local update server,
your local IT team will need to configure a private windows registry entry so the software can
connect to the internal update server. For more information on this, please contact your local Blom
representative.
Once this is done, the update procedure is exactly the same as the described on section 2.4.1.
2.4.3 Manual update
The final option for updating your version of BlomDESKTOP ViewerTM is to get a copy of the
installation files. Your local Blom representative will inform you of the release of newer version and
will either send you the installation files, or provide you a URL to download.
Once the new version files are received, uninstall the previous version using the uninstall version
on the windows application menu. After that, double-click on the new MSI file to install the new
version as described in section 2.1.
8
BlomDESKTOP ViewerTM User Guide v3.5 r1.0a
2.5
Connection via Proxy
BlomDESKTOP ViewerTM requires a connection to the Internet for the following functions:
a) When trying to access the BlomURBEX™ geoserver
b) When trying to auto update the application from a public URL
If your connection to the Internet is through a Proxy server that requires authentication,
BlomDESKTOP ViewerTM will detect it and it will show the following dialog box:
Figure 8: Proxy Configuration
The IP address of your proxy is shown; whereas the username and password need to be manually
configured. Contact your local IT department for details on these credentials.
9
BlomDESKTOP ViewerTM User Guide v3.5 r1.0a
2.5.1 Manual proxy configuration
If your proxy is configured using automatic configuration scripts, the proxy will not be detected and
must be configured manually or you can use the PAC file (Proxy auto-config file). To do so, open the
Settings->Preferences… dialog box and check the Configure manually option at the bottom of the
dialog box.
Figure 9: Manual Proxy Configuration
Then type the IP address of your proxy server and the port used. You can use the Test Proxy button
to check if the proxy server can be accessed from the application.
If you are executing BlomDESKTOP Viewer™ without local administrator rights, the application will
not be able to obtain the proxy parameters so you will need to configure it manually as explained
here.
2.5.2
Proxy auto config with PAC file:
A proxy auto-config (PAC) file defines how web browsers and other user agents can automatically
choose the appropriate proxy server (access method) for fetching a given URL.
10
BlomDESKTOP ViewerTM User Guide v3.5 r1.0a
A PAC file contains a JavaScript function "FindProxyForURL(url, host)". This function returns a
string with one or more access method specifications. These specifications cause the user agent to
use a particular proxy server or to connect directly.
The Proxy auto-config file format was originally designed by Netscape in 1996 for the Netscape
Navigator 2.0 and is a text file that defines at least one JavaScript function, FindProxyForURL(url,
host), with two arguments: url is the URL of the object and host is the hostname derived from that
URL. By convention, the PAC file is normally named proxy.pac. The WPAD standard uses wpad.dat.
To use it, a PAC file is published to a web server, and client user agents are instructed to use it,
either by entering the URL in the proxy connection settings of the browser or through the use of
the WPAD protocol.
Even though most clients will process the script regardless of the MIME type returned in the HTTP
request, for the sake of completeness and to maximize compatibility, the web server should be
configured to declare the MIME type of this file to be either application/x-ns-proxy-autoconfig or
application/x-javascript-config.
There is little evidence to favor the use of one MIME type over the other. It would be, however,
reasonable to assume that application/x-ns-proxy-autoconfig will be supported in more clients than
application/x-javascript-config as it was defined in the original Netscape specification, the latter
type coming into use more recently.
A very simple example of a PAC file is:
function FindProxyForURL(url, host)
{ return "PROXY proxy.example.com:8080; DIRECT";
}
11
BlomDESKTOP ViewerTM User Guide v3.5 r1.0a
SECTION 2
BlomDESKTOP ViewerTM User Guide
12
BlomDESKTOP ViewerTM User Guide v3.5 r1.0a
3
3.1
BlomDESKTOP ViewerTM Overview
BlomDESKTOP ViewerTM Features
BlomDESKTOP ViewerTM is a windows desktop application that allows its users to work with Blom
image libraries and also to connect to BlomURBEXTM, making it possible to access more than 4000
hi-resolution cities in Europe and vector map data for all of Europe.
BlomDESKTOP ViewerTM features are:
•
Multiple data sources management: BlomDESKTOP ViewerTM allows users to work
simultaneously with different data sources.
• Blom image libraries
• BlomURBEXTM online geoserver
• Raster files (georreferenced JPG, TIF, GIF and PNG, supported)
• Vector files (SHP, KML and GML files, supported)
• Connection to External WMS Servers
• 3D capabilities via BlomURBEX 3D™ (online connection)
• LiDAR capabilities (via LAS files and online via BlomURBEX™ connection)
• BlomSTREET™ spherical imagery
•
Navigation capabilities: BlomDESKTOP ViewerTM allows users to search information
and navigate through it in several ways.
• Geocoding tool
• Coordinates search
• Zoom and pan
• Display of ortho and oblique imagery as well as vector map data.
• Dual View and Multi View
• Street map overlay on Ortho and Oblique imagery (via BlomURBEXTM)
• Multiple Oblique views for every point, easy to select
• Annotation capabilities (points, lines and areas)
• Magnifying Glass tool
•
Measurement toolkit: BlomDESKTOP ViewerTM provides a powerful set of
measurement tools that allow users to perform calculations directly on the images
without the need of coding or use of external GIS Tools.
• Length tool
• Area tool
• Height tool
• Bearing tool
• Elevation tool
•
Export and Print capabilities: BlomDESKTOP ViewerTM lets you export the imagery
to different formats as well as directly to a printer.
13
BlomDESKTOP ViewerTM User Guide v3.5 r1.0a
Future versions of BlomDESKTOP ViewerTM will include additional features. Refer to the
BlomDESKTOP ViewerTM Product Roadmap and the What’s New file for additional information.
The following sections detail all of these features.
3.2
How to start working with BlomDESKTOP ViewerTM
This section details how to start your first session with BlomDESKTOP ViewerTM in three easy steps:
a. Run the application and select a Workspace
b. Add some data sources
c. Start working!
This section assumes that BlomDESKTOP ViewerTM is already installed on your system. Refer to
section 2.1 for additional information.
3.2.1 Run the application
To run BlomDESKTOP ViewerTM, double-click on the desktop icon or select it via the windows Start
menu.
Figure 10: BlomDESKTOP Viewer™ icon in the windows start menu
Once the application starts, it gives the option to open an existing Workspace, or to create a new
one. If this is your first session with BlomDESKTOP ViewerTM just click on the Create new
Workspace… button; otherwise select an existing Workspace from the list or click the Browse for
Workspace… button to search for a previously saved Workspace elsewhere. For a detailed
explanation on Workspaces refer to section 4.
Once the Workspace is selected or created, the BlomDESKTOP ViewerTM main screen will be
displayed.
14
BlomDESKTOP ViewerTM User Guide v3.5 r1.0a
Toolbar and menu bar
Imagery
date
Dataview
Explorer
Minimized
Windows
Figure 11: BlomDESKTOP Viewer™ Main Screen
On the left part of the screen (by default) the Dataview explorer is located. This window contains all
dataviews, data sources, windows and windows groups that you will be dealing with in your
Workspace. These items are explained in more detail in Chapter 4.
Note: this quick tutorial assumes that you already have a license for your copy of BlomDESKTOP
ViewerTM. Refer to section 2.3 for details on how to obtain and install your license.
3.2.2 Add data sources
Unless you are opening a previously created Workspace, you will need to define some data sources
to work with.
The current version of BlomDESKTOP ViewerTM works with two possible data sources:
•
•
Blom Libraries
The BlomURBEXTM server
To add a data source, simply right-click on the Dataview element in the Dataview explorer. A popup menu will appear.
15
BlomDESKTOP ViewerTM User Guide v3.5 r1.0a
Figure 12: Adding Datasources
If you want to add BlomURBEXTM as a data source, select the Add BlomURBEX as a Datasource…
option.
If you want to add a Blom library, select the Add local Blom library as a Datasource… option.
See chapter 6 for a detailed description of valid data sources in BlomDESKTOP ViewerTM.
3.2.2.1
BlomURBEXTM as data source
If you have valid credentials to access the BlomURBEXTM geoserver, and you have an internet
connection, you can add BlomURBEXTM as a data source to use in BlomDESKTOP ViewerTM.
To use BlomURBEXTM as a valid data source you need to first configure the connection in the
Settings -> BlomURBEX server connection… menu option. If you have not already done this,
BlomDESKTOP ViewerTM will ask you if you want to configure the connection.
The following dialog box will appear:
Figure 13: Introducing BlomURBEX™ credentials
Enter your username and password to access BlomURBEXTM and press ENTER or click the OK
Button.
16
BlomDESKTOP ViewerTM User Guide v3.5 r1.0a
If you entered this information when adding BlomURBEXTM as data source, a new window group
and view window will be created (if there was not one previously), and the BlomURBEXTM imagery
will be displayed from your starting login coordinates.
To enter this information from the Settings -> BlomURBEX server connection… menu option, you
will need to go to the Dataview explorer, right-click on the Dataview element and select the Add
BlomURBEX as a Datasource… option. A new window group and view window will be created (if
there was not one previously), and the BlomURBEXTM imagery will be displayed from your starting
login coordinates.
Note: If the current Workspace already has another datasource loaded and a view window, any
additional data sources that you define will be opened on the same window. In this case, the new
data source may not appear directly on screen depending on the current screen coordinates.
3.2.2.2
Local Blom libraries as data sources
To add a Blom local library, select the Add local Blom library as a Datasource… option on the popup menu in the Dataview explorer. A browse window will open.
Figure 14: Browse library
Select the location of your Blom Library and click the OK button. A new window group and view
window will be created (if there was not one previously), and the library data will be displayed from
your starting coordinates.
Note: If the current workspace already has another datasource loaded and a view window, any
additional data sources that you define will be opened on the same window. In this case, the new
data source may not appear directly on screen depending on the current screen coordinates.
17
BlomDESKTOP ViewerTM User Guide v3.5 r1.0a
Important: In order to be able to view and work with a given Blom library, you must have a valid
license for that library, otherwise, the library will not open on BlomDESKTOP ViewerTM. Contact
your local Blom representative for obtaining a valid license for your library.
3.2.3 Start working!
That’s it, now your data sources are configured and you can start adding other data sources,
navigating the imagery and using the different tools in BlomDESKTOP ViewerTM.
The following sections in this user manual will guide you on how to use the different available tools
and options.
18
BlomDESKTOP ViewerTM User Guide v3.5 r1.0a
4
Workspaces
This chapter describes the elements and features of Workspaces in BlomDESKTOP ViewerTM.
As described in section 3.2.1, BlomDESKTOP ViewerTM is based around using Workspaces.
A Workspace can be seen as a ‘Project’ where the user can define which data models and libraries
to use, define specific views and their function, add data files, etc… This Workspace can then be
saved so all the configuration can be easily retrieved later on. Several Workspaces can be created,
so users can manage and work with different projects on different data libraries or geographic
areas.
Workspaces are files with the .wksx extension. By default they are saved into the .\Workspaces
folder in the BlomDESKTOP ViewerTM installation folder.
4.1
Creating or opening Workspaces
4.1.1 On start up
When you run BlomDESKTOP ViewerTM a dialog box will open, allowing you to select or create a
Workspace.
Figure 15: Initial Workspace selection
4.1.1.1
Opening a saved Workspace
The latest saved Workspaces appear in the Select Workspace list. If you want to resume work with
that Workspace, just click on its name. You can also Browse for other workspaces by clicking on the
Browse for Workspace… option to open the File search dialog box.
19
BlomDESKTOP ViewerTM User Guide v3.5 r1.0a
You can also double click on a workspace file (*.wskx) in Windows Explorer to directly open
BlomDESKTOP Viewer™ and make it load that workspace.
4.1.1.2
Creating a new Workspace
If you want to create a new Workspace simply click on the Create new workspace… option. The
Save as… dialog box will allow you to enter the name of the new Workspace and where you want
to save it.
Figure 16: Create new workspace
Once saved, the Workspace will be created and BlomDESKTOP ViewerTM will open with an empty
view.
Figure 17: Empty BlomDESKTOP Viewer™ screen
Pressing Cancel will abort opening the BlomDESKTOP ViewerTM.
20
BlomDESKTOP ViewerTM User Guide v3.5 r1.0a
4.1.2 Disabling the initial splash screen
If you don’t want that the initial workspace selection window appears on start-up, click on the
Don’t show this screen again checkbox.
To activate this option again, go to the Settings->Preferences… option (Refer to Chapter 15)
4.2
Saving your work
You can save your Workspace configuration at any moment using the following File menu options:
•
•
•
Save Workspace: this option saves your current Workspace with the same name and path
Save Workspace as…: this option opens the Save as… dialog box letting saving your
Workspace with another name or location.
Save as master Worspace…: this option opens the Save as… dialog box letting saving your
Workspace as master workspace with another name or location.
Note: If the current Workspace has changed and you exit the application, BlomDESKTOP ViewerTM
will ask you if you want to save your changes.
See 4.3.1 Section Master workspace.
4.3
Opening an existing Workspace
Version 3.0 of BlomDESKTOP Viewer™ allows you to change workspaces from the main application
window. To do this simply click on File -> Open Workspace to open a submenu with the most
recently opened workspace files. Alternatively you can Browse… to another location.
21
BlomDESKTOP ViewerTM User Guide v3.5 r1.0a
Figure 18: Opening a Workspace from the main window
4.3.1 Master Workspace
Version 3.6.8 of BlomDESKTOP Viewer™ allows you to save your workspace as Master Workspace.
It allows the creator to share with more users. Even share the BlomURBEX credentials. Only the
owner of the master workspace can save or modify it. A master Workspace displays M icon in the
bottom left of the application.
This icon is displayed when you open a master workspace and not owner. You can open the
workspace and modify it but, can’t save the changes..
4.4
Elements of a Workspace
A Workspace is comprised of one or many Dataviews. A Dataview is the basic information unit in
BlomDESKTOP ViewerTM and is as a set of data, configurations and windows that display data.
BlomDESKTOP ViewerTM can include several Dataviews in a given Workspace to allow users to work
with libraries from different years, or manage BlomURBEXTM and Local Library data separately.
Dataviews contain:
•
•
•
Data sources
windows
window Groups
4.4.1 Data sources
A Data Source is a repository of complex cartographic data that can be managed by BlomDESKTOP
ViewerTM. In order to work with a Data Source it must be assigned to a Dataview in the Dataview
Explorer (see section 4.5)
22
BlomDESKTOP ViewerTM User Guide v3.5 r1.0a
Current version of BlomDESKTOP ViewerTM supports two different Data Sources:
•
•
Blom Libraries
BlomURBEXTM online services
The Data Sources are explained in detail in Chapter 6.
Dataviews treat any collection of data sources as a single entity. This means you can add any
number of Blom Libraries to a given Dataview, and BlomDESKTOP ViewerTM will navigate them all as
if through a single data source.
4.4.2 Windows
A window is required to display data from a Dataview. Each view will have its own window.
Whenever you add a Data Source to an empty Dataview, a window (and its associated window
Group, see below) is created in order to display the selected data.
Additional Data Sources can be added to the Dataview. These will be displayed in the default
window. Users can create as many windows as they need to display their data in any way they
need.
Windows also allow users to add data sources, raster or vector overlays to the current view. Refer
to Chapter 6 for additional information.
4.4.3 Window Groups
Window Groups are auxiliary elements used to group related window views together. You can add
any number of windows to a window Group and then configure the view of the associated Data
Source.
Using window Groups it is possible to show different views of a given area. Windows in a given
window Group can be synchronized, so scrolling or zooming in one will make all other windows in
the group move to the same position. You can also choose to exclude some windows from
synchronization, so they remain in a fixed position.
Window groups also provide a quick way to close several windows at the same time.
When you select Dual or Multi View modes a new window Group is automatically created to leave
your current window deployment unchanged. See Section 4.5.4 for details on Dual and Multi Views.
4.5
Managing elements in a Workspace
4.5.1 Dataviews
Whenever a new Workspace is created, it contains only a single, empty Dataview.
23
BlomDESKTOP ViewerTM User Guide v3.5 r1.0a
4.5.1.1
Adding contents to a Dataview
To add contents to any Dataview, just select it on the Dataview Explorer by right-clicking on it to
show the pop-up menu. You can add Data sources, windows and window Groups to any Dataview.
Available options in the Dataview menu are:
4.5.1.2
•
Add BlomURBEX server as a datasource…: this option allows you to define BlomURBEXTM
as valid data source for this Dataview. See section 3.2.2 for a quick description on this, and
refer to chapter 6 for a detailed description on data sources.
•
Add local Blom Library as a datasource…: this option allows you to select individual Blom
Libraries as valid data sources for this Dataview. See section 3.2.2 for a quick description on
this, and refer to chapter 6 for a detailed description on data sources.
•
New empty windows Group: This will create a new empty windows Group in the Dataview.
Nb - that whenever you add a Data Source to the Dataview, the appropriate window and
windows Group are created automatically to view the added Data Sources.
•
Open New window: This will create a new window and its associated window Group. If no
data sources are defined, the window will appear black. If Data Sources are added later,
they will be directed to that window so no additional windows will be created.
Creating additional Dataviews
You can add additional Dataviews to your Workspace. This will allow you to work separately in the
same project with different Data Sources or with Data Sources with different years of capture.
To add an additional DataView:
4.5.1.3
•
Go to File -> New Empty Dataview. The new Dataview will appear on the Dataview
Explorer.
•
Press the Create Empty Dataview icon on the icon toolbar.
Removing elements from a Dataview
You can remove any element from a given Dataview by right-clicking it and select Remove. You can
delete Data Sources, windows and window Groups.
To delete a Dataview, follow the same procedure, right-clicking on the Dataview and selecting the
Remove option.
When deleting an element inside the Dataview, all objects located on its tree will be deleted too.
This means that deleting a window Group will also delete all windows located in it, and deleting a
Dataview will also delete all Data Source, windows and window Groups located in it.
24
BlomDESKTOP ViewerTM User Guide v3.5 r1.0a
4.5.1.4
Renaming elements in a Dataview
Default names are given by BlomDESKTOP Viewer™ to all elements added to a Dataview. These
names can be edited for Windows, Window Groups and Annotations (see section 8).
To edit the name of a Dataview element, right click on it and select the Rename… option. The text
string in the Dataview will change to Edit mode. Type the new desired name and press ENTER to
finish.
4.5.2 Data sources
Valid Data Sources in BlomDESKTOP ViewerTM are Blom Libraries and the BlomURBEXTM geoserver
connection.
BlomDESKTOP ViewerTM also allows you to include additional data, such as georeferenced raster
files or vector files. These however are not considered Data Sources and are managed at window
level (see section 0 for details).
Once a data source is added to a Dataview you can right-click on them on the Dataview Explorer to
perform different actions according to the kind of Data Source. These actions are described below:
•
Configure BlomURBEXTM Server connection…: only appears on BlomURBEXTM Data
Sources. This option lets you enter your BlomURBEXTM credentials for accessing the
BlomURBEXTM data services inside BlomDESKTOP ViewerTM.
Figure 19: BlomURBEX™ credentials
•
Add another Blom Library…: only appears on Blom Libraries Data Sources. This option lets
you add additional Libraries to the Dataview.
•
Remove: selecting this option will remove the selected Data Source from the Dataview.
4.5.3 Window Groups
Window Groups are auxiliary elements used to help group related window views together.
25
BlomDESKTOP ViewerTM User Guide v3.5 r1.0a
A new window Group is created automatically when you add a Data Source to an empty Dataview.
You can add any number of window Groups to a Dataview by right-clicking on the Dataview in the
Dataview Explorer and selecting the New Empty windows Group option.
In addition you can perform the following actions on a window Group if you right-click on the
window Group in the Dataview Explorer to show the menu:
•
Open New window…: this option will create a new window in the selected window Group.
•
Synchronized: windows in a window Group can be synchronized, so actions performed in a
given window such as zooming or scrolling affect all other synchronized windows. If you
select the Synchronized option in the window Group menu, you will synchronize all
windows that are previously synchronized with all windows Groups marked as
synchronized.
See section 4.5.4.3 for details on synchronization of windows.
Example: We have three window Groups: A, B and C. Every window Group has three
windows numbered 1 to 3. If windows A1 and A2 are synchronized and windows B1 and B2
are also synchronized, and if windows Groups are marked as Synchronized, then windows
A1, A2, B1 and B2 will be Synchronized one to each other. All other windows in the example
will remain unsynchronized.
•
Remove: this option will delete the window Group and all related windows from the
Dataview.
4.5.4 Windows
Windows are the elements used in BlomDESKTOP ViewerTM to display data. Windows are always
associated to a window Group even if they are isolated with no sibling windows.
There are many possible options available for windows in BlomDESKTOP ViewerTM. Right-click on
any window in the Dataview Explorer to open the windows pop-up menu.
4.5.4.1
Moving windows
Windows in BlomDESKTOP ViewerTM are not fixed. You can click on the name area of a window to
move it around the user interface, or even position them away from the application main window.
Windows are fixed or docked by default. Use the “pin” icon to minimize them if needed. Minimized
windows names appear near the Dataview Explorer. Click on a window name to restore its view.
26
BlomDESKTOP ViewerTM User Guide v3.5 r1.0a
Window is docked.
Click the pin icon to
“unlock” it
Then click and drag to
move the Window
Figure 20: Moving windows
Windows can be docked to fixed positions in the BlomDESKTOP ViewerTM main window. When
dragging around to move the window you will notice that some arrows appear on the
BlomDESKTOP ViewerTM main window.
Docking arrows
27
BlomDESKTOP ViewerTM User Guide v3.5 r1.0a
Figure 21: Docking arrows appear when moving a window
Move the mouse cursor to the desired arrow. A blue area will appear showing the position and size
that the window will adopt when you release the mouse button.
Figure 22: Docking area appears when the mouse moves over a docking arrow
Windows docked in this way can be resized later using the mouse cursor on the sides of the
window.
If you move a window over another open window, additional icons will appear to let you drop the
window in a position relative to the other window.
28
BlomDESKTOP ViewerTM User Guide v3.5 r1.0a
Figure 23: Moving a window over another window
Figure 24: window will dock to the right of window 1
Finally, as in any other MS Windows TM application, use the ‘X’ icon to close the window.
29
BlomDESKTOP ViewerTM User Guide v3.5 r1.0a
4.5.4.2
Managing multiple windows
If you are using multiple windows, sometimes they can become hidden by the other windows in the
Group.
To bring a hidden window to the front of the screen, right-click on its name on the Dataview
Explorer and select the Bring to Front menu option.
Figure 25: Bring window to Front
Additionally, if you have many opened windows on screen, you can minimize all undesired windows
by right-clicking on the window or window name in the Dataview Explorer and select the Leave this
window alone option.
4.5.4.3
Synchronising windows
As the image information in Blom Libraries and BlomURBEXTM can contain several different views of
a given point, it is useful to have different windows open in a group to show these different views
of the point.
One of the options available is to have different views linked to each other, so when a zoom or
scroll action is performed on one window, all other modify their view accordingly.
In order to do this, simply decide the windows in a group that you want to synchronize and rightclick on them or on their name on the Dataview explorer and select the Synchronized option in the
30
BlomDESKTOP ViewerTM User Guide v3.5 r1.0a
menu. All windows in a window Group marked as Synchronized will change their view according to
any user interaction done on any one of the synchronized windows.
You can also synchronize windows in different window groups using the Synchronized option in the
window group menu as described in section 4.5.3.
Note: In version 3.0 onwards of BlomDESKTOP Viewer, the Synchronized status of any Window is
graphically shown by an Icon on the upper right corner of every window
“Synchronized” icon
Clicking on the “Synchronized” icon will change the Synchronized status of the Window on or off.
4.5.4.4
Dual and Multi View
A quick way to create multiple, synchronized views of data is to use the Dual and Multi View menu
options.
A Dual View is a set of two synchronized windows, one set to Ortho (Vertical) view, and the other
in Oblique view.
A Multi View is a set of five synchronized windows, showing the five possible orientations (Ortho,
North, East, South and West).
To create a quick Dual or Multi View:
•
Right-Click on a window name on the Dataview Explorer and select the Dual view or Multi
View menu option. A new window Group with the Dual or Multi view will be created in the
associated Dataview. The Dual or Multi view will display the approximate centre of the
latest selected window.
If the selected window is in Ortho view, the additional window will appear in North view,
otherwise, right window will appear in Ortho view.
31
BlomDESKTOP ViewerTM User Guide v3.5 r1.0a
Figure 26: Dual view screen
•
4.5.4.5
Select a window and right-click on any point on the screen to open the pop-up menu; then
select the Dual view or Multi view menu option. A new window group with the Dual or
Multi view will be created in the associated Dataview. The Dual or Multi view will display
using the selected point as the centre for the new view.
Blocking Images
Images in Blom Libraries and in the BlomURBEXTM server can be discrete or continuous (mosaic)
images. See chapter 6 for detailed information on this topic.
When working with discrete images, whenever a zoom or scroll action takes more than 50% of the
view out of the image boundaries, BlomDESKTOP ViewerTM will load another appropriate image
from the database (Library or Server) in order to keep the data visualization continuous.
There are occasions however, when it is needed to examine a given discrete image. To avoid the
automatic loading of the next image, right-Click on a window, or a window name on the Dataview
Explorer and select the Blocked Image menu option.
32
BlomDESKTOP ViewerTM User Guide v3.5 r1.0a
Figure 27: Blocking a window
Now, the selected view is ‘blocked’, so you can scroll the view without loading a different discrete
image, or zoom up and down without loading a different zoom level image.
Note: In version 3.0 onwards of BlomDESKTOP Viewer, the Blocked status of any Window is shown
by an Icon on the upper right corner of every window
“Blocked” icon
Clicking on the “Blocked” icon will change the Blocked status of the Window on or off.
Note: when searching for addresses or coordinates using the Go To… option (see chapter 5),
blocked windows are automatically un-blocked to be able to appropriately show the results of the
search function.
4.5.4.6
Adding overlays to a window view
BlomDESKTOP ViewerTM allows users to work with their own geographic data, such as vector files or
raster images. These external elements are not classed as Data Sources so they must be added to a
given view at window level.
33
BlomDESKTOP ViewerTM User Guide v3.5 r1.0a
•
To add a raster overlay on a window click on a window, or a window name on the Dataview
Explorer and select the Add Raster Overlay… menu option.
•
To add a vector overlay on a window click on a window, or a window name on the
Dataview Explorer and select the Add Vector Overlay… menu option.
•
To add a LiDAR overlay on a window click on a window or a window name on the Dataview
Explorer and select the Add LiDAR Overlay… menu option.
•
To add a BlomSTREET™ overlay on a window click on a window, or a window name on the
Dataview Explorer and select the Add BlomSTREET Overlay… menu option
The Open File dialog box will open to allow you to search the required file in your local drive or
network directory. Once selected, the data will be displayed as an overlay on top of the selected
imagery in the window.
Refer to Chapter 6 for a detailed description on overlays. Special overlays such as BlomSTREET™
and LiDAR are covered on Chapter 10 and 13, respectively.
4.5.5 Coordinates visualisation
The lower right corner of the BlomDESKTOP Viewer™ screen will show the coordinates of the last
point clicked on the active window. Default projection system is Latitude-Longitude (EPSG:4326).
This can be changed in the preferences dialog (see chapter 15).
Note: You can click on the shown coordinates to quickly copy them to the clipboard.
34
BlomDESKTOP ViewerTM User Guide v3.5 r1.0a
5
Navigating through the Map Interface
The main feature of the BlomDESKTOP ViewerTM is located in its map windows. These windows
allow the user to navigate through the geographical content provided by the BlomURBEXTM
geoserver or local libraries, as well as zooming and panning the imagery, adding overlays,
performing measurements, and searching for elements and addresses.
This section covers the basic controls for navigating the map control. Here you will learn to:
•
•
•
•
•
•
•
5.1
Move (pan) the maps on the window view
Zoom in and out in the current view
Switch views in a window
Resize the screen/window
Search by address
Search by coordinates
Using the Magnyfing Glass tool
Panning the map
To move the image displayed simply left-click and hold to pan around the area. The cursor will
change to a hand shape and then you can drag the image to the desired location. New map areas
will be retrieved from the libraries or the BlomURBEXTM server and shown on screen automatically
5.2
Zooming in and out
Blom geographic contents are organized in different zoom levels according to the resolution of the
imagery. For example standard 10cm urban areas are located at zoom level 20. There can be
additional levels for higher resolution areas.
To change the zoom level of the images displayed you can:
a) Use the mouse wheel. Move it upwards to zoom in, and downwards to zoom out.
b) Use the zoom control on the left side of the map. You can click on the + or - controls to zoom
by one level at a time, or move the slider for quicker zooming.
35
BlomDESKTOP ViewerTM User Guide v3.5 r1.0a
The mouse wheel will produce direct zoom level changes. If you want to zoom smoothly using
digital zoom, keep the SHIFT key pressed while moving the mouse wheel.
Figure 28: Zoom in action
c) Press and hold the shift-key and left-click and hold the mouse to draw a rectangle on screen.
The map will zoom to the area selected in the rectangle.
Figure 29: windowed zoom
5.3
Switching views (ortho – oblique)
Blom has the capability to produce oblique georeferenced imagery for the entire territory of
Europe. Images generated this way are a discontinuous set of images without re-projection that
cover all points of the terrain from four orientations (North, South, East, West) with a resolution
between 5 and 18 cm. per pixel depending on camera resolution. Because of the multiple passes
required by the aircraft to capture Oblique imagery, this guarantees that for each point of the
terrain, there may be up to 18 different images as a single point may appear in different oblique
images. BlomDESKTOP ViewerTM manages this set of images, isolating the user from the difficulties
inherent in working with them. It also provides tools to perform measurements on the images, so
36
BlomDESKTOP ViewerTM User Guide v3.5 r1.0a
that users can for example, calculate the height of buildings on the images themselves, and extract
detailed information.
In order to switch to a different view, use the view control located on the upper left side of the map
window.
In this control, ‘O’ stands for Ortho (vertical) image and ‘N’, ‘S’, ‘E’, ‘W’ are the four cardinal
orientations for the existing oblique images.
In the following example there is a vertical image of a city square. Note the ‘O’ is highlighted in the
View Control.
Figure 30: Ortho View to be changed to North View
Clicking on the ‘N’ for North View on the View Control will directly switch to Natural Oblique North
View, as seen below. Note that the ‘N’ control is highlighted after clicking on it to provide visual
feedback of the current view. The arrow control on the right provides the location of North
according to the current view.
37
BlomDESKTOP ViewerTM User Guide v3.5 r1.0a
Figure 31: North View
Clicking on other views will change the image accordingly. Below you can see South View for the
same area. Note that the ‘S’ control is now highlighted.
Figure 32: South View
5.3.1 A note on Oblique Images
BlomDESKTOP ViewerTM manages two kinds of oblique images: Natural Obliques and
Orthorrectified Obliques.
38
BlomDESKTOP ViewerTM User Guide v3.5 r1.0a
Natural Obliques are the unmodified oblique images obtained during the capture process. These
are discontinuous images (non mosaiced imagery) and because of this, when you pan around the
map viewer you will notice black/null areas. This is simply the limit of where the oblique image
ends. BlomDESKTOP ViewerTM automatically detects if there is another oblique image in the
BlomURBEXTM database or the local Blom Library that better covers the current centre of the screen
and if there is a better image, it will display it automatically. When panning oblique images you can
sometimes experience a displacement in the image and this is due to a new oblique image
downloaded to replace the previous one.
Figure 33: Natural Oblique Image
Orthorrectified Obliques are a continuous projected mosaic of oblique views. This mosaic provides
a continuous oblique view from 4 angles (North, South, East, and West) with the oblique images
projected, transformed, and orthorectified to correct elevation distortion. The resulting images
show a certain degree of distortion that is noticeable at close-up zoom levels. These have the
advantage that they are ortho images, so they can be easily superimposed on other maps and
processed continuously, making them ideal for use in mobile devices and navigators.
Figure 34: Orthorrectified Oblique
Another very important difference between these two sets of oblique images is that Natural
Obliques allow for measurements (see section 6.7) and this is not possible on Orthorectified
Obliques.
39
BlomDESKTOP ViewerTM User Guide v3.5 r1.0a
5.3.1.1
Intelligent Mode option
BlomDESKTOP ViewerTM restricts the view of orthorrectified obliques to zoom level 16 or lower.
Because of the nature of these images, there can be visible distortion at closer zoom levels and you
can choose whether you want these to be displayed or not. This can be controlled by
activating/deactivating the Intelligent Mode option. To do this, simply right-click on the window
name and select the Intelligent Mode option.
Figure 35: Selection of Intelligent Mode for Obliques
Intelligent Mode is enabled by default. Deselecting it will allow to manually change from Natural
Obliques to Orthorectified Obliques using the icon(s) shown below:
40
BlomDESKTOP ViewerTM User Guide v3.5 r1.0a
Natural
Oblique
is
selected
Figure 36: Natural Oblique Mode
Ortorectified Oblique is
selected. Note distortion
on the image
Figure 37: Ortorectified oblique mode
Note: the Intelligent Mode status of any Window is represented by a small icon in the upper right
corner of every window
“Intelligent Mode” icon
Clicking on the “Synchronized” icon will change the Synchronized status of the Window on or off.
41
BlomDESKTOP ViewerTM User Guide v3.5 r1.0a
5.4
Resizing the screen
The BlomDESKTOP ViewerTM window(s) can be resized according to your requirements similarly to
any windows-based application by using the mouse.
In addition, the BlomDESKTOP ViewerTM screen can switch to full screen mode. This is very useful
for projector-based presentations or demos, where maximizing the image area is required.
To select the BlomDESKTOP ViewerTM full screen mode, simply:
•
Select the Settings -> Toggle fullscreen mode menu option.
•
•
•
Click on the
icon located in the icons toolbar
Press the F11 key
Press the Ctrl + F keys
To switch back to normal screen mode press ESC.
5.5
Magnifying Glass
BlomDESKTOP ViewerTM includes a feature for when the user requires a high level of detail on the
image in order to accurately select points and features to measure or draw lines. Manually zooming
on the image is not always the best option as the user may wish to keep a certain area visible on
screen for performing the measurement(s). To solve these situations you can use the integrated
Magnifying Glass option.
Regardless of the action you are currently performing on a window (zooming, panning, drawing,
etc.), if you click and hold the left mouse button for a couple of seconds, a red rectangle will appear
surrounding the mouse cursor, and a small magnifying window will appear on the upper left corner
of the window.
42
BlomDESKTOP ViewerTM User Guide v3.5 r1.0a
Figure 38: The Magnifying Glass tool
Moving the mouse over the image without releasing the left button will move the red box and the
image in the magnifying window will vary accordingly.
Releasing the left mouse button will close the magnifying tool.
The magnifying tool default options can be modified using the Settings… menu option. Refer to
chapter 15 for details.
43
BlomDESKTOP ViewerTM User Guide v3.5 r1.0a
6
Data Sources
The current version of BlomDESKTOP ViewerTM manages different types of geographic data. These
data sources are described here to provide BlomDESKTOP ViewerTM users with a data reference
guide and glossary of terms.
Supported data sources are:
•
•
Blom image libraries
BlomURBEXTM online geodata services
In addition, external geodata files can be visualised in BlomDESKTOP ViewerTM as overlays on top of
the data sources.
•
•
6.1
Raster Overlays
Vector Overlays
Blom libraries
A Blom Library is a catalogue of imagery collected by aerial flight (or other capture means) and
packaged in a convenient file format. The Blom Library is composed of a set of Blom File System
packages stored into a directory tree, which are packed and encrypted.
Every Blom Library may contain one or several of the following data elements:
•
Discrete imagery: All images captured when flying a given area. These images can be
oblique images, vertical images or nadir images.
•
Mosaics imagery: Continuous geo-referenced imagery cut into tiles conforming to a Grid at
different zoom levels. These mosaics can be: ortho imagery mosaics or ortho-rectified
oblique (North, South, East and West) mosaics.
•
Digital Terrain Models (DTMs or DSMs)
•
Metadata
6.1.1 Discrete Imagery
Discrete images are individual images captured from the flight (or appropriate device) cameras.
They can overlap into one another and they do not form a continuous georeferenced image as
mosaic imagery does.
Navigation through these types of images, by their nature, will not be continuous. Users will be
forced to ‘jump’ from one image to another.
There are 2 types of discrete imagery a library can contain:
44
BlomDESKTOP ViewerTM User Guide v3.5 r1.0a
•
Baselayer imagery: Images to be shown as background imagery. Usually terrain pictures
encoded as JPEG or other formats.
•
Overlay imagery: Imagery with transparency to be shown on top of the baselayer imagery.
Usually, vector images encoded in PNG format.
Depending on the processing the images receive after capture, two additional sets of discrete
imagery sets can be defined:
•
Nadir and Oblique Images: Nadir and Oblique images are images just as captured from a
camera in an airplane, with no additional processing. Nadir images are orthogonal pictures,
while oblique images are taken at a set angle (usually between 40 and 50 degrees). These
have four orientations (North, South, East or West). Nadir images will also have a suborientation depending on the cardinal point the plane was heading towards when the
picture was taken (North, South, East or West). Depending on the plane’s direction, the top
of the image will point to a different cardinal direction.
•
Vertical images: Vertical images are georeferenced Nadir images. The georeferencing
process is performed by using a DTM (Digital Terrain Model), in order to identify the exact
world coordinates for every pixel in the image. The georeferencing process can create a
very slight distortion on the images.
6.1.2 Mosaic Imagery
Mosaic images are continuous, georeferenced images. These are usually tiled into 256x256 pixel
images for every zoom level. Blom libraries use the Spherical Mercator projection (EPSG:3785).
As these images are continuous and have no edges, so too is the navigation through them. The user
will experience no jumps or overlapping between tiles.
As in discrete imagery, two different kinds of mosaic images can be found:
•
Baselayer mosaics
•
Overlay mosaics.
6.1.3 Terrain Models
DTM (digital terrain models) or DSM (Digital Surface Models) may be also available on Blom
Libraries.
A DTM is composed of a point matrix where every point contains the height above the sea level
value for a given coordinate (excludes buildings, trees and other land objects). A DSM provides
similar information, but includes the data for buildings, trees and other elements into the provided
height values.
45
BlomDESKTOP ViewerTM User Guide v3.5 r1.0a
6.1.4 Library Metadata
Every library will have some metadata files attached containing relevant information about the
library and its content. Some of the information included is mandatory and will always be present,
while other is optional.
Some of the mandatory information included in the metadata section of a Blom Library includes
copyright info, dates of capture of the information and image resolution.
6.1.5 Accessing a Blom Library from BlomDESKTOP ViewerTM
Blom libraries can be purchased via your local Blom representative.
They are distributed by physical means (external drives or removable media) and they must be
copied onto your computer or on a shared folder on your local network.
In order to be able to view and work with a Blom Library, your BlomDESKTOP ViewerTM needs a
valid license. This is provided to you by Blom when you purchase a new Blom library. Additional
libraries are added to your license file so you only need one license file per computer.
To add a Blom library, simply select the Add local Blom library as a Datasource… option on the
pop-up menu in the Dataview explorer. A browse window will open
Figure 39: Browse library folder
Select the location of your Blom Library and click the OK button. A new window group and view
window will be created (if there were none previously). The library data will be displayed from your
starting login coordinates.
If there are no opened windows on BlomDESKTOP Viewer™ when a library is added, the new
window that is created will open showing the guide image in the library as a layer.
46
BlomDESKTOP ViewerTM User Guide v3.5 r1.0a
Figure 40: Guide map opened
6.2
BlomURBEXTM
BlomURBEXTM is Blom’s geographic information server (geoserver). Designed to offer fast, simple
access to geospatial models through an extensive set of standardized interfaces on which multiple
value-added services can be offered. BlomURBEXTM is fast and powerful enough to serve millions of
users, and robust and stable to meet the demands that any ambitious enterprise may require.
At the moment BlomURBEXTM covers more than 1100 urban areas in Europe, which in turn
translates into more than 4000 cities.
BlomDESKTOP ViewerTM allows you define BlomURBEXTM as a valid data source, so all of the
content served by the online platform can be accessed from BlomDESKTOP ViewerTM. You can use
this data to fill in gaps in your existing libraries, to check the quality of other geographical areas
prior to acquiring the associate libraries, or even to avoid using off-line libraries at all.
For additional information about BlomURBEXTM please refer to the BlomURBEXTM Product
Description or contact your local Blom representative.
6.2.1 BlomURBEXTM Datasets
BlomURBEXTM datasets include:
•
Vertical (Ortho) images: continuous projected mosaic of vertical views. High resolution (0,1
to 0,5m) aerial imagery establishing a seamless image view of an area.
47
BlomDESKTOP ViewerTM User Guide v3.5 r1.0a
•
•
•
•
Oblique images: discontinuous set of pictures composed of single images covering all
points from 5 different angles (North, South, East, West and Vertical). Resolution 5-18 cm,
accuracy 1-4m.
Ortho-rectified oblique: continuous projected mosaic of oblique views providing a
seamless oblique view from 4 angles, North, South, East and West.
Rasterized vector data: An overlay of rasterized vector data that can be displayed on top of
ortho and oblique layers. By default, TeleAtlas street maps are offered as an option, but
also custom vector maps can be imported. See section ¡Error! No se encuentra el origen de
la referencia. for details on how to view BlomURBEX™ on BlomDESKTOP Viewer™.
Third-party data: BlomURBEXTM can also host third-party datasets and also serve customer
data with the same performance and privacy features as provided for Blom’s own data.
The current version of BlomDESKTOP ViewerTM allows connecting to the vertical and oblique image
datasets. Future versions will let you select additional information layers from BlomURBEXTM such
as the rasterized vector overlay.
6.2.2 Adding BlomURBEXTM as a Data Source
Access to BlomURBEXTM is provided by a valid Username/Password combination or a usertoken
string. These connection credentials will be provided to you upon request by your local Blom sales
representative. These can be either as demonstration or paid-for customer keys.
The connection credentials to BlomURBEXTM will include:
•
•
•
The geographical area(s) you will have access to
The different data layers available
The different BlomURBEXTM services available
To use BlomURBEXTM as a valid data source you need first to configure the connection in the
Settings -> BlomURBEX server connection… menu. If you have not already done this,
BlomDESKTOP ViewerTM will ask you if you want to configure the connection now.
The following dialog box will appear:
48
BlomDESKTOP ViewerTM User Guide v3.5 r1.0a
Figure 41: BlomURBEX™ connection settings
Enter your user and password for accessing BlomURBEXTM and press ENTER or click OK.
If you entered this information when trying to add BlomURBEXTM as data source, a new window
group and view window will be created (if there were none previously), and the BlomURBEXTM
imagery will be displayed from your starting login coordinates.
To enter this information from the Settings -> BlomURBEX server connection… menu option, you
will then need to go to the Dataview explorer, right-click on the Dataview element and select the
Add BlomURBEX as a Datasource… option. A new window group and view window will be created
(if there was not one previously), and the BlomURBEXTM imagery will be displayed from your
starting login coordinates.
6.2.3 Different credentials
You can change your BlomURBEXTM connection settings at any point by simply:
•
•
Selecting the Settings -> BlomURBEX server connection… menu option
Right-clicking the BlomURBEX™ Data Source on the Dataview explorer and selecting the
Configure BlomURBEX server connection… menu option.
This allows switching between different BlomURBEXTM access configurations (if provided to you),
without the need to create additional Dataviews or Workspaces.
6.2.4 Base Layer
Version 2.0 onwards includes a default layer called Base Layer. This represents the Data Source
layer that you have defined for that window (either a Blom Library or a BlomURBEX™ connection).
Having the base layer identified on the window provides you additional control options for the
layer such as making it visible or not (see the Overlays section, below, for additional info).
49
BlomDESKTOP ViewerTM User Guide v3.5 r1.0a
You can also use the Edit base layer… option to access the Imagery layer configuration dialog box.
This dialog box is intended mainly to work with overlays and is described in detail in section ¡Error!
No se encuentra el origen de la referencia.). For base layers, this dialog will allow to select the date
range for the imagery.
By default all available dates options is selected. This shows the latest available year; but you can
uncheck that option and select a specific range of years or a single year as seen below.
Figure 42: Base layer year range selection
50
BlomDESKTOP ViewerTM User Guide v3.5 r1.0a
6.3
Accessing libraries metadata
Version 3.0 of BlomDESKTOP Viewer™ allows users to retrieve metadata from Blom Libraries.
If a valid Blom Library is loaded, you can right-click on the Library Name on the DataView Explorer
to access to a new menu: Show Library Metadata…
Figure 43: Accessing Library Metadata
This will open a window showing the available layers on the library.
Figure 44: Available layers
Note: Whenever an arrow appears on the left of any row in this window, you can click on it to
expand the metadata and additional information view as shown below:
51
BlomDESKTOP ViewerTM User Guide v3.5 r1.0a
Figure 45: Library Metadata
6.4
Showing Library Extents
When a Blom Library is added to BlomDESKTOP Viewer™ you can visualise the extent of the
different available layers on screen.
To do this, simply right-click on any window on the DataView Explorer that is currently showing
data from that library and select the Add Blom Local Library extent overlay option. You will need to
select then the layer which extent you want to show.
Figure 46: Selecting an extent to show
52
BlomDESKTOP ViewerTM User Guide v3.5 r1.0a
Once selected, a shape file with the extent of the selected layer will displayed. You may need to
zoom up or select the Fit to Screen option to properly see the full library extent. The image below
shows the extent of the Oblique North layer of a given library on top of the Index Image.
Figure 47: Extent displayed
6.5
Raster and Vector Overlays
BlomDESKTOP ViewerTM will let you overlay external geo data files on top of the data sources.
These external data files can be provided as:
•
•
Raster files (geo-referenced JPG, TIF, GIF and PNG supported)
Vector files (SHP, KML and GML files supported)
Raster and Vector files are not considered Data Sources as they can be provided by third parties so
they remain out of the Blom Quality Control process and do not compromise the functionality of
BlomDESKTOP ViewerTM as more complex data sources such as Blom Libraries do. Because of this,
Raster and Vector overlays are added at window level.
6.5.1 Supported formats
Current version of BlomDESKTOP ViewerTM supports the following formats for external files:
6.5.1.1
Raster Files
The following formats are supported via the GDal library.
53
BlomDESKTOP ViewerTM User Guide v3.5 r1.0a
Format Name
Maximum file size1
Graphics Interchange Format (.gif)
2GB
TIFF / BigTIFF / GeoTIFF (.tif) [RBG, ARGB,
GrayScale]
4GB for classical TIFF / No limits for BigTIFF
JPEG JFIF (.jpg)
4GB (max dimensions 65500x65500)
Portable Network Graphics (.png)
..
Maximum file size is not only determined by the file format itself, but operating system/file system
capabilities as well. Raster files are internally tiled to help performance in visualisation.
6.5.1.2
Vector Files
The following formats are supported:
•
GML 3.1.1: (http://www.ogcnetwork.net/gml-sf). Gml is not a definition-closed format so
usage of GML Simple Features Profile is recommended. Tests have been done with GML
files generated from ArcGis 9.3. Other versions and schemas are not supported in this
version.
•
KML vector data only. Character encoding iso-8859-1. Compressed format (KMZ) not
supported yet.
•
ESRI Shape file
•
DXF, all versions supported by the GDAL library (http://www.gdal.org/ogr/drv_dxf.html)
6.5.2 A note on projections
Projections supported must comply the Proj4 specification (http://trac.osgeo.org/proj
,http://trac.osgeo.org/proj/wiki/GenParms). If a projection needs a special grid shift file for the
conversion between datums, this grid shift file must be copied inside the installation folder. The
grid shift table formats are ctable (the binary format produced by the PROJ.4 nad2bin program),
NTv1 (the old Canadian format), and NTv2 (.gsb - the new Canadian and Australian format). The
definition of the projection must be filled according the PROJ.4 specification: i.e. “+proj=latlong
+ellps=clrk66 +nadgrids=./ntv1_can.dat”.
EPSG Code: Coordinate systems (projected or geographic) can be selected based on their EPSG
codes, for instance EPSG:27700 is the British National Grid using the OSTN02 grid transformation. A
list of EPSG coordinate systems can be found in the GDAL data files gcs.csv and pcs.csv.
(http://www.epsg.org/ )
6.5.3 Adding an Overlay
Overlay data is added at window level. This means that you need to select a valid window in order
to display your data.
54
BlomDESKTOP ViewerTM User Guide v3.5 r1.0a
Select a window and right-click on it, or in its name on the Dataview Explorer. Then select the Add
Raster Overlay… menu option to add a raster file or the Add Vector Overlay… menu option to add
a vector file. Then select the Browse… option.
Note: that a list of the 5 last opened overlays will appear below the Browse option for ease of use.
The Open File dialog box will open to let you search the desired file in your local drive or network
directory.
Figure 48: Add overlay data
Once a valid vector file is selected, BlomDESKTOP ViewerTM will try to determine the Projection
system used.
Figure 49: Selection of Projection System
If the projection found is correct, simply press the Ok button to continue. Otherwise you can press
the Choose Projection… button to open the Projection Selection Dialog box.
55
BlomDESKTOP ViewerTM User Guide v3.5 r1.0a
Figure 50: Projection Selection
Here you can select a projection from the list of recently used projection, or click on the Advanced
Projection options button to show additional options that will allow you to search the list of
available projection (including filters) and even define your own projection using Proj4 parameters.
Once selected, the data will be displayed in the selected viewer window.
Additionally vector and raster files can be added by drag and dropping them into a BlomDESKTOP
Viewer icon (this action will open BlomDESKTOP Viewer™ with a new workspace and a default
window), or directly over an existing window into the application.
6.5.4 Managing overlays
Once an overlay is loaded into a window, several options become available by right-clicking on the
overlay name on the Dataview explorer.
Some options will not be available depending on the type of overlay data and the existence of
associated metadata.
These options are:
56
BlomDESKTOP ViewerTM User Guide v3.5 r1.0a
•
Visible: this option is selected by default. Deselecting it will hide the overlay from the
current view. The overlay will not be deleted but will remain assigned to the window in the
Dataview.
•
Opacity: selecting this option will show a slide bar that you can use to define the
transparency level of each overlay layer.
•
Zoom level range: see section 6.7
•
Fit to Screen: selecting this option will modify the zoom level and the position of the
screen, so that all of selected overlay data can be seen on screen at once.
•
Show metadata…: this will open a new table-view displaying the associated metadata for
the selected overlay. You can filter the table using the Search field on the top-right part of
the view.
Figure 51: Metadata view from a vector file
You can double-click on any row of in the metadata table to see the location of the
associated element in the window view.
From version 2.0 onwards of BlomDESKTOP Viewer™ it is possible to select several
elements and display them on the screen. Use the Ctrl key to select/unselect row on the
metadata table, and then click the Fit selected geometries to screen button.
Note: Double-clicking on any vector element on a vector overlay will open a table view to
show the associated metadata to the selected element.
57
BlomDESKTOP ViewerTM User Guide v3.5 r1.0a
Figure 52: Several geometries are selected and shown on screen
•
Search metadata: this option will allow the user to search the overlay metadata fields. Just
type in a text or number and press Enter.
Figure 53: Filtering Metadata
Results will be shown in a table view. Clicking on any row will show the associated data on
screen.
•
Symbology Editor…: this option will open a dialog box that will allow the user to change the
basic appearance for the selected overlay data. Using this dialog box you change thickness,
colour, style and other attributes for points, lines and polygons. See section 9.4 for
additional details.
•
Labelling and labelling editor: see section 6.6.
58
BlomDESKTOP ViewerTM User Guide v3.5 r1.0a
6.6
•
Move/Copy overlay to…: these two options will allow you to move or copy the selected
overlay layer to a different window.
•
Bring overlay to front: this option will bring the overlay to the front position in order of the
display so it will be visualized on top of all other overlays in the window.
•
Bring overlay forward: this option will move the overlay one position up in the order of
visualization in the window.
•
Send overlay backwards: this option will push the overlay back one position in the order of
the display window.
•
Send overlay to back: this option will push the overlay to the back position in order of the
display so it will be at the bottom of the list of overlays in the window.
•
Change Projection…: you can change the selected projection system for the overlay by
choosing this option.
•
Remove: select this option to remove the overlay from the window.
Labelling Overlays
For vector overlays with metadata, such as shape files, GML files or KML files, it is possible to select
a field in the available metadata to label the elements on screen.
Providing the vector overlay has metadata, an option called Labelling … will appear by right-clicking
on the overlay name. Select it and a list of fields will appear. Choose one to label the vectors using
the contents of that field.
Figure 54: Labelling Vectors
59
BlomDESKTOP ViewerTM User Guide v3.5 r1.0a
6.6.1 Changing the label style
The font used for labelling data can be customized using the labelling editor. You can open it
selecting the Labelling editor… option on the overlay menu.
Figure 55: Labelling Editor
Here you can select the font family, typeface, color, size and special features for the labels. Note
that this selection will apply to all labels for the selected overlay. You can select different options
for different overlays.
6.7
Defining the zoom level for overlays
When managing overlays, it is possible that the display of the data (especially with very large sized
vector files) make take some time to display.
To reduce the loading time, it is possible to select the valid zoom level for overlay datasets and
define a range of zoom levels where BlomDESKTOP Viewer™ will display the data.
To define a valid range of zoom levels for a given overlay, right-click on the name in the DataView
Explorer and select the Zoom Level Range option.
60
BlomDESKTOP ViewerTM User Guide v3.5 r1.0a
Figure 56: Selection of Range of Zoom Levels
On the slide bar you can select the minimum and maximum zoom levels required to display the
selected overlay.
Note: This option does not apply to the BlomSTREET™ overlays, so the option will not appear.
Baselayer zoom level cannot be limited either.
6.7.1 A note on zoom levels
BlomDESKTOP Viewer™ manages different zoom levels as images with different resolution, in fixed
intervals, to speed up rendering time. The table below shows some of the bigger resolution zoom
levels for Spherical Mercator data.
Note that:
•
The resolution of this projection only matches real world resolution in the equator.
•
It varies with the latitude.
61
BlomDESKTOP ViewerTM User Guide v3.5 r1.0a
Figure 57: Resolution per zoom level
6.8
Editing the base layer
In BlomDESKTOP Viewer™ it is possible to select layers from the available Data Sources. Version 2.0
supports overlays from BlomURBEX™ and future versions will integrate the possibility of adding
overlays from Blom Libraries.
BlomURBEXTM imagery is composed of Baselayers and Overlays. Overlays have transparent areas,
whereas Baselayers do not.
Different layers can be selected by the user if they are available. In order to display different layers
in a window, right-click on the base layer name in a window on the Dataview Explorer and select
the Edit base layer… option. The following dialog box will appear.
Figure 58: Add overlay from data source
62
BlomDESKTOP ViewerTM User Guide v3.5 r1.0a
The first area in the dialog box allows you to select a Layer from the available list, or by typing its
name into the text box below. By default several layers are defined in your configuration. If you
want the selected layers to show, you will need to un-check the Use Default Baselayers option.
Then you can select layers in any desired order by clicking on their name and moving them to the
Selected baselayers list using the arrow buttons.
It is also possible to select the Date range for the selected overlay. You can choose to select all
available dates for the overlay, or select a range of years using the list boxes below.
Once you are happy with the settings, click OK and the new layer or overlay will appear on the
selected window.
Figure 59: Overlay named “Streets” on top of imagery
6.9
LiDAR and BlomSTREET™ overlays
BlomDESKTOP Viewer™ version 3.0 onwards includes the possibility of working with two additional
datasets:
LiDAR data: either taken from the BlomURBEX™ server or directly from local LAS files.
BlomSTREET™ data: spherical, georreferenced images, taken from the BlomURBEX™ server.
Due to the specific behavior of these overlays, they are described in separate chapters;
BlomSTREET™ datasets are covered in chapter 10. LiDAR datasets are covered in chapter 13.
6.10 Associating file types to BlomDESKTOP Viewer™
All supported file formats in BlomDESKTOP Viewer™ can be associated to the application as the
default viewer. This means that you can simply double-click on a given file to open it inside
BlomDESKTOP Viewer™. For details on this operation, refer to your Windows™ help
documentation.
63
BlomDESKTOP ViewerTM User Guide v3.5 r1.0a
7
Measurement Tools
BlomDESKTOP ViewerTM offers a powerful set of measurement tools that can be directly applied on
Ortho and Oblique images, providing a great added value for users. All of these tools are described
in this section.
The available measurement tools in BlomDESKTOP ViewerTM 1.0 are:
Tool
Description
Length/Distance tool
Area tool
Bearing tool
Elevation tool
Height tool
Façade Area tool
Diagonal (ladder) tool
Erase button
Change style of measurements
These tools are located in the icons bar in the upper part of the user interface.
To perform any measurement, just click on the desired tool. BlomDESKTOP ViewerTM will then enter
into Measurement Mode (the mouse behaviour will depend on the tool selected). To exit
Measurement Mode click again on the tool, or click on the Erase Button. Note that while a
measurement tool is selected, you can perform multiple measurements on screen. Press the Erase
Button to remove any current measurements on screen.
Note, the unit system used in measurements can be selected from the Settings->Preferences…
menu. See section 15.1 for details.
7.1
Length measurement
This tool lets you perform length measurements on ortho or oblique images. The length tool
provides “as the crow flies” measurements.
64
BlomDESKTOP ViewerTM User Guide v3.5 r1.0a
Select the desired length measurement tool by clicking on the appropriate icon in the toolbar and
follow this procedure for length calculation.
1. Click on a point to start measuring. A blue point will appear on screen
2. Move the mouse to create a line, and click on another point to finish that line
3. Continue the above method to draw additional lines if needed, or double-click on the map to
finish the measurement and retrieve the results
4. The cumulative length at every individual line will be displayed on screen (in meters).
Figure 60: Length Measurement
7.2
Area Measurement
This tool lets you perform area measurements on ortho images by drawing polygon shapes on the
BlomDESKTOP ViewerTM screen.
Select the tool by clicking on its icon in the toolbar and follow this procedure for area calculation.
1. Click on a point to begin measuring. A blue point will appear on screen
2. Move the mouse to create a line, and click on another point to finish that line. Note the
polygon is created on the fly so there is no need to close it manually.
3. Continue the procedure to draw additional lines if required, or double-click on the map to finish
the measurement and retrieve the results.
4. The area of the polygon created will be displayed on screen (in meters squared).
65
BlomDESKTOP ViewerTM User Guide v3.5 r1.0a
Figure 61: Area Measurement
7.3
Bearing Measurement
This tool lets you measure the bearing or azimuth (angle relative to true North) of a line.
Select the tool by clicking on its icon in the toolbar and then follow the procedure below for bearing
calculation.
1.
2.
3.
4.
Click on a point to start measuring. A blue point will appear on screen
Move the mouse to create a line.
Click again on the map to finish the measurement
The bearing of the created line (in sexagesimal degrees), will be displayed on screen.
Figure 62: Bearing Calculation
66
BlomDESKTOP ViewerTM User Guide v3.5 r1.0a
7.4
Elevation Measurement
All images available in BlomURBEXTM or into Blom Libraries have been processed using a DTM. The
elevation information of those DTMs is included in the server and can be obtained using the
Elevation Tool.
Select the tool by clicking on its icon in the toolbar and follow this procedure for elevation
calculation.
1. Click on a point to start measuring. A blue point will appear on screen
2. The Elevation of that point at sea level will be displayed on screen (in meters).
Figure 63: Elevation Measurement
7.5
Height Measurement
This tool lets you measure the vertical height from a point on the ground in oblique imagery only.
This lets you measure the height of any given façade.
Select the tool by clicking on its icon in the toolbar and follow this procedure for height calculation.
1. Click on a point on the ground to start measuring. A blue point will appear on screen.
2. Move the mouse to create a vertical line. Note, that BlomDESKTOP ViewerTM will only let you
move up the Z axis, so perform measurements from the bottom to top.
67
BlomDESKTOP ViewerTM User Guide v3.5 r1.0a
3. Click again on the map to finish the measurement
4. The height of the line will be displayed on screen (in meters).
Figure 64: Height Measurement
7.6
Façade Area Measurement
This tool allows to measure areas on façades in oblique images by drawing irregular polygons on
the BlomWEB ViewerTM screen. To perform area measurements on ortho images use the Area Tool
(section 7.2).
To perform a measurement:
a. Click on a point on the ground as the first point for the baseline of the area to measure.
b. Click on a second point on the ground as the second point for the baseline of the area to
measure. (Figure 65)
c. Continue the procedure clicking on additional points over the baseline to complete the
polygon, or double-click on the map to finish the measurement. (Figure 66)
d. The area of the polygon will be displayed on screen. (Figure 67)
68
BlomDESKTOP ViewerTM User Guide v3.5 r1.0a
Figure 65: Measuring façade area: Define baseline first…
Figure 66: …Then continue defining the area
Figure 67: … Finally, double click to get the measurement
7.7
Diagonal (Ladder) Measurement
This tool calculates the length of the hypotenuse of the triangle formed by a point on the ground
and two points in a façade. This can be used to have an estimation of the length of a Fire Truck
ladder/hose needed to reach a certain window or height in a building.
Diagonal Measurement tool is only active in Oblique Image view.
69
BlomDESKTOP ViewerTM User Guide v3.5 r1.0a
To perform a measurement:
1. Click on a point located on the ground. This will represent the location of the Fire Truck.
2. Move the mouse and click on a point on the ground directly below the desired window (or
height). This will be the corner of the triangle rectangle.
3. Move the mouse up the façade and click on the desired height.
4. The hypotenuse (ladder) will then be drawn in red and its length will be displayed.
Figure 68: Diagonal Measurement
7.8
Erase Button
This button will remove all measurement data currently displayed on screen allowing you to start a
new batch of measurements. This button will also exit from any Measurement Mode you may be
in.
7.9
Changing the style of the measurements
BlomDESKTOP Viewer™ includes the possibility of changing the style of measurements since
version 1.2.0 of the tool. This means that it is possible for users to select the colour, line thickness
and line pattern of the graphic elements used for measuring data.
To define the style of measurements, just click on the
editor dialog box (see section 9.4).
button. This will open the symbology
Styles are saved in the workspace so if you change the default styles for measurements, they will
be retained for the next time you open that workspace.
70
BlomDESKTOP ViewerTM User Guide v3.5 r1.0a
8
8.1
Geocoding
Searching for an address with OpenStreetMap
Searching for a specific location is one of the most common needs for a GIS tool. To this end, a
Geocoding tool is integrated with the BlomDESKTOP ViewerTM.
This tool uses an external provider (OpenStreetMap) so Internet access is required in order to use
address searching.
Blom disclaims any responsibility derived from outages, poor performance or any other issue
related to any service provided by third party organizations.
OpenStreetMap is licensed under the terms of the Creative Commons Attribution Sharealike 2.0
(http://creativecommons.org/licenses/by-sa/2.0/) and is a project to provide a free source of data
and services at the worldwide level.
OSM-based geocoding follows a free text structure. In some countries, the postal addresses may
not include numbers and have only street directions.
To search for an address in BlomDESKTOP ViewerTM:
•
Right-click on any part of the map screen to show a pop-up menu. Then select the Go to…
option.
Figure 69: Geocoding tool
•
Type in the required address in free text into the text box and then press ENTER or click on
the Go To Address button. The search will be performed and the screen will centre on the
selected location.
71
BlomDESKTOP ViewerTM User Guide v3.5 r1.0a
•
If there are multiple results for the selected search string, a dialog box will appear to select
the correct one or to further refine the search.
Figure 70: Geocoding results
8.1.1 Where am I? Option
BlomDESKTOP Viewer™ includes a quick option for reverse geocoding addresses. Simply click on
any point on the window and then right-click again to select the Where Am I? option. The name of
the selected street will be displayed and also the coordinates of the point you clicked. You can also
select the Copy coordinates to clipboard option for using those coordinates afterwards.
Figure 71: Where Am I?
72
BlomDESKTOP ViewerTM User Guide v3.5 r1.0a
8.2
Search by coordinates
BlomDESKTOP ViewerTM also allows for a coordinate search using the same interface as described
in the previous section for address search. This means that you can input coordinates instead of an
address in the Search dialog box.
You can type the desired coordinates:
a) As (Latitude, Longitude) in decimal format. Example: 40.42, -3.69
b) As (X,Y), in Spherical Mercator or UTM projection. Example: 225485.2, 6250785.5
To search by Latitude, Longitude, type:
•
@ll <lat> <lon>
Example: @ll 40.42 -3.69
To search in Spherical Mercator projection, type:
•
@sphm <y> <x>
Example: @sphm 6250785.5 225485.2
To search in UTM projection, type:
•
@utm<zone><hemisphere> <y> <x>
Example: @utm18n 4312984.502 323894.392
73
BlomDESKTOP ViewerTM User Guide v3.5 r1.0a
8.3
Searching for an address from SHP file information
Version 3.2 of BlomDESKTOP Viewer™ includes the facility to search addresses using the
information in either a single, or multiple SHP vector files.
It is possible to create many profiles and change between them quickly and easily.
8.3.1 Create shapefile based geocoding
In the menu Settings there is an option to create shapefile based geocoding. (Settings->Create
shapefile based geocoding).
After selecting the item on the menu, the following window will appear.
Figure 72: Configure Geocoding Options
74
BlomDESKTOP ViewerTM User Guide v3.5 r1.0a
In this window there are several options to create and manage profiles with shapefiles for using
them to geocode.
To create a new profile click the button <Add profile>, a new name appears into the dropdown list
with the name GeocodingProfileXX - XX relates to the numerical naming sequence.
To delete a geocoding profile, click the Remove Profile button, and the profile selected must be
erased.
There are two more buttons that manage the shapefiles to obtain the fields involved in the
geocoding process.
Clicking on the Add Shapefile button opens the window to locate the shapefile to include in the
geocoding process.
To remove a shapefile, just click on the Remove Shapefile button.
A list of available fields will appear on the Search fields box. You need to specify which fields will be
used for address searching. All fields will appear selected by default. Unselect those you do not
require for geocoding.
Then use the boxes below to select the list of fields you want to have displayed in the search
results. You can move fields from one box to the other using the arrow button in the middle, and
move up and down the selected fields using the red arrow buttons on the right. If there are
multiple results for the selected search string, a dialog box will appear to select the correct one or
to further refine the search.
Once complete, click Ok to accept the configuration. From now on, the GoTo… option described on
section 8.1 will no longer use Open Street Maps as geocoding source, and will use the selected SHP
file and fields for results.
To search an address now, Right-click on any part of the map screen, then select the Go to… option.
Type in the required address in free text into the text box and then press ENTER or click on the Go
To Address button. The search will be performed and the screen will centre on the selected
location.
75
BlomDESKTOP ViewerTM User Guide v3.5 r1.0a
8.3.2 Delete shapefile based geocoding
There two ways to remove a geocoding profile:
-
From the menu select Settings-Delete shapefile based geocoding, and in the window
select remove profile button as explained in the section “Create shapefile based
geocoding”
Figure 73 Remove profile geocoding
-
From the Settings-Delete Shapefile based geocoding menu, select the profile you wish
to delete.
8.3.3 Set active geocoding
BlomDESKTOP Viewer™ allows multiples profiles, and you can quickly choose between profiles in an
expandable list. To select the profile you wish to use, simply click on the profile name under the menu
Settings->Set active geocoding.
Figure 74 Switch geocoding profile
If you wish to return to Open Street Maps as the default geocoding source, the Default Geocoding must
be selected in the previous menu.
76
BlomDESKTOP ViewerTM User Guide v3.5 r1.0a
9
Annotation tools
BlomDESKTOP Viewer™ includes a set of tools for drawing simple vector elements on top of the
Data Sources displayed. These elements are:
•
•
•
Points
Polylines
Polygons
Figure 75: Annotation Tools
Once an annotation icon is activated the map window will enter into edit mode. An annotation
layer is needed first in order to be able to draw on the map.
The annotation toolbar also allows for editing vertexes and features of elements.
9.1
Annotation layers
To add an annotation layer right-click on the window name (located in the Dataview explorer)
where you want to create the annotation layer and select the Add Annotations Layer… option.
Figure 76: Annotation Layer created
There can be as many annotation layers as required per window, but only one active annotation
layer per window.
77
BlomDESKTOP ViewerTM User Guide v3.5 r1.0a
Note: If an annotation layer is not present the cursor will change to a “Forbidden” sign, as there is
no annotation layer to add to.
Figure 77: No annotation layer available
Annotation Layers can be in four different states:
Annotation layer non-active, visible
Annotation layer active, visible
Annotation layer non-active, non-visible
Annotation layer active, non-visible
Annotation layer status can be changed by right-clicking on it.
An annotation layer is considered an overlay for BlomDESKTOP Viewer™, so the menu options
available when right-clicking on it are the same that are available for other overlays. See section
6.5.4 for additional details.
9.2
Drawing elements
Once the annotation layer is present it is possible to add points, polylines and polygons.
9.2.1 Adding points
•
•
•
•
Select the Draw Point tool
Click on the map to draw a point on the selected position
Right-click on any drawn point to label or remove it (see section 9.2.4)
Select the Symbology Editor menu to change the appearance of points (see section 6.5.4)
9.2.2 Drawing lines
•
Select the Draw Multiline tool
78
BlomDESKTOP ViewerTM User Guide v3.5 r1.0a
•
•
•
•
•
•
Click on the map to draw a point on the selected position
Drag the mouse to start drawing a line
Click on the map to draw a vertex, and continue drawing the line
Double-click on the map to end drawing the line.
Right-click on any drawn line to label or remove it (see section 9.2.4)
Select the Symbology Editor menu to change the appearance of points (see section 6.5.4)
9.2.3 Drawing polygons
•
•
•
•
•
•
•
Select the Draw Polygon tool
Click on the map to draw a point on the selected position
Drag the mouse to start drawing a line
Click on the map to draw a vertex, and continue drawing lines. Note, the polygon will autocomplete
Double-click on the map to end drawing the polygon.
Right-click on any drawn polygon to label or remove it (see section 9.2.4)
Select the Symbology Editor menu to change the appearance of polygon (see section 6.5.4)
9.2.4 Labelling annotations
If the map is in edit mode and an annotation tool is selected, you can Right-click on any element
drawn on an annotation layer to show a pop-up menu with two options:
•
Set text: this will open a dialog box to enter the text for the label you want to add to the
selected element.
Figure 78: Labelling Dialog Box
Enter the desired text and press ENTER or click the Set Text button.
79
BlomDESKTOP ViewerTM User Guide v3.5 r1.0a
Figure 79: New Label
Using the same method you can modify or delete the labels at any time. There can be only one
label per element.
9.3
Symbology
Symbology of annotations can be changed using the Symbology Editor Dialog box (see next
section). All elements of an annotation layer will be affected by your selection on the Symbology
Editor dialog. So if you wish to have different elements in different colours, create several
annotation layers and change the symbology as desired per layer.
Figure 80: Annotation layers with different symbology
80
BlomDESKTOP ViewerTM User Guide v3.5 r1.0a
9.4
Symbology Editor
The symbology editor is a dialog box that will allow users to change the basic appearance for the
selected overlay data.
The dialog box is divided into three tabs allowing you to select the symbology for different
annotation objects that can be drawn in BlomDESKTOP Viewer™.
9.4.1 Points Symbology
Figure 81: Symbology Editor: Points
Points are defined by a symbol, a colour and a size. You can select them from a list of predefined
symbols and colours by clicking on the Point colour and Point symbol drop boxes. The Point size
can be changed using the Size slider.
You can also use image files to represent points instead of using the standard symbology. Simply
select the Browse an image option and search the desired image file on your computer or network.
The selected graphic will then be displayed on the location of the point. Accepted image formats
are JPG, PNG and GIF.
You can use the Restore Values button to return to the default symbology values in BlomDESKTOP
Viewer™.
81
BlomDESKTOP ViewerTM User Guide v3.5 r1.0a
9.4.2 Multilines symbology
Figure 82: Symbology Editor: Multilines
Multilines are defined by a line style, a colour and a line thickness. You can select them from a list
of predefined styles and colours clicking on the Line colour, Line Style and Line Thickness drop
boxes.
You can use the Restore Values button to return to the default symbology values in BlomDESKTOP
Viewer™.
9.4.3 Polygon symbology
Figure 83: Symbology Editor: Polygons
Polygon symbology is more complex and more elements can be defined from the list of drop boxes:
•
Outline colour: This is the colour of the outline that defines the polygon.
82
BlomDESKTOP ViewerTM User Guide v3.5 r1.0a
•
•
•
•
Outline style: This is the style of the outline that defines the polygon (continuous, dotted,
etc.).
Line thickness: This is the thickness of the outline that defines the polygon.
Fill colour: This is the colour that will be used to fill the polygon.
Fill pattern: You can use a pattern to fill the polygon by selecting it from a list of predefined
ones.
You can use the Restore Values button to return to the default symbology values in BlomDESKTOP
Viewer™.
9.5
Editing symbology
The annotations toolbar provides two options for editing elements created in BlomDESKTOP
Viewer.
9.5.1 Editing vertices
To edit a vertex in any given annotation object:
•
•
•
•
Select the edit vertices tool.
Click on the desired vertex on an annotation object. Do not release the mouse button. The
object symbology will change to red.
Move the mouse, dragging the vertex to the desired position.
Release the mouse button.
Figure 84: A polygon to edit
83
BlomDESKTOP ViewerTM User Guide v3.5 r1.0a
Figure 85: The vertex is clicked
Figure 86: The vertex is dragged to the new position
9.5.2 Editing features
Existing objects can be moved to a new position. To do this;
•
•
•
•
Select the edit features tool.
Click on the desired object. Do not release the mouse button. The object symbology will
change to red.
Move the mouse, dragging the object to the desired position.
Release the mouse button.
84
BlomDESKTOP ViewerTM User Guide v3.5 r1.0a
10
BlomSTREET™ data
CycloMedia is a Blom partner that specializes in producing large scale and systematic capture of
public space using mobile mapping technology to generate 360° panoramic images, called
“Cycloramas”. CycloMedia has many years of experience in the in-house development of recording
systems, the accompanying processing software, data architectures and the best way to record
Cycloramas on a great-scale on a daily basis. Today CycloMedia is a main supplier for the Dutch
government; the entire public road network of the Netherlands is being recorded on a yearly basis.
Many Dutch municipalities use the imagery of CycloMedia Technology for all kinds of applications.
A Cyclorama is a 360° panoramic image, as shown below:
Every Cyclorama has the following properties:
•
A 360° panoramic image with a resolution of 4800 x 2400 pixels
•
Recorded at a fixed interval of 5 meters, most objects are therefore visible from
three different angles
•
Spherical – As well as the ability to look around (360°), you can also look up and
down
•
Good continuous image – Best of class stitching
•
Upright image – when recordings are taken from a talus, this is corrected so that an
image is always horizontal (level)
•
The file contains a recording date and time
•
Geometrically correct – each pixel in the Cyclorama is geometrically positioned
•
Outstanding geo reference – precise position and viewing direction
These properties allow the possibility to use Cycloramas for many applications.
Blom has been capturing and producing Cyclorama data for its customers since Q2 2011. This new
product of Blom is branded BlomSTREET™. BlomDESKTOP Viewer™ v3.0 includes the ability to open
BlomSTREET™ datasets as overlays in specific windows.
10.1 Accessing BlomSTREET™ data
BlomSTREET™ is currently provided online via the BlomURBEX™ connection. If your access
credentials to BlomURBEX™ grant you access to BlomSTREET™ data, you can create a BlomSTREET™
85
BlomDESKTOP ViewerTM User Guide v3.5 r1.0a
visualisation window by right-clicking on an existing window and selecting the Add BlomSTREET
overlay… option.
As seen in the screenshot below, this will open a BlomSTREET™ overlay over the current base layer
selected, and a new separate BlomSTREET™ window which is linked to the first one, where the 360°
panoramic image(s) will be displayed.
Compass
BlomSTREET™ layer
BlomSTREET™ image tools
Figure 87: The BlomSTREET™ data windows
10.2 BlomSTREET™ Navigation
Navigating the 360° imagery is simple and intuitive.
The BlomSTREET™ window is composed of two linked windows; one showing an image of your
current position and the other displaying a BlomSTREET™ viewer. The right window will appear
empty until you select an image location by clicking on any dot on the ortho view. Every dot
represents the location of a BlomSTREET™ image.
86
BlomDESKTOP ViewerTM User Guide v3.5 r1.0a
Figure 88: BlomSTREET™ scenario
10.2.1 The map window
You can navigate the ortho imagery using all of BlomDESKTOP Viewer™ navigation options
described on section 5, including the magnifying glass on the BlomSTREET™ window.
Figure 89: Magnifying Glass on BlomSTREET™ image
The coloured dots on the image represent the location of the different BlomSTREET™ spherical
images. Different colour dots indicate different dates of capture: note if you hover the mouse
cursor over the dots, the date of the associated BlomSTREET™ image will be shown.
Filtering information by date of capture is possible. To this, simply right-click on the BlomSTREET™
layer on the dataview explorer and select the Date Filter option. Then use the year slide bar to
select the desired range of years for your BlomSTREET™ dataset.
87
BlomDESKTOP ViewerTM User Guide v3.5 r1.0a
Figure 90: Filtering BlomSTREET™ data by date
The triangle shown on top of the currently selected dot shows the user field of vision according to
the selected BlomSTREET™ spherical image on the right side window. As you move and rotate the
image in the BlomSTREET™ image, the triangle will also rotate to represent the direction the viewer
is looking at. The compass will move accordingly to show the location of the north related to your
current point of view.
Click on any dot to access the associated BlomSTREET™ spherical image on the right-side window.
Figure 91: The triangle rotates according to the BlomSTREET™ view
88
BlomDESKTOP ViewerTM User Guide v3.5 r1.0a
Clicking on additional dots will open new BlomSTREET™ images in the associated window. Only one
BlomSTREET™ viewer can be opened per overlay, but there is no limit to the number of
BlomSTREET™ overlays that you can open in BlomDESKTOP Viewer™
10.2.2 The BlomSTREET™ window
To move around the BlomSTREET™ image, click on it and drag your mouse to move the view. You
can use the following keys for navigating the image:
•
Use the left/right arrow keys to rotate the image
•
Use the up/down arrow keys to advance to the next/previous BlomSTREET™ spherical
image.
•
Use the + and – keys to zoom in and out
•
Use the PageUp and PageDown keys to tilt up and down
Dots also appear on the BlomSTREET™ window, allowing you to select different views just by
clicking on them. Note that if you position the mouse cursor over a dot, the date of capture of the
associated BlomSTREET™ spherical image will be visible.
Figure 92: Date of the BlomSTREET™ image
89
BlomDESKTOP ViewerTM User Guide v3.5 r1.0a
10.3 Measuring on BlomSTREET™ data
One of the main features of BlomSTREET™ is the capability to perform measurements directly on
the spherical images. Measurement tools are located on top of the BlomSTREET™ and are
described here.
Tool
Description
Point Measurement
Line Measurement
Height Measurement
Plane (Surface) Measurement
Volume Measurement
Clear all measurements
Finish measurement (active when
measuring)
10.3.1 A note on measurement on BlomSTREET™ data
A BlomSTREET™ image is a flat image where every pixel represents a spatial direction with a known
orientation, from a known recorded position.
In order to determine the coordinates of an object point, at least two images are required. As seen
below, with one Cyclorama you can only find out the orientation of the point:
Figure 93: Measurement principles (1)
However, with a second image, the point to measure will be located in the intersection of both
“direction cones”, so a true measurement can be achieved.
90
BlomDESKTOP ViewerTM User Guide v3.5 r1.0a
Figure 94: Measurement Principles (2)
As above, the greater the number of BlomSTREET™ images used, the better the accuracy of the
measurement results.
10.3.2 Measuring Points
As described above, you will need to open at least two BlomSTREET™ viewing windows in order to
perform a measurement. We will demonstrate the process with an easy example. As you can see
on the screenshot below, we are going to measure the coordinates of a single point next to a
building. Two BlomSTREET™ windows have been opened and rotated so that the point to measure
can be seen in both windows simultaneously.
Click on the Point Measurement button to begin the procedure, and then click on the location of
the desired point you want to measure. You will see a line appear on the other BlomSTREET™
window with the same colour of the frame as the first one. This is a visual guide to locate where the
point is located on the second image.
Figure 95: Point Measurement. Step 1
Locate the point on the second BlomSTREET™ Window and click on it. Note that a similar guideline
will now appear in the first Window.
91
BlomDESKTOP ViewerTM User Guide v3.5 r1.0a
Figure 96: Point Measurement. Step 2
You can click on the selected points as many times as you need until you are happy with the
location. When you are ready, click on the Finish Measurement button (the point measurement
button has changed now to show this icon) and the results will be displayed at the bottom of the
BlomSTREET™ viewing window.
Figure 97: Point Measurement results
Clicking on the measurement result(s) will copy it to the clipboard.
92
BlomDESKTOP ViewerTM User Guide v3.5 r1.0a
10.3.3 Measuring Lines
As described above in measuring points, you will need to open at least two BlomSTREET™ windows
in order to perform a measurement. Next we will demonstrate the process with an easy example
for measuring lines. As you can see in the screenshot below, we are going to measure the height of
a window in a building. Two BlomSTREET™ windows have been opened and rotated so that the line
to measure can be seen in both windows simultaneously.
Click on the Line Measurement button to start the procedure. Now click on the location of the
initial point of the line, and then again on the end point of that same line. You will see that both
spots will appear numbered on the BlomSTREET™ windows, and a line will appear on the other
BlomSTREET™ window with the same colour frame of the first one. This line is a visual guide to
locate where the first point of the line is located on the second image.
Figure 98: Line Measurement. Step 1
Click on the location of the first point of the line on the second BlomSTREET™ window. Note that
the guideline now moves to the possible location of the second point.
Figure 99: Line Measurement. Step 2
93
BlomDESKTOP ViewerTM User Guide v3.5 r1.0a
Now click on the location of the second point on the second BlomSTREET™ Window.
Figure 100: Line Measurement. Step 3.
You can further modify the position of the points by clicking on them to reposition, or press the
Finish Measurement button to retrieve the results. The length of the line in meters is shown at the
bottom of the BlomSTREET™ Window. Clicking on the measurement result will copy it to the
clipboard.
10.3.4 Measuring Heights
Although the procedure describe in the previous section can be used to measure vertical lines, that
action will only measure the straight distance between two selected points. It is possible to
measure actual heights using the Measure Height tool. Once selected, a measurement pole will
appear on screen.
To position the height measurement pole, you can drag it around the map or Cyclorama with the
mouse, by clicking and holding to position it to the ground plane. Note that actual height
measurement must be performed within a Cyclorama. Position the pole correctly and confirm its
location with additional nearby Cycloramas. Once the location is determined, click and drag the top
or bottom red round indicators (the mouse will change to a hand icon to drag the indicators) to
reflect the object you want to measure.
Note that a yellow dot will appear on the map window, marking the location of the measuring pole.
You can click on the map window to move the dots and the measuring pole will move accordingly
on the BlomSTREET™ Window.
The results of the measurement are shown at the bottom of the window. They are:
•
•
The height of the pole
The ground elevation of the pole base
Clicking on the measurement result will copy it to the clipboard.
94
BlomDESKTOP ViewerTM User Guide v3.5 r1.0a
Figure 101: BlomSTREET™ Height Measurement
10.3.5 Plane measurements
Surface measurements can be performed in the same way as height measurements. Instead of one
measurement pole you have two which are connected at the top and the bottom. By dragging each
pole into position, you can adjust the width of the surface area you want to measure. To adjust the
height range of the measurement, click and hold with the left mouse button on the top or bottom
edge of the measurement square.
If preferred you can drag the entire tool by clicking and holding with the left mouse button on the
grey dot. Note that linked dots will appear on the map window, marking the location of the
measuring poles. You can click on the map window to move the dots and the measuring poles will
move accordingly on the BlomSTREET™ Window.
Measurements shown are total area, height and width of the measurement box. Clicking on the
measurement result will copy it to the clipboard.
95
BlomDESKTOP ViewerTM User Guide v3.5 r1.0a
Figure 102: Surface Measurement
10.3.6 Volume measurements
Volume measurements are not too dissimilar from surface measurements. It consists of two
surface measurement tools connected to each other to form a cube. Adjusting the size of the cube
works in the same way as the surface measurement tool. The individual poles can be positioned
separately to encompass the object to be measured. The height range of the cube can be changed
by dragging one of the top or bottom plane edges. Like the surface measurement tool, the grey dot
at the bottom of the tool can be clickedon to allow dragging of the entire tool without changing its
shape.
Note that linked dots will appear on the map window, marking the location of the measuring poles.
You can click on the map window to move the dots and the measuring poles will move accordingly
on the BlomSTREET™ Window.
Results provided are Area, Height, Perimeter and Volume of the cube.
10.3.7 Deleting measurements
Use the Clear Measurements button to delete all measurements and start a new measurement if
required.
10.4 Printing BlomSTREET™ data
You can print the contents of the BlomSTREET™ window in any printer connected to your network.
96
BlomDESKTOP ViewerTM User Guide v3.5 r1.0a
Simply select the Print BlomSTREET™ viewer button ( ) and click on the opened BlomSTREET
image you want to print. The system printer dialog box will appear to let you select the desired
printing options. Click Ok to save the image.
10.5 Export BlomSTREET™ data
BlomSTREET™ screenshots can be saved as JPG or PNG files.
Simply select the Export BlomSTREET™ viewer to image button ( ) and click on the opened
BlomSTREET image you want to export. A dialog box will appear to let you select the desired format
and JPG compression level. Click Ok to save the image.
Figure 103: Exporting BlomSTREET™ imagery
97
BlomDESKTOP ViewerTM User Guide v3.5 r1.0a
10.6 Vector data on BlomSTREET™
The BlomSTREET™ can reproject vector datasets and show them over the spherical imagery. This is
an immediate action as long as there is vector data overlayed on the main window. Full detail on
vector loading on BlomDESKTOP can be found on section 6.5.
Current version of the BlomSTREET™ only supports vector data in GML format. If you have datasets
in other formats, they won’t visualize in the BlomSTREET™ window.
Figure 104: Vector data over BlomSTREET™ image
98
BlomDESKTOP ViewerTM User Guide v3.5 r1.0a
11
Connection to external WMS Servers
BlomDESKTOP Viewer™ allows you to connect to an external WMS server and use those services as
an overlay (or baselayer) on top of any Data Source previously loaded using the tool.
This chapter covers the procedure to load and configure an external WMS service.
NOTE: The WMS services on BlomDESKTOP ViewerTM are usually local services that provide
information only for the selected country. Blom disclaims any responsibility derived from outages,
poor performance or any other issue related to the service provided by third party organizations.
11.1 Adding a WMS layer
WMS services are added at window level. This means that the selected service will be loaded and
displayed for a given display window on the user interface.
To add a WMS layer simply right-click on the window name on the Dataview explorer and select the
Add WMS layer… option.
Figure 105: Adding a WMS Layer
This will open the Add WMS Layer dialog box.
99
BlomDESKTOP ViewerTM User Guide v3.5 r1.0a
Figure 106: Add WMS Layer Dialog Box
The server address list box will show any previous servers that you may have loaded. This list will
be empty to begin with. In order to load a WMS server you will need to create an entry for it. Do so
by clicking on the New… button to open the Add new WMS server dialog box.
Figure 107: Adding a new WMS Server
Here you will need to provide a name for the service, for later reference on the Server name field,
and to type the full URL of the WMS server you want to load.
100
BlomDESKTOP ViewerTM User Guide v3.5 r1.0a
Figure 108: WMS server parameters introduced
The layer name will now appear on the list of server addresses (see below)
Figure 109: Server ready for connection
You now need to connect to that server by clicking on the Connect button. Once connected, a list
of the available layers for the service will appear on the dialog box (see below).
Note - You can change the image encoding for the service by selecting the GIF, JPG or PNG buttons,
and also change the Layer Name by selecting a new name for the service.
101
BlomDESKTOP ViewerTM User Guide v3.5 r1.0a
Figure 110: WMS Server connected
Now you need to select which layers you want to retrieve for display in BlomDESKTOP Viewer™. To
do this, simply click on them with the mouse. Use the Ctrl key to select/unselect additional layers as
needed. In the example below we have selected the first three layers in the service.
Figure 111: Selecting layers
You can also change the order in which the WMS layers will be displayed on BlomDESKTOP
Viewer™. To do this, simply click on the Layer Order tab. As seen below, to change the display
order of any given layer, just click on its name and press the arrow buttons to move the order up or
down on the list.
102
BlomDESKTOP ViewerTM User Guide v3.5 r1.0a
Figure 112: Changing layer order
Once you are happy with the settings, click on the Add WMS Layer… button to connect to the
service and display it on top of your data.
Figure 113: The WMS Service is displayed
103
BlomDESKTOP ViewerTM User Guide v3.5 r1.0a
11.2 Modifying the list of services
Once you have defined a WMS service on BlomDESKTOP Viewer™, it will remain on your list of
services for easy access. You can modify the parameters of any of these services whenever you like.
Open the Server address list to see the list of pre-loaded WMS servers.
Figure 114: Different servers on the list
a) Click on the Edit… button to open the Edit WMS Server (same as Figure 107) and
modify the service parameters as needed.
b) Click on the Delete button to delete the WMS server from the list. Caution: this will not
ask you for confirmation and the service will be deleted as you press the button.
11.3 Low-performance WMS Servers
There will be some cases where the WMS Server you are connecting to has poor performance. In
order to speed up the performance of BlomDESKTOP Viewer™ you can open the Add WMS Layer
dialog and uncheck the Autorefresh WMS layer when map moves option. This can also be done by
right-clicking on the WMS name on the DataView explorer and un-checking the Autorefresh menu
option. By default BlomDESKTOP Viewer™ will do a call to the WMS server whenever the image
data changes by zooming or panning. Unselecting the Autorefresh option will disable further calls
to the WMS server until you:
a) Manually order BlomDESKTOP Viewer to refresh data by right-clicking on the WMS service
name and selecting the Refresh Now option
b) Check again the Autorefresh option by any of the two methods described above.
104
BlomDESKTOP ViewerTM User Guide v3.5 r1.0a
12
3D capabilities
BlomURBEX 3DTM is an online platform that streams the photorealistic 3D urban models produced
by Blom and allows its integration in different end-user applications through the use of its API and
SDKs.
BlomDESKTOP ViewerTM now includes direct access to BlomURBEX 3DTM, allowing the user to view
and navigate through the Blom3D model repository without the need to use a different viewer or
application. If your BlomURBEX™ credentials (see section 3.2.2.1) grant you access to 3D models,
you will be able to work with them and display them synchronized with other windows in your
workspace.
Available data models in BlomURBEX 3DTM are:
•
•
•
BlomURBEXTM Ortho imagery including overlays.
Urban 3D models in four different Levels of Detail (LOD)1
Digital Terrain Models (DTMs)
12.1 Opening a 3D window
3D windows in BlomDESKTOP Viewer™ are different to standard windows because they contain the
3D viewer control. This means you will need to open a separate window to see 3D models on the
tool.
To open a 3D window, right-click on the Dataview name on the Dataview explorer, or right-click on
any window group name and select the Open new 3D window… option.
Figure 115: Opening a 3D View
1
Refer to the BlomURBEX 3DTM Product Description for details on the different LODs for Blom3DTM models.
105
BlomDESKTOP ViewerTM User Guide v3.5 r1.0a
This will open a new 3D window on the selected window Group (or create a new window Group if
opened at Dataview level).
Figure 116: 3D window created
12.2 Synchronizing views
The 3D window will not appear centred on a given city or area. You can navigate the 3D viewer
using the standard controls (see section 12.3, below), use the Go To… option right clicking on the
3D Window, or synchronize the view with another window.
As detailed on section 4.5.4.3, you can choose which windows you want to synchronize. Simply click
on the 3D view, then right-click on their name on the Dataview explorer and select the
Synchronized option in the menu. All windows marked as Synchronized will change their view
according to any user interaction done on any one of the synchronized windows.
Note that the synchronized windows need to be on the same window Group in order for the
synchronization to work correctly. Otherwise you will need to synchronize the windows Groups.
See section 4.5.4.3 for additional details.
106
BlomDESKTOP ViewerTM User Guide v3.5 r1.0a
Figure 117: Synchronized 2D and 3D views
12.3 Navigating through the 3D models
To move and rotate the models and the viewing camera you can use the Navigation Pad located in
the bottom right part of the screen, or use the mouse and keyboard.
107
BlomDESKTOP ViewerTM User Guide v3.5 r1.0a
12.3.1 Navigation Pad
•
•
•
•
Use the central arrows to move the models forward, backwards, left and right.
Use the buttons located between zoom buttons and central arrows to move the camera up
and down (sky/ground)
Use the buttons with arrows located in top of the navigation pad to spin left and right
Use the plus and minus button to zoom in and out.
Spin model
Move Model
Zoom
Rotate Model
Figure 118: 3D Navigation Pad
12.3.2 Mouse controls
•
•
•
•
•
•
•
Use the central mouse wheel to zoom in and out.
Left-click and drag to move the models forward, backwards, left and right
Right-click and drag to spin left and right
Press Shift and right-click, and then drag to move the camera up and down
Make a double left-click to zoom in
Make a double right-click to zoom out
Make a double middle-click to point the camera to North.
12.3.3 Keyboard controls
•
•
•
•
•
•
•
Use the arrow keys to move the models forward, backwards, left and right.
Press shift and the up/down arrow keys to tilt the camera up and down
Press shift and the right/left arrow keys to rotate the camera clockwise
Press Ctrl and the right/left arrow keys to rotate the camera counter clockwise
Press Ctrl and the up/down arrow keys to zoom in and out.
F6: puts the viewer in 3D mode
F7: puts the viewer in LiDAR mode (see chapter 13)
108
BlomDESKTOP ViewerTM User Guide v3.5 r1.0a
13
LiDAR datasets
13.1 Introduction
BlomDESKTOP Viewer™ introduces LiDAR visualization capabilities with version 3.0.
The BlomURBEX 3D™ engine has been enhanced to work with LiDAR point clouds in an internal
binary file, optimized for online delivery. BlomDESKTOP Viewer™ can now manage huge LiDAR files
taken directly online from Blom geoservers, reducing costly investments in hardware and storage.
Additionally BlomDESKTOP Viewer™ can work with local LAS and PRJ files, loading them for
presentation.
13.2 Accessing LiDAR data
There are two ways to access LiDAR from BlomDESKTOP Viewer™;
•
•
Online: Using a BlomURBEX™ connection
Offline: Using LAS or PRJ files
The following sections cover these two different ways to work with LiDAR data.
13.2.1 LiDAR data via BlomURBEX™
LiDAR data can be retrieved from the BlomURBEX™ server provided that your login gives you access
to areas where there is LiDAR data available.
In order to access LiDAR data follow these simple steps:
1. Make sure you have a valid connection to BlomURBEX™ defined as a dataset (see section
3.2.2)
2. Navigate to an area on the map where LiDAR data exists.
3. Click on the LiDAR area button
Figure 119. LiDAR area button
Once you click this button the mouse cursor will change to a cross. Now select the centre of the
area to display with your mouse, and then drag to draw the radius of the area to load.
109
BlomDESKTOP ViewerTM User Guide v3.5 r1.0a
Figure 120: Selecting the LiDAR area to visualise
4. Release the mouse button. Once you select the area, BlomDESKTOP Viewer™ will open a
3D window and display the LiDAR model.
Figure 121: LiDAR Model loaded
Note: Depending on the area size and the speed of your internet connection, this may take some
time.
110
BlomDESKTOP ViewerTM User Guide v3.5 r1.0a
13.2.2 LiDAR data from local files
BlomDESKTOP Viewer™ also allows you to load LiDAR from LAS or PRJ files located on your local
hard drive, intranet or external disks.
In order to load a local LiDAR file follow these steps:
1. Right-click on a Window name on the Dataview Explorer and select the Add LiDAR
Overlay… option.
2. Browse to the location of the file (see section XXX for a description on available formats).
3. BlomDESKTOP Viewer™ will read the file and ask for a valid projection. The Projections
dialog box will appear to let you select the required projection for the LAS file.
Figure 122: The Projections dialog box
4. Click on Select when finished. The extent of the LiDAR file will show on yellow colour on top
of the current baselayer (Figure 123). If no area appears on the screen, right-click on the
LAS file name on the Dataview explorer and select the Fit to Screen option (Figure 124).
Figure 123: LiDAR area shown over the baselayer
111
BlomDESKTOP ViewerTM User Guide v3.5 r1.0a
Figure 124: Fit the LiDAR area to the current viewport
5. Once the yellow area is visible, click on the LiDAR button on the toolbar (Figure 119).
6. Once you click this button the mouse cursor will change to a cross. Now select the centre of
the area to display with your mouse, and then drag to draw the radius of the area to load.
Current version limits visualization to 500m radius models (Figure 120).
7. Release the mouse button. Once you select the area BlomDESKTOP Viewer™ will open a 3D
window and display the LiDAR model.
112
BlomDESKTOP ViewerTM User Guide v3.5 r1.0a
Figure 125: LiDAR file loaded in 3D Window
13.2.3 Change LiDAR point size
On the 3D window LiDAR, using mouse right button it is possible to change the LiDAR point size
with the slice including in the menu.
13.2.4 Supported LiDAR Files
BlomDESKTOP Viewer™ v.3.0 supports the following LiDAR file formats:
•
•
LAS format, standard version 1.2
TerraSolid PRJ format
113
BlomDESKTOP ViewerTM User Guide v3.5 r1.0a
13.3 Navigating through the LiDAR models
To move and rotate the model viewing camera, you can use the Navigation Pad located in the
bottom right part of the screen, or use the mouse and keyboard. The visualization control is the
same one used for Blom3D™, so all the mouse and keyboard controls described in section 12.3 are
the same.
If there is enough LiDAR data on the area selected, BlomURBEX will retrieve additional information
as you navigate the LiDAR view, so the 3D LiDAR view will be continuous.
Additionally you can directly change between 3D and LiDAR view using the keyboard:
•
•
F6: puts the viewer in 3D mode
F7: puts the viewer in LiDAR mode
13.4 Visualisation options
LiDAR data in BlomWEB Viewer™ can be visualised in nine different modes. These modes can be
selected by right-clicking on the LiDAR 3D window and selecting one of the following options:
Figure 126: Menu with different ways of view
114
BlomDESKTOP ViewerTM User Guide v3.5 r1.0a
13.4.1 Classification-based
This view displays LiDAR data based in the classification information stored in the original LAS
file(s).
Figure 127: LiDAR data in classification-based view
115
BlomDESKTOP ViewerTM User Guide v3.5 r1.0a
13.4.2 Classification with intensity based.
This view displays LiDAR data based on the classification intensity parameters from the file. With
the intensity parameter enabled the information is clearer to identify.
Figure 128: LiDAR data in classification with intensity based view
116
BlomDESKTOP ViewerTM User Guide v3.5 r1.0a
13.4.3 Height HSV based
As shown in the example above, when the height difference in the LiDAR file(s) is not too varied,
height-based colour can lead to a monochrome display. The height HSV colour option provides a
cyclic height range of colours that can produce a better display on small height-variation files.
Figure 129: LiDAR data with height HSV colour
117
BlomDESKTOP ViewerTM User Guide v3.5 r1.0a
13.4.4 Height HSV with intensity based
Similar to the Height HSV based mode above, the Height HSV Intensity parameter is included in the
process to generate the view.
Figure 130: LiDAR data with height HSV colour with intensity based
118
BlomDESKTOP ViewerTM User Guide v3.5 r1.0a
13.4.5 Height (rotating colour) based
This view displays the data with a colour palette based on the range of heights found in the data.
The interval is indicated with a minimum value and maximum value.
Figure 131: LiDAR data in height-based view
119
BlomDESKTOP ViewerTM User Guide v3.5 r1.0a
13.4.6 Height (rotating colour) with intensity based
This view is similar to the previous but includes the intensity parameter in the display of the data.
Figure 132: LiDAR data with height HSV with intensity based
120
BlomDESKTOP ViewerTM User Guide v3.5 r1.0a
13.4.7 Intensity based
This view is generated only with the intensity parameter found in the area indicated.
Figure 133: LiDAR data with intensity based
121
BlomDESKTOP ViewerTM User Guide v3.5 r1.0a
13.4.8 Real Colour
This is a true colour representation of the LiDAR dataset taken from the information stored in the
original LAS file(s).
Figure 134: LiDAR data with True colour
122
BlomDESKTOP ViewerTM User Guide v3.5 r1.0a
13.4.9 Real Colour with intensity based
This is a true colour representation including the intensity parameter of the LiDAR dataset, taken
from the information stored in the original LAS file(s).
Figure 135: LiDAR data True color with intensity based
13.5 Customizing LiDAR Views
For each view described in previous sections, it is possible to customise them further.
To customise each view simply select the Define custom colour mode option. This option allows
you to change the default visualisation of the LiDAR data in four modes
Classification
Height
True Colour
Intensity
123
BlomDESKTOP ViewerTM User Guide v3.5 r1.0a
13.5.1 Custom Classification
Figure 136: Custom Classification
In this window BlomDESKTOP provides information of the current classification colours used. For
each class the user can change the colours represented in the data. In the example the ground is
represented by a brown colour.
For each class you can change the colour value in Hexadecimal format, or you can click in the colour
dropdown box and choose a colour.
The option ‘Use LiDAR point intensity as transparency value’ will include this parameter into the
process of the view generation.
124
BlomDESKTOP ViewerTM User Guide v3.5 r1.0a
13.5.2 Custom Height
Figure 137: Custom Height
This window allows you to change the height visualisation colours for the LiDAR data.
You can switch between relative heights and absolute heights by simply clicking the appropriate option
button (use relative height values and use absolute height values).
It is possible to define new height ranges for the LiDAR data by using the text box Height Value. After a
value has been chosen, the button “Add new range” must be used to generate the new range. The whole
list of ranges appear into the Height ranges list box
If you want to repeat the colours into this representation, it is required that you enable the LiDAR colours
based on rotating range, and BlomDESKTOP will ask the minimum height loop and the maximum height
loop.
Check the option ‘Use LiDAR point intensity as transparency value’ to include this parameter into the view
generation process.
125
BlomDESKTOP ViewerTM User Guide v3.5 r1.0a
13.5.3 Custom True Colour
Figure 138: Custom True Colour
If you tick the option to ‘Use LiDAR point intensity as transparency value’, this will include the
parameters into the view generation process.
126
BlomDESKTOP ViewerTM User Guide v3.5 r1.0a
13.5.4 Custom Point Intensity
Figure 139: Custom Intensity
This option allows you to customise the intensity view for the LiDAR data. It is possible to define a
new range for the intensity parameter by simply typing the value in the text field, and then by
pressing the button ‘Add New range’. For each range it is possible to select one colour for its
representation into the view.
13.6 LiDAR profiles
BlomDESKTOP Viewer™ allows the extraction of terrain profiles from LiDAR datasets, and to
perform precise measurements using the data.
In order to access LiDAR data follow these simple steps:
1. Make sure you have a valid connection to BlomURBEX™ defined as a dataset (see section
3.2.2) or load an offline local LAS file.
2. Navigate to an area on the map where the LiDAR data exists.
3. Click on the LiDAR profile button.
127
BlomDESKTOP ViewerTM User Guide v3.5 r1.0a
Figure 140. LiDAR profile buttons
Now you need to select the area of the profile. Using the mouse:
a) Click on the map to define the starting point for the profile.
b) Click again on the map to define the ending point of the profile. A blue line will display
indicating the length of the profile.
c) Move the mouse to position and define the width of the profile to be extracted.
d) Click to finish.
BlomDESKTOP will then extract the profile data and open the LiDAR profile window as seen in the
screenshot below. Depending on the LiDAR density and size of the profile this operation may take a
few moments.
Figure 141: LiDAR profile
Moving the mouse cursor in the profile window will display the measurements relative to the
profile min/max guides. The figures will also change in real-time as you move the cursor.
128
BlomDESKTOP ViewerTM User Guide v3.5 r1.0a
Clicking and dragging on any part of the LiDAR viewer will pan the image allowing you to move as
desired. Zooming in and out can be performed using the mouse wheel.
All measurements are relative to the min/max guides. These are the yellow vertical lines that define
the extension of the profile. The green line defines the height as zero, and the red line defines the
maximum height. You can click and drag on any one of them to move them and choose the objects
you want to measure.
Figure 142: LiDAR Profile Options
Right-clicking on the profile window will display the LiDAR profile menu. The options are as follows:
•
Fit to screen: This option will make the LiDAR profile window display the total extension of
the profile
•
Graph Mode: Reserved for future versions of BlomDESKTOP
•
Show Grid: Default option. Deselect it to hide the grid ruler from view
•
Show Mouse Guides: Default option. Deselect it to hide the mouse measurements from
view
•
Show Stats: Default option. Deselect it to hide the LiDAR stats from view
•
Show Min/Max lines: Default option. Deselect it to hide the vertical/horizontal mouse
guides from the view
•
Reset Max/Min: Select this option to reset the Max/Min lines to their default positions
•
Opacity: This option allows you to change the opacity
•
Colour mode: Use this option to select the colour mode for the profile view. Options are
the same are described in section 13.4
•
LiDAR Point Size: This option allows you to change the point size of the LiDAR data
•
Export image: Saves the current viewport contents to a JPG file
•
Print image: Sends the current viewport contents to a selected printer
129
BlomDESKTOP ViewerTM User Guide v3.5 r1.0a
You can press and hold the shift key and left-click and hold the mouse to draw a rectangle on
screen. The profile viewer will zoom to the area selected in the rectangle.
You can also use the magnifying tool in the profile viewer to zoom on specific image areas (see
section 5.5).
Figure 143: The Magnifying tool in the LiDAR Profile Viewer
130
BlomDESKTOP ViewerTM User Guide v3.5 r1.0a
13.6.1 Toolbar in LiDAR profile
When a profile is created a toolbar will appear in BlomDESKTOP, this toolbar contains the options
explained in the previous section, and are listed below in more detail.
1
2
3
4
5
6
7
8
9
10
11
12
13
14
15
Tool Description
1
Add new point into the LiDAR profile
2
This tool performs horizontal measurements
3
This tool performs vertical measurements
4
Free measurements (vertical and horizontal at same time)
5
Remove all measurements
6
Fit the whole LiDAR data to the screen
7
Open the print dialog to print the content of the LiDAR profile.
8
Export the view to an image
9
Switch to Graph mode
10
Show mouse guides
11
Show grid
12
Show/hide statistics
13
Show/hide maximum/minimum lines
14
Change point size
15
Show/hide metadata
131
BlomDESKTOP ViewerTM User Guide v3.5 r1.0a
13.6.1.1
Add Point
This tool lets you to add point into the LiDAR view
Select the desired add point tool by clicking on the appropriate icon in the toolbar and follow this
procedure for add a new point.
2. Click in any part of the screen to add new point. This point displays the absolute and relative
height.
Figure 144: Add a new point
132
BlomDESKTOP ViewerTM User Guide v3.5 r1.0a
13.6.1.2
Horizontal measurement
This tool
allows doing horizontal measurements.
1. Click on any part of the lidar viewer
2. Move the mouse horizontally to draw a new line
3. Click to finish, and the horizontal measurement appears on the screen (in meters).
Figure 145: Horizontal measurement
133
BlomDESKTOP ViewerTM User Guide v3.5 r1.0a
13.6.1.3
Vertical measurement
This tool
allows doing vertical measurements.
1. Click on any part of the lidar viewer
2. Move the mouse vertically to draw a new line
3. Click to finish, and the vertical measurement appears on the screen (in meters).
Figure 146: Vertical measurement
134
BlomDESKTOP ViewerTM User Guide v3.5 r1.0a
13.6.1.4
Free measurement
This tool
allows doing measurements in any directions, not only in vertical and horizontal.
4. Click on any part of the lidar viewer
5. Move the mouse in any direction to draw a new line
6. Click to finish, and the measurement appears on the screen (in meters).
Figure 147: Free measurement
135
BlomDESKTOP ViewerTM User Guide v3.5 r1.0a
13.6.1.5
Remove all measurements
Selecting this tool
13.6.1.6
all the measurements will be removed from the lidar viewer.
Fit to screen
It may happen that after making several measurements, and several lidar zooms, the all LiDAR data
are not visualized on the screen, then there is a tool in the toolbar to fit all the LiDAR data to the
screen.
Make click in this button
to fit the whole data into the screen.
Figure 148: Fit to window
In this case, there are several points at 256 meters above the ground. It is probably these points
will be birds.
136
BlomDESKTOP ViewerTM User Guide v3.5 r1.0a
13.6.1.7
Print View
This tool
lets you to print the lidar view content. This tool opens the windows printer dialog,
where it’s possible to select one printer.
Figure 149: Printer Dialog
13.6.1.8
Export View
Next tool
allows exporting the lidar view content to an image. This tool open the “Save As”
windows dialog to select the destination and the format, to store the image.
Figure 150: Save as dialog
Jpeg, Tiff and Png are formats supported.
137
BlomDESKTOP ViewerTM User Guide v3.5 r1.0a
13.6.1.9
Graph mode
This tool
change the visualization into mode graph. Just click in the button of the toolbar.
After click the button in the LiDAR view will appear the LiDAR profile.
Figure 151: LiDAR profile
138
BlomDESKTOP ViewerTM User Guide v3.5 r1.0a
13.6.1.10
Mouse guides
This tool
is a switch to show and hide the mouse guides.
Figure 152: Mouse guides on
If this button is enabled, the mouse guides will be displayed in the LiDAR viewer; if the button is
disabled the mouse guides will be hidden
13.6.1.11
LiDAR View Grid
By default, the LiDAR view grids are enabled, If for any reason it is important to hide the rules, next
button
of the toolbar must be pressed.
This button turns on and off the LiDAR view grids.
139
BlomDESKTOP ViewerTM User Guide v3.5 r1.0a
Figure 153: Grids off
13.6.1.12
Statistics
When a LiDAR profile is made, by default, in the right lower corner of the LiDAR viewer appears the
statistics.
These statistics are dynamics, when the mouse is moved across the LiDAR view the stats are
changed.
Next tool
is used to show and hide the stats
Figure 154: Stats on
140
BlomDESKTOP ViewerTM User Guide v3.5 r1.0a
13.6.1.13
Max/Min lines
This tool
shows and hides the maximum and minimum lines (horizontal and vertical direction)
Figure 155: Max and Min lines
These lines can be moved. The line must be dragged from the current position, and dropped to the
final position.
141
BlomDESKTOP ViewerTM User Guide v3.5 r1.0a
13.6.1.14
Point Size
In the toolbar there is an slice to change the LiDAR point size.
Clicking in the slice the point size is selected.
Figure 156: LIDAR point size 1
142
BlomDESKTOP ViewerTM User Guide v3.5 r1.0a
Figure 157: LIDAR point size 3
13.6.1.15
Metadata
This tool
14
shows and hides the LiDAR metadata on the screen.
Image tools
As described in Chapter 6, Blom Libraries include a collection of discrete images. These images can
be:
•
•
•
NADIR
Oblique
Ortho
In addition Data Sources also provide continuous (mosaic) images.
BlomURBEXTM only includes Oblique images and the continuous mosaic of vertical and
orthorectified obliques.
BlomDESKTOP ViewerTM lets you easily manage this collection of images. Here you will learn to:
•
•
Open images in a separate window
Search the collection of images
143
BlomDESKTOP ViewerTM User Guide v3.5 r1.0a
•
•
Export images
Print images
14.1 Opening images in a new window
To open an image in a new window, right-click on the desired point on the image and select the
appropriate menu option:
•
Open oblique image in new window: you can select the desired view (North, South, West,
and East). The oblique image will be extracted from the library or the server in a new
window in the current window Group.
•
Open mosaic imagery in new window: you can select Ortho to open the vertical mosaic, or
a view (N, S, E, W) to open the mosaic of orthorectified obliques on a new window in the
current window Group.
•
Open vertical image in new window: this option will open the individual Ortho image for
the selected point (if available from the selected data sources) on a separate window in the
current window Group.
•
Open Nadir image in new window: this option will open the individual Nadir image for the
selected point (if available from the selected data sources) in a new window in the current
window Group.
14.2 Searching images
Because of the way oblique imagery is captured, the aircraft passes over the same point several
times. This guarantees that for each point of the terrain, there may be up to 18 different images,
because a single point may appear in different oblique images. BlomDESKTOP ViewerTM manages
these sets of images, from the available Data Sources, making it easy to navigate for the end user.
In addition, BlomDESKTOP ViewerTM allows users to see all available images for any given point.
To do this, simply right-click on any point on a view and select the Search Images option and a view
orientation (or Any for all available views). The following window will appear:
144
BlomDESKTOP ViewerTM User Guide v3.5 r1.0a
Figure 158: Search images
The left panel in this window shows all available views for the selected orientation. The currently
selected view is previewed on the main area of the window, with a red cross showing the location
of the initially selected point.
•
The filter option at the top left area of the window allows you to alter the orientation of
the selected images. So it is possible to change from one view to another within the
window.
•
The left panel shows an image list by default. You can click on the Image Name List tab to
show a text list of the available images.
•
The Properties button will show the metadata information for the previewed image (Image
size, area, orientation, sensor position, etc.)
•
The Open Image button will open the selected image on a new window in the current
window Group.
Note that the red cross showing the location of the selected point will also appear on the original
window. This cross will disappear if you perform any operation on the window such as zoom or
scroll. In the case of obique images shown on a new window, the red cross will remain while the
window is kept Blocked.
145
BlomDESKTOP ViewerTM User Guide v3.5 r1.0a
14.3 Exporting images
BlomDESKTOP ViewerTM allows you to export the contents of the selected window to a
georeferenced JPG.
To do this, simply position your view as required, right-click on it and select the Export menu
option.
Two options are available:
•
•
Export current viewport: this will export the contents of the selected window as they are
shown on screen.
Export entire image: this option only works on discrete images and it will save the whole
image to disk regardless of the visible portion of it on screen.
The Save As… dialog box will then appear, allowing you select the name and path to save the
image.
Figure 159: Exporting image
Future versions of BlomDESKTOP ViewerTM will include additional formats and features for this
function.
14.4 Exporting layers
Vector and annotation overlays can be exported to SHP, KML and GML files.
To export a given overlay, right-click on its name on the Dataview Explorer and select the Export
Layer… option.
You will need to select first the desired projection for the resulting file from the available projection
in the Export Layer dialog box.
146
BlomDESKTOP ViewerTM User Guide v3.5 r1.0a
Figure 160: Select projection to export file
Once the desired projection is found, the Save As… dialog box will appear allowing you to provide a
name for the file and file type from the different supported formats: SHP, KML, GML, MIF or DXF.
147
BlomDESKTOP ViewerTM User Guide v3.5 r1.0a
Figure 161: Exporting file to SHP
14.5 Printing
BlomDESKTOP ViewerTM allows you to print the contents of the selected window. Printing options
will depend on the features of the available printers.
In order to print the image, simply right-click on the desired window and select the Print option.
Depending on the image type contained in the dataview, there are three different ways to print the
imagery:
•
•
Print current viewport: this will print the contents of the selected window as they are
shown on screen.
Print entire image: this option only works on discrete images and it will print the whole
image regardless of the visible section on screen.
The Print dialog box is a system dialog box so it will depend on your Windows version and the
available printers you have set up.
•
Advanced print settings: this option will only work on discrete images and ortho images.
This option displays a dialog window with the options for printers and the ways to print the
images.
148
BlomDESKTOP ViewerTM User Guide v3.5 r1.0a
14.5.1 Advanced Print Settings – Printing Ortho mosaic images.
When the image shown in the dataview is an ortho image the advanced print settings with next
options:
Figure 162 Ortho mosaic images dialog box
Printer: The drop down list contains all the printers the computer has configured.
Paper Size: This list shows the available paper size for each printer selected in the printer
parameter.
Resolution: This shows the print resolution, in dots per inch (dpi).
Orientation: This configures whether the image will be printed in landscape or portrait orientation.
Grayscale, colour: This allows you to print in either grayscale, or in true colour.
149
BlomDESKTOP ViewerTM User Guide v3.5 r1.0a
The map printing details section contains two elements:
-
Print visible overlays: This option when selected will print all visible overlays loaded in
the dataview.
-
Zoom Level: The zoom level displays the current zoom onscreen. For example, if the
image displayed in the dataview is at the zoom level 18, and another zoom level with
more resolution is required, it is possible to select another zoom level (e.g. printer:20)
by simply moving the slide bar. This action prints the current view extent in the
dataview but with the zoom level indicated (e.g printer: 20). It is possible to print the
image at a different resolution to the one shown currently on screen.
The ortho mosaic image printing option allows two ways to print the image:
-
Fit to print. The image is scaled to the paper size keeping the image proportions (height
and width).
-
Print to exact scale.
•
The scale must be selected from a predefined list.
•
It is also possible to define a custom scale through a number writing this
number in the text field of the custom scale
When the scale is chosen one of these options must be selected.
•
Use all printing area. If the scale selected does not fill the whole of the paper,
this option will increase the image to fill the whole paper size.
•
Respect extend displayed in the window. This is the opposite of the Use all
the printing area option. In this case there might be white areas around the
image because the scale selected isn’t large enough for the image to fill the
whole page. The objective is to print only the image contained in the dataview.
150
BlomDESKTOP ViewerTM User Guide v3.5 r1.0a
14.5.2 Advanced Print Settings – Printing discrete images.
When printing a discrete image the following Advanced Print Settings shows are available:
Figure 163 Discrete images dialog box
When selected, these options are disabled
-
Zoom level section
Ortho mosaic image.
If printing discrete image is enabled, it will only have two options, these are:
-
Fit to print area. (Described in the previous section)
Print to exact scale.
In both cases (discrete and ortho mosaic) the predefined scales are in a close relation to the
paper size where the image will be printed.
Note - If the image is bigger than the printing area, the following option will appear to notify
the user that the image will be truncated (clipped).
151
BlomDESKTOP ViewerTM User Guide v3.5 r1.0a
15
Customising your environment
15.1 BlomDESKTOP ViewerTM Settings
The overall behaviour and preferences of BlomDESKTOP ViewerTM windows can be controlled in the
Settings dialog box. You can find this in the Settings->Preference… menu.
Figure 164: BlomDESKTOP Viewer™ Preferences
The following options are available:
•
Image rotation mode selector
•
Magnifying tool options
•
Selection of Unit System for measurements
152
BlomDESKTOP ViewerTM User Guide v3.5 r1.0a
•
Activation of crosshair on main window and selection of colour and symbol.
•
Projection to display coordinates in
•
Enabling/disabling workspace selection (splash screen) on start-up
•
Checking updates at start-up
•
Manual or Automatic proxy configuration
15.1.1 Oblique orientation
Oblique images have four possible orientations, depending on the direction they were captured (N,
S, E, W). While the images can be displayed in their ‘correct’ orientation, this can be confusing for
the user as the buildings may appear rotated. The behaviour of BlomDESKTOP ViewerTM regarding
the visualization of orthorectified oblique images can be controlled with the first set of options in
the Settings dialog box.
•
Do not rotate the view in mosaic mode (the buildings may not appear properly oriented):
This option will display the north in the upper side even if the map is showing mosaic view
in south/east/west orientation.
•
Rotate view to display buildings properly in mosaic mode: This option will rotate the map
accordingly in mosaic mode in order to show the buildings properly (i.e., roofs pointing
‘upwards’) even if the map is in south/east/west orientation.
153
BlomDESKTOP ViewerTM User Guide v3.5 r1.0a
15.1.2 Magnifying tool options
The magnifying tool has been described in section 5.5. It is enabled by default but you can
deactivate it by deselecting the Enable Magnify mode checkbox.
The default magnify zoom level is set at 2. You can also modify this using the dropdown list on the
right.
15.1.3 Selection of unit system in measurements
When you perform any measurement in BlomDESKTOP Viewer™ the default units are meters.
You can select the unit system from the Preferences dialog box. Available options are:
•
•
Metric system: Measurements in meters
Imperial system: Measurements in feet
15.1.4 Projection to display coordinates
The lower right corner of the BlomDESKTOP Viewer™ screen will show the coordinates of the last
point clicked on the active window. Default projection system is Latitude-Longitude (EPSG:4326).
This can be changed in here by clicking on the Choose Projection… button and selection a new one
from the list of available projections.
15.1.5 Crosshair
This option will show a crosshair in the centre of the window. This crosshair provides the location of
the centre of the current view in any other synchronized window that you may also have. This way,
it is possible to check the location of the centre of the current view when working with different
views, dual view or multi view.
From the setting dialog you can:
154
BlomDESKTOP ViewerTM User Guide v3.5 r1.0a
•
•
•
Show/hide the crosshair just by checking/un-checking the Show cross in centre of map
option.
Select the Symbol to use as crosshair from the list of symbols under the Crosshair symbol
option.
Select the colour of the crosshair from the colour list under the Crosshair colour option.
15.1.6 Enabling workspace selection at start-up
As described on section 4.1.1, BlomDESKTOP Viewer™ will launch asking you to select a workspace
to open. This is the default option.
If you want to override this behaviour, just unselect the Enable workspace selection at the
beginning of the application checkbox.
Check it again to return to the default behaviour.
15.1.7 Checking updates at startup
By default, this option is selected so BlomDESKTOP Viewer™ will search for new versions at startup.
If you want to change this behaviour just check/uncheck this option as needed.
15.1.8 Manual/Automatic proxy configuration
This option is used in case the proxy server is not automatically detected due to the use of
configuration scripts. If that is the case, select the manual option and type the needed proxy
parameters.
15.2 Change language
Default language for BlomDESKTOP ViewerTM is English, although additional language packs are
provided:
•
•
•
•
•
•
•
Spanish
French
Romanian
Finnish
Norwegian
Danish
Italian
To select a new language pack, go to Settings -> Change Language -> and select the desired
language pack.
BlomDESKTOP ViewerTM will need to be restarted to apply these changes and will ask for
confirmation prior to proceed.
155
BlomDESKTOP ViewerTM User Guide v3.5 r1.0a
Contact your local Blom representative for instructions on how to add additional languages to
BlomDESKTOP ViewerTM if required.
156
BlomDESKTOP ViewerTM User Guide v3.5 r1.0a
16
BlomDESKTOP Remote Invocation™
16.1 Introduction
Version 2.1 of BlomDESKTOP Viewer™ includes a new, powerful feature called BlomDESKTOP
Remote Invocation™. This feature allows users to execute actions inside BlomDESKTOP Viewer™ by
sending commands to a port opened by the program. This way you can control remotely the
behavior of the tool making it possible to open it under certain initial conditions for data displaying
or the like.
Only the first BlomDESKTOP Viewer™ program instance in execution can receive remote actions.
Only one client is allowed simultaneously.
BlomDESKTOP Viewer™ starts a socket server if is the first running instance and then waits to
receive further commands. The application is also ready to receive commands as arguments on
start-up.
The rest of this chapter is intended for programmers, developers or advanced users, as it covers the
different available commands and some examples of configuration.
16.2 Available Commands
Version 2.1 of BlomDESKTOP Remote Invocation™ has only a valid command. This command
allows you to place the first of the windows in the workspace pre-loaded in a specified zoom level
and coordinates.
16.2.1 Command Syntax
<?xml version="1.0" encoding="utf-8"?>
<RemoteActions xmlns:xsi="http://www.w3.org/2001/XMLSchema-instance"
xmlns:xsd="http://www.w3.org/2001/XMLSchema">
<RemoteActionsVersion>2.0.8</RemoteActionsVersion>
<WorkspacePath>C:\Users\MyUser\Documents\BlomDESKTOP
Viewer\Workspaces\defaultworkspace316.wksx</WorkspacePath>
<InitialLatitude>279020.1218014881</InitialLatitude>
<InitialLongitude>3061526.4340042621</InitialLongitude>
<ZoomLevel>5</ZoomLevel>
<MapOrientationType>Ortho</MapOrientationType>
157
BlomDESKTOP ViewerTM User Guide v3.5 r1.0a
<MapViewType>Mosaic</MapViewType>
<Proj4></Proj4>
</RemoteActions>
<!-- END DATA -->
16.2.2 Valid Command Fields
RemoteActionsVersion: Remote actions target BlomDESKTOP Viewer™ version. (Informative only,
nothing to do)
WorkspacePath: Path for workspace files to be opened by BlomDESKTOP Viewer™.
InitialLatitude: Starting Latitude to open the map.
InitialLongitude: Starting Longitude to open the map.
ZoomLevel: Initial Zoom Level to set the map window.
Proj4: Coordinates in a format compatible with the Proj4 definition. If Proj4 is empty, Spherical
Mercator is assumed
MapOrientationType: Valid types are [Any, Ortho, North, South, West, East]. Default value is
Ortho.
MapViewType: Valid types are [Mosaic, Discrete]. Default value is Mosaic.
<!-- END DATA --> Needed to tell to the socket server that actions ends and can process it.
16.2.3 Process Flowchart
Next page shows the process flowchart for the Remote Invocation command.
158
BlomDESKTOP ViewerTM User Guide v3.5 r1.0a
159
BlomDESKTOP ViewerTM User Guide v3.5 r1.0a
16.3 Testing BlomDESKTOP Remote Invocation™
You can use PuTTY to test the BlomDESKTOP Remote Invocation™. PuTTY can be downloaded from
http://www.chiark.greenend.org.uk/~sgtatham/putty/download.html
Once installed, you’ll need to configure PuTTY as shown on the image below.
Figure 165: PuTTY Configuration
If the BlomDESKTOP Remote Invocation™, server is UP you will see the following server message
160
BlomDESKTOP ViewerTM User Guide v3.5 r1.0a
Figure 166: Server ready
You can now send commands to the server.
If a valid command is detected, the server response with a [200] code, as shown below:
Figure 167: Valid Command Received
However, if an invalid command is detected, the server will response with a [400] code
Figure 168: Invalid Command Received
161
BlomDESKTOP ViewerTM User Guide v3.5 r1.0a
16.4 Running BlomDESKTOP Viewer™ from a batch file
It is possible to create a batch file that receives coordinates as arguments and then creates a
command file to launch BlomDESKTOP Viewer™. The flowchart should be:
Here you can find an example of a batch file that:
a) receives coordinates as arguments,
b) creates a command file with these arguments
c) launches BlomDESKTOP Viewer™ using this generated command file.
@echo off
rem begin configuration *****************
set destination_path=%TEMP%
set workspace_path=C:\Users\MyUser\Documents\BlomDESKTOP
Viewer\Workspaces\defaultworkspace316.wksx
set blomdesktop_path=C:\Users\MyUser\Documents\Visual Studio
2010\Projects\BlomDESKTOP\v.1.2.1\2.0.0 (2011-0701)\BlomDESKTOP\BlomDESKTOP\bin\Release\BlomDESKTOP Viewer.exe
set zoom_level=6
set proj4=
rem valid values for map_orientation_type: Any,Ortho,North,South,West,East
set map_orientation_type=West
rem valid values for map_view_type: Mosaic,Discrete
set map_view_type=Mosaic
162
BlomDESKTOP ViewerTM User Guide v3.5 r1.0a
rem end configuration ***************
set remote_actions_version=2.0.8
set destination_filename=bd.launcher
if [%1]==[] goto usage
if [%2]==[] goto usage
set
destination_full_name=%destination_path%%time:~0,2%%time:~3,2%%time:~6,2%%
time:~-2,2%_%date:~-10,2%%date:~-7,2%%date:~-4,4%%destination_filename%
echo Generating file: %destination_full_name%
rem generate file
echo ^<?xml version="1.0" encoding="utf-8"?^> >%destination_full_name%
echo ^<RemoteActions xmlns:xsi="http://www.w3.org/2001/XMLSchema-instance"
xmlns:xsd="http://www.w3.org/2001/XMLSchema"^> >>%destination_full_name%
echo
^<RemoteActionsVersion^>%remote_actions_version%^</RemoteActionsVersion^>
>>%destination_full_name%
echo ^<WorkspacePath^>%workspace_path%^</WorkspacePath^>
>>%destination_full_name%
echo ^<InitialLatitude^>%1^</InitialLatitude^> >>%destination_full_name%
echo ^<InitialLongitude^>%2^</InitialLongitude^> >>%destination_full_name%
echo ^<ZoomLevel^>%zoom_level%^</ZoomLevel^> >>%destination_full_name%
echo ^<MapOrientationType^>%map_orientation_type%^</MapOrientationType^>
>>%destination_full_name%
echo ^<MapViewType^>%map_view_type%^</MapViewType^>
>>%destination_full_name%
163
BlomDESKTOP ViewerTM User Guide v3.5 r1.0a
echo ^<Proj4^>%proj4%^</Proj4^> >>%destination_full_name%
echo ^</RemoteActions^>^ >>%destination_full_name%
echo ^<!-- END DATA --^> >>%destination_full_name%
echo START
start "" "%blomdesktop_path% " "%destination_full_name%"
@echo Done!
goto :eof
:usage
@echo Invalid parameters...
@echo Usage: %0 ^<Latitude^> ^<Longitude^>
pause
exit /B 1
16.4.1 Configuring the Batch file
The following configuration options can be used in the example above:
•
destination_path: path where the output command file is generated
•
workspace_path: path of workspace that will be included in output command file
•
blomdesktop_path: path where BlomDESKTOP Viewer™ is installed and will be launched
from when the output command file is generated
•
zoom_level: level of the desired zoom that will be included in output command file
•
proj4, proj4 definition of coordinates provided to batch file as arguments. If not provided,
default is Spherical Mercator
•
map_orientation_type, desired map orientation type [Any,Ortho,North,South,West,East]
•
map_view_type, desired map view type [Mosaic,Discrete]
164
BlomDESKTOP ViewerTM User Guide v3.5 r1.0a
16.5 Limitations
The actions will be executed in the first window available in the loaded workspace (2D / 3D)
16.6 Starting BlomDESKTOP Viewer™ with command-line arguments
Starting from version 2.1, it is possible to launch BlomDESKTOP Viewer™ with two kinds of
parameters:
•
•
Path for a valid command file
Path for an existing workspace file
165
BlomDESKTOP ViewerTM User Guide v3.5 r1.0a
17
The BlomDESKTOP ViewerTM Help menu
The BlomDESKTOP ViewerTM Help menu includes three options that are described below.
17.1 Open BlomDESKTOP ViewerTM user manual
Selecting this option will open the PDF version of this manual. This option requires Adobe Reader™.
17.2 What’s new?
This option will show a text file detailing all versions of BlomDESKTOP ViewerTM and their new
features.
17.3 Check now for updates…
Selecting this option will verify if there is a new BlomDESKTOP Viewer™ version available. If that is
the case, it will be downloaded for installation.
17.4 About BlomDESKTOP ViewerTM…
This option opens the About dialog that shows:
•
•
•
Current version and revision number of BlomDESKTOP ViewerTM.
Versions used of the .NET Framework and NatBDSK
Application code string
Remember that the Application code is needed to obtain your valid license for BlomDESKTOP
ViewerTM (see Section 2.3).
166


![ArcMap [v10.0- v.10.2] User manual](http://vs1.manualzilla.com/store/data/005724954_1-1f5d2da94c774511c91b8b97dbbbcd93-150x150.png)

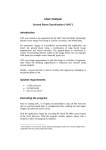
![Intergraph Geomedia [6.1-2013] User manual](http://vs1.manualzilla.com/store/data/005689587_1-58c82d14f3ba8ebe92b5c45af00d079c-150x150.png)


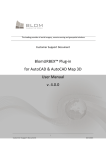

![MapInfo [v9.5 - v10.0] User manual PDF](http://vs1.manualzilla.com/store/data/005662542_1-c58f11f989f54f88b5c049879cd1b1b4-150x150.png)
![Autodesk MAP [2007-2009] User manual](http://vs1.manualzilla.com/store/data/005814944_1-7d4ade0f748ad8f526e057550ef902e1-150x150.png)

![Autocad [2007-2009] User manual](http://vs1.manualzilla.com/store/data/005776291_1-e398978f20775312922048f8d5b8f7a5-150x150.png)