1
Getting Started
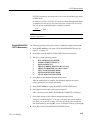
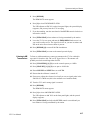
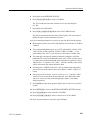
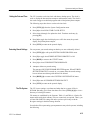
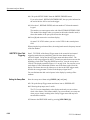
5. Press [D] to see the analog display.
This turns off the D storage register (the only one currently enabled). When
all registers are turned off, the analog display appears.
6. Repeatedly press [D] to toggle the D register on and off several times. Notice
the similarity between displays.
7. Turn the D register on.
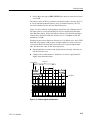
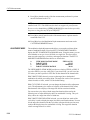
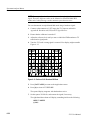
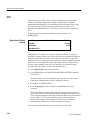
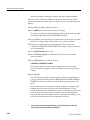
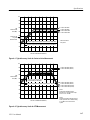
To obtain the max/min display, the maximum and minimum amplitudes of the
analog spectrum are each sampled at 256 points. Plotting the two interleaved sets
of 256 points produces the 512 point graph of the spectrum that you see. This
display not only imitates the analog spectrum, but can also assist in detecting
low-level signals by more effectively showing the characteristic void they
produce under the noise floor.
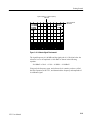
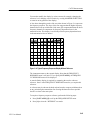
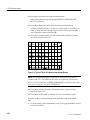
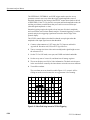
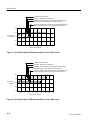
The spectral display is overlaid by a 32-character wide by 16-character high text
screen. Not all of the text fields are displayed all the time, and you can turn the
text screen on and off by pressing [READOUT].
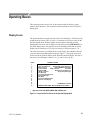
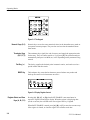
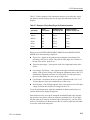
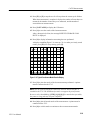
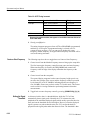
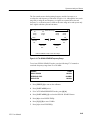
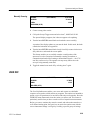
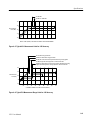
The top portion of the text screen contains two data readout columns that are
present whenever the text screen is turned on. The readouts show spectrum
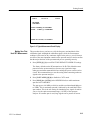
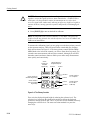
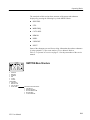
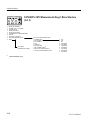
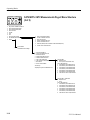
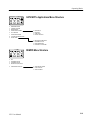
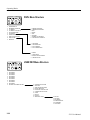
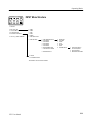
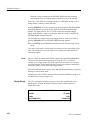
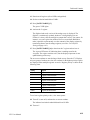
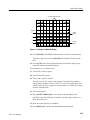
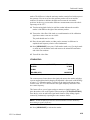
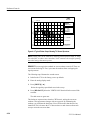
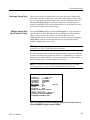
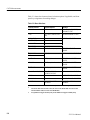
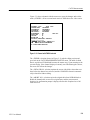
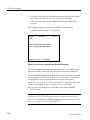
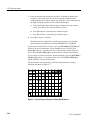
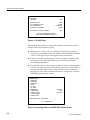
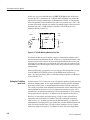
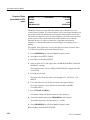
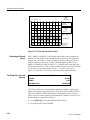
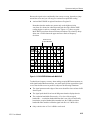
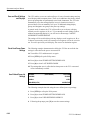
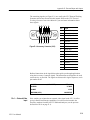
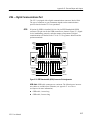
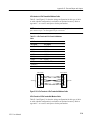
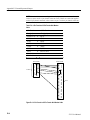
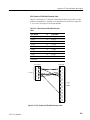
analyzer settings or measurement results. Figure 2–2 shows the data normally
displayed in the readout columns.
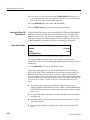
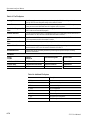
Center frequency
Reference level
Horizontal scale factor
Resolution bandwidth
Marker frequency
Marker amplitude
Vertical scale factor
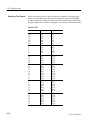
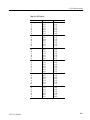
Channel table and number
(Various messages may appear as needed below the
data readout columns)
Figure 2–2: Normal On-Screen Data Readouts
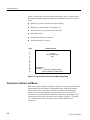
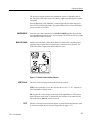
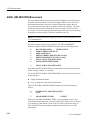
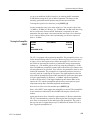
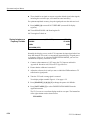
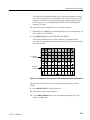
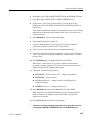
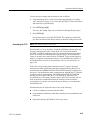
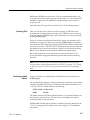
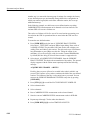
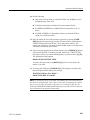
With the spectrum analyzer in the MAX SPAN mode (indicated by MAX
following the horizontal scale factor), the resulting spectrum spans the entire
input frequency range. In this mode, the first item in the left column lists the
frequency at the location of the frequency marker (the intensified spot on
the display).
2715 User Manual
2–7