1
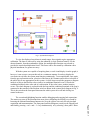
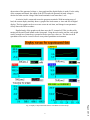
Session 2259
LABVIEW BASED ELECTRIC MACHINES LABORATORY
INSTRUMENTATION
S. A. Chickamenahalli, V. Nallaperumal, V. Waheed
Wayne State University/Wayne State University/Patti Engineering
Abstract
This paper presents an innovative instrumentation project that consisted of interface of a
dc motor-generator set to an IBM PC using National Instruments Data Acquisition (NIDAQ)
tools and display of experimental data using LabVIEW software. The goal was to achieve realtime measurement and display of experiment waveforms on the PC screen and store these
waveforms for later use in reports, illustrations, etc. Example front panel screens and block
diagrams developed utilizing the ‘G’ graphic programming capabilities of LabVIEW are
discussed and appropriate procedures are outlined. Configuration of the DAQ hardware and
details of the signal sensing and conditioning circuits are provided. Real-time experiment data
captured on LabVIEW screens are enclosed. Many aspects of data acquisition, instrumentation,
interfacing, programming, and World Wide Web (WWW) referencing made possible in this
project are highlighted. The paper is concluded with a report on the current utilization of the
project in a NSF funded curriculum development project and by providing the future scope of the
project.
INTRODUCTION
Technological advances in PC based instrumentation are continuing to utilize the
multimedia capabilities of modern computers. Virtual instrumentation has thus been possible.
While utilizing the computer as its centerpiece, virtual instrumentation provides powerful data
analysis and presentation tools. Virtual instruments are user defined and are programmable
where as traditional instruments have fixed functionality and are hardware controlled. A data
acquisition board (DAQ) plugged into the computer bus allows the instrumentation in
combination with the capabilities of the computer along with signal conditioning hardware. The
board configuration setup software and the LabVIEW software form the software tools.
1
Page 3.387.1
National Instruments has revolutionized the manner in which all scientists and engineers
carryout data acquisition, analyze data, control system operation and display the results. First
introduced in 1983, LabVIEW from National Instruments currently monopolizes the
instrumentation world [1]. Several academic institutions and industries utilize LabVIEW in many
applications for data display and analysis [2 - 4]. In academic literature, reports of the LabVIEW
based project results have begun to appear [5]. Several other data acquisition packages such as
LabTech/Control and LabTech/Notebook from LabTech, TestPoint and Easiest from Keithley
Metrabyte, DT VEE from Data Translation do exist [6]. Particular tool prices, features and
accommodation of academic discounts determine the usage. The availability of the student
edition of LabVIEW from Prentice Hall at a very reasonable price (~$50 per copy), has started to
meet most of the instrumentation requirements of academic laboratories [7].
The instrumentation tools can be utilized to accomplish many objectives only when
properly gathered data is available. Though the non-real-time usage of the tools is justified, their
use in real time systems provides students with hands-on experience and an environment to make
realistic comparison with data from actual laboratory instruments. Such has been the
development of this paper. National Instruments LabVIEW instrumentation and analysis
software, along with its data acquisition board has been utilized to interface signals from an
actual experimental set up to a PC. Another aspect of the tool well utilized is the capability to
enable modifications that can be made so as to display the data in a desired manner.
In this paper an attempt is made to demonstrate the many features of the student edition
of LabVIEW instrumentation tool that resulted in successful results. The extent of coverage on
the details of both NIDAQ hardware and the LabVIEW software pertain to the goals of this
project. Another objective of this paper is also to provide anyone referencing this material, a
thorough methodology to utilize the tools in an instrumentation and data acquisition project. The
paper concludes by providing details on current utilization and future scope of this work.
PROBLEM DEFINITION
The schematic of the dc motor-generator experimental setup utilized in this project is
depicted by Fig. 1. A 0-125 V dc supply runs the dc shunt motor and the generator is separately
excited. The objective is to transform the four experimental parameters: generator voltage and
current, and motor speed and torque into a form readable by the computer and then display the
results on the monitor in the desired manner in real time. This would enable electrical analysis of
generator and visual observation of one-parameter changes on others. The ratings, which
reflected the range of these parameters, were Voltage - 0 to 125v, Current -0 to 3.5A, and Speed
0-1800 RPM. Thus, to accomplish the aims of the project, components required were: i) The
DAQ board which transformed the acquired signals into a form readable by the computer, ii) the
configuration software NIDAQ used to configure the board and setup communication between
the board and the computer, iii) the programming software LabVIEW used to design and run the
A
DC
G
V
Signal Conditioner SCX
PC with DAQ board and Configuration
software and LabVIEW
Instrumentation software
2
Page 3.387.2
Fig. 1. Schematic of the motor-generator experimental setup.
Virtual instrument as desired, iv) the signal conditioning hardware to condition and isolate the
signals before being connected to the DAQ board, and finally, v) the computer, a IBM 486 PC to
house the DAQ board and the LabVIEW and NIDAQ software. In the sections, which follow, the
methodology of the development is presented, followed by the description of the components.
METHODOLOGY
The acquisition of data from a practical system and its display on the computer screen for
study and analysis requires a proper setup of the hardware and software tools involved and a
proper communication between the two. The NIDAQ board communicates to the outside world
through a ribbon cable with terminations on both the DAQ board and the signal conditioner. The
signal conditioner serves as the junction where the conditioned signals are connected to the
channels of the DAQ board. The rest is the set up of the NIDAQ to inform LabVIEW about the
configuration utilized. The front panel, which contains the display features, and the block
diagram, which contains the mechanics on what is being actually displayed constitute the
essential components of LabVIEW. A match of the front panel and block diagrams of the
LabVIEW software delivers the user with a clear understanding of the key procedures involved
and the programming involved. The following describes the details of the components and the
development of the system.
DATA ACQUISITION BOARD AND CONFIGURATION SOFTWARE
The ATMIO-16-DE-10 DAQ board utilized belongs to the family of enhanced multiplefunction input/output boards [8, 9]. It has digital as well as analog input/output capabilities. It has
a total of 16 analog input channels, which can be used in, single ended and differential modes, all
software selectable. All 16 channels can be used in single ended mode only if all the signals have
a common ground. Otherwise, only eight analog input channels are available. In the differential
mode, input voltage range is 0v to 1v. It has two twelve bit analog output channels, whose output
range is -5v to +5v or from 0v to 10v, software selectable, with a current of -5mA to +5mA. The
sampling rate is 100 ksamples/sec. There are, a total of thirty-two digital input/output channels.
It is also equipped with 24-bit, 20 MHz counter/timers. Digital channels are compatible with
TTL/CMOS. The hardware configuration of the DAQ board was studied and the required
channels were configured for this application. The corresponding gains and input voltages were
selected.
SIGNAL CONDITIONER (SCX)
Signal conditioning is necessary to step down the voltages or to shield the signals from
noise and distortion. The actual voltage and current measured have to be stepped down and
isolated to protect the board. The circuit diagram of the conditioning circuitry, thus developed is
shown in Fig. 2. The maximum generated voltage was 125v. The voltage divider was used to
obtain 1v across the 440k resistor. As the generator voltage varies from 0 to 125v, the voltage
across 440k varies from 0v to 1v. The two 63mA fuses protect the board against any large
currents due to high voltage.
3
Page 3.387.3
Without the availability of other current sensing devices, in order to get a reference
voltage for the current, a variable resistor was used in series with the load. The resistor was
A
Load
Cell
50M
RL
M
G
Photo
Tacho
V
V
• .5
•
440K
fuse
Ω
Torque signal
•
Speed signal
fuse
47K
01V
01V
•
•
•
Ch.
3
Ch.
2
Ch.
7(+)
*
Gnd
• •
fuse
•
•
47K
Signal Conditioner
SCX
fuse
Ch.
7(-)
Ch. Ch.
5(-) 5(+)
DAQ Board
Fig. 2. Details of Signal Conditioner SCX.
adjusted to yield a 1v drop across it when maximum load current flows in the generator circuit.
Two fuses protect the board against excessive currents.
Motor speed was sensed using a photo tachometer, whose output is a proportional analog
signal (0 - 1 V) for interfacing directly to the NIDAQ board. The motor torque was measured
using a Hampden load cell, with its analog output voltage used for the interface. Finally, before
connecting the signal conditioning hardware to the board, the voltage at the output of the signal
conditioning board was checked to make sure that they are less than one volt over the complete
range of input signals.
LabVIEW STUDENT EDITION
LabVIEW is an abbreviation for Laboratory Virtual Instrument (VI) Engineering
Workbench. It is a powerful instrumentation and analysis software system that runs on PCs.
LabVIEW was first developed in 1983 by National Instruments, since then it has become a
standard in the program development applications much like C or BASIC development systems.
However, LabVIEW departs from the sequential nature of traditional programming languages
and features easy to use graphical programming environment called "G" [10-14].
LabVIEW allows design of the front panel or user interface and the block diagram or
graphical code. The front panel is interactive because it simulates the panel of a physical
instrument. It can contain indicators and controls such as graphs, charts, switches, numeric
displays, control knobs and various other kind of controls. The indicators are program outputs
where as controls are user inputs. User input is through the keyboard and mouse while program
output is displayed on the screen of the monitor.
Page 3.387.4
4
The block diagram or graphical code constructed in the LabVIEW's graphical
programming language, ‘G’ is the source code of the VI’s. It is the actual executable program.
The block diagram contains lower level VI’s, built-in functions, program execution control
structures and constants. Wires are drawn to connect the required objects together, indicating the
flow of data in a block diagram. Every object on the front panel has a corresponding terminal on
the block diagram that facilitates the flow of data between the user and the program.
In windows, when the LabVIEW icon is opened, the tools to build the front panel of the
VI are available through the menu bar. The tool bar can be changed into run mode palette or edit
mode palette by clicking on the run/edit mode icon. Some of the helpful features of the front
panel and the block diagram of LabVIEW are:
• A click on the run button enables the VI to run and that on the stop button enables its stop.
The run button is broken if the VI is not compiled correctly or due to an illegal connection. This
prevents making serious mistakes and wasting time on debugging later on.
• The execution highlighting button causes the VI to highlight the flow of data as it passes
through the diagram. When execution highlighting is on, the intermediate data values that would
otherwise not appear can even be seen.
• Operating tool is used to change the values in controls, click on/off buttons and knobs.
• Positioning tool is used to select, delete, move, and re-size objects etc.
• Wiring tool is used only in the block diagram. It is used to wire terminals together.
• The coloring tool enables selection of several colors to the front panel or block diagram.
FRONT PANEL
Familiarity with the different functions and menus of LabVIEW is necessary before
beginning to build the front panel. As per the initial objective of the project, three parametersmotor speed, generator voltage and current had to be displayed as graphs and as numeric
displays. The following procedure was used to devise the front panel and the block diagram.
Using the positioning tool, with click on the right mouse button and from the pop up
window selections of the choice of five different types of graphs, a Waveform Chart was chosen
for the real time display of data. Once the chart was on the panel, it was duplicated to have a
total of three graphs on the front panel. Numeric displays of the variables were set up from the
pop up menu on the respective graphs. The data acquisition system requires two knobs to control
the acquisition rate and the number of samples per second.
The program execution to acquire the data from the system in operation is controlled by
an on/off switch. An optional LED serves for visual indication of on/off status. The completed
preliminary front panel of the project is shown in the Fig. 3.
BLOCK DIAGRAM
5
Page 3.387.5
The block diagram is the screen where the source code for the VI is developed. In the
block diagram, there is a terminal for every object created in the front panel. First the data has to
be read in a continuous manner or in real time. Data input is at three different channels of the
DAQ board, so a channel number is specified for each parameter. Once acquired, the data is in
the range of 0 to 1v. So scaling has to be done to bring back data to their original scale before
displaying the signals on the graph. Also each channel has to adopt a different scaling factor as
variables’ ranges are different.
Fig. 3. Front Panel of the system.
In the block diagram environment from the pop up menu for functions, if the Data
acquisition option is selected, it in turn opens another window showing several analog and digital
input-output VI's. There are four VI's for analog input. Two for sampling channel’s and two for
acquiring waveforms. Due to entirely different variables, AI (Analog input) Acquire
Waveforms(the third option) option was chosen for individual channels so as to treat them
individually and condition them before displaying on the graphs. The eight terminals of the
chosen VI icon have to be configured in order to attribute meaningful data acquisition and
display.
6
Page 3.387.6
Three of the waveform acquire VI’s were used on the block diagram, one for each
parameter to be read. In order for the VI to function, it needs the required values for each
terminal. Since the differential connections at the DAQ board input were only used, it was not
required to use high limit and low limit terminals on the VI. The terminals for sampling rate and
number of samples are to be varied at the same time for all the three inputs. Thus these are
connected to the terminals of two control knobs. The two control knobs are the ones selected on
the front panel. The device and channel number entries correspond to 1 and 0 in this particular
case. This readies the VI for further processing and display. The same process is repeated with
the other two AI Acquire Waveform VI’s, with the only difference being the channel numbers.
Fig. 4. System Block Diagram.
To view the displayed waveforms in actual ranges, these signals require appropriate
calibration. The latter is achieved by using the arithmetic or logic function features. For the
chosen channels, from the mathematics option, the multiplication function was selected to
provide the required multiplication factor. This factor can be fine-tuned by calibration with a
physical instrument, for greater accuracy.
With the system now capable of acquiring data, re-scale it and display it on the graph, it
however, is not set up to carryout this task in a continuous manner. In order to display the
waveforms in real time, the system must function continuously. To accomplish this, once again
from the pop up functions menu, selection of the Structs & Constants option allows selection of
the while loop as one appropriate for this system. A while loop executes the program or diagram
inside it as long as the Boolean value wired to its conditional terminal is true. It checks the
conditional terminal value at the end of each iteration. If the value is true, another iteration
occurs. The whole diagram is enclosed inside the loop and the conditional terminal of the loop is
connected to the terminal of the Boolean switch as shown in the system block diagram in Fig. 4.
This is the switch on the front panel that turns the whole system on or off and which gives
control to the user.
7
Page 3.387.7
The execution highlighting function enables debugging and removing bad connections.
The answers to some of the questions that arose when configuring the NIDAQ were found by
browsing the National Instruments Internet site. Now the system was ready for real time data
acquisition and instrumentation. The front panel and block diagram screens can be flipped back
and forth by pressing < ctrl > and < f > key simultaneously or by selecting ' show panel / Show
window ' option from ' windows ' in the top menu bar. This feature provides immediate
information on the display configuration and the programmed block diagram.
To add to the capabilities of the system, it was desired to save the acquired data as an
Excel file for further manipulation and hard copy. This is also very useful if the characteristic
curves of the generator are to be drawn later. The Write to Spread Sheet File VI enabled this
feature. The details of setting up the different inputs of this VI can be found in reference [5]. In
a later step, the procedure to automatically obtain the hardcopy of the data screen was achieved.
As a further step in the development, the front panel and the block diagram of the
LabVIEW were both extended to incorporate the display of the motor torque variable and also
the display of motor torque vs. the speed and the generator terminal voltage vs. the load current.
The latter, accomplished with additional programming is illustrated in the block diagram Fig. 5.
The experiment section contains the display of the front panel devised for this block diagram.
Fig. 5. System block diagram for experimental setup.
EXPERIMENTS ON MOTOR-GENERATOR SETUP
8
Page 3.387.8
In order to run the system, in the LabVIEW environment, from the file menu the VI that
needs to be run is opened. With the motor-generator set off, the on/off switch is enabled to turn
on the VI. On the top tool bar, the run button is clicked ON. The LED next to the on/off button
comes ON indicating that the system is on. The motor is turned on and brought to its normal
speed of 1800 rpm. The RPM vs. time graph as well as the digital display as shown in Fig. 6.
start responding to the increasing speed of the motor. Then the generator field is supplied and an
observation of the generated voltage vs. time graph and the digital display is made. For the safety
of the computer and board, the output of the SCX board with generator at rated voltage is
checked to make sure the voltage at the board terminals is not more than 1 volt.
A resistive load is connected across the generator terminals. With increasing steps of
load, the current display similarly shows a graph of the load current vs. time and also its digital
display. The four graphs can be seen on one screen in real-time, and change in one parameter
clearly shows the effect on others.
Detailed study of the graphs can be done once the VI is turned off. This is achieved by
turning off the on/off push button on the front panel. Using the tools on the tool bar, each graph
can be zoomed in or zoomed out, rewound to look at previous values etc. The data saved on
spreadsheet files can be viewed in Excel or any other spreadsheet environment.
9
Page 3.387.9
Fig. 6. Display of Experiment Waveforms from Motor-Generator Setup.
SCOPE OF FUTURE WORK
Partial results of this project served a senior undergraduate student fulfil the requirements
of his EET degree in winter 1997. The project as developed was utilized as a demonstration
laboratory in the Division’s electric machines and drives course in the winter and fall semesters
in 1997. It also has been used in three occasions as a display during Engineering Open house and
Metro Detroit area public school visits, to highlight the scope of computer use in practical
systems. The latter part of the development is currently being utilized to observe and analyze the
performance of a machine tool system. The monitoring and display of the lathe motor torque as a
function of the depth of cut of the tool is the main objective of the system. The testing of this
system is awaiting the torque monitor fixture setup. The project is further to include the signals
from a load monitoring system, for which separate front panel and block diagrams are being
devised. This is part of a NSF funded Greenfield Coalition’s Manufacturing Engineering
curriculum development project for which the first author is the principal investigator. The future
plans for the development include i) devising the LabVIEW based instrumentation system as a
real-time visual controller rather than only as data indicator ii) to serve as an example while
seeking external funding for the electric machines and drives laboratory future expansion to
several stations iii) to continue to serve as a demonstration set up in other activities of the
Division, iv) to serve as an a station for any measurement and control system
CONCLUSION
An instrumentation project utilizing the student edition of National Instruments
LabVIEW and data acquisition tools NIDAQ is presented. Pertinent details about the
methodology and the configuration of hardware and the front panel are provided. Efficient usage
of graphic programming capabilities of LabVIEW are outlined. Screens showing the set up of the
display of several parameters of the motor-generator system are enclosed along with the actual
screens of real time instrumentation. Procedures developed to save the acquired data as XL files
are described. Current utilization of the project and future scope of the project are provided.
REFERENCES
1.
2.
3.
4.
5.
6.
10
Page 3.387.10
7.
8.
9.
10.
11.
12.
13.
14.
"Instrumentation Newsletter", Winter 1996/1997, National Instruments,
"Academic Version Instrumentation Reference and Catalogue", National Instruments 1997.
"National Instruments in Education", National Instruments 1996, 1997.
Valeed B. Waheed, "Virtual Instrumentation – A project involving data acquisition and display on a PC using
LabVIEW and NIDAQ" Senior Project, Wayne State University, Apr’ 1997.
Rajappa Papannareddy, "New laboratory experiments in Analog electronic courses using Microcomputer based
instrumentation and LabVIEW", ASEE Annual Conf. Proceedings, 1997
Emin Yilmaz, "Use of LabTech/Control in Microcomputer based Instrumentation", ASEE Annual Conference
Proceedings, 1997.
Lisa K. Wells, " The LabVIEW Student Edition User's Guide ", National Instruments.
User's Manual for DAQ. " AT- MIO E Series DAQ Boards ", National Instruments.
User's Manual for DAQ. " NIDAQ Function Reference Manual for PC Compatibles", National Instruments.
User's Guide for LabVIEW, " User Manual for Windows ", National Instruments.
User's Guide for LabVIEW, " Data Acquisition VI Reference Manual for Windows”.
User's Guide for LabVIEW, " Function Reference Manual ", National Instruments.
Lisa K. Wells, Jefferey Travis " LabVIEW For Everyone ", Prentice Hall PTR 1997.
" Instrumentation Reference And Catalogue ", National Instruments 1996.
SHAMALA CHICKAMENAHALLI
Shamala Chickamenahalli has been an assistant professor in the College of Engineering at Wayne State University
since 1994. She earned her B.E. degree in 1984, M. Tech degree in 1986, and Ph.D. in 1995, all in Electrical
Engineering. She worked in industry for five years. Her interests include power electronics and digital control,
teaching and learning pedagogy. Dr. Chickamenahalli is a member of IEEE, ASEE, Tau Alpha Pi, and POET.
VENKATESWARAN NALLAPERUMAL
Venkateswaran Nallaperumal received his B. E. in Electronics and Instrumentation Engineering in 1992. He
worked as an Instrumentation Engineer, at Manali Petrochemical Ltd., India for four years. Presently, he is a
graduate student in the Department of Electrical and Computer Engineering at Wayne State University. His interests
are computer applications and he is developing CBI courseware and a load monitoring system-utilizing Labview.
VALEEB BIN-WAHEED
Valeed Bin-Waheed received his Bachelor of Electrical Engineering Technology from Wayne State University in
May 1997. He is currently working as an instrumentation engineer at Patti Engineering, Rochester, Michigan. He is
a member of the ταπ Society and the Professional Order of Engineering Technology Societies. His areas of interests
include data acquisition and instrumentation and control systems.
Page 3.387.11
11