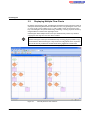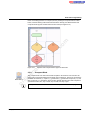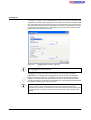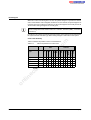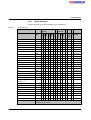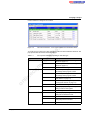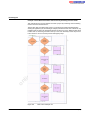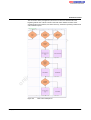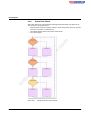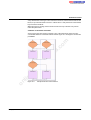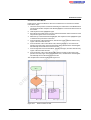
1
on
lin
e
co
m
po
ne
nt
s.
co
m
AUTOMATION
nanoNavigator User Manual
UM SWD EN NLC-NAV01
Order No.: 2701441
Installing and using nanoNavigator™ software to
configure nanoLine controllers
m
co
s.
nt
ne
po
m
co
lin
e
on
AUTOMATION
nanoNavigator User Manual
07/2009
UM SWD EN NLC-NAV01
Revision:
E
Order No.:
2701441
co
m
po
ne
Designation:
nt
s.
co
m
Installing and using nanoNavigator™ software to configure nanoLine
controllers
Designation
Version
Order No.
2.0
2701221
on
nanoNavigator
lin
e
This user manual is valid for:
2373_en_E
PHOENIX CONTACT
nanoNavigator
Please observe the following notes
In order to ensure the safe use of the product described, you have to read and understand
this manual. The following notes provide information on how to use this manual.
User group of this manual
The use of products described in this manual is oriented exclusively to qualified application
programmers and software engineers, who are familiar with the safety concepts of
automation technology and applicable standards.
co
m
Phoenix Contact accepts no liability for erroneous handling or damage to products from
Phoenix Contact or third-party products resulting from disregard of information contained in
this manual.
Explanation of symbols used and signal words
nt
s.
This is the safety alert symbol. It is used to alert you to potential personal injury
hazards. Obey all safety messages that follow this symbol to avoid possible
injury or death.
po
ne
DANGER
This indicates a hazardous situation which, if not avoided, will result in death or serious
injury.
m
WARNING
This indicates a hazardous situation which, if not avoided, could result in death or serious
injury.
co
CAUTION
This indicates a hazardous situation which, if not avoided, could result in minor or
moderate injury.
on
lin
e
The following types of messages provide information about possible property damage and
general information concerning proper operation and ease-of-use.
NOTE
This symbol and the accompanying text alerts the reader to a situation which may cause
damage or malfunction to the device, either hardware or software, or surrounding
property.
This symbol and the accompanying text provides additional information to the reader. It is
also used as a reference to other sources of information (manuals, data sheets, literature)
on the subject matter, product, etc.
PHOENIX CONTACT
2373_en_E
nanoNavigator
General terms and conditions of use for technical documentation
Phoenix Contact reserves the right to alter, correct, and/or improve the technical
documentation and the products described in the technical documentation at its own
discretion and without giving prior notice, insofar as this is reasonable for the user. The
same applies to any technical changes that serve the purpose of technical progress.
nt
s.
co
m
The receipt of technical documentation (in particular data sheets, installation instructions,
manuals, etc.) does not constitute any further duty on the part of Phoenix Contact to furnish
information on alterations to products and/or technical documentation. Any other
agreement shall only apply if expressly confirmed in writing by Phoenix Contact. Please
note that the supplied documentation is product-specific documentation only and that you
are responsible for checking the suitability and intended use of the products in your specific
application, in particular with regard to observing the applicable standards and regulations.
Although Phoenix Contact makes every effort to ensure that the information content is
accurate, up-to-date, and state-of-the-art, technical inaccuracies and/or printing errors in
the information cannot be ruled out. Phoenix Contact does not offer any guarantees as to
the reliability, accuracy or completeness of the information. All information made available
in the technical data is supplied without any accompanying guarantee, whether expressly
mentioned, implied or tacitly assumed. This information does not include any guarantees
regarding quality, does not describe any fair marketable quality, and does not make any
claims as to quality guarantees or guarantees regarding the suitability for a special purpose.
ne
Phoenix Contact accepts no liability or responsibility for errors or omissions in the content
of the technical documentation (in particular data sheets, installation instructions, manuals,
etc.).
on
lin
e
co
m
po
The aforementioned limitations of liability and exemptions from liability do not apply, in so
far as liability must be assumed, e.g., according to product liability law, in cases of
premeditation, gross negligence, on account of loss of life, physical injury or damage to
health or on account of the violation of important contractual obligations. Claims for
damages for the violation of important contractual obligations are, however, limited to
contract-typical, predictable damages, provided there is no premeditation or gross
negligence, or that liability is assumed on account of loss of life, physical injury or damage
to health. This ruling does not imply a change in the burden of proof to the detriment of the
user.
2373_en_E
PHOENIX CONTACT
nanoNavigator
Statement of legal authority
This manual, including all illustrations contained herein, is copyright protected. Use of this
manual by any third party is forbidden. Reproduction, translation, and public disclosure, as
well as electronic and photographic archiving or alteration requires the express written
consent of Phoenix Contact. Violators are liable for damages.
Phoenix Contact reserves all rights in the case of patent award or listing of a registered
design, in as far as this concerns software of Phoenix Contact that meets the criteria of
technicity or has technical relevance. Third-party products are always named without
reference to patent rights. The existence of such rights shall not be excluded.
m
Windows 3.x, Windows 95, Windows 98, Windows NT, Windows 2000, Windows XP, and
Windows Vista are trademarks of the Microsoft Corporation.
All other product names used are trademarks of the respective organizations.
Up-to-date information on Phoenix Contact products and our Terms and Conditions can be
found on the Internet at:
s.
Internet
co
How to contact us
nt
www.phoenixcontact.com.
ne
Make sure you always use the latest documentation.
It can be downloaded at:
www.phoenixcontact.net/download.
If there are any problems that cannot be solved using the documentation, please contact
your Phoenix Contact subsidiary.
Subsidiary contact information is available at www.phoenixcontact.com.
Published by
m
po
Subsidiaries
.
lin
e
co
PHOENIX CONTACT GmbH & Co. KG
Flachsmarktstraße 8
32825 Blomberg
Germany
Phone +49 - (0) 52 35 - 3-00
Fax
+49 - (0) 52 35 - 3-4 12 00
PHOENIX CONTACT
P.O. Box 4100
Harrisburg, PA 17111-0100
USA
Phone +1-717-944-1300
on
Should you have any suggestions or recommendations for improvement of the contents and
layout of our manuals, please send your comments to
PHOENIX CONTACT
[email protected].
2373_en_E
Table of Contents
About This User’s Manual................................................................................... 1-3
1.2
Revisions ........................................................................................................... 1-3
1.3
System Requirements ........................................................................................ 1-4
1.4
Manual Conventions........................................................................................... 1-4
1.5
Phoenix Contact Technical Service .................................................................... 1-5
m
Getting Started.........................................................................................................................2-3
Installing nanoNavigator ..................................................................................... 2-3
2.2
Starting nanoNavigator....................................................................................... 2-4
2.3
Configuring nanoNavigator................................................................................. 2-7
2.4
Connecting to a nanoLC ................................................................................... 2-13
s.
co
2.1
nt
Flow Chart Programming .........................................................................................................3-3
Exploring Flow Charts......................................................................................... 3-3
3.2
Chart Explorer .................................................................................................... 3-6
3.3
Displaying Multiple Flow Charts........................................................................ 3-10
3.4
Editing Flow Charts .......................................................................................... 3-11
3.5
Flow Chart Blocks............................................................................................. 3-12
3.6
Connecting Flow Chart Blocks ......................................................................... 3-28
3.7
Entering Block Comments ................................................................................ 3-30
3.8
Using the Message Editor................................................................................. 3-31
ne
3.1
Ladder Chart Programming .....................................................................................................4-3
on
4
lin
e
co
3
1.1
po
2
Before Beginning .....................................................................................................................1-3
m
1
5
4.1
Exploring Ladder Charts..................................................................................... 4-3
4.2
Chart Explorer .................................................................................................... 4-7
4.3
Displaying Multiple Charts ................................................................................ 4-11
4.4
Editing Ladder Charts....................................................................................... 4-12
4.5
Ladder Chart Contacts and Coils...................................................................... 4-13
4.6
Using the Message Editor................................................................................. 4-28
Data Operations.......................................................................................................................5-3
2373_en_E
5.1
Using the Data Item Editor.................................................................................. 5-3
5.2
Data Type Descriptions ...................................................................................... 5-7
5.3
Data Types and Formats .................................................................................. 5-10
5.4
Using Timers and Counters .............................................................................. 5-11
5.5
Using the Move Function .................................................................................. 5-13
5.6
Handling Analog Values ................................................................................... 5-16
5.7
Using Analog Values ........................................................................................ 5-17
PHOENIX CONTACT
i
nanoNavigator
Specifying the PC Connection ............................................................................ 6-3
6.2
Verifying a Project............................................................................................... 6-4
6.3
Connecting to the nanoLC .................................................................................. 6-4
6.4
Downloading a Project........................................................................................ 6-5
6.5
Uploading a Project from the nanoLC................................................................. 6-5
6.6
Downloading to the Memory Module .................................................................. 6-6
6.7
Uploading from the Memory Module................................................................... 6-6
6.8
Clearing the Memory Module ............................................................................. 6-6
6.9
Running a Project ............................................................................................... 6-7
6.10
Stopping a Running Project ................................................................................ 6-7
6.11
Set nanoLC Password........................................................................................ 6-7
6.12
Set nanoLC Date/Time ....................................................................................... 6-8
6.13
Lock the nanoLC ................................................................................................ 6-9
6.14
Unlock the nanoLC ............................................................................................. 6-9
6.15
Updating nanoLC Firmware.............................................................................. 6-10
6.16
Clearing a nanoLC Project................................................................................ 6-12
ne
nt
s.
co
m
6.1
po
7
Running Projects and Controlling the nanoLC .........................................................................6-3
Verifying a Project....................................................................................................................7-3
nanoLC Monitor Window .................................................................................... 7-4
co
7.1
m
6
A
ii
7.3
Using Execution Tracing in nanoNavigator......................................................... 7-8
lin
e
Forcing Data Values ........................................................................................... 7-7
Flow Chart Tutorial...................................................................................................................8-3
on
8
7.2
8.1
Flow Charting Primer .......................................................................................... 8-3
8.2
Designing a Control Project ................................................................................ 8-7
8.3
Project Execution.............................................................................................. 8-19
8.4
Creating a Project ............................................................................................. 8-21
8.5
Downloading and Verifying the Project ............................................................. 8-37
Technical Appendix – Setting Preferences ............................................................................. A-1
PHOENIX CONTACT
A1
General Tab....................................................................................................... A-1
A2
Designer Options Tab........................................................................................ A-3
A3
Designer Colors Tab.......................................................................................... A-5
A4
Block Colors Tab ............................................................................................... A-7
A5
Data Item Editor Tab.......................................................................................... A-8
A6
Debug Tab......................................................................................................... A-9
A7
Changes Made ................................................................................................ A-10
2373_en_E
Table of Contents
Base Unit Flags ................................................................................................. B-1
B2
Ethernet Flags ................................................................................................... B-1
Technical Appendix – Analog Device Scaling ......................................................................... C-1
Scaling Formula................................................................................................ C-1
C2
No Scaling Applied Example ............................................................................ C-2
C3
Scaling Applied Examples ................................................................................ C-2
m
C1
Appendix ................................................................................................................................ D-1
D1
List of Figures ................................................................................................... D-1
D2
List of Tables .................................................................................................... D-7
D3
Index................................................................................................................. D-9
on
lin
e
co
m
po
ne
nt
D
B1
co
C
Technical Appendix – System Flags ....................................................................................... B-1
s.
B
2373_en_E
PHOENIX CONTACT
iii
on
lin
e
co
m
po
ne
nt
s.
co
m
nanoNavigator
iv
PHOENIX CONTACT
2373_en_E
Section 1
This section provides information about:
– The contents of this manual
– Manual conventions
– Contacting Technical Support
Before Beginning..............................................................................................................................1-3
About This User’s Manual................................................................................... 1-3
1.1.1
What’s Inside ....................................................................................... 1-3
1.2
Revisions ........................................................................................................... 1-3
1.3
System Requirements ........................................................................................ 1-4
1.4
Manual Conventions........................................................................................... 1-4
1.4.1
Keyboard Commands.......................................................................... 1-5
1.4.2
Using a Mouse..................................................................................... 1-5
1.5
Phoenix Contact Technical Service .................................................................... 1-5
on
lin
e
co
m
po
ne
nt
s.
co
m
1.1
2373_en_E
PHOENIX CONTACT
1-1
on
lin
e
co
m
po
ne
nt
s.
co
m
nanoNavigator
1-2
PHOENIX CONTACT
2373_en_E
Before Beginning
1
Before Beginning
Welcome to the nanoNavigator™ software from Phoenix Contact — the software that makes
the most of the nanoLine controller (nanoLC). nanoNavigator is the programming
environment for the nanoLC.
1.1
About This User’s Manual
1.1.1
What’s Inside
s.
This manual includes the following sections:
co
m
This User Manual provides complete information on how to use nanoNavigator for the
nanoLC.
Section 1, “Before Beginning” provides an overview of nanoNavigator and this manual.
ne
nt
Section 2, “Getting Started” describes how to install and start nanoNavigator and connect
to nanoLC.
Section 3, “Flow Chart Programming” describes how to create projects using the flow chart
capabilities within nanoNavigator.
po
Section 4, “Ladder Chart Programming” describes how to create projects using the ladder
chart capabilities within nanoNavigator.
m
Section 5, “Data Operations” defines the available data types in nanoNavigator and how to
move data and use mathematical and relational expressions.
co
Section 6, “Running Projects and Controlling the nanoLC”, describes how to run projects.
Section 7, “Verifying a Project”, provides information on how to monitor and verify running
projects.
on
lin
e
Section 8, “Flow Chart Tutorial”, describes how to install nanoNavigator, connect to
nanoLC, create a flow chart project, and verify the project.
1.2
Table 1-1
Revisions
Revisions
Software version
Documentation
1.2
2373_en_E
Description
Original release
1.3
B
Added analog input module. Required
firmware update.
–
C
General edits and corrections
1.4
D
Added Simulator
2.0
E
Added Ladder Chart logic; General edits
PHOENIX CONTACT
1-3
nanoNavigator
1.3
System Requirements
Manual Conventions
nt
1.4
s.
co
m
nanoNavigator requires:
– Keyboard and mouse
– Display (800x600 minimum resolution)
– Windows 2000 (SP4), Windows XP (SP2), or Windows Vista operating systems
– 400 MHz processor
– 128 MB memory
– Hard Drive — 280 MB required for .net framework 2.0 ;
10 MB required for nanoNavigator and projects
– .net framework 2.0
– MDAC 2.8
– Windows installer 3.0 (required to install .net)
– IE6 SP1 (required to install .net)
Folder and File Names
ne
This section discusses text conventions used throughout the manual.
po
Folder and file names appear in quotation marks. For example, “\nanoNavigator” is a folder
name; “MyProject.nano” is a file name.
m
Titles, Buttons, Keywords, Mnemonics
lin
e
co
Command buttons, keywords and phrases found in dialog boxes appear in quotes. For
example, the text might say, ‘click the “Apply” button’ to indicate that there is a button in the
dialog box labeled “Apply”. Menu selections also appear in quotes (for example, “File”
menu), and submenu selections follow an ellipsis after the main menu (for example “File...
Print” menu). In some cases, words and characters in a bold version of the text font indicate
emphasis.
on
Other Text Conventions
1-4
PHOENIX CONTACT
There are a few hypertext links to Web pages. They appear as underlined text. (for example,
www.phoenixcontact.com). When viewing this manual in Adobe Acrobat, they also appear
as blue text. Clicking one of these links launches the Web browser and attempts to connect
to the link.
2373_en_E
Before Beginning
1.4.1
Keyboard Commands
Key names are shown as <Alt>, <Ctrl>, or <Home>. Keyboard commands, key
combinations, and key sequences are shown in Table 1-2:
Table 1-2
Manual Conventions for Keyboard Command
Description
<Key1>+<Key2>
A plus sign (+) between key names means
to press and hold the first key (<Key1>) and
type the second key (<Key2>). For
example, <Alt>+<F4> means to hold down
the <Alt> key, press the <F4> key, and then
release both keys.
<Key1>, <Key2>
A comma (,) between key names means to
type the keys individually in the sequence
shown. For example, if instructed to type
<R>, <Enter>, type the letter <R>, release
it, and then press the <Enter> key.
Using a Mouse
ne
1.4.2
nt
s.
co
m
Keystroke(s)
co
m
po
nanoLine controller development with nanoNavigator requires use of a mouse. When using
a mouse, make choices and selections using the standard left mouse button, unless it is a
left-hand mouse or it has been remapped to use the right button. With the mouse pointer
over an object, clicking the right mouse button (unless remapped) often displays a pop-up
menu of commands that are available depending on the context (also called context or popup menus).
Phoenix Contact Technical Service
lin
e
1.5
on
To obtain answers to questions about nanoNavigator that don’t appear to be in this manual,
contact Phoenix Contact Technical Service via the Internet. Our staff will provide advice
needed to get the most from the nanoLC and nanoNavigator.
We suggest trying to duplicate the problem before contacting Technical Service. During this
process, write down each step performed and any error messages that appeared.
PHOENIX CONTACT
Internet:www.phoenixcontact.com
2373_en_E
PHOENIX CONTACT
1-5
on
lin
e
co
m
po
ne
nt
s.
co
m
nanoNavigator
1-6
PHOENIX CONTACT
2373_en_E
Section 2
This section provides information about:
– Installing and starting nanoNavigator
– Configuring a nanoLC within nanoNavigator
– Connecting nanoNavigator to the nanoLC
Getting Started .................................................................................................................................2-3
Installing nanoNavigator ..................................................................................... 2-3
2.2
Starting nanoNavigator....................................................................................... 2-4
2.2.1
Run Connection Wizard....................................................................... 2-4
2.2.2
Create a New Project........................................................................... 2-5
2.2.3
Open Last Project ................................................................................ 2-6
2.2.4
Open Existing Project .......................................................................... 2-6
2.2.5
Exit....................................................................................................... 2-6
2.3
Configuring nanoNavigator................................................................................. 2-7
2.3.1
Base Unit ............................................................................................. 2-7
2.3.2
I/O Expansion Module #1... #3........................................................... 2-10
2.3.3
Operator Panel .................................................................................. 2-11
2.3.4
COM Interface ................................................................................... 2-12
2.4
Connecting to a nanoLC ................................................................................... 2-13
2.4.1
Physical Connection .......................................................................... 2-14
2.4.2
Connecting nanoNavigator to the nanoLC ......................................... 2-14
on
lin
e
co
m
po
ne
nt
s.
co
m
2.1
2373_en_E
PHOENIX CONTACT
2-1
on
lin
e
co
m
po
ne
nt
s.
co
m
nanoNavigator
2-2
PHOENIX CONTACT
2373_en_E
Getting Started
2
Getting Started
This section provides help getting started with nanoNavigator software and nanoLine
controller (nanoLC). The first step is to install nanoNavigator on a PC, and then connect to
the nanoLC. To use the nanoLC, begin by creating a control program using nanoNavigator,
and then transfer the program to the nanoLC.
nanoNavigator provides two methods to create program logic: flow chart or ladder charts.
Flow charts use blocks and flow lines with the blocks representing actions and decisions,
and the flow lines indicating direction of movement.
co
m
A tutorial on flow chart programming provides an overview of nanoNavigator features using
a sample project (see Section 8, “Flow Chart Tutorial”). The tutorial includes building the
project, and then monitoring and verifying it. To get the full benefit of the tutorial, you should
have a nanoLC. If a nanoLC is not available, you can go through the building of the project,
and then use the simulator to verify it.
nt
s.
Ladder charts use contacts and coils to represent the actions of the program. The contacts
and coils are assembled into “rungs” like a ladder, with each rung representing a piece of
logic that is either true or false, 1 or 0, or ON or OFF. The coils and contacts are similar to
relays and is therefore sometimes referred to as relay ladder logic.
ne
The option of using ladder charts to program the nanoLC is available with nanoNavigator
2.0 and later. Ladder charts use relays to express the programming logic.
m
NOTE:
po
Projects can use a mixture of flow charts and ladder charts. Since each programming
method is actually “converted” to a language the nanoLine controller understands, it makes
no difference which type of chart is used. Because different logic is used, charts cannot be
converted between type.
lin
e
co
Ladder charts cannot be opened with the Flow Chart Editor and flow charts cannot be
opened with the Ladder Chart Editor.
on
2.1
Installing nanoNavigator
To install nanoNavigator, either download a copy from the www.phoenixcontact.com or use
the CD that comes with a nanoLC Startup Kit. nanoNavigator is also available separately.
With the installation CD or file download, follow these steps:
1. Start the installation program.
– For a file download saved to disk, find the setup executable file and double-click it.
– With an installation CD, insert it in the CD drive. It should automatically start. If it
doesn’t, use Windows Explorer to navigate to the CD drive, go to the “nanoNav”
folder, and double-click the setup executable file.
The name of the setup executable file varies. It will, however, always be an “.exe” file. For
more specific instructions, see the readme instructions on the CD.
2.
3.
2373_en_E
Follow the instructions of the installation wizard. The wizard has multiple pages. After
completing each page, click the “Next” button at the bottom of the page.
Click the “Finish” button to complete installation.
PHOENIX CONTACT
2-3
nanoNavigator
2.2
Starting nanoNavigator
After installation of nanoNavigator, the software can be started:
1. From the Windows “Start” menu, select “Programs... Phoenix Contact...
nanoNavigator... nanoNavigator” to start the program.
ne
nt
s.
co
m
Each time nanoNavigator starts, it displays the “nanoNavigator Startup” dialog box.
Run Connection Wizard
m
2.2.1
“nanoNavigator Startup” dialog box
po
Figure 2-1
lin
e
co
The Run Connection Wizard requires a physical connection between the PC and a nanoLC.
Click the “Run Connection Wizard” button and nanoNavigator communicates with the
connected nanoLC and determines the status of the project stored in the nanoLC memory.
This information is displayed and several options are made available.
on
Additional information on how to connect a nanoLine controller to a PC can be found in
“Connecting to a nanoLC” on page 2-13.
2-4
PHOENIX CONTACT
To update the firmware in the nanoLC, click the “Run Connection Wizard” button and see
“Updating nanoLC Firmware” on page 6-10.
2373_en_E
ne
nt
s.
co
m
Getting Started
The "nanoLC Connection Wizard"
po
Figure 2-2
on
lin
e
co
m
The operations available depend on the current state of the nanoLC.
– If there is a project loaded on the nanoLC, nanoNavigator displays a message
indicating that a project exists and the “Upload” button is available. Click the “New”
button to upload the project from the nanoLC to nanoNavigator.
– If there is no project on the nanoLC, nanoNavigator displays a message to that effect
and the “Upload” button is gray. Click the “New” button and a new project is started
using the configuration of the attached nanoLine controller. The “Select Type of First
Chart” appears. Click either the “Create Flow Chart” button or the “Create Ladder Chart”
button to create the desired type of chart.
The nanoLC operates in two modes:
– “Run mode” is the normal operating mode, and the mode required for connecting
nanoNavigator to the nanoLC. In Run mode, a project on the nanoLC can be either
running or stopped.
– “Monitor mode” permits monitoring operations directly on the nanoLC. When the
nanoLC is in Monitor mode, nanoNavigator cannot connect to it.
For more information on directly monitoring on the nanoLC, see the “nanoLC Hardware
User Manual.”
2.2.2
Create a New Project
Click the “Create a new Project” button and nanoNavigator displays the “Configuration”
dialog box (see “Configuring nanoNavigator” on page 2-7). After configuration, a dialog box
prompts to “Create Flow Chart” or “Create Ladder Chart” appears in the nanoNavigator
workspace. Click the desired chart type and the appropriate chart editor opens.
2373_en_E
PHOENIX CONTACT
2-5
nanoNavigator
2.2.3
Open Last Project
The “Open Last Project” button displays the name of the most recently viewed project in
parenthesis. Click the button to open the listed project and with the most recently viewed
chart displayed.
To open a different project than the most recently viewed, click the drop-down menu to view
the full path and file name of the most recently viewed projects. Click the desired file name
to open the project.
Open Existing Project
m
2.2.4
co
Click the “Open Existing Project” button to display a browse dialog box opened to the
directory most recently used to save or open a nanoNavigator project. The “Files of type”
field is set to display all “.Nano” files in that directory.
s.
nanoNavigator saves all project data, charts, and data items in one “.nano” file per project.
Exit
po
2.2.5
ne
nt
After nanoNavigator is open, the “Open Project” button in the Main toolbar and the “File...
Open Project” menu perform the same operation. If there is a project currently open with any
unsaved modifications, nanoNavigator displays a prompt requesting permission to save the
changes before opening the new project.
on
lin
e
co
m
Click the “Exit” button to exit nanoNavigator.
2-6
PHOENIX CONTACT
2373_en_E
Getting Started
2.3
Configuring nanoNavigator
If a nanoLC is connected to the PC, nanoNavigator can automatically set up the nanoLC
configuration by doing one of the following:
– When nanoNavigator first starts, click the “Run Connection Wizard” button in the
“nanoNavigator Startup” dialog box (see Figure 2-1).
– At any time, select the “nanoLC... Connect” menu.
lin
e
co
m
po
ne
nt
s.
co
m
If a nanoLC is not connected to the PC, select the “nanoLC... Configuration” menu to display
the “nanoLC Configuration” dialog box (this dialog box also displays when creating a new
project). It allows the programmer to define the target nanoLC on which the project will
execute.
on
Figure 2-3
“nanoLC Configuration” dialog box
The options available in this dialog box define the target nanoLC. They are discussed in the
following sections.
2.3.1
Base Unit
The “Base Unit” group selects a specific nanoLC base unit to use as the target for the
project.
– From the “Base Unit” drop-down list, select the model number of the base unit. After
selecting the base unit, the “Configure” button becomes available.
2373_en_E
PHOENIX CONTACT
2-7
nanoNavigator
Click the “Configure” button to display the options available for the selected base unit.
po
ne
nt
s.
co
m
–
Figure 2-4
“Configure Base Unit” dialog box
co
m
Only options available on the base unit are available in this dialog box. For example, if the
base unit does not support analog inputs, the two analog input drop-down lists are gray.
lin
e
The “Configure Base Unit” dialog box displays the model number and description of the
selected base unit. From the “Slot #1” or “Slot #2” drop-down list, click the option module
that is installed in the slot. The current configuration of the selected option module is
displayed, and the “Configure” button becomes available, if applicable.
on
When an option module is not installed, select “Not Installed” from the drop-down list.
Slot #1 RS-232, RS-485, USB Option Modules
Click the “Configure” button to configure the option module for Modbus RTU
communication. The RS-232, RS-485, and USB options use the same “Configure Serial
Port” dialog box (Figure 2-5).
Communication with a PC running nanoNavigator is set automatically by the software and
is not manually configurable.
2-8
PHOENIX CONTACT
2373_en_E
nt
s.
co
m
Getting Started
The “Configure Serial Port” dialog box
ne
Figure 2-5
on
lin
e
co
m
po
The “Configure Serial Port” dialog box has the following parameters:
– “Node Number” selects the node number for the serial port. Valid values are from 1 to
247.
– “Baud Rate” selects the baud rate from the drop-down list. Valid values are from 300 to
115200.
– “Parity” selects the data parity from the drop-down list. Valid values are “None”, “Odd”,
and “Even”.
– “Watchdog” permits entry of a value, or use the spin buttons, to set the watchdog timer.
Valid values are from 0.0 to 25.5 seconds. A value of 0.0 disables the watchdog timer.
If no Modbus communication occurs before the Watchdog timer value is exceeded, a
fault is generated by the nanoLC. The result of the fault is defined in the “Fault” dropdown list.
– The “Fault” field defines the result of a Modbus communication error. Available options
are:
– Select “Fault” to stop execution of the nanoLC. All outputs are turned OFF.
– Select “Warning” to indicate warning condition and continue execution.
– “Write Mode” defines Modbus RTU Read/Write conditions.
– Read/Write allows a Modbus Client to read and write commands to the nanoLC.
– Read allows a Modbus Client to read data from the nanoLC.
When the dialog box is closed, the options selected are displayed in the “Configure Base
Unit” dialog box in the “Base Option Slots” group (see Figure 2-4).
Slot #1 Memory Module
Select NLC-MOD-MEM 032K if using the optional memory module. See Section 6.6,
“Downloading to the Memory Module” and Section 6.7, “Uploading from the Memory
Module” for more information.
2373_en_E
PHOENIX CONTACT
2-9
nanoNavigator
Slot #2 Real-Time Clock
s.
co
m
The real-time clock option is available in the “Slot #2” drop-down list. Selecting this option
displays the “Configure RTC” dialog box (Figure 2-6).
The “Configure RTC” dialog box
nt
Figure 2-6
on
lin
e
co
m
po
ne
The “Configure RTC” dialog box has the following parameters:
– “Date Format” defines the date format using the drop-down list. Choices are DayMonth-Year (European), Month-Day-Year (US), and Year-Month-Day (International).
– “Daylight Savings” used to select one of three options for handling Daylight Savings
time. Available options are:
– “None”
– “U.S.”
– “European” (selecting this option enables the “EU Time Zone” fields)
– “EU Time Zone” has drop-down to select “Greenwich Mean Time”, “GMT +01:00”, and
“GMT +02:00”. In addition, there is a browse (...) button that displays a selection dialog
to set the EU time zone based on sample cities in the zone.
– “Fault” provides choices for handling faults are:
– “Fault” sets a fault condition and stop execution.
– “Warning” sets a warning condition and continue execution.
2.3.2
I/O Expansion Module #1... #3
The nanoLC supports up to three I/O Expansion Modules. Use the drop-down list to select
the model of the module installed. Depending on the device selected, the “Configure” button
may become available. When available, click the “Configure” button to define additional
parameters in a configuration dialog box.
Configure I/O Expansion modules from left to right. The module installed closest to the base
unit is #1. I/O Expansion module #1 must be configured before #2, and #2 must be
configured before #3.
When modifying the configuration to add or delete I/O, nanoNavigator displays a warning
message and the change takes effect immediately. There is no undo or cancel operation.
The only way to undo this type of configuration change is to close the project without
saving it.
2-10
PHOENIX CONTACT
2373_en_E
Getting Started
Configuring Analog Inputs
nt
s.
co
m
One of the I/O Expansion choices is “nLC-IO-4AI”. This expansion module provides four
analog input devices. When selected, the “Configure” button is active. Clicking the
“Configure” button displays the “nLC-IO-4AI” dialog box (see Figure 2-7) that configures the
four analog inputs on this device.
The “nLC-IO-4AI” configuration dialog box
ne
Figure 2-7
lin
e
co
m
po
Each analog input device (AI-00 to AI-03) has three parameters:
– “Mode” is a drop-down that provides the following choices:
– Current 4-20 mA
– Current 0-20 mA
– Unipolar 0-10 Volts (default)
– Bipolar +/-10 Volts
– “Scaling” has two configurable values for “Lower Value” and “Upper Value”. The range
of values for each of these scaling parameters is from -10000 to 10000. Scaling is a
technique for converting input voltages (or amperage) to an integer value (see
“Handling Analog Values” on page 5-16).
2.3.3
Operator Panel
on
Use the drop-down list to select the model of Operator Panel installed.
2373_en_E
Configure the “Fault Action” for the Operator Panel using the drop-down list. A fault occurs
when the project expects an Operator Panel and the nanoLC doesn’t have one. Choices for
handling faults are:
– “Fault” sets a fault condition and stop execution
– “Warning” sets a warning condition and continue execution
– “Warning on Access” sets a warning condition only if the project attempts to access the
device and continue execution
– “Ignore” continues execution without posting a warning or fault condition
PHOENIX CONTACT
2-11
nanoNavigator
2.3.4
COM Interface
co
m
po
ne
nt
s.
co
m
Use the drop-down list to select the model of module installed. Once selected, the
“Configure” button becomes available. For the “nLC-COM-ENET-MB1” option, click the
“Configure” button to display the “Configure Ethernet” dialog box.
The “Configure Ethernet” dialog box configures the Ethernet option
on
lin
e
Figure 2-8
2-12
PHOENIX CONTACT
The options available in this dialog box are:
– Click the “Obtain IP Address Using BootP” button to use an address assigned by
Phoenix Contact “IPassign.exe” (downloadable from www.phoenixcontact.com),
Factory Manager, or another BOOTP server.
– Click the “Obtain IP Address using DHCP” button if there is a DHCP server on the
network.
– Click the “Use the following IP Address” button and enter the static “IP Address” and
“Subnet Mask” in the fields that become available.
– Modbus TCP parameters and options are:
– “Write Mode” defines Modbus TCP Read/Write conditions.
– Read/Write allows a Modbus Client to read and write commands to the nanoLC.
– Read allows a Modbus Client to read data from the nanoLC.
– The “Watchdog Timeout” field: enter a timeout value in the field or use the up/down
buttons to set a value in seconds and tenths of a second. If the timeout is exceeded
after executing a command, the nanoLC issues a fault as defined in the “Fault”
field. Leave the Timeout value at "0.0" to disable the watchdog timer.
2373_en_E
Getting Started
–
The “Fault” field: Provides options for handling a fault when the project is expecting
a response from Modbus TCP and doesn’t receive one within the watchdog
timeout limit. Choices for handling faults are: “Fault” sets a fault condition and stops
execution, and “Warning” sets a warning condition and continues execution.
Project
In the Project group, change the project name and enter project comments. This group also
includes “Major Version” and “Minor Version” options.
co
m
nanoLC Runtime the major and minor version numbers in the nanoLC to compare the
project on the nanoLC with the project on the PC. The “Minor” version number automatically
increments whenever the project downloads or is verified. It also increments on the nanoLC
whenever a change is made (locally or by download). The “Major” version number indicates
significant changes to the project. It only changes under user control; however, whenever
the “Major” number changes, the “Minor” number resets to zero.
Connecting to a nanoLC
ne
2.4
nt
s.
After selecting appropriate options, click the “OK” button to close the dialog box. Some of
the options determine data items available in the Data Item Editor (see “Using the Data Item
Editor” on page 5-3), and other nanoNavigator behavior.
on
lin
e
co
m
po
There are two aspects to connecting to a nanoLC. The first is the physical connection
between the PC running nanoNavigator and the nanoLC. This physical connection is either
a serial or USB cable. The second aspect of connecting to a nanoLC is a logical connection
via the cable. This logical connection lets nanoNavigator access the nanoLC. When using
nanoNavigator to perform operations on the nanoLC, connect nanoNavigator to the
nanoLC. Other than “Physical Connection” on page 2-14, all references to “connecting to
the nanoLC” are regarding the logical connection between the nanoLC and nanoNavigator.
2373_en_E
PHOENIX CONTACT
2-13
nanoNavigator
2.4.1
Physical Connection
The nanoLC is connected to a PC (or other device) through an option module inserted in
Slot 1 on the base unit. The option module connects via a USB, RS-232 or RS-422/485
cable.
10
13
14
15
In
pu
ts
M
12
2
s.
1
+
ne
Q3
nt
1
Q2
m
ine
C
om
m
A on
na
lo Inp
g u
ts
L
no
na
co
C In
om pu
m t
on
24
V
D
C
CO
11
+
nanoLC RS-232 programming connection
m
Figure 2-9
po
Q0
Q1
lin
e
co
For more information on making a physical connection between the nanoLC and a PC,
see the “nanoLC Hardware User Manual.”
on
When using a USB port and cable to connect a PC to the nanoLC, a COM port is assigned
to the nanoLC. Occasionally, this virtual COM port interferes with a physical COM port and
must be re-assigned.
For more information on changing the COM port address assigned to a nanoLine
controller, see the USB to COM Port Configuration Application Note (document 2706).
2.4.2
Connecting nanoNavigator to the nanoLC
Before transferring a project to or from the nanoLC, starting or stopping the project,
monitoring it, or performing any other operations on the nanoLC, nanoNavigator must
connect to the nanoLC. To perform a software connection from nanoNavigator to the
nanoLC, the PC must be physically connected to the controller.
– If nanoNavigator is started, the “nanoNavigator Startup” dialog box appears. Click the
“Run Connection Wizard” button and nanoNavigator communicates with the nanoLC.
– If nanoNavigator is running, select the “nanoLC…Download” or “nanoLC…Download &
Go” menu. Or select the “nanoLC…Monitoring” menu to monitor the project as it runs
on the nanoLine controller (see Section 6, “Running Projects and Controlling the
nanoLC” for more information).
2-14
PHOENIX CONTACT
2373_en_E
Section 3
This section provides information about:
– Managing charts using Chart Explorer
– Using the Flow Chart Editor and creating flow charts
– Using the Message Editor
Flow Chart Programming .................................................................................................................3-3
Exploring Flow Charts......................................................................................... 3-3
3.1.1
Using the Main Toolbar........................................................................ 3-4
3.1.2
Grid and Cell Address.......................................................................... 3-5
3.1.3
Zooming In or Out ................................................................................ 3-6
3.2
Chart Explorer .................................................................................................... 3-6
3.2.1
Opening a Flow Chart .......................................................................... 3-7
3.2.2
Creating a New Flow Chart .................................................................. 3-7
3.2.3
Renaming a Flow Chart ....................................................................... 3-7
3.2.4
Copying a Flow Chart .......................................................................... 3-8
3.2.5
Changing Execution Order................................................................... 3-8
3.2.6
Import Charts ....................................................................................... 3-8
3.2.7
Deleting a Flow Chart .......................................................................... 3-9
3.3
Displaying Multiple Flow Charts........................................................................ 3-10
3.4
Editing Flow Charts .......................................................................................... 3-11
3.4.1
Saving Flow Charts............................................................................ 3-11
3.4.2
Cut-Copy-Paste ................................................................................. 3-12
3.4.3
UnDo and ReDo ................................................................................ 3-12
co
m
po
ne
nt
s.
co
m
3.1
on
lin
e
3.5
2373_en_E
Flow Chart Blocks............................................................................................. 3-12
3.5.1
Enable Block...................................................................................... 3-13
3.5.2
Branching Blocks............................................................................... 3-14
3.5.3
Compare Block .................................................................................. 3-15
3.5.4
Decision Block ................................................................................... 3-19
3.5.5
Action Blocks ..................................................................................... 3-22
3.5.6
Control Block ..................................................................................... 3-23
3.5.7
Message Block .................................................................................. 3-25
3.5.8
Move Block ........................................................................................ 3-26
3.5.9
Wait Block.......................................................................................... 3-27
3.5.10 Notes ................................................................................................. 3-28
3.6
Connecting Flow Chart Blocks ......................................................................... 3-28
3.7
Entering Block Comments ................................................................................ 3-30
3.8
Using the Message Editor................................................................................. 3-31
3.8.1
Displaying the Message Editor .......................................................... 3-31
3.8.2
Creating and Editing Messages ......................................................... 3-32
3.8.3
Copying Messages ............................................................................ 3-32
3.8.4
Clearing Messages ............................................................................ 3-33
PHOENIX CONTACT
3-1
on
lin
e
co
m
po
ne
nt
s.
co
m
nanoNavigator
3-2
PHOENIX CONTACT
2373_en_E
Flow Chart Programming
3
Flow Chart Programming
When a new project is created, the user must choose to create either a flow chart or ladder
chart (see Section 4, “Ladder Chart Programming”). A flow chart is a type of diagram that
uses symbols to illustrate a control process. The symbols in the flow chart depict two
classes of items: action blocks and branching blocks. For a detailed discussion of action
and branching blocks, see “Flow Charting Primer” on page 8-3.
Exploring Flow Charts
m
3.1
co
When a new flow chart is created, nanoNavigator opens the current flow chart maximized
in the Flow Chart Editor window.
s.
Menus
nt
Main
Toolbar
Magnifier
po
ne
Toolbar
Column
labels
Workspace
(in this case, showing a
flow chart in the drawing
area)
nanoLC
Status
Icons
Scrollbars
on
lin
e
co
m
Row
labels
Status line
Figure 3-1
nanoNavigator showing a flow chart window
The key elements of the Flow Chart Editor window, shown in Figure 3-1, are:
– Menus: Provide access to all the commands in nanoNavigator, as well as online help.
– Toolbar: Contains toolbar buttons for placing blocks onto flow charts. With the “View...
Auto-hide Toolbar” menu selected (the default), the Toolbar only appears with the Flow
Chart Editor visible. With this menu unselected, the Toolbar also appears in the Data
Item Editor and Message Editor, but it is only active in the Flow Chart Editor.
– Main Toolbar: Contains toolbar buttons for cut, copy, and paste. It also contains buttons
to quickly access selections from the “View” and “nanoLC” menus (see “Using the Main
Toolbar” on page 3-4).
2373_en_E
PHOENIX CONTACT
3-3
nanoNavigator
–
–
–
–
po
Connection
State Icon
(connected)
ne
nt
s.
co
–
Column labels: Provide a guide for locating shapes in the drawing area. nanoNavigator
provides five columns for flow chart blocks.
Row labels: Provide a guide for locating shapes in the drawing area. nanoNavigator
provides an unlimited number of rows as they are needed... limited only by available
memory.
Drawing area: Build flow charts in the drawing area. Horizontal and vertical grid lines
appear by default. Blocks must appear within a grid cell with only one block per cell.
Magnifier: Appears when hovering the mouse pointer over a populated cell in the flow
chart. Provides a more readable version of the cell’s contents and labels. Toggle this
feature ON (check mark present) or OFF using the “View... Magnifier” menu. By default,
the Magnifier is ON.
Scrollbars: Use the scroll bars to bring portions of the drawing area that are off-screen
into view. To scroll in small increments, click the arrows at the end of each scroll bar.
Status line: Provides information about nanoNavigator or selected shapes. Status
elements include a Message area and nanoLC status icons. nanoLC status icon area
presents three icons (from left to right) that reflect the state of the nanoLC. The icons
are:
– Connection state: Connected or not
– Running state: Unknown (not connected); Running; Stopped
– Locked state: Unknown (not connected); Locked; Unlocked
m
–
Locked State
Icon
(unlocked)
nanoLC status icons
co
m
Figure 3-2
Running State
Icon
(running)
3.1.1
Using the Main Toolbar
2
3
4
on
1
lin
e
The Main toolbar (see Figure 3-3) is visible by default. To toggle the toolbar on and off,
select the “View... Main Toolbar” menu.
5
6
Figure 3-3
7
8
9
0
!
"
§
$
%
&
Main toolbar
From left to right, the buttons in the toolbar are:
1. Save Project: Performs the same function as the “File... Save Project” menu.
2. Open Project: Performs the same function as the “File... Open Project” menu (see
“Open Existing Project” on page 2-6).
3. Cut: Performs the same function as the “Edit... Cut” menu (see “Cut-Copy-Paste” on
page 3-12).
4. Copy: Performs the same function as the “Edit... Copy” menu (see “Cut-Copy-Paste” on
page 3-12).
5. Paste: Performs the same function as the “Edit... Paste” menu (see “Cut-Copy-Paste”
on page 3-12).
3-4
PHOENIX CONTACT
2373_en_E
Flow Chart Programming
10.
11.
12.
13.
15.
Grid and Cell Address
co
3.1.2
m
po
16.
ne
nt
14.
m
8.
9.
co
7.
UnDo: Performs the same function as the “Edit... UnDo” menu (see “UnDo and ReDo”
on page 3-12).
ReDo: Performs the same function as the “Edit... ReDo” menu (see “UnDo and ReDo”
on page 3-12).
Chart Explorer: Opens the Chart Explorer (see “Chart Explorer” on page 3-6).
Edit Data Items: Opens the Data Item Editor (see “Using the Data Item Editor” on
page 5-3).
Edit Messages: Opens the Message Editor (see “Using the Message Editor” on
page 3-31).
Start Monitoring/Stop Monitoring: Toggles depending on whether or not nanoNavigator
is currently monitoring the connected nanoLC. Performs the same function as the
“nanoLC... Start Monitoring” menu and the “nanoLC... Stop Monitoring” menu (see
“nanoLC Monitor Window” on page 7-4).
Run: Starts the current project running on the nanoLC. Performs the same function as
the “nanoLC... Run” menu (see “Running a Project” on page 6-7).
Stop: Stops the current project on the nanoLC. Performs the same function as the
“nanoLC... Stop” (see “Stopping a Running Project” on page 6-7).
Download & Go: Downloads the project currently open in nanoNavigator to the
nanoLC. This single click saves, verifies, and then downloads the project to the
nanoLC. It then runs the project on the nanoLC. Performs the same function as
“nanoLC... Download & Go” menu (see “Downloading a Project” on page 6-5).
Simulator: Starts simulation of the project (see “Connecting to the Simulator” on
page 8-39).
Zoom Buttons: Combo Box, Zoom In and Zoom Out (see “Zooming In or Out” on
page 3-6).
s.
6.
lin
e
The Flow Chart Editor uses a fixed grid of five columns (labeled “A” to “E”) by any number
of rows (numbered “1” to n) for placement of flow chart blocks. The grid defines cells that
are labeled by column letter and row number. For example, cell “A0” is the cell in the upperleft location of the flow chart. By default, the grid lines are visible in flow charts. Whether the
grid lines are visible or not, cell references are by their cell address.
on
Turning the Grid On and Off
2373_en_E
To turn the page grid on or off, follow these steps:
1. Select the “File... Preferences...” menu to display the multi-page Preferences dialog
box.
2. Click the “Designer Options” tab.
3. Click the “Show Grid Lines” check box to turn the grid line on or off, respectively.
4. Click the “OK” button, and then answer any message dialog boxes that appear.
PHOENIX CONTACT
3-5
nanoNavigator
3.1.3
m
3.2
Chart Explorer
s.
Zoom drop-down
list
The full design of a chart may be large and any page may be larger than the viewable Flow
Chart Editor window. The following techniques show more of the page by setting the zoom
factor:
– Select the desired zoom percentage from the “View... Zoom Factor...” menu.
– Click the “Zoom In” or “Zoom Out” tools in the Standard toolbar.
– Hold the <Ctrl> key and spin the middle mouse wheel (up to zoom in and down to zoom
out).
– Hold the <Ctrl> key and press the main keyboard minus key to zoom out or the plus key
to zoom in.
– Use the “Zoom” drop-down list in the Main toolbar.
co
Zoom Out (left)
and In (right)
toolbar buttons
Zooming In or Out
ne
nt
A project can have up to 16 charts, in any combination of ladder and flow, with a total of
approximately 500 blocks. Use multiple charts for all but the simplest projects with each
chart controlling a single process, machine, or major function. A modular approach to
developing chart programs makes it easier to create, verify, and maintain control projects.
po
Use the Verify Project (see Section “nanoLC Monitor Window” on page 7-4) to ensure the
project is properly configured and does not exceed the capability of the hardware.
on
lin
e
co
m
Once downloaded to a nanoLC, all enabled charts (flow or ladder) execute in the order they
appear in the Chart Explorer. The project can programmatically control which charts
execute during any given scan cycle. For more information on enabling charts, see “Enable
Block” on page 3-13.
Figure 3-4
3-6
PHOENIX CONTACT
Chart Explorer
2373_en_E
Flow Chart Programming
To open the Chart Explorer and display a list of the charts (flow and ladder) in the project:
– Click the “Chart Explorer” button on the Main toolbar.
– Select the “View... Chart Explorer” menu.
Chart
Explorer
Button
An icon indicates the type of chart. Using the Chart Explorer automatically selects the
correct chart editor (flow or ladder).
Flow charts cannot be opened using the Ladder Chart Editor and ladder charts cannot be
opened using the Flow Chart Editor.
Flow charts appear in a Flow Chart Editor window. If the project consists of only one chart,
nanoNavigator always displays it when the program starts.
co
m
If there are multiple charts in the project, nanoNavigator displays the last chart that was
open when the program starts. If no chart window was open the last time the project closed,
nanoNavigator displays the Chart Explorer to allow selection of a chart to open.
– Click the “Exit” button to close the Chart Explorer.
Opening a Flow Chart
ne
3.2.1
nt
s.
Alternatively, select the “File… New Chart” and choose either a flow or ladder chart from the
list. To open an existing chart select the “File…Open Chart…” menu and click the desired
chart from the list.
po
To open a flow chart, for editing from the Chart Explorer, double-click the chart in the list or
click the chart name to select it, and then click the “Open” button.
Creating a New Flow Chart
co
3.2.2
m
Alternatively, the ladder chart can be selected from the “File... Open Chart...” menu.
lin
e
To create a new chart from the Chart Explorer, click the “New” button. The new chart will be
the same type of chart as last viewed, either ladder or flow. To create a new chart of a
different type, click the “New” button drop-down list on and click desired chart type.
on
Alternatively, select the “File… New Chart” and choose either a flow or ladder chart from the
list.
2373_en_E
3.2.3
Renaming a Flow Chart
To rename a chart, follow these steps:
1. Click the chart to highlight it, and then click the “Rename” button. Alternatively, rightclick the desired chart, and then click “Rename” from the pop-up menu.
2. In the “Rename Chart” dialog box that appears, type the new name. Chart names are
limited to 12 characters.
3. Click the “OK” button.
PHOENIX CONTACT
3-7
nanoNavigator
3.2.4
Copying a Flow Chart
To copy a chart from the Chart Explorer, follow these steps:
1. Click the chart to highlight it, and then click the “Copy” button. Alternatively, right-click
the desired chart, and then click “Copy” from the pop-up menu.
2. In the “Chart Name” dialog box that appears, leave the default new name or type the
new name.
3. Click the “OK” button.
Changing Execution Order
co
3.2.5
m
Alternatively, from the Flow Chart Editor, select the “File... Save Flow Chart As” menu to
save the chart with a new name and include it in the project. The old chart remains open and
in the project.
nt
s.
The Chart Explorer provides the capability to rearrange chart execution order. To change
chart execution order, do the following:
1. From the Chart Explorer, click the name of the desired chart to move.
2. Use the “Up” and “Down” buttons at the bottom of the window to reposition the
highlighted chart.
Import Charts
m
3.2.6
po
ne
Charts will execute in the order they are arranged. It doesn’t matter if it is a flow chart or
ladder chart.
on
lin
e
co
To import charts from another project, follow these steps:
3. Click the “Import” button to display the “Import Logic Chart” dialog box.
Figure 3-5
3-8
PHOENIX CONTACT
The “Import Logic Chart” dialog box
2373_en_E
Flow Chart Programming
4.
Select one or more charts in the list using any of the following techniques:
– Click on a chart.
– Use standard Windows multiple selection techniques to select multiple charts.
– Use the “Select All” button to select all charts in the project, and use the “Clear All”
button to start over.
Click the “Add” button to add the selected charts to the current project.
Click the “Exit” button to close the “Import Logic Charts” dialog box.
lin
e
6.
The “Import Logic Chart” dialog box with a project selected
co
Figure 3-6
m
po
ne
nt
s.
co
m
5.
Specify the source project by either typing the full path in the “Source Project Path” field
or by clicking the “…” (browse) button.
Use the browse dialog box to navigate to the project directory and locate the source
project (*.Nano” extension) that contains the charts to import. Once selected, the
source project name appears in the “Import Logic Charts” dialog box and all charts in
the project appear in the list.
on
7.
8.
3.2.7
Deleting a Flow Chart
To delete a flow chart use the Chart Explorer.
1. Click the chart to highlight it, and then click the “Delete” button or press the <Delete>
key. Alternatively, right-click the desired chart, and then click “Delete” from the pop-up
menu.
2. Click the “Yes” button in the confirmation box to delete the file or click the “No” button
to cancel.
The only way to undo deletion of a chart is by closing the project without saving changes.
This abandons all changes that were made to the project since the last save.
2373_en_E
PHOENIX CONTACT
3-9
nanoNavigator
3.3
Displaying Multiple Flow Charts
By default, when opening a chart, nanoNavigator maximizes it in the workspace. Switch to
other open charts using either the list in the “Window” menu, or by pressing the <Ctrl>+<F6>
or <Ctrl>+<Tab> (<Ctrl>+<Shift>+<F6> or <Ctrl>+<Shift>+<Tab> to reverse the order)
keys. nanoNavigator also permits maximizing, minimizing, or closing any chart window by
using the Window controls in the upper-right corner.
nanoNavigator allows multiple charts to be open simultaneously. This is very useful for
copying flow chart logic from one flow chart to another.
NOTE:
on
lin
e
co
m
po
ne
nt
s.
co
m
Different chart types can be opened simultaneously. However, it is not possible to copy
content between different chart types. Only content from a flow chart can be copied into
a flow chart and only content from a ladder chart can be copied into a ladder chart.
Figure 3-7
3-10
PHOENIX CONTACT
Vertically tiled flow chart windows
2373_en_E
Flow Chart Programming
To display more than one chart at a time:
– Select the “Window…Cascade” menu to show all open charts one behind the other,
slightly offset.
– Select the “Window…Tile Vertically” menu to display all open charts in a vertical
arrangement as shown in Figure 3-7.
– Select the “Window…Tile Horizontal” menu to display all open charts in a horizontal
arrangement.
Editing Flow Charts
co
3.4
m
Charts that are minimized are not displayed using the “Window…” commands.
s.
nanoNavigator provides intuitive Windows-style editing capability to move or cut and paste
flow chart blocks from one grid location to another. Many functions are available with a
mouse right-click, or use the Main toolbar buttons as described:
nt
To select flow chart elements for editing:
1. Click a block or connection to select it.
po
To select multiple blocks or connections, do one of the following:
– Select a rectangular area by pressing (hold down) the left mouse button, dragging
the cursor diagonally to size a rectangular area, and then releasing the mouse
button. This technique selects any cell that is partially included in the selection
rectangle. That means that the block in the cell and any flow lines connected to it
get selected.
– Hold the <Ctrl> key while clicking blocks or connections. Clicking a selected block
or connection with the <Ctrl> key pressed deselects that object without deselecting
any others.
Perform the action (such as cut, copy, move, or delete).
lin
e
co
m
2.
ne
By default, nanoNavigator is always in selection mode, except after clicking a block’s exit
connector anchor that doesn’t have a flow line connecting to another block (see
“Connecting Flow Chart Blocks” on page 3-28).
3.
on
UnDo or ReDo edit operations can be performed until an operation that clears the UnDo
Stack is performed.
3.4.1
Saving Flow Charts
Select the “File... Save Flow Chart” menu to save the current flow chart using the current
name (the default is “Flowchart” followed by a number). Attempting to close a flow chart after
modifying it displays a “Changes Made” dialog box. Click the “Yes” button to save the
changes, click the “No” button to close the flow chart without saving it, or click the “Cancel”
button to return to the flow chart.
To save a copy of the current flow chart, select the “File... Save Flow Chart As” menu. This
menu selection displays the “Rename Chart” dialog box with the new default name. Either
accept the name or type a new name, and then click the “OK” button. This creates a copy of
the chart with any modifications and leaves the original chart in the project in the state it was
in the last time it was saved.
2373_en_E
PHOENIX CONTACT
3-11
nanoNavigator
3.4.2
Cut-Copy-Paste
After selecting the object(s), use the cut (<Ctrl>+<X>), copy (<Ctrl>+<C>), and paste
(<Ctrl>+<V>) shortcuts (see Figure 3-8), the Main toolbar buttons, or the “Edit” menu
selections to speed up chart development. With multiple charts open, it is possible to
cut/copy and paste from one chart to another, provided the charts are the same chart type.
UnDo and ReDo
co
3.4.3
From left to right, “Cut”, “Copy”, and “Paste” buttons
m
Figure 3-8
nt
s.
nanoNavigator supports an unlimited number of UnDo and ReDo operations. UnDo (or
ReDo) operations are processed one at a time in the order they were performed. UnDo
cancels the last edit operation (for example, deleting a block from a flow chart), and restores
the chart to its state before the previous operation. After performing an UnDo, a ReDo can
be performed. ReDo cancels the previous UnDo operation and restores the chart to its state
prior to the UnDo.
m
po
ne
nanoNavigator stores UnDo and ReDo operations in separate stacks for each chart. The
UnDo stack is cleared (UnDo operations are no longer valid) when:
– a chart is saved
– the project is saved
– a nanoLC is connected
– the project is verified
lin
e
co
The ReDo stack is cleared (ReDo operations are no longer valid) when any edit on the chart
is performed other than an UnDo.
on
Figure 3-9
“Undo” and “Redo” buttons
To perform an UnDo or ReDo operation, do one of the following:
– click the “UnDo” or “ReDo” button on the Main toolbar.
– select the “Edit... UnDo” or “Edit... ReDo” menu.
– press the <Ctrl>+<Z> keys to UnDo or the <Ctrl>+<Shift>+<Z> keys to ReDo.
3.5
Flow Chart Blocks
This section describes the various block types, how to place them and create a flow chart.
To place a new flow chart block on the page, follow these steps:
1. In the Toolbar, click the button of the block type to place.
2. Click in the desired location (cell) on the drawing page.
3-12
PHOENIX CONTACT
2373_en_E
Flow Chart Programming
3.5.1
Enable Block
The Enable block always appears at the top of a flow chart. It allows the flow chart to begin
executing. It can contain an expression that conditionally activates the flow chart while the
project is running. To develop the control program, add flow chart blocks below the Enable
block.
An empty Enable block (no expression created) causes a flow chart to always run.
At runtime, the enable block is green if the flow chart is active. If it's red, the flow chart
is inactive, and if it's gray, the project isn't running.
m
–
–
Every new flow chart opens with a predefined Enable block
po
Figure 3-10
ne
nt
s.
co
m
The Enable block is in the upper-left, grid cell A0, in a new flow chart (see Figure 3-10). It
has the following characteristics:
– The Enable block is the first block of every flow chart. It has a single exit from which flow
passes on to the rest of the control program. The Enable block cannot be deleted,
copied, or moved on the drawing area.
on
lin
e
co
Expressions can be added to the Enable block to set conditions for running the chart. To
add statements to the expression using logical operators, double-click the block. The result
of the expression is either TRUE or FALSE, enabling or disabling the flow chart respectively.
Figure 3-11
2373_en_E
The “Enable Block” dialog box
PHOENIX CONTACT
3-13
nanoNavigator
The AND and OR “Operator” in the dialog box permits addition of a second Boolean
condition to the expression. AND has greater precedence than OR (in other words AND
expressions are evaluated before OR expressions, and then they are evaluated from topdown). nanoLC supports one or two Boolean conditions in an Enable block.
– nanoLC evaluates the Enable block every scan, at the time when the flow chart
executes (based on the position of the flow chart in the flow chart list—see “Changing
Execution Order” on page 3-8. The flow chart only runs if its expression is true at the
start of the scan.
– On the first scan or whenever the Enable block expression transitions from FALSE to
TRUE, flow chart execution starts at the Enable block output. Otherwise, execution
starts where it left off the previous scan.
Valid Enable Block Expression1
Table 3-1
ON
OFF
Input
X
X
X
X
X
X=valid
po
3.5.2
nt
X
Flag
ne
Output
s.
Data Item Type
1
co
m
Table 3-1 defines all possible Enable block combinations. This table shows valid data item
types and the conditions that appear in the “Condition” drop-down list. For example, it is
possible to test to see if an Input is “ON” or “OFF”.
Branching Blocks
on
lin
e
co
m
Branching blocks (both Decision and Compare blocks) perform a test and determine which
of two paths to take after the test. Each branching block has one entry point and two exit
points indicating Yes and No paths from the block. By default, the bottom connector is the
Yes path, and the right side is the No path. For more information on branching blocks, see
“Types of Branching Blocks” on page 8-5.
3-14
PHOENIX CONTACT
2373_en_E
Flow Chart Programming
m
po
ne
nt
s.
co
m
Place a branching (Decision or Compare) block by clicking the respective Block toolbar
button, and then clicking in the desired location in the drawing area. Both Decision and
Compare blocks appear as diamonds in the flow chart (see Figure 3-12).
Decision and Compare blocks appear as diamonds
co
Figure 3-12
Compare Block
lin
e
3.5.3
on
Compare
Block Button
2373_en_E
The Compare block can make a numerical comparison. Flow follows one of the two exit
paths of the Compare block based on the result of the comparison. The type of comparisons
available are less than (<), equal to (=), greater than (>), greater than or equal to (>=), less
than or equal to (<=), and IsEven. There are also special direct time and date comparison
operations for date, time, day of week, day of month, and day of year.
To compare Boolean values, use the Decision Block (see “Decision Block” on page 3-19).
PHOENIX CONTACT
3-15
nanoNavigator
co
m
po
ne
nt
s.
co
m
Double-click the Compare block to edit its expression. This displays the “Compare Block...
Configuration” tab (see Figure 3-13). This example compares the register “R-01” with the
name “Big Number Register” and register “R-07” that has the default name.
“Compare Block... Configuration” tab
lin
e
Figure 3-13
on
When using a constant in the Compare Expression, the variable operand must be the First
Item and the constant must be Second Item.
Both Registers and Timer/Counters have subtypes. The default subtype of both is
“Unconfigured”. If selecting an unconfigured type for the first operand, nanoNavigator
prompts for selection of its type. The subtype of the second operand must match the
subtype of the first operand. Its drop-down list only shows operands with matching or
unconfigured subtypes. If selecting an unconfigured item, nanoNavigator permits changing
the subtype to match the type of the first operand.
When comparing “Current Date” or “Current Time” or a register with a subtype of “Date”
or “Time of Day”, choose which components of the date or time to include in the
comparison. For instance, to perform a date compare between the day and month, ignore
the year. Likewise, to perform a time compare between minutes, ignore the hours and
seconds.
In the example shown in Figure 3-13, the nanoLC will compare the register R-01 data item
to see if it is equal to R-07 when this block executes. If it is, control will pass through the
“Yes” path to the next block in that path. If not, control passes through the “No” path to the
next block in that path.
3-16
PHOENIX CONTACT
2373_en_E
Flow Chart Programming
Editing a Compare Block
s.
co
m
To edit a Compare block expression, follow these steps:
1. While in Selection Mode, double-click the Compare block to open the “Compare
Block... Configuration” tab (see Figure 3-13).
2. Click the “Data Type” drop-down to select the data item type. Only valid data types
appear in the list. Available types are Register, Timer/Counter, Analog Input, Message
Input, Current Date, Current Time, Current Day of Week, Current Day of Month, and
Current Day of Year.
3. For Register, Timer/Counter, Analog Input, and Message Input, enter the “Data Item”
using one of the following techniques:
– Enter the data item number, for example “1” or “01”. The type is known because it
is already selected.
– Enter the data item ID (“DI”), for example “I-01”. When tabbing to the next field,
nanoNavigator displays the data item name associated with the ID.
– Use the drop-down button to display the list of data items that correspond to the
selected data item type. The drop-down list only shows data items of the “Type”
selected.
Use the “Comparison Operator” drop-down to select the desired comparison.
Use the “Second Item” group to select a “Data Type” and “Data Item”.
Click the “OK” button.
po
4.
5.
6.
ne
nt
If selecting an unconfigured Timer/Counter, a small dialog box opens with a drop-down
list that permits configuration of the Timer/Counter as a “Counter”, “Duration (HMS)”, or
“Duration (mSec)”.
Yes/No path selection
lin
e
co
m
By default, the connection that goes out the bottom of the Compare block is the “Yes” path;
the exit on the right is the “No” path. The “Compare Block... Comments” tab permits adding
a block comment and swapping the positions of the Yes and No exit paths (another way is
to right-click a block, and then select “Swap Yes/No Connectors” from the pop-up menu).
Entering the block’s cell address (“Grid and Cell Address” on page 3-5) explicitly sets or
modifies the target block of the “Yes” or “No” connector.
Compare Block Summary
on
Table 3-2 defines all possible Compare block combinations.
2373_en_E
PHOENIX CONTACT
3-17
nanoNavigator
Valid Comparisons in a Compare Block1
Data Item Type
IsEven
mSec
HMS
DoW
Time
X
Display
Format
X
xxxxxxxx
X
dd/mm/yy
X
DoW
X
X
hh:mm:ss
X
X
mSec
X
X
X
X
xxxx.xxx
X
X
s.
X
xxxxxxxx
hh:mm:ss
X
xxxx.xxx
X
X
X
xxxxxxxx
Analog Out
X
X
X
xxxxxxxx
HS Counter
X
X
X
xxxxxxxx
X
X
xxxxxxxx
Integer
X
Date
X
Time
po
Message Input
Current Time
lin
e
Day of Week
co
mSec
dd/mm/yy
X
X
hh:mm:ss
X
X
m
HMS
X
X
DoW
Current Date
ne
Analog In
nt
mSec
hh:mm:ss
X
Counts X
HMS
Sun-Sat
m
HMS
Sun-Sat
X
X
hh:mm:ss
X
X
X
X
X
X
xxxx.xxx
dd/mm/yy
hh:mm:ss
X
Sun-Sat
X
X
xx
Day of Year
X
X
xxx
on
Day of Month
1
3-18
Date
X
Time
Timer/Counter
Integer
Date
mSec
X
HMS
Integer
DoW
Integer
Register
Time
Subtype
Date
Data Item Type
Constant Value
co
Table 3-2
Notes:
DoW is Day of the Week
X=valid
PHOENIX CONTACT
2373_en_E
Flow Chart Programming
3.5.4
The Decision block evaluates a Boolean expression as true/false. The expression may
consist of one or more bits. The Decision block has one entry point and two exit points
(Yes/No), based on the Boolean decision. Use the “Decision Block” dialog box to select the
bit(s) to be evaluated, which are of these types:
– Flag
– Input
– Output
– Keypad key
– Timer/Counter
– High-Speed Counter
m
Decision Block
Button
Decision Block
The AND and OR “Operator” in the dialog box permits adding a second Boolean
condition to the expression. Expressions are evaluated from top-down. nanoLC
supports one or two Boolean conditions in one Decision block. Double-click the
Decision block to edit its expression. This displays the “Decision Block...
Configuration” tab (see Figure 3-14).
on
lin
e
co
m
po
ne
nt
s.
–
co
To perform a non-Boolean comparison, use the Compare block (see “Compare Block” on
page 3-15).
Figure 3-14
2373_en_E
“Decision Block... Configuration” tab
PHOENIX CONTACT
3-19
nanoNavigator
Editing a Decision Block
co
m
To edit a Decision block expression, follow these steps:
1. While in Selection Mode, double-click the Decision block to open the “Decision Block...
Configuration” tab (see Figure 3-14).
2. Click the “Data Type” drop-down list to select the data item type. Only valid data types
appear in the list. Available types are Flag, Input, Output, Keypad Key, Timer/Counter,
and High-Speed Counter.
3. Enter the “Data Item” using one of the following techniques:
– Enter the data item number, for example “1” or “01”. The type is known.
– Enter the data item ID (“DI”), for example “I-01”. When tabbing to the next field,
nanoNavigator displays the data item name associated with the ID.
– Use the drop-down button to display the list of data items that correspond to the
selected data item type. The drop-down list only shows data items of the “Type”
selected.
Use the “Condition” drop-down list to set the condition desired.
nt
4.
s.
When selecting an unconfigured Timer/Counter, a small dialog box appears with a dropdown list that permits configuration of the Timer/Counter as a “Counter”, “Duration
(HMS)”, or “Duration (mSec)”.
ne
Or use the <Tab> key to highlight the field and use the first character to toggle the value.
For example, typing the letter “o” toggles among values beginning with the letter “o”.
Click the “OK” button.
m
5.
po
Use the
button on the right side of the conditional expression line to delete (make all
fields blank) the expression.
Yes/No Path Selection
on
lin
e
co
By default, the connection that goes out the bottom of the Decision block is the “Yes” path;
the exit on the right is the “No” path. The “Decision Block... Comments” tab permits adding
a block comment and swapping the positions of the “Yes” and “No” exit paths (another way
is to right-click a block, then select “Swap Yes/No Connectors” from the pop-up menu).
Entering the block’s cell address (“Grid and Cell Address” on page 3-5) explicitly sets or
modifies the target block of the “Yes” or “No” connector.
3-20
PHOENIX CONTACT
2373_en_E
Flow Chart Programming
Decision Block Summary
Table 3-3 defines all possible Decision block combinations.
Valid Comparisons in a Decision Block1
Timer/
Counter
Bits
X
Timer/Counter HMS
Counts
X
X
m
X
X=valid
X
X
X
X
X
X
X
X
on
lin
e
co
m
po
1
X
ne
HS Counter
X
nt
mSec
X
co
X
X
Disabled
X
Key pad entry
Enabled
Flag
Not Done
X
Done
X
Not Running
Output
Running
X
Not Done
Off
X
Mode
Done
On
Input
Data Item
Type
HS Counter
s.
Table 3-3
2373_en_E
PHOENIX CONTACT
3-21
nanoNavigator
3.5.5
Action Blocks
on
lin
e
co
m
po
ne
nt
s.
co
m
nanoNavigator has four types of action blocks: Control, Message, Move, and Wait (see
Figure 3-15). For more information on action blocks, see “Types of Action Blocks” on
page 8-5.
3-22
PHOENIX CONTACT
Figure 3-15
Action blocks
2373_en_E
Flow Chart Programming
3.5.6
Control block
Button
Control Block
The Control block is the most basic building block of a flow chart. It is one of the action
blocks of the nanoNavigator (see “Types of Action Blocks” on page 8-5). Its job is to do the
discrete actions listed in its expression list. A Control block is capable of setting bits On or
Off (flags or outputs), and doing internal timer or counter operations.
Unlike ladder logic, these actions are latched. In other words, when turning an output on,
it stays on until the flow chart (or another flow chart) turns it off. The only exception is the
pulse output, which automatically turns off after the specified duration (entered in the Data
Item grid), and the Flash Output action, which causes the Output to turn on and off at the
configured period until the output is turned off.
co
m
Use the “Control Block” dialog box to select the action(s) for the control block:
– Turn a Flag or Output on or off
– Pulse or Flash an Output (where a pulse turns off after a specified duration, and a flash
cycles on and off at a 50% duty cycle until it is either turned off or on)
Start, stop, reset, or restart a Timer
Increment, Decrement, or reset a counter
ne
–
–
nt
s.
A Pulse output with a duration of 0 (zero) causes the output to be on for a single scan only.
on
lin
e
co
m
po
The “Control Block” dialog box can contain up to four actions, which the nanoLC executes
in list order. Double-click the Control block to edit its expression. This displays the “Control
Block... Configuration” tab (see Figure 3-16).
Figure 3-16
2373_en_E
“Control Block... Configuration” tab
PHOENIX CONTACT
3-23
nanoNavigator
Since actions in the Control block execute in the order they appear, Control blocks permit
reordering actions. To reorder an action, select it (it appears highlighted), and then use the
“Move Up” or “Move Down” buttons to move the selected action. For these buttons to be
available, there must be more than one action defined in the block.
The order rarely makes a difference. This feature is primarily to improve readability. It
does, however, make a difference when starting a timer, and then resetting that timer, as
opposed to the inverse. This is applicable if the timer was previously stopped but did not
complete (elapsed time operations).
Editing a Control block
ne
nt
s.
co
m
To edit a Control block’s expression, follow these steps:
1. Double-click the Control block to open the “Control Block... Configuration” tab (see
Figure 3-16).
2. Click the “Type” cell, and select the data item type desired.
3. Enter the “Data Item” using one of the following techniques:
– Enter the data item name in the “Data Item” field. While typing, nanoNavigator
attempts to auto-complete the name. When tabbing to the next field,
nanoNavigator displays the data item ID associated with the data item name.
– Enter the data item ID (“DI”), for example “I-01”. When tabbing to the next field,
nanoNavigator displays the data item name associated with the ID.
– Use the drop-down button to display the list of data items that correspond to the
selected data item type.
From the “Action” drop-down list, select the action desired. The choices available in the
drop-down depend on the data item type selected.
co
4.
m
po
When selecting an unconfigured Timer/Counter, a small dialog box displays with a dropdown that permits configuration of the Timer/Counter as a “Counter”, “Duration (HMS)”,
or “Duration (mSec)”.
lin
e
Use the
button on the right side of the conditional expression line to delete (make all
fields blank) the expression.
on
5.
3-24
PHOENIX CONTACT
6.
Repeat steps 2. through 4. as required for additional expressions. A block must have at
least one expression. After entering more than one expression, the “Move Up” and
“Move Down” buttons become available. These buttons permit re-ordering the
expression, since the nanoLC executes them in the order they appear in this dialog box.
Select one of the expressions, and then click the desired button to move it in the list.
Click the “OK” button.
2373_en_E
Flow Chart Programming
3.5.7
When configured with the optional Operator Panel, the nanoLC can display messages to
the user. Messages can contain static text, dynamic values from any data item, and data
entry requests. Double-click the Message block to edit its expression. This displays the
Configuration page of the “Message Block” dialog box (see Figure 3-17).
“Message Block... Configuration” tab
m
Figure 3-17
po
ne
nt
s.
co
m
Message
Block
button
Message Block
co
The drop-down list at the top of the page permits selection of a message number (from 0 to
31). The Message Editor permits entry or modification of the message associated with that
message number (see “Using the Message Editor” on page 3-31).
lin
e
Only configured messages appear in the “Message #” drop-down list.
on
Obtaining User Input
As defined in “Inserting Data Entry Items” on page 3-32, messages can include data
variables that prompt for user input. As the operator enters data through the keypad on the
Operator Panel, the Operator Panel processor validates the input data according to the data
type specified. Once the operator completes data entry and presses the “OK” key, the
Operator Panel passes the input to the flow chart and sets the “Message Input Ready” key
for one scan cycle.
Flow charts that require operator input must continue to look for the “Message Input Ready”
key or some overriding condition that would inhibit data from being entered on every scan
after sending the message requesting input.
2373_en_E
PHOENIX CONTACT
3-25
nanoNavigator
3.5.8
Move Block
The Move block simply moves data from one location to another. Doing a move from one
data item to another simply moves (copies) the data of the first data item into the second
data item. The value of the first data item is preserved.
Move Block
Button
The “Move Block... Configuration” tab (see Figure 3-18) permits definition of the “From” and
“To” data fields. After selecting the “Data Type”, the “Data Item” drop-down list displays only
those data items for the type selected.
lin
e
co
m
po
ne
nt
s.
co
m
For more information on how the Move block performs powerful data manipulations, refer to
“Using the Move Function” on page 5-13.
“Move Block... Configuration” tab
on
Figure 3-18
3-26
PHOENIX CONTACT
2373_en_E
Flow Chart Programming
3.5.9
Wait Block
The Wait block inserts a wait period in the execution of the flow chart. Configure the wait
period in seconds (with millisecond resolution) or hours, minutes, and seconds. If the wait
duration is zero, the block defaults to one scan cycle.
co
m
po
ne
nt
s.
co
m
Wait Block
Button
To configure the wait time:
1. Double-click the Wait block to display the “Wait Block... Configuration” tab (see
Figure 3-19).
“Wait Block... Configuration” tab
lin
e
Figure 3-19
on
2.
Do one of the following:
To wait for one scan cycle, click the “One Scan Wait” check box.
The duration changes to zero if it was previously non-zero, and “Wait Time” becomes
unavailable.
To wait for a specified period of time:
– Click either the “HH:MM:SS” or “Seconds” radio button.
– Enter the duration in hours, minutes, and seconds or seconds and milliseconds in
the field using the format shown.
If the duration is zero, the Wait block defaults to one scan cycle. The Wait block
automatically selects the “One Scan Wait” check box upon clicking the “OK” button.
3.
Click the “OK” button.
During the wait period, many scan periods may pass. However, the flow chart with the Wait
block will not execute further until the wait period ends. On the scan when the wait time
expires, flow chart execution resumes at the next block following the Wait block.
2373_en_E
PHOENIX CONTACT
3-27
nanoNavigator
The Wait block is easier to use than constructing a timing loop for a delay in the flow chart,
since there is no need to create a timer data item or create the flow chart loop. When a Wait
block is executing, no other blocks in the current flow chart execute until the wait completes.
Other flow charts continue to execute normally as long as they are enabled.
3.5.10
Notes
Notes don’t actually appear in a block. They can appear anywhere on the flow chart page
and don’t connect to or affect program flow.
m
Connecting Flow Chart Blocks
co
3.6
nt
s.
To draw flow chart block connecting lines, follow these steps:
1. Move the cursor to the bottom (or side for Decision and Compare blocks) connecting
point of a block that doesn’t have an outgoing flow line. The connecting point turns
orange (or the specified color) to indicate a potential outgoing connector pointer, and
the cursor changes to the connector pointer.
m
4.
Click the outgoing connector point.
Move the cursor to the next block’s top (incoming) connector point, which will turn green
(or the specified color).
Click the incoming connector to complete the line. The cursor changes back to the
selector pointer.
po
2.
3.
ne
If the Flow Chart Editor is inadvertently in connect mode, press the <Esc> key to switch
back to select mode.
on
lin
e
co
nanoNavigator supports automatic routing from one block to another, so it is only
necessary to click the outgoing connector of one block and the incoming connector of the
next to generate the flow line. It is always possible to manually draw the flow line by
clicking from point-to-point to route the line.
3-28
PHOENIX CONTACT
2373_en_E
Flow Chart Programming
m
po
ne
nt
s.
co
m
For example, Figure 3-20 shows a simple project flow chart with all required connecting
lines.
Sample flow chart with flow lines connecting all blocks
co
Figure 3-20
on
lin
e
Unlike CAD programs that permit ending a line where it intersects another line,
nanoNavigator requires guiding the pending connection to the common destination.
2373_en_E
If the connector appears as a red line, it is not properly connected. This can occur if the
connection doesn’t meet the input connection point of the block. Try moving the end point
of the line until the region that represents the block’s input connection becomes
highlighted.
PHOENIX CONTACT
3-29
nanoNavigator
3.7
Entering Block Comments
Enter comments about a block to summarize actions taken in the block. This is useful to
provide an overview version of the flow chart. Specify whether flow charts should display
block comments or block expressions by toggling the “View... Block Comments” menu.
lin
e
co
m
po
ne
nt
s.
co
m
To enter or edit block comments:
1. Right-click on the block and select “Block Comments” from the pop-up menu. The
“Comments” tab of the properties dialog box (see Figure 3-21) appears.
on
Figure 3-21
2.
PHOENIX CONTACT
Enter the block comment, and then click the “OK” button.
The “Address” fields for “Yes” and “No” in the “Compare” and “Decision” block
“Comments” tabs permit entry of a cell address (see “Grid and Cell Address” on page 3-5)
without drawing a connection.
3.
3-30
“Compare Block... Comments” tab
To view all block comments on the flow chart instead of expressions, select the “View...
Block Comments” menu.
2373_en_E
Flow Chart Programming
3.8
Using the Message Editor
on
lin
e
co
m
po
ne
nt
s.
co
m
The Message Editor (see Figure 3-22) permits definition of up to 32 four-line messages to
use during project execution. Each line can have up to 20 characters, and lines can contain
any combination of static text, data item output, and user-requested input.
Figure 3-22
3.8.1
Edit
Messages
Button
2373_en_E
Use Message Editor to define and edit messages in a project
Displaying the Message Editor
Click the “Edit Messages” button in the Main toolbar, or select the “View... Message Editor”
menu to display the Message Editor in the nanoNavigator workspace. Once open, the
Message Editor is like any other window. Display the Message Editor by selecting it from the
“Windows” menu, selecting it again from the “View” menu, or pressing <Ctrl>+<F6> or
<Ctrl>+<Shift>+<F6> until it appears on top. When using “Windows... Cascade” or one of
the “Tile” options with the Message Editor open, the Message Editor appears along with all
open charts.
PHOENIX CONTACT
3-31
nanoNavigator
3.8.2
Creating and Editing Messages
To create or edit a message, follow these steps:
1. Select the “View... Message Editor” menu or click the “Edit Messages” button on the
Main toolbar to display the Message Editor.
2. Select the message to create or edit from the “Current Message” drop-down list. This
displays the current message in the four lines of the “Message” group at the top of the
window.
3. Enter any static text, data display items (see below), data entry items (see below),
and/or symbols in the fields.
co
m
The nanoLC does not clear any message cells that aren’t explicitly overwritten. To ensure
that an old message is cleared before writing a new one, leave the “Clear Line” check box
selected (selected by default) for the line(s) to clear prior to displaying new text.
Click the “Save” button to save the message.
Inserting Data Display Items
nt
4.
s.
The symbols that appear in the “Insert Symbols” list correspond to special keys that are
available on the nanoLC.
po
ne
To display a data item, use the “Insert Data Display Item” group as follows:
1. Select a cell of the message.
2. Select the data item “Type” from the drop-down list.
3. Select the data item from the “Data Item” drop-down list.
4. Click the “Insert” button to insert the data display item in the message.
m
Inserting Data Entry Items
lin
e
co
To have the user enter a data item, use the “Insert Data Entry Item” group as follows:
1. Select a cell of the message.
2. Select the data item “Return Type” from the drop-down list.
3. Select the data item from the “Data Item” drop-down list.
4. Click the “Insert” button to insert the data entry item in the message.
on
3.8.3
Copying Messages
To copy a message, follow these steps:
1. Select the “View... Message Editor” menu or click the “Edit Messages” button on the
Main toolbar to display the Message Editor.
2. Select the message to copy from the “Current Message” drop-down list. This displays
the current message in the four lines of the “Message” group at the top of the window.
3. Click the “Copy...” button. This displays the “Copy Message” dialog box.
4. Use the “Copy Message” dialog box to enter a message number or use the up/down
buttons to select a message number. The number entered is the destination for the
copy operation.
An asterisk (*) in the number field indicates the message has been configured previously.
3-32
PHOENIX CONTACT
2373_en_E
Flow Chart Programming
5.
Click the “OK” button. The copy operation executes immediately unless the destination
message already has text or fields. In that case, a warning message appears before the
operation completes.
3.8.4
Clearing Messages
on
lin
e
co
m
po
ne
nt
s.
co
m
To clear a message, follow these steps:
1. Select the “View... Message Editor” menu or click the “Edit Messages” button on the
Main toolbar to display the Message Editor.
2. Select the message to clear from the “Current Message” drop-down list. This displays
the current message in the four lines of the “Message” group at the top of the window.
3. Click the “Clear” button. This displays a confirmation dialog box.
4. Click the “Yes” button to clear the message.
2373_en_E
PHOENIX CONTACT
3-33
on
lin
e
co
m
po
ne
nt
s.
co
m
nanoNavigator
3-34
PHOENIX CONTACT
2373_en_E
Section 4
This section provides information about:
– Managing charts using Chart Explorer
– Using the Ladder Chart Editor and creating ladder charts
– Using the Message Editor
Ladder Chart Programming..............................................................................................................4-3
Exploring Ladder Charts..................................................................................... 4-3
4.1.1
Using the Main Toolbar........................................................................ 4-5
4.1.2
Grid and Cell Address.......................................................................... 4-6
4.1.3
Zooming In or Out ................................................................................ 4-7
4.2
Chart Explorer .................................................................................................... 4-7
4.2.1
Opening a Ladder Chart ...................................................................... 4-8
4.2.2
Creating a New Ladder Chart .............................................................. 4-8
4.2.3
Renaming a Ladder Chart.................................................................... 4-8
4.2.4
Copying a Ladder Chart....................................................................... 4-9
4.2.5
Changing Execution Order................................................................... 4-9
4.2.6
Import Charts ....................................................................................... 4-9
4.2.7
Deleting a Ladder Chart..................................................................... 4-10
4.3
Displaying Multiple Charts ................................................................................ 4-11
4.4
Editing Ladder Charts....................................................................................... 4-12
4.4.1
Saving Ladder Charts ........................................................................ 4-12
4.4.2
UnDo and ReDo ................................................................................ 4-12
4.5
Ladder Chart Contacts and Coils...................................................................... 4-13
4.5.1
Enable Block...................................................................................... 4-14
4.5.2
Rungs ................................................................................................ 4-16
4.5.3
Decision Contact ............................................................................... 4-17
4.5.4
Compare Contact .............................................................................. 4-19
4.5.5
Control Coil ........................................................................................ 4-23
4.5.6
Message Coil..................................................................................... 4-25
4.5.7
Move Coil........................................................................................... 4-27
on
lin
e
co
m
po
ne
nt
s.
co
m
4.1
2373_en_E
4.6
Using the Message Editor................................................................................. 4-28
4.6.1
Displaying the Message Editor .......................................................... 4-28
4.6.2
Creating and Editing Messages ......................................................... 4-29
4.6.3
Copying Messages ............................................................................ 4-29
4.6.4
Clearing Messages ............................................................................ 4-30
PHOENIX CONTACT
4-1
on
lin
e
co
m
po
ne
nt
s.
co
m
nanoNavigator
4-2
PHOENIX CONTACT
2373_en_E
Ladder Chart Programming
4
Ladder Chart Programming
4.1
Exploring Ladder Charts
nt
s.
co
m
When a new project is created, the user must choose to create either a flow chart (see “Flow
Chart Programming” on page 3-3) or ladder chart. A ladder chart (or ladder diagram)
expresses the program logic using graphical symbols similar to relay circuits. When a new
project is selected, the “Select Type of First Chart” dialog box appears. Click the “Create
Ladder Chart” button to create a new ladder chart.
“Select Type of First Chart” dialog box
ne
Figure 4-1
po
To create additional charts in a project, select “File… New Chart…” from the menu and
choose either the “Flow Chart” or “Ladder Chart” option. Alternatively, new charts can be
created from within the Chart Explorer by clicking the “New” button.
Flow charts and ladder charts can both be utilized within a project.
on
lin
e
co
m
A flow chart cannot be opened using the Ladder Chart Editor and a ladder chart cannot be
opened using the Flow Chart Editor.
2373_en_E
PHOENIX CONTACT
4-3
nanoNavigator
Upon creation of a ladder chart, an Enable block is automatically placed in the first cell (A0).
Also, the first rung is automatically created and populated using a contact and a coil. Down
the left side is the “power” line.
Menus
Main
Toolbar
Toolbar
Column
labels
s.
co
m
Magnifier
m
ne
po
Workspace
(in this case, showing a
ladder chart in the
drawing area)
nt
Row
labels
co
Status line
nanoLC
Status
Icons
nanoNavigator showing a ladder chart window
on
lin
e
Figure 4-2
Scrollbars
4-4
PHOENIX CONTACT
The key elements of the nanoNavigator ladder chart window, shown in Figure 4-2, are:
– Menus: Provide access to all the commands in nanoNavigator, as well as online help.
– Toolbar: Contains toolbar buttons for placing coils and contacts onto ladder charts.
With the “View... Auto-hide Toolbar” menu selected (the default), the Toolbar only
appears with a Chart Editor visible. With this menu unselected, the Toolbar also
appears in the Data Item Editor and Message Editor, but it is only active in the Ladder
Chart Editor.
– Main Toolbar: Contains toolbar buttons for cut, copy, and paste. It also contains buttons
to quickly access selections from the “View” and “nanoLC” menus (see “Using the Main
Toolbar” on page 4-5).
– Column labels: Provide a guide for locating shapes in the drawing area. nanoNavigator
provides five columns for ladder chart blocks.
– Row labels: Provide a guide for locating shapes in the drawing area. nanoNavigator
provides an unlimited number of rows limited only by available memory.
– Drawing area: Build ladder charts in the drawing area. Horizontal and vertical grid lines
appear by default. Coils and contacts must appear within a grid cell with only one
element per cell.
2373_en_E
Ladder Chart Programming
–
–
co
m
–
Magnifier: Appears when hovering the mouse pointer over a populated cell in the ladder
chart. Provides a more readable version of the cell’s contents and labels. Toggle this
feature ON (check mark present) or OFF by clicking the “View... Magnifier” menu. By
default, the Magnifier is ON.
Scrollbars: Use the scroll bars to bring portions of the drawing area that are off-screen
into view. To scroll in small increments, click the arrows at the end of each scroll bar.
Status line: Provides information about nanoNavigator or selected shapes. Status
elements include a Message area and nanoLC status icons. nanoLC status icon area
presents three icons (from left to right) that reflect the state of the nanoLC. The icons
are:
– Connection state: Connected or not
– Running state: Unknown (not connected); Running; Stopped
– Locked state: Unknown (not connected); Locked; Unlocked
Running State
Icon
(running)
Locked State
Icon
(unlocked)
nt
s.
Connection
State Icon
(connected)
nanoLC status icons
ne
Figure 4-3
4.1.1
Using the Main Toolbar
3
4
5
6
7
9
0
!
"
§
$
%
&
Main toolbar
lin
e
Figure 4-4
8
m
2
co
1
po
The Main toolbar (see Figure 4-4) is visible by default. To toggle the toolbar on and off,
select the “View... Main Toolbar” menu.
on
From left to right, the buttons in the toolbar are:
1. Save Project: Performs the same function as the “File... Save Project” menu.
2. Open Project: Performs the same function as the “File... Open Project” menu (see
“Open Existing Project” on page 2-6).
The Cut, Copy and Paste buttons do not function in the Ladder Chart Editor. They appear
because it is a common toolbar with the Flow Chart Editor and future functionality is
planned for these buttons.
3.
4.
5.
6.
7.
8.
9.
2373_en_E
Cut: Performs the same function as the “Edit... Cut” menu.
Copy: Performs the same function as the “Edit... Copy” menu.
Paste: Performs the same function as the “Edit... Paste” menu.
UnDo: Performs the same function as the “Edit... UnDo” menu (see “UnDo and ReDo”
on page 4-12).
ReDo: Performs the same function as the “Edit... ReDo” menu (see “UnDo and ReDo”
on page 4-12).
Chart Explorer: Opens the Chart Explorer (see “Chart Explorer” on page 4-7).
Edit Data Items: Opens the Data Item Editor (see “Using the Data Item Editor” on
page 5-3).
PHOENIX CONTACT
4-5
nanoNavigator
Grid and Cell Address
ne
4.1.2
nt
s.
co
m
10. Edit Messages: Opens the Message Editor (see “Using the Message Editor” on
page 4-28).
11. Start Monitoring/Stop Monitoring: Toggles depending on whether or not nanoNavigator
is currently monitoring the connected nanoLC. Performs the same function as the
“nanoLC... Start Monitoring” menu and the “nanoLC... Stop Monitoring” menu (see
“nanoLC Monitor Window” on page 7-4).
12. Run: Starts the current project running on the nanoLC. Performs the same function as
the “nanoLC... Run” menu (see “Running a Project” on page 6-7).
13. Stop: Stops the current project on the nanoLC. Performs the same function as the
“nanoLC... Stop” (see “Stopping a Running Project” on page 6-7).
14. Download & Go: Downloads the project currently open in nanoNavigator to the
nanoLC. This single click saves, verifies, and then downloads the project to the
nanoLC. It then runs the project on the nanoLC. Performs the same function as
“nanoLC... Download & Go” menu (see “Downloading a Project” on page 6-5).
15. Simulator: Starts simulation of the project (see “Connecting to the Simulator” on
page 8-39).
16. Zoom Buttons: Combo Box, Zoom In and Zoom Out (see “Zooming In or Out” on
page 4-7.)
m
po
The Ladder Chart Editor uses a fixed grid of five columns (labeled “A” to “E”) by any number
of rows (numbered “1” to n) for placement of coils and contacts. The grid defines cells that
are labeled by column letter and row number. For example, cell “A0” is the cell in the upperleft location of the chart. By default, the grid lines are visible in charts. Whether the grid lines
are visible or not, cell references are by their cell address.
co
Columns A through D only accept contacts. Column E only accepts coils.
Turning the Grid On and Off
on
lin
e
To turn the page grid on or off, follow these steps:
1. Select the “File... Preferences...” menu to display the “Preferences” dialog box.
2. Click the “Designer Options” tab.
3. Click the “Show Grid Lines” check box to turn the grid line on or off, respectively.
4. Click the “OK” button, and then answer any message dialog boxes that appear.
4-6
PHOENIX CONTACT
2373_en_E
Ladder Chart Programming
4.1.3
m
4.2
Chart Explorer
s.
Zoom drop-down
list
The full design of a chart may be large and any page may be larger than the viewable Ladder
Chart Editor window. The following techniques show more of the page by setting the zoom
factor:
– Select the desired zoom percentage from the “View... Zoom Factor...” menu.
– Click the “Zoom In” or “Zoom Out” tools in the Main toolbar.
– Hold the <Ctrl> key and spin the middle mouse wheel (up to zoom in and down to zoom
out).
– Hold the <Ctrl> key and press the keyboard minus key to zoom out or the plus key to
zoom in.
– Use the “Zoom” drop-down list in the Main toolbar.
co
Zoom Out (left)
and In (right)
toolbar buttons
Zooming In or Out
ne
nt
A project can have a total of 16 charts, in any combination of ladder and flow, with a total of
approximately 500 blocks. Use multiple charts for all but the simplest projects with each
chart controlling a single process, machine, or major function. A modular approach to
developing chart programs makes it easier to create, verify, and maintain control projects.
po
Use the Verify Project (see page 7-4) to ensure the project is properly configured and does
not exceed the capability of the hardware.
on
lin
e
co
m
Once downloaded to a nanoLC, all enabled charts (flow or ladder) execute in the order they
appear in the Chart Explorer. The project can programmatically control which charts
execute during any given scan cycle. For more information on enabling charts, see “Enable
Block” on page 4-14.
Figure 4-5
2373_en_E
Chart Explorer
PHOENIX CONTACT
4-7
nanoNavigator
To open the Chart Explorer and display a list of the charts (flow and ladder) in the project:
– Click the “Chart Explorer” button on the Main toolbar.
– Select the “View... Chart Explorer” menu.
Chart
Explorer
Button
An icon indicates the type of chart. Using the Chart Explorer automatically selects the
correct chart editor (flow or ladder).
Flow charts cannot be opened using the Ladder Chart Editor and ladder charts cannot be
opened using the Flow Chart Editor.
Ladder charts appear in a Ladder Chart Editor window. If the project consists of only one
chart, nanoNavigator always displays it when the program starts.
co
m
If there are multiple charts in a project, nanoNavigator displays the last chart that was open
when the project starts. If no chart window was open the last time the project closed,
nanoNavigator displays the Chart Explorer to allow selection of a chart.
– Click the “Exit” button to close the Chart Explorer.
Opening a Ladder Chart
ne
4.2.1
nt
s.
Alternatively, select the “File… New Chart” and choose either a flow or ladder chart from the
list. To open an existing chart select the “File…Open Chart…” menu and click the desired
chart from the list.
po
To open a ladder chart for editing from the Chart Explorer, double-click the chart in the list
or click the chart name to select it, and then click the “Open” button.
Creating a New Ladder Chart
co
4.2.2
m
Alternatively, the ladder chart can be selected from the “File... Open Chart...” menu.
lin
e
To create a new chart from the Chart Explorer, click the “New” button. The new chart will be
the same type of chart as last viewed, either ladder or flow. To create a new chart of a
different type, click the “New” button drop-down list on and click desired chart type.
on
Alternatively, select the “File… New Chart” and choose either a flow or ladder chart from the
list.
4-8
PHOENIX CONTACT
4.2.3
Renaming a Ladder Chart
To rename a ladder chart use the Chart Explorer.
1. Click the chart to highlight it, and then click the “Rename” button. Alternatively, rightclick the desired chart, and then click “Rename” from the pop-up menu.
2. In the “Rename Chart” dialog box that appears, type the new name. Chart names are
limited to 12 characters.
3. Click the “OK” button.
2373_en_E
Ladder Chart Programming
4.2.4
Copying a Ladder Chart
To copy a chart from the Chart Explorer, follow these steps:
1. Click the chart to highlight it, and then click the “Copy” button. Alternatively, right-click
the desired chart, and then click “Copy” from the pop-up menu.
2. In the “Chart Name” dialog box that appears, leave the default new name or type the
new name.
3. Click the “OK” button.
Changing Execution Order
co
4.2.5
m
Alternatively, from the Ladder Chart Editor, select the “File... Save Ladder Chart As” menu
to save the chart with a new name and include it in the project. The old chart remains open
and in the project.
nt
s.
The Chart Explorer provides the capability to rearrange chart execution order. To change
chart execution order, do the following:
1. From the Chart Explorer, click the name of the desired chart to move.
2. Use the “Up” and “Down” buttons at the bottom of the window to reposition the
highlighted chart.
Import Charts
m
4.2.6
po
ne
Charts will execute in the order they are arranged. It doesn’t matter if it is a flow chart or
ladder chart.
on
lin
e
co
To import charts from another project, use the Chart Explorer.
1. Click the “Import” button to display the “Import Logic Chart” dialog box.
Figure 4-6
2373_en_E
The “Import Logic Chart” dialog box
PHOENIX CONTACT
4-9
nanoNavigator
2.
Select one or more charts in the list using any of the following techniques:
– Click on a chart.
– Use standard Windows multiple selection techniques to select multiple charts.
– Use the “Select All” button to select all charts in the project, and use the “Clear All”
button to start over.
Click the “Add” button to add the selected charts to the current project.
Click the “Exit” button to close the “Import Logic Charts” dialog box.
lin
e
4.
The “Import Logic Charts” dialog box with a project selected
co
Figure 4-7
m
po
ne
nt
s.
co
m
3.
Specify the source project by either typing the full path in the “Source Project Path” field
or by clicking the “…” (browse) button.
Use the browse dialog box to navigate to the project directory and locate the source
project (*.Nano” extension) that contains the charts to import. Once selected, the
source project name appears in the “Import Logic Charts” dialog box and all charts in
the project appear in the list.
on
5.
6.
4.2.7
Deleting a Ladder Chart
To delete a ladder chart, use the Chart Explorer.
1. Click the chart to highlight it, and then click the “Delete” button or press the <Delete>
key. Alternatively, right-click the desired chart, and then click “Delete” from the pop-up
menu.
2. Click the “Yes” button in the confirmation box to delete the file or click the “No” button
to cancel.
The only way to undo deletion of a chart is by closing the project without saving changes.
This abandons all changes that were made to the project since the last save.
4-10
PHOENIX CONTACT
2373_en_E
Ladder Chart Programming
4.3
Displaying Multiple Charts
By default, when opening a chart, nanoNavigator maximizes it in the workspace. Switch to
other open charts using either the list in the “Window” menu, or by pressing the <Ctrl>+<F6>
or <Ctrl>+<Tab> (<Ctrl>+<Shift>+<F6> or <Ctrl>+<Shift>+<Tab> to reverse the order)
keys. nanoNavigator also permits maximizing, minimizing, or closing any chart window by
using the Window controls in the upper-right corner.
nanoNavigator allows multiple charts to be open simultaneously. This is very useful for
copying ladder chart logic from one ladder chart to another.
NOTE:
on
lin
e
co
m
po
ne
nt
s.
co
m
Different chart types can be opened simultaneously. However, it is not possible to copy
content between different chart types. Only content from a flow chart can be copied into
a flow chart and only content from a ladder chart can be copied into a ladder chart.
Figure 4-8
2373_en_E
Vertically tiled ladder chart windows
PHOENIX CONTACT
4-11
nanoNavigator
To display more than one chart at a time:
– Select the “Window…Cascade” menu to show all open charts one behind the other,
slightly offset.
– Select the “Window…Tile Vertically” menu to display all open charts in a vertical
arrangement as shown in Figure 4-8.
– Select the “Window…Tile Horizontal” menu to display all open charts in a horizontal
arrangement.
Editing Ladder Charts
co
4.4
m
Charts that are minimized are not displayed using the “Window…” commands.
4.4.1
nt
s.
nanoNavigator provides intuitive Windows-style editing capability to move or cut and paste
contacts and coils from one grid location to another. Many functions are available with a
mouse right-click, or use Main toolbar buttons as described.
Saving Ladder Charts
po
ne
Select the “File... Save Ladder Chart” menu to save the current ladder chart using the
current name (the default is “Ladderchart” followed by a number). Attempting to close a
ladder chart after modifying it displays a “Changes Made” dialog box. Click the “Yes” button
to save the changes, click the “No” button to close the ladder chart without saving it, or click
the “Cancel” button to return to the ladder chart.
lin
e
co
m
To save a copy of the current ladder chart, select the “File... Save Ladder Chart As” menu.
This menu selection displays the “Rename Chart” dialog box with a new default name.
Either accept the name or type a new name, and then click the “OK” button. This creates a
copy of the chart with any modifications and leaves the original chart in the project in the
state it was in the last time it was saved.
on
4.4.2
UnDo and ReDo
nanoNavigator supports an unlimited number of UnDo and ReDo operations. UnDo (or
ReDo) operations are performed one at a time in the order they were originally performed.
UnDo cancels the last edit operation (for example, deleting a contact from a ladder chart),
and restores the chart to its state before the previous operation. After performing an UnDo,
a ReDo can be performed. ReDo cancels the previous UnDo operation and restores the
chart to its state prior to the UnDo.
nanoNavigator stores UnDo and ReDo operations in separate stacks for each chart. The
UnDo stack is cleared (UnDo operations are no longer valid) when:
– a chart is saved
– the project is saved
– a nanoLC is connected
– the project is verified
4-12
PHOENIX CONTACT
2373_en_E
Ladder Chart Programming
The ReDo stack is cleared (ReDo operations are no longer valid) when any edit on the chart
is performed other than an UnDo.
Figure 4-9
“Undo” and “Redo” buttons
Ladder Chart Contacts and Coils
s.
4.5
co
m
To perform an UnDo or ReDo operation, do one of the following:
– click the “UnDo” or “ReDo” button on the Main toolbar.
– select the “Edit... UnDo” or “Edit... ReDo” menu.
– press the <Cntrl>+<Z> keys to UnDo or the <Cntrl>+<Shift>+<Z> keys to ReDo.
nt
This section describes the various ladder chart coils and contacts, how to place them and
create a ladder chart.
on
lin
e
co
m
po
ne
To place a new ladder chart element on the page, follow these steps:
1. In the Toolbar, click the button of the desired contact or coil to place.
2. Click in the desired location (cell) on the drawing page.
2373_en_E
PHOENIX CONTACT
4-13
nanoNavigator
4.5.1
Enable Block
m
po
ne
nt
s.
co
m
Every new ladder chart is created with an Enable block in cell A0. This symbolizes the power
source (battery) for the ladder chart and the starting point of the chart. The Enable block is
connected to the line on the left side of the chart. This line, or bus, typically represents
power. The logic of the chart passes from the left side to the right side, just as power passes
from positive to negative. The “return” connection to the Enable block (battery) is not shown.
Enable block
co
Figure 4-10
on
lin
e
The Enable block cannot be deleted, copied or moved on the drawing area. It can be
configured in the following ways:
– An empty Enable block (no expression created) causes the ladder chart to always run.
– The Enable block is color-coded when running the Simulator or monitoring a connected
nanoLine controller. If the block is green, the chart is active. If it’s red, the ladder chart
is inactive (another chart is active). If it’s gray, the project is not running.
4-14
PHOENIX CONTACT
2373_en_E
Ladder Chart Programming
The “Enable Block” dialog box
ne
Figure 4-11
nt
s.
co
m
Expressions can be added to the Enable block to set conditions for running the chart. To
add statements to the expression using logical operators, double-click the element. The
result of the expression is either true or false, enabling or disabling the chart.
lin
e
co
m
po
The AND and OR “Operator” in the dialog box permits addition of a second Boolean
condition to the expression. AND has greater precedence than OR (in other words AND
expressions are evaluated before OR expressions, and then they are evaluated from topdown). nanoLC supports one or two Boolean conditions in an Enable block.
– nanoLC evaluates the Enable element every scan at the time when the chart executes
based on the position of the chart in the chart list (see “Changing Execution Order” on
page 4-9). The chart only runs if its expression is true at the start of the scan.
– On the first scan or whenever the Enable element expression transitions from FALSE
to TRUE, chart execution starts at the Enable element. Otherwise, execution starts
where it left off the previous scan.
on
Table 4-1 defines all possible Enable element combinations. This table shows valid data
item types and the conditions that appear in the “Condition” drop-down list. For example, it
is possible to test to see if an Input is “ON” or “OFF”.
Table 4-1
Data Item Type
ON
OFF
Input
X
X
Output
X
X
Flag
X
X
1
2373_en_E
Valid Enable Element Expression1
X=valid
PHOENIX CONTACT
4-15
nanoNavigator
4.5.2
Rungs
Ladder charts rely on rungs crossing from one bus to the other. A rung is populated with
elements, contacts (inputs) and coils (outputs), to create an instruction. The arrangement of
the elements can be as parallel or series, normally open or normally closed. The nanoLC
processes a ladder chart from left to right and top to bottom with each rung essentially being
a separate instruction. As each rung is evaluated, instructions are completed based on the
logic of the ladder chart.
New ladder chart with first rung showing default contact and coil
m
Figure 4-12
po
ne
nt
s.
co
m
When a new ladder chart is created, the first rung is automatically created and includes a
contact in cell A1 and a coil in cell E1.
co
Additional rungs may be added to the chart. Every new rung includes one Contact in
column A and one Coil in column E. New rungs may be added anywhere on the chart but
they must be contiguous.
on
lin
e
To add a new rung:
1. Click the “Rung” button in the Toolbar.
2. Click in the desired location on the grid.
– Clicking anywhere below the existing rungs will insert a row at the bottom of the
ladder chart.
– Clicking on a row will insert the new rung on that row and move the existing row(s)
down. For instance, if rungs exist in rows 1 through 4, clicking on row 3 will move
the rung in row 3 to row 4, and the rung in row 4 to row 5. The new rung is in row 3.
A second method to add rungs is available. Right-click on the row label and click “Insert
Rung” on the menu.
To delete a rung, right-click on the row header and click “Delete Rung” on the menu.
Empty rows can also be added to the grid. Right-click on the row header and then click
either “Insert Row Before” or Insert Row After” on the menu.
It is not possible to add parallel branches to an existing rung if another rung is directly
below it. A blank row must be added first.
4-16
PHOENIX CONTACT
2373_en_E
Ladder Chart Programming
The various types of contacts and coils can be added to a rung. To place elements on a
page:
1. In the Toolbar, click the button of the desired element.
2. Click in the desired location on an existing rung.
Contacts can be placed in columns A through D and coils can be placed in column E.
To remove an element from a rung:
1. In the Element toolbar, click the “Horz” button.
2. Click the desired element to remove.
Horz
Button
Decision Contact
co
4.5.3
m
A rung must contain a contact in column A and a coil in column E. It is not possible to delete
these elements from a rung.
s.
A Decision Contact is an element in a rung that makes or breaks a circuit, or rung. The
Decision Contact may be external, such as a switch connected to a physical input or keypad
key from the Operator Panel, or internal, such as a flag, timer or output. A Decision Contact
is configured to a default position (either normally closed or normally open). By combining
various Decision Contacts in series and parallel arrangements in a rung, the logic of the rung
becomes either True or False, causing the coil in column E to be either True or False.
ne
nt
Contact
Button
on
lin
e
co
m
po
Decision Contact elements can be placed in either parallel or series arrangements on a
rung. After clicking the “Decision Contact” button on the Toolbar, the pointer changes as it
hovers over different cells to indicate how the element will be connected to the rung.
Figure 4-13
2373_en_E
Placing Decision Contacts in different arrangements
PHOENIX CONTACT
4-17
nanoNavigator
m
Figure 4-13 shows the cursor in different positions in the Ladder Chart Editor.
– In cell D1, the cursor indicates the contact will be inserted in series.
– In cell A3, the cursor indicates the contact will be inserted in parallel with the Decision
Contact in cell A2.
– In cell C2, the cursor indicates the contact will be inserted in parallel with the Decision
Contact in cell C1.
– Cell B2 is diagonally “divided” into two halves.
– If the mouse is clicked when the cursor is in the lower left, the Decision Contact will
be in series with the relay in cell A2. Both elements row 2 will be in parallel with the
elements in cells A1 and A2.
– If the mouse is clicked when the cursor is in the upper right, the Decision Contact
will be in parallel with the element in cell B2 (and not in series with the element in
cell A2).
m
po
ne
nt
s.
co
To configure a Decision Contact, double-click the Decision Contact in the workspace. This
displays the “Decision Contact” dialog box. The Decision Contact is configured by selecting
the data type, data item and what the condition of the data item should be to make it true.
The configuration options for the different data item types are shown in Table 4-2.
“Decision Contact” dialog box
co
Figure 4-14
on
lin
e
If all the conditions are met, the expression is considered true. If the conditions in the
expression are not met, the expression is considered false.
Figure 4-15
4-18
PHOENIX CONTACT
Decision Contact symbols
2373_en_E
Ladder Chart Programming
When the “Decision Contact” dialog box is closed, the symbol changes to represent the
default condition of the element. If the default condition is ON, the symbol appears as
normally open contacts. If the configured condition is OFF, the symbol appears as normally
closed contacts. With Timer/Counter data types using the mSec or HMS mode, the
“Condition” field allows selection of Done and Running, indicated by normally open
contacts, or Not Done and Not Running, indicated by normally closed contacts (Counters
are limited to Done and Not Done conditions).
If selecting an unconfigured Timer/Counter, a dialog box opens with a drop-down list that
permits configuration of the Timer/Counter as a “Counter”, “Duration (HMS)”, or Duration
(x.xxx Sec.)”.
m
In addition to the symbol representing the condition, the default condition is written below
the symbol. The Data Item Type and ID monitored in the cell is displayed.
co
Decision Contact Summary
Table 4-2 defines all possible Decision Contact combinations.
Valid Comparisons in a Decision Contact1
s.
Table 4-2
X
X
X
X
X
po
ne
X
m
co
lin
e
on
4.5.4
Compare
Contact
Button
X
X
X
X
X
X
X
X
X
X
X
mSec
X
X
Counts
X
X
HS Counter
1
Disabled
Timer/Counter HMS
Enabled
Not Running
Key pad entry
Not Done
Running
X
HS Counter
Done
Not Done
Flag
Done
Input
Output
Off
Mode
On
Data Item
Type
Timer/
Counter
nt
Bits
X=valid
Compare Contact
A Compare Contact compares two numerical data items. The types of comparisons
available are less than (<), equal to (=), greater than (>), greater than or equal to (>=), less
than or equal to (<=), and IsEven (checks for an even number). There are also special direct
time and date comparison operations for date, time, day of week, day of month, and day of
year. An expression is created and the program evaluates the two data items based on the
comparison operator.
Compare Contact elements can be placed in either parallel or series arrangements on a
rung. After clicking the “Compare” button on the Toolbar, the pointer changes as it hovers
over different cells to indicate how the element will be connected to the rung. This function
works using the same method as the Decision Contacts (See Figure 4-15).
2373_en_E
PHOENIX CONTACT
4-19
nanoNavigator
“Ladder Compare Contact” dialog box
m
Figure 4-16
po
ne
nt
s.
co
m
To configure a Compare Contact, double-click the Compare Contact in the workspace. This
displays the “Compare Contact” dialog box. The expression is created by selecting the data
type and specific data item for the First Item, the Comparison Operator, and the data type
and specific data item of the Second Item. When the comparison is evaluated, the Compare
Contact becomes logically true if the expression is true. The Compare Contact becomes
logically false if the expression is not true.
co
When using a constant in the expression, the variable operand must be the First Item and
the constant must be the Second Item.
on
lin
e
Both Registers and Timer/Counters have subtypes. The default subtype of both is
“Unconfigured.” If selecting an unconfigured type for the first operand, nanoNavigator
prompts for selection of the type. The subtype of the second operand must match the
subtype of the first operand. The drop-down list only shows operands with matching or
unconfigured subtypes. If selecting an unconfigured item, nanoNavigator permits changing
the subtype to match the type of the first operand.
4-20
PHOENIX CONTACT
When comparing “Current Date” or “Current Time” or a register with a subtype of “Date”
or “Time of Day”, choose which components of the date or time to include in the
comparison. For instance, to perform a date compare between the day and month, ignore
the year. Likewise, to perform a time compare between minutes, ignore the hours and
seconds.
2373_en_E
Compare Contact symbols
po
Figure 4-17
ne
nt
s.
co
m
Ladder Chart Programming
co
m
With Timer/Counter data types using the mSec or HMS mode, the “Condition” field allows
selection of Done and Running, indicated as a normally open contact, or Not Done and Not
Running, indicated as a normally closed contact (Counters are limited to Done and Not
Done conditions).
on
lin
e
If selecting an unconfigured Timer/Counter, a dialog box opens with a drop-down list that
permits configuration of the Timer/Counter as a “Counter”, “Duration (HMS)”, or Duration
(x.xxx Sec.)”.
2373_en_E
When the “Compare Contact” dialog box is closed, the symbol changes to show the two
items being compared, one above the symbol, the other below. If one of the items is a Data
Item, the Type and ID are displayed. If the item is a constant, the constant is displayed. The
operator used to compare the two items is displayed within the symbol.
PHOENIX CONTACT
4-21
nanoNavigator
Compare Contact Summary
Table 4-3 defines all possible Compare Contact combinations.
Valid Comparisons in a Compare Contact1
Data Item Type
X
s.
m
X
xxxx.xxx
X
xxxxxxxx
X
X
xxxxxxxx
X
xxxxxxxx
X
X
dd/mm/yy
X
co
lin
e
hh:mm:ss
X
hh:mm:ss
X
X
Sun-Sat
X
X
hh:mm:ss
X
X
X
Day of Week
xxxxxxxx
xxxxxxxx
X
Current Time
X
X
mSec
xxxx.xxx
X
X
HMS
Current Date
hh:mm:ss
X
X
X
m
Date
Sun-Sat
X
nt
X
po
HS Counter
ne
X
X
IsEven
mSec
Analog Out
mSec
X
X
HMS
X
xxxxxxxx
hh:mm:ss
X
X
Analog In
DoW
X
X
HMS
DoW
Time
X
Counts X
Time
Date
X
mSec
Display
Format
dd/mm/yy
X
HMS
Integer
X
X
DoW
Message Input
Integer
X
X
Time
Timer/Counter
mSec
X
Date
HMS
Integer
DoW
Integer
Register
Time
Subtype
Date
Data Item Type
Constant Value
co
Table 4-3
dd/mm/yy
X
X
xxxx.xxx
hh:mm:ss
X
Sun-Sat
X
X
xx
Day of Year
X
X
xxx
on
Day of Month
Notes:
DoW is Day of the Week
1
4-22
X=valid
PHOENIX CONTACT
2373_en_E
Ladder Chart Programming
4.5.5
Coil Button
Control Coil
A Control Coil represents the logical result of a rung. As the elements on a rung are
evaluated, a Control Coil defines the result, or action. If all the elements in the rung are
determined to be True, the Control Coil becomes True and causes an action. If any of the
elements on the rung are False, the Control Coil becomes False and the action does not
occur. A maximum of four Control Coils can be placed in parallel in a single rung. They are
always located in column E at the end of a rung.
“Control Coil” dialog box
nt
Figure 4-18
s.
co
m
A Control Coil may be a physical output, such as a lamp, or an internal output, such as a flag
or timer/counter that is used elsewhere in the chart.
m
po
ne
To configure a Control Coil, double-click the Control Coil in the workspace. This displays the
“Control Coil” dialog box. The Control Coil is configured by selecting the data type, data item
and what the resulting action of the data item should be. When all the previous elements in
the rung are met, the Rung is considered True and the condition is set as specified in the
“Action” field. If the conditions in the expression are not met, the expression is considered
False and the action is not performed.
on
lin
e
co
The On and Off Actions are momentary and will remain in those conditions as long as the
contact logic before it remains true or false. The Set Action latches the coil until elsewhere
in the program a Reset is issued or an Off Action is issued.
Figure 4-19
2373_en_E
Control Coil symbols
PHOENIX CONTACT
4-23
nanoNavigator
When the “Control Coil” dialog box is closed, the symbol changes to represent the desired
action of the element. If the configured condition is On, Set or Reset, the symbol appears as
normally open. If the configured condition is Off, the symbol appears as normally closed. All
Timer/Counter data types appear as normally open.
If selecting an unconfigured Timer/Counter, a dialog box opens with a drop-down list that
permits configuration of the Timer/Counter as a “Counter”, “Duration (HMS)”, or Duration
(x.xxx Sec.)”.
In addition to the symbol representing the desired action, the desired action is written below
the symbol and the Data Item Type and ID being changed is written above the symbol.
m
Control Coil Summary
Table 4-2 defines all possible Control Coil combinations.
co
Valid Comparisons in a Control Coil1
Table 4-4
Timer/
Counter
nt
ne
X
X
X
po
X
Timer/Counter HMS
mSec
m
Counts
X
X
X
X
X
X
X
X
Reset
X
Decrease
X
Increase
X
Reset
X
Stop
X
Start
Flash
Flag
X
Restart
Pulse
Reset
Set
Output
X
X
X
X=valid
on
lin
e
co
1
Off
Mode
On
Data Item
Type
s.
Bits
4-24
PHOENIX CONTACT
2373_en_E
Ladder Chart Programming
4.5.6
When configured with the optional Operator Panel, the nanoLC can display messages to
the user. Message Coils can contain static text, dynamic values from any data item, and
data entry requests. To configure a Message Coil, double-click the Message Coil in the
workspace. This displays the Configuration page of the “Message Coil” dialog box.
m
po
ne
nt
s.
co
m
Message Coil
Button
Message Coil
“Message Coil” dialog box
co
Figure 4-20
lin
e
The “Message #” drop-down list allows selection of a message number (from 0 to 31). The
Message Editor permits entry or modification of the message associated with that message
number (see “Using the Message Editor” on page 4-28).
on
Only configured messages appear in the “Message #” drop-down list. They must be
“created” in the Message Editor before they appear in the list.
Figure 4-21
Message Coil symbol
When the Message is selected and the “Message Coil” dialog box closed, the Message Box
symbol appears. In addition to the symbol, the Data Item Type and ID is written above the
symbol and the text Display Msg below the symbol.
2373_en_E
PHOENIX CONTACT
4-25
nanoNavigator
Obtaining User Input
As defined in “Inserting Data Entry Items” on page 4-29, messages can include data
variables that prompt for user input. As the operator enters data through the keypad on the
Operator Panel, the Operator Panel processor validates the input data according to the data
type specified. Once the operator completes data entry and presses the “OK” key, the
Operator Panel passes the input to the chart and sets the “Message Input Ready” key for
one scan cycle.
Charts that require operator input must continue to look for the “Message Input Ready” key
or some overriding condition that would inhibit data from being entered on every scan after
sending the message requesting input.
on
lin
e
co
m
po
ne
nt
s.
co
m
With a Ladder Chart, a latch mechanism should be incorporated to prevent the logic from
requesting data entry each scan. Figure provides a typical example of a rung incorporating
a Message coil that is logically true for a single scan.
4-26
PHOENIX CONTACT
Figure 4-22
Message coil latching logic example
In the example, once Msg-0 is displayed, F-003 is set to make rung 1 logically false. Once
the user presses the <OK> key on the nanoLC, F-003 is reset, allowing the message to
display again, provided the remainder of the project logic is true.
2373_en_E
Ladder Chart Programming
4.5.7
Move Coil
The Move Coil transfers data from one location to another. Doing a move from one data item
to another moves (copies) the data of the first data item into the second data item. The value
of the first data item is preserved.
The “Move Coil” dialog box defines the “From” and “To” data fields. After selecting the “Data
Type”, the “Data Item” drop-down list displays only those data items for the type selected.
co
m
po
ne
nt
s.
co
m
Move Coil
Button
“Move Coil” dialog box
lin
e
Figure 4-23
on
The Move Coil symbol is displayed as a rectangle with an arrow with the Data Item Type and
ID being moved displayed above the symbol and the location it is being moved to displayed
below the symbol.
Figure 4-24
Move Coil symbol
For more information on how the Move Coil performs powerful data manipulations, refer to
“Using the Move Function” on page 5-13.
2373_en_E
PHOENIX CONTACT
4-27
nanoNavigator
4.6
Using the Message Editor
on
lin
e
co
m
po
ne
nt
s.
co
m
The Message Editor permits definition of up to 32 four-line messages to use during project
execution. Each line can have up to 20 characters, and lines can contain any combination
of static text, data item output, and user-requested input.
Figure 4-25
4.6.1
Edit
Messages
Button
4-28
PHOENIX CONTACT
Use the Message Editor to define and edit messages in a project
Displaying the Message Editor
Click the “Edit Messages” button in the Main toolbar, or select the “View... Message Editor”
menu to display the Message Editor in the nanoNavigator workspace. Once open, the
Message Editor is like any other window. Display the Message Editor by selecting it from the
“Windows” menu, selecting it again from the “View” menu, or pressing <Ctrl>+<F6> or
<Ctrl>+<Shift>+<F6> until it appears on top. When using “Windows... Cascade” or one of
the “Tile” options with the Message Editor open, the Message Editor appears along with all
open charts.
2373_en_E
Ladder Chart Programming
4.6.2
Creating and Editing Messages
To create or edit a message, follow these steps:
1. Select the “View... Message Editor” menu or click the “Edit Messages” button on the
Main toolbar to display the Message Editor.
2. Select the message to create or edit from the “Current Message” drop-down list. This
displays the current message in the four lines of the “Message” group at the top of the
window.
3. Enter any static text, data display items, data entry items, and/or symbols in the fields.
m
The nanoLC does not clear any message cells that aren’t explicitly overwritten. To ensure
that an old message is cleared before writing a new one, leave the “Clear Line” check box
selected (selected by default) for the line(s) to clear prior to displaying new text.
s.
Click the “Save” button to save the message.
Click the “Close” button to close the Message Editor.
Inserting Data Display Items
nt
4.
5.
co
The symbols that appear in the “Insert Symbols” list correspond to special keys that are
available on the nanoLC.
po
ne
To display a data item, use the “Insert Data Display Item” group as follows:
1. Select a cell of the message.
2. Select the data item “Type” from the drop-down list.
3. Select the data item from the “Data Item” drop-down list.
4. Click the “Insert” button to insert the data display item in the message.
m
Inserting Data Entry Items
on
lin
e
co
To have the user enter a data item, use the “Insert Data Entry Item” group as follows:
1. Select a cell of the message.
2. Select the data item “Return Type” from the drop-down list.
3. Select the data item from the “Data Item” drop-down list.
4. Click the “Insert” button to insert the data entry item in the message.
4.6.3
Copying Messages
To copy a message, follow these steps:
1. Select the “View... Message Editor” menu or click the “Edit Messages” button on the
Main toolbar to display the Message Editor.
2. Select the message to copy from the “Current Message” drop-down list. This displays
the current message in the four lines of the “Message” group at the top of the window.
3. Click the “Copy...” button. This displays the “Copy Message” dialog box.
4. Enter a message number in the “Message #” field or use the up/down buttons to select
a message number. The number entered is the destination for the copy operation.
An asterisk (*) in the number field indicates the message has been configured previously.
2373_en_E
PHOENIX CONTACT
4-29
nanoNavigator
5.
Click the “OK” button. The copy operation executes immediately unless the destination
message already has text or fields. In that case, a warning message appears before the
operation completes.
4.6.4
Clearing Messages
on
lin
e
co
m
po
ne
nt
s.
co
m
To clear a message, follow these steps:
1. Select the “View... Message Editor” menu or click the “Edit Messages” button on the
Main toolbar to display the Message Editor.
2. Select the message to clear from the “Current Message” drop-down list. This displays
the current message in the four lines of the “Message” group at the top of the window.
3. Click the “Clear” button. This displays a confirmation dialog box.
4. Click the “Yes” button to clear the message.
4-30
PHOENIX CONTACT
2373_en_E
Section 5
This section provides information about:
– Data items
– Timers and counters
– Move blocks
– Analog values
Data Operations ...............................................................................................................................5-3
Using the Data Item Editor.................................................................................. 5-3
5.1.1
Displaying the Data Item Editor............................................................ 5-3
5.1.2
Data Item Editor ................................................................................... 5-4
5.1.3
Data Item Types................................................................................... 5-5
5.1.4
Editing Data Item Grid Entries.............................................................. 5-6
5.1.5
Using Cross-Reference ....................................................................... 5-6
5.2
Data Type Descriptions ...................................................................................... 5-7
5.2.1
Duration, Preset, and Retentive Values ............................................... 5-8
5.2.2
Outputs and Flags in Coils ................................................................... 5-9
5.3
Data Types and Formats .................................................................................. 5-10
5.3.1
Current Date, Day, and Time ............................................................. 5-11
5.4
Using Timers and Counters .............................................................................. 5-11
5.4.1
Timer Items........................................................................................ 5-11
5.4.2
Using Counters .................................................................................. 5-12
5.5
Using the Move Function .................................................................................. 5-13
5.5.1
The Move Expression ........................................................................ 5-13
5.5.2
Moving Between Same Data Types................................................... 5-14
5.5.3
Moving Between Different Data Types............................................... 5-14
5.5.4
Move Summary.................................................................................. 5-15
lin
e
co
m
po
ne
nt
s.
co
m
5.1
Handling Analog Values ................................................................................... 5-16
5.7
Using Analog Values ........................................................................................ 5-17
on
5.6
2373_en_E
PHOENIX CONTACT
5-1
on
lin
e
co
m
po
ne
nt
s.
co
m
nanoNavigator
5-2
PHOENIX CONTACT
2373_en_E
Data Operations
5
Data Operations
This chapter discusses how to use variables and constants in nanoNavigator. It begins with
an overview of the available data item types and includes details on available data
operations.
5.1
Using the Data Item Editor
po
To display the Data Item Editor in the nanoNavigator workspace, click the “Edit Data Items”
button on the Main toolbar, or select the “View... Data Item Editor” menu. Once it is open,
the Data Item Editor is like any other window. Display the Data Item Editor by selecting it
from the “Windows” menu, selecting it again from the “View” menu, or pressing <Ctrl>+<F6>
or <Ctrl>+<Shift>+<F6> until it appears on top. With “Windows... Cascade” selected or one
of the “Tile” options with the Data Item Editor open, the Data Item Editor appears along with
all open charts.
on
lin
e
co
m
Edit
Data Items
Button
Displaying the Data Item Editor
ne
5.1.1
nt
s.
co
m
Data items are a central part of every project. They are the variables that contain project
data. Data items have IDs that correspond to the IDs on a nanoLC. In nanoNavigator, data
items also have names assigned as part of a project. The data item names assigned in
nanoNavigator do not download to the nanoLC with the project. However, whenever
nanoNavigator connects to a nanoLC, nanoNavigator uses the version of the project on the
PC to view and verify a running nanoLC project (see “Running Projects and Controlling the
nanoLC” on page 6-3). nanoNavigator contains the tools for viewing all parts of the project,
including the Data Item Editor.
2373_en_E
PHOENIX CONTACT
5-3
nanoNavigator
5.1.2
Data Item Editor
ne
nt
s.
co
m
The initial view of the Data Item Editor lists the data item types in nanoNavigator (see
Figure 5-1). Each data item type is preceded by a plus button. Click the “+” button to view
the defined data items of that type.
The Data Item Editor initially displays all available data types
po
Figure 5-1
on
lin
e
co
m
The Data Item Editor displays the defined data items of one or more types by clicking the
plus button in front of the type heading. If necessary, use the scroll bar to view the entire list
of data types and/or data items.
5-4
PHOENIX CONTACT
2373_en_E
Data Operations
on
lin
e
co
m
po
ne
nt
s.
co
m
In nanoNavigator, all data items are pre-defined based on the configuration of the nanoLC.
Figure 5-2
5.1.3
The Data Item Editor with an opened data type
Data Item Types
For a list of data item types available in nanoNavigator, see “Data Type Descriptions” on
page 5-7. These data item types appear as headings in the Data Item Editor. To view
available data items for each type, click the + (plus) button in front of the type heading (see
Figure 5-2).
2373_en_E
PHOENIX CONTACT
5-5
nanoNavigator
New projects have all available data items listed. Data items have an ID that corresponds to
their ID on the nanoLC, and they have a default name, which is modifiable. Data item names
can be up to 30 characters long. Long data item names are split when they appear in a chart.
The data item name does not get downloaded to the nanoLC.
When uploading a project from a nanoLC, nanoNavigator resets data item names to their
default names if the project isn’t available on the PC because data item names aren’t
stored on the nanoLC.
5.1.4
Editing Data Item Grid Entries
Using Cross-Reference
nt
5.1.5
s.
co
m
The Data Item grid permits modification of default data item names and, depending on the
data item type, permits entry of a description, indicates that a data item is retentive, and
specifies an initial value. For Timer/Counter and Register data items, specify the type, and
for Timer/Counters, specify the preset.
on
lin
e
co
m
po
ne
Each data item row in the Data Item Editor has an “XRef” link on the left side of the line.
When the link is clicked, nanoNavigator searches all charts and messages for references to
the data item, and then it displays the “Project Information... CrossReference” tab (see
Figure 5-3).
Figure 5-3
The “Project Information... CrossReference” tab
The rows of the “CrossReference” tab list all occurrences of the data item in the project. The
columns provide the following information:
– Type: Either “Flow Chart,” “Ladder Chart” or “Message”
– Name: The name of the chart or the message number
– Location: The type of chart element
5-6
PHOENIX CONTACT
2373_en_E
Data Operations
–
–
Address: The cell number of the element
Action: The action taken in the element on the data item
Double-click anywhere in a row to display the chart or message and the element containing
the data item.
5.2
Data Type Descriptions
There are ten data item types in nanoNavigator. Depending on the nanoLC configuration,
some data item types may not be present in the Data Item Editor.
m
Analog Input
s.
co
Present if available in the nanoLC. Use analog input to monitor voltages or values. The
Analog Input data item is a 16-bit number that is proportional to the actual voltage or current
present at the input pin. There are a maximum of 8 analog inputs. The number available
depends on the configuration of the nanoLC. For more information on analog inputs, see
“Handling Analog Values” on page 5-16.
nt
Analog Output
po
ne
Present if available in the nanoLC. Use analog outputs to set voltages or values. The Analog
Output data item is a 16-bit number that is proportional to the actual voltage or current
output. There are a maximum of 8 analog outputs. The number available depends on the
nanoLC configuration selected. For more information on analog outputs, see “Handling
Analog Values” on page 5-16.
m
Display Message
co
The Message data type provides support for the optional display on the nanoLC. There are
up to 32 messages with each message containing up to four lines of 20 characters.
Flag
on
lin
e
Flags are single-bit variables that have a value of either 0 or 1. These are for general use to
store a Boolean (TRUE/FALSE) variable. Although these are single-bit variables, they are
not associated with discrete I/O points. There are a total of 64 binary user-definable flags.
These flags are available for general project use. They can have an initial value (set=1) and
may be retentive. In addition, there are System Flags that provide Runtime status and
control (see Appendix B, “Technical Appendix – System Flags”).
Input
Digital inputs are either ON or OFF (0 or 1). There are a maximum of 32 digital inputs. The
number available depends on the nanoLC configuration selected.
High-Speed Counter
Present if available in the nanoLC and configured. There are a maximum of two high-speed
counters. If present, these may be enabled or disabled by project.
2373_en_E
PHOENIX CONTACT
5-7
nanoNavigator
Keypad Key
The Keypad Key data type provides single-bit (0-1) input that corresponds to the Operator
Panel keys on the nanoLC. One or TRUE values indicate that a key is being pressed. There
are a total of 15 keys (0-9, four arrow keys, an “OK”) that are available only if the optional
Operator Panel is present on the nanoLC. There is a sixteenth key data item for “Message
Input Ready”.
Output
An Output data item is a single-bit (0 or 1) for use with discrete output points for the I/O subsystem. A maximum of 32 output points are available.
m
Register
co
There are a total of 32 registers. Configurable as Unconfigured, Integer, Date, Time of Day,
Duration (HH:MM:SS or msec). Registers can have an initial value and may be retentive.
Timer/Counter
Duration, Preset, and Retentive Values
m
5.2.1
po
ne
nt
s.
The Counter data item is configured as a Timer/Counter with a “Counter” subtype. Counters
range in value from 0 to 99,999,999. Timer/Counter data items count upward once per
millisecond. The Timer/Counter value (accumulator) is accessible to charts. Timer data
items have a type that determines whether the timer value is seconds and milliseconds or
hours, minutes, and seconds. The range of a Seconds timer is 0.00 to 99,999.999. The
range of an HMS timer is 00:00:00 to 99:59:59. When a Timer/Counter reaches a “Preset”
value, the Timer/Counter sets a “Done” bit.
lin
e
co
Outputs can have a “Duration” measured in seconds (x.xxx) or hours, minutes, and seconds
(HH:MM:SS). Outputs that have a duration can be pulsed, flashed, or latched or set (see
“Outputs and Flags in Coils” on page 5-9). Outputs without a pre-defined “Duration” are
always latched, except in the case of a ladder chart where the output needs to be set to be
latched.
on
Timer/Counters can have a “Preset” that depends on the type (Counter, HH:MM:SS, or
Seconds). A preset specifies the ending (“Done”) value for the timer or counter. When reset,
the Timer/Counter accumulator goes to zero. When the accumulator reaches the “Preset”
value, the Timer/Counter sets the “Done” bit.
To configure a “Duration” or “Preset”:
1. Open the Data Item Editor (see “Using the Data Item Editor” on page 5-3).
2. For digital outputs, enter a value in the “Duration” column; or for Timer/Counters, enter
a value in the “Preset” column.
Outputs, Flags, Timer/Counters, and Registers can be retentive. The term retentive
indicates that nanoLC writes the value of the data item to flash memory whenever the
Runtime project closes or the nanoLC loses power. Retentive data items have initial values
equal to their previous value before shut-down.
5-8
PHOENIX CONTACT
2373_en_E
Data Operations
To configure a retentive data item:
1. Open the Data Item Editor (see “Using the Data Item Editor” on page 5-3).
2. Select the check box in the “Retentive” column for the appropriate data item rows. Only
data items that can be retentive have the “Retentive” column present in the Data Item
Editor.
When making a timer retentive, only its accumulator is retentive. The started/stopped and
done status aren’t saved. When a project starts or restarts, all timers and counters are
initially stopped.
Click the check box again to clear the retentive setting (toggles between retentive/nonretentive).
Outputs and Flags in Coils
co
5.2.2
m
3.
nt
s.
Outputs and flags can be turned On and Off using the logic within the chart. However,
because flow charts and ladder charts evaluate their structure differently, these data item
types have some differences. The following defines the “Actions” available in a coil for
outputs and flags.
Table 5-1
Output and Flag Actions
ne
Flow Chart
Output/flag is turned ON until a
TurnOff command is executed.
po
TurnOn
Not applicable
Not applicable
Output/flag is ON if the rung
logic is True. Otherwise, the
output/flag is OFF.
Not applicable
Output/flag is OFF if the rung
logic is True.Otherwise, the
output/flag is ON.
Set
Not applicable
Output/flag is turned ON until a
Reset is executed.
Reset
Not applicable
Output/flag is turned OFF.
Pulse (outputs only)
Output is turned ON for the specified duration.
Flash (outputs only)
Output flashes ON for 50% of the specified duration and OFF for
50% of the specified duration.
co
On
lin
e
Off
on
Not applicable
Output/flag is turned OFF until a
TurnOn command is executed.
m
TurnOff
Ladder Chart
To pulse or flash an output, specify a “Duration” for the output data item in the Data Item
Editor (see “Using the Data Item Editor” on page 5-3). Then, use the “Pulse” or “Flash”
output “Action” in a Control block or Control coil. When pulsed, the output turns on for the
time specified in the “Duration” parameter. After the specified time, the output automatically
turns off. When flashed, the output cycles on and off at a 50% duty cycle until it is either
turned OFF or ON.
A duration of 0.000 or 00:00:00 results in a one scan duration, which may never be seen
because of the time it takes the output to turn ON or OFF. Scan times are in the order of
0.5 - 3 ms, depending on the number of I/O expansion modules and amount of logic.
2373_en_E
PHOENIX CONTACT
5-9
nanoNavigator
5.3
Data Types and Formats
Table 5-2 lists data types supported by nanoNavigator and nanoLC.
Table 5-2
Supported Data Types
Maximum
Data
Items
Can Be
Retentive?
0
Hardware
dependent
Read
8
No
0
Write
8
Yes
Flag
F
0
1
R/W
64
Yes
System Status
Flags
F
0
1
Read
8
No
Ethernet
Status Flags1
F
0
1
R/W
32
No
HS
0
99999999
R/W
4
No
Input
I
0
1
Read
32
No
Keypad Key
K
0
1
Read
16
No
Message
MI
R/W
32
No
Output
O
R/W
32
Yes
ne
nt
s.
AI
m
Read/
Write
AO
po
0
1
R
32
R
0
99999999
R/W
Yes
R
01/01/200
0
12/31/2250
R/W
Yes
Time of Day
R
00:00:00
23:59:59
R/W
Yes
Day of Week
R
R/W
Yes
HH:MM:SS
R
00:00:00
99 or 99:59
or 99:59:59
R/W
Yes
x.xxx Sec.
R
0.000
99999.999
R/W
Yes
Timer/Counter
TC
Timer
TC
00:00:00
or
0.000
99:59:59
or
99999.999
R/W
Yes
Counter
TC
0
99999999
R/W
Yes
m
Integer
lin
e
co
Date
on
Maximum
Value
Analog Output
Register
1
PHOENIX CONTACT
Minimum
Value
Analog Input
High-speed
Counter
5-10
Prefix
co
Data Type
Text day of week
32
Only visible with an Ethernet module in the configuration.
2373_en_E
Data Operations
5.3.1
Current Date, Day, and Time
Compare blocks and Compare Coils allow access to the real-time clock in the nanoLC to
check the current date, day (of week, month, or year), and time. There are specific subtypes
for some of these comparisons, and the Compare block and Compare Coil ensures that you
select the appropriate subtype. Subtypes that can be used in a Compare to test the current
real-time clock are:
Table 5-3
Valid Current Date, Day, Time Comparisons
Compare to Subtype
Current Date
Date
Current Time
Time of Day
Current Day of Week
Day of Week
Integer
Current Day of Month
Current Day of Year
co
s.
Using Timers and Counters
nt
5.4
m
Compare
5.4.1
po
ne
nanoLC provides up to 32 Timer/Counter type data items for use in the project. Selecting
the format of the Timer/Counter determines whether it operates as a timer or counter.
Timer Items
co
m
Timers have a timing range of 0 to 99:59:59 or 99999.999. Each timer is actually a
collection of related variables, organized in a structure that is accessible in various project
tools. Timer variables include the Accumulator (timer value), Preset Value, Timer Done
status bit, and Timer Enabled status bit. The Data Item Editor permits specification of a
preset value.
on
lin
e
Ways in which project components can interact with a timer include:
– A Control block or Coil can start, stop, reset, or restart a timer.
– A Decision block or Contact can use a Boolean expression to check to see if the timer
is done or not done; running or not running
– A Compare block or Compare Contact can compare the timer accumulator with another
value.
– A Move block or Move Coil can move a value to the timer preset.
Whenever used or enabled for the first time, a timer data item must have the following
specified:
– Duration with units of HH:MM:SS (hours and seconds)
– Duration with units of x.xxx seconds (seconds and msec)
In Control blocks and Coils, the following actions on a timer are possible:
– Restart
– Start
– Stop
– Reset
2373_en_E
PHOENIX CONTACT
5-11
nanoNavigator
Start
A Timer Start causes the timer’s accumulator to begin timing.
Reset
A Timer Reset sets the timer’s accumulator to 0. After a timer expires, it must be reset before
starting it again.
Restart
A Timer Restart sets the timer’s accumulator to 0 and starts the timer (combines the
functions of Reset and Start).
m
Stop
Using Counters
s.
5.4.2
co
A Timer Stop causes the accumulator to hold its current value.
ne
nt
Counters are 32-bit values that have a range of 0 to 99,999,999. Counters also have Name,
Preset, and Description fields available for access in the Data Item Editor. The main
characteristics of Counter data items are:
– Counters can count upward (increment) and downward (decrement).
Specify a Preset for each Counter in the Data Item Editor. The preset is the Counter’s
ending value.
m
–
po
A Control block or Coil can increment, decrement, or reset a Counter each scan. Counting
is not transition-based, as in other types of controllers.
on
lin
e
co
Ways in which project components can interact with a Counter include:
– A Control block or Coil can increment, decrement, or reset a Counter.
– A Compare block or Compare Contact can compare the Counter’s current value with
another variable or constant.
– A Move block or Move Coil can replace the current value with a new value or read the
current value.
5-12
PHOENIX CONTACT
In Control blocks and Coils, the following actions on a Counter are possible:
– Increment
– Decrement
– Reset
2373_en_E
Data Operations
5.5
Using the Move Function
The purpose of the Move block and Move Coil in a chart is to write data from one variable to
another. Mathematically, a move data operation is the same as an assignment statement:
MOVE from Data Item A to Data Item B, or
Let B = A
It is important to see the move as an assignment operation or copy because the move is
non-destructive. That is, moving data from A to B does not clear A. A still has its original
value, but B has a new value equivalent to A.
5.5.1
The Move Expression
co
m
For readers who are more accustomed to using Load and Out instructions in accumulatorbased controllers, just think of the Load-Out combination as the Move block or Move Coil.
on
lin
e
co
m
po
ne
nt
s.
The Move block and Move Coil is a specialized control method in nanoNavigator because
it does a specific kind of action. Double-click the block to display the “Move Block” dialog
box or double-click the coil to display the “Move Coil” dialog box.
Figure 5-4
“Move Block... Configuration” tab
The dialog box is partitioned into the “From” and “To” groups. Complete the “From” data
fields before completing the “To” data fields. nanoNavigator automatically presents only the
valid data types in the “To” group based on the data type selected in the “From” group.
2373_en_E
PHOENIX CONTACT
5-13
nanoNavigator
5.5.2
Moving Between Same Data Types
The simplest case is moving data from one data item to another of the same type. The
following example uses two data items of the Register/Integer type, making the data item
named “Setpoint” equal to “Max. Temperature”.
FROM
TO
475
Max. Temperature
Move
475
Setpoint
Moving Between Different Data Types
ne
5.5.3
nt
s.
co
m
To perform this type of move, follow these steps:
1. Double-click the Move block to display the “Move Block” dialog box.
2. Select a “Data Type” from the drop-down list in the “From” group.
3. Use the “Data Item” drop-down list to choose an item of the selected type, or type the
logical ID (for example, “R-03”), index number (“03”), or data item name.
4. Select a “Data Type” from the drop-down list in the “To” group.
5. Click the “OK” button.
on
lin
e
co
m
po
nanoNavigator ensures that the data type of the “To” data item is compatible with the
selected “From” data item. For example, moving from a Timer/Counter configured as a
Counter to a Register configured as an Integer is possible because counters are, in fact,
integers.
5-14
PHOENIX CONTACT
2373_en_E
Data Operations
5.5.4
Move Summary
The following table defines all possible Move data combinations.
Table 5-4
Move Summary1
Timer/
Counter
Register
X
X
xxxxxxxx
m
Display
Format
mSec
dd/mm/yy
co
hh:mm:ss
Sun-Sat
X
s.
X
X
hh:mm:ss
X
xxxx.xxx
nt
X
xxxxxxxx
X
mSec
X
High-speed Counter (HSC)
X
xxxx.xxx
xxxxxxxx
xxxxxxxx
X
X
X
X
X
m
Date
hh:mm:ss
X
po
Analog In
ne
HMS
HSC
X
Counts X
Analog
Output
X
HMS
Integer
mSec
X
DoW
Message Input
HMS
X
Time
Timer/Counter
Counts
Date
mSec
X
HMS
Integer
DoW
Integer
Register
Time
Subtype
Date
Data Item Type
Time
dd/mm/yy
X
hh:mm:ss
X
co
DoW
HMS
Sun-Sat
X
X
X
lin
e
mSec
Current Date
hh:mm:ss
X
xxxx.xxx
X
Current Time
dd/mm/yy
X
Current Day of Week
(DoW)
hh:mm:ss
X
on
xxxxxxxx
Sun-Sat
Current Day of Month
X
xx
Current Day of Year
X
xxx
Fixed
Integer
Date
Time
DoW
X
X
X
X
X
xxxxxxxx
dd/mm/yy
X
hh:mm:ss
X
HMS
mSec
Sun-Sat
X
X
X
hh:mm:ss
X
xxxx.xxx
Notes:
DoW is Day of the Week
1
2373_en_E
X=valid
PHOENIX CONTACT
5-15
nanoNavigator
5.6
Handling Analog Values
nanoLC has a powerful set of I/O drivers that understand the difference between discrete
(individual) I/O points and I/O data representing numerical values. Some controllers impose
tedious programming tasks, such as handling sign bits separately from values, and time demultiplexing values for 2 to 8 channels from a single data word. nanoLC takes the usual
work out of handling analog data.
Scaling Analog Data
m
Analog values typically have 8 or 12 data bits. Moving analog input values from the I/O
system to data items occurs automatically during each scan, but they must be properly
configured when selected in the “nanoLC... Configuration” menu.
co
Analog values begin as unsigned integers. An analog channel may have 8, 10, or 12 data
bits. Once converted to an integer, analog data can be handled as any other integer.
Analog Value Mapping
nt
Table 5-5
4 to 20 mA
0 to 10 V
-10 to +10 V
0
4 mA
0V
-10 V
2048
12 mA
5V
0V
20 mA
10 V
10 V
po
ne
Device Range/
Integer Value
4095
s.
nanoLC only supports unsigned integers, so analog values map to positive 12-bit numbers
in the default range of 0-4095. Table 5-5 shows the value mapping for the different types of
analog devices supported by the nanoLC.
on
lin
e
co
m
When configured with scaling values, the nanoLC selects an integer value based on the
“Lower Value” and “Upper Value” specified in the analog configuration dialog box (see
Figure 5-5) and the input voltage or amperage.
Figure 5-5
The nLC-IO-4AI” configuration dialog box
For example, given an input device on “AI-00” that measures temperature in the range of 70
to 90° on a 0-10 V device, configure the device as follows:
– Set “Mode” to “Unipolar 0-10 Volts”
– Set “Lower Value” to “70”
– Set “Upper Value” to “90”
5-16
PHOENIX CONTACT
2373_en_E
Data Operations
In this example, an input of 5 V would appear as a value of 80, while 0 V would be 70, and
10 V would be 90.
For more information on scaling and scaling examples, see Appendix C, “Technical
Appendix – Analog Device Scaling”.
5.7
Using Analog Values
lin
e
co
m
po
ne
nt
s.
co
m
To use an analog value in a chart, follow these steps:
1. Add an analog device to the nLC configuration (see “Configuring Analog Inputs” on
page 2-11).
2. Provide scaling to the analog input, if desired, by clicking the “Configure” button for the
expansion slot that has the analog I/O device.
3. Open the Data Item Editor, and change the label name to a more fitting name for that
particular analog input.
4. Use a Move block or coil to move the analog input value to a register.
on
Figure 5-6
2373_en_E
“Move Block” dialog box showing analog input to register configuration
Once the analog value is in a register, treat it as any other integer value.
PHOENIX CONTACT
5-17
on
lin
e
co
m
po
ne
nt
s.
co
m
nanoNavigator
5-18
PHOENIX CONTACT
2373_en_E
Section 6
This section provides information about:
– Verifying, downloading, running, stopping projects
– Other nanoLC controls available through nanoNavigator
Running Projects and Controlling the nanoLC..................................................................................6-3
Specifying the PC Connection ............................................................................ 6-3
6.2
Verifying a Project............................................................................................... 6-4
6.3
Connecting to the nanoLC .................................................................................. 6-4
6.4
Downloading a Project........................................................................................ 6-5
6.5
Uploading a Project from the nanoLC................................................................. 6-5
6.6
Downloading to the Memory Module .................................................................. 6-6
6.7
Uploading from the Memory Module................................................................... 6-6
6.8
Clearing the Memory Module ............................................................................. 6-6
6.9
Running a Project ............................................................................................... 6-7
6.10
Stopping a Running Project ................................................................................ 6-7
6.11
Set nanoLC Password........................................................................................ 6-7
6.12
Set nanoLC Date/Time ....................................................................................... 6-8
6.13
Lock the nanoLC ................................................................................................ 6-9
6.14
Unlock the nanoLC ............................................................................................. 6-9
6.15
Updating nanoLC Firmware.............................................................................. 6-10
6.16
Clearing a nanoLC Project................................................................................ 6-12
on
lin
e
co
m
po
ne
nt
s.
co
m
6.1
2373_en_E
PHOENIX CONTACT
6-1
on
lin
e
co
m
po
ne
nt
s.
co
m
nanoNavigator
6-2
PHOENIX CONTACT
2373_en_E
Running Projects and Controlling the nanoLC
6
Running Projects and Controlling the nanoLC
This chapter shows how to prepare a nanoNavigator project to run it, how to transfer a
project to or from the nanoLC, and how to start and stop execution on the nanoLC. Note that
this discussion involves running a project, not just a flow chart or ladder chart. Whenever
updating a chart or closing a project, nanoNavigator ensures that it is error-free (as far as it
can tell without actually executing the project). Projects are always ready to download to the
connected nanoLC for execution.
Specifying the PC Connection
m
6.1
s.
co
Before transferring a project to or from the nanoLC, starting or stopping the project,
monitoring it, or performing any other operations on the nanoLC, nanoLC and the PC must
be physically connected. Follow these steps:
1. Verify that there is a physical connection between the nanoLC and the PC.
nt
For more information on making a physical connection between the nanoLC and a PC,
see the “nanoLC Hardware User Manual.”
Select the “File... Connection Settings” menu to display the “Connection Settings”
dialog box (see Figure 6-1). This dialog box permits selection of a COM port for the
connection to the nanoLC, and permits specification of a serial port for a nanoLC
Memory Module.
on
lin
e
co
m
po
2.
ne
The nanoLC Memory Module doesn’t require a physical connection between the nanoLC
and the PC, so skip step 1 if defining a connection to a nanoLC Memory Module.
Figure 6-1
3.
“Connection Settings” dialog box
Use the “Primary Communication” drop-down list to select from among the available
COM ports on the PC. Once selected, upload or download projects from or to the
nanoLC (see “Downloading a Project” on page 6-5 and “Uploading a Project from the
nanoLC” on page 6-5).
If the nanoLC has a USB Base Unit Option module, a USB cable connects the nanoLC to
the PC. The nanoNavigator installation automatically installs a special driver to treat the
USB port on the PC as a COM port. The USB port appears as a COM port in this dropdown list.
2373_en_E
PHOENIX CONTACT
6-3
nanoNavigator
4.
With a nanoLC Memory Module attached to a USB port on the PC and the special USB
driver installed, select the “COM” port to use for communication to the Memory Module.
Once installed, upload or download projects from or to the Memory Module (see
“Downloading to the Memory Module” on page 6-6 and “Uploading from the Memory
Module” on page 6-6).
6.2
Verifying a Project
lin
e
co
m
po
ne
nt
s.
co
m
At any time, it is possible to verify that the project is error-free and consistent with the
attached (or configured) nanoLC (see “Configuring nanoNavigator” on page 2-7) by
selecting the “nanoLC... Verify Program” menu. This opens the “Project Information...
Messages” tab.
on
Figure 6-2
The “Project Information... Messages” tab
If the verification process identifies errors, check that the configuration matches the nanoLC
intended for project execution. If there are errors identified in a chart, double-click the error
message to display the chart containing the error. The error message identifies the chart,
specific cell in the chart, type of block, and error cause. With this information, find and
correct any problems encountered.
6.3
Connecting to the nanoLC
Before transferring a project to or from the nanoLC, starting or stopping the project,
monitoring, or performing any other operations on the nanoLC, connect to it. To perform a
software connection from nanoNavigator to the nanoLC, the nanoLC and PC must be
physically connected. Follow these steps:
6-4
PHOENIX CONTACT
2373_en_E
Running Projects and Controlling the nanoLC
1.
Verify that there is a physical connection between the nanoLC and the PC (see
“Connecting to a nanoLC” on page 2-13).
For more information on making a physical connection between the nanoLC and a PC,
see the “nanoLC Hardware User Manual.”
Perform any operation on the nanoLC, such as “nanoLC... Run”, “nanoLC... Start
Monitoring”, “nanoLC... Download”, or “nanoLC... Download & Go”.
– If a communication port isn’t already selected, nanoNavigator displays the “Select
COM Port” dialog box (see Figure 6-3). Use the drop-down list to select the COM
port that has the cable connection to the nanoLC.
ne
nt
s.
co
m
2.
If the nanoLC doesn’t have a project loaded, nanoNavigator displays a message.
If the nanoLC has a different project loaded, nanoNavigator displays a message
and warns that running the nanoLC with a different project loaded in nanoNavigator
isn’t possible.
co
m
–
–
“Select COM Port” dialog box
po
Figure 6-3
on
lin
e
6.4
Downloading a Project
To download a project from nanoNavigator to the nanoLC, select the “nanoLC... Download”
menu. This transfers the executable project to the nanoLC. Select the “nanoLC... Download
& Go” menu to transfer the executable project to the nanoLC and begin execution. This
single menu selection saves, verifies, and then downloads the project to the nanoLC. It then
runs the project on the nanoLC.
Although projects can be uploaded to the PC and modified from the uploaded version, the
data item names do not get downloaded, so it is important to keep a copy of the original
source project on the PC.
6.5
Uploading a Project from the nanoLC
To upload a project to nanoNavigator from the nanoLC, follow these steps:
1. If nanoNavigator currently has a project open, select the “File... Close Project” menu.
2. In the “nanoNavigator Startup” dialog box, select the “Run Connection Wizard” button.
3. In the “nanoLC Connection Wizard” click the “Upload” button.
2373_en_E
PHOENIX CONTACT
6-5
nanoNavigator
–
–
6.6
If the original project isn’t available, nanoNavigator creates a new project. The data
item names in this new project return to their default values.
If the project exists on the PC, nanoNavigator compares the two versions and
displays any differences with a choice to use the logic from the nanoLC or the
version on the PC.
Downloading to the Memory Module
s.
co
m
To download a project from nanoNavigator to the nanoLC Memory Module, follow these
steps:
1. Attach the nanoLC Memory Module to the PC using the configured USB port (see
“Specifying the PC Connection” on page 6-3) and a standard type A to type B USB
cable (Order No. 2701247).
2. Select the “nanoLC... Memory Module... Download Project” menu to download the
project. This transfers the executable project to the nanoLC Memory Module.
6.7
ne
Install the Memory Module in the nanoLC and transfer the project to the nanoLC.
Uploading from the Memory Module
po
3.
nt
Although projects can be uploaded to the PC and modified from the uploaded version, the
data item names do not get downloaded, so it is important to keep a copy of the original
source project on the PC.
on
lin
e
co
m
To upload a project to nanoNavigator from the nanoLC, follow these steps:
1. Attach the nanoLC Memory Module to the PC using the configured USB port (see
“Specifying the PC Connection” on page 6-3) and a standard type A to type B USB
cable (Order No. 2701247).
2. Select the “nanoLC... Memory Module... Upload Project” menu to upload the project. If
there is a project open in nanoNavigator, nanoNavigator closes it (if the project has
modifications, nanoNavigator first asks to save the changes).
3. nanoNavigator then uploads the executable project from the Memory Module, and
displays the Chart Explorer.
4. Open a chart.
5. Select the “File... Save Project” menu to save the project.
6.8
Clearing the Memory Module
To clear a project from the nanoLC Memory Module, follow these steps:
1. Attach the nanoLC Memory Module to the PC using the configured USB port (see
“Specifying the PC Connection” on page 6-3) and a standard type A to type B USB
cable (Order No. 2701247).
2. Select the “nanoLC... Memory Module... Clear Project” menu to clear the project from
the memory module.
6-6
PHOENIX CONTACT
2373_en_E
Running Projects and Controlling the nanoLC
6.9
To run a project on the nanoLC from nanoNavigator, follow these steps:
1. If nanoNavigator isn’t currently connected to the nanoLC, follow the steps in
“Connecting to the nanoLC” on page 6-4.
2. Select the “nanoLC... Run” menu to begin execution or click the “Run” button on the
Main toolbar. Running a project always begins execution at the top of each chart. Data
Items that are not retentive have their values reset to their initial values.
Stop nanoLC
Button
Stopping a Running Project
m
6.10
The project will continue to run all flow charts and I/O read/writes until halted. To stop the
project, connect to the controller (see “Connecting to the nanoLC” on page 6-4), and then
select the “nanoLC... Stop” menu or click the “Stop” button on the Main toolbar.
co
Run nanoLC
Button
Running a Project
s.
WARNING:
Set nanoLC Password
po
6.11
ne
nt
Any machine or process on the I/O network under Runtime control will cease operation.
This can lead to dangerous, even life-threatening situations in some applications.
on
lin
e
co
m
To set the password on the nanoLC from nanoNavigator, follow these steps:
1. Select the “nanoLC... Set Password” menu.
2. If nanoLC doesn’t have a current password, skip to step 3. If the nanoLC already has a
password, the “Current Password” field is available (see Figure 6-4) and requires entry
of the current password. Enter the correct current password (a one- to four-digit
number).
Figure 6-4
2373_en_E
“New Password” dialog box requests the current password
PHOENIX CONTACT
6-7
nanoNavigator
3.
4.
Press the <Tab> key to enable the “New Password” and “Confirmation” fields.
Enter a numeric password in the “New Password” field and repeat it in the
“Confirmation” field. Valid passwords are from 1 to 9999.
To clear the password, follow steps 1 through 3, above. For the new password, leave both
the “New Password” and “Confirmation” fields blank (don’t enter any values or space),
and then click the “OK” button.
6.12
Set nanoLC Date/Time
on
lin
e
co
m
po
ne
nt
s.
co
m
To set the date and time on the nanoLC from nanoNavigator, follow these steps:
1. If nanoNavigator isn’t currently connected to the nanoLC, follow the steps in
“Connecting to the nanoLC” on page 6-4.
2. Select the “nanoLC... Set Date/Time” menu. This displays the “Set nanoLC Date &
Time” dialog box (see Figure 6-5).
Figure 6-5
3.
4.
6-8
PHOENIX CONTACT
“Set nanoLC Date & Time” dialog box
To quickly set the date and time to the current date and time of the PC, click the “Get
PC Date & Time” button. To set another date and time, use the dialog box calendar and
time controls.
– To change the month and/or year, click the next or previous buttons in the calendar
month, year title.
– To change the hour, minute, or second, select the desired number and either type
the number or use the spin button on the right.
– To change AM/PM, select the letters and either type “A” or “P” or use the spin
button on the right.
Click the “Apply” button to set the date and time on the nanoLC and leave the dialog box
open. Click the “OK” button to set the date and time on the nanoLC and close the dialog
box.
2373_en_E
Running Projects and Controlling the nanoLC
6.13
Lock the nanoLC
ne
nt
s.
co
m
When locked, the nanoLC does not permit changes until it is unlocked using the password
defined at the time it was locked. To protect the nanoLC from changes using the
nanoNavigator, follow these steps:
1. If nanoNavigator isn’t currently connected to the nanoLC, follow the steps in
“Connecting to the nanoLC” on page 6-4.
2. If necessary, follow the steps in “Set nanoLC Password” on page 6-7.
3. Select the “nanoLC... Lock nanoLC” menu. This displays the “Lock the nanoLC” dialog
box (see Figure 6-6).
Figure 6-6
Unlock the nanoLC
co
6.14
po
Enter the current password, a number from 1-9999, and then click the “OK” button.
m
4.
The “Lock the nanoLC” dialog box requires the current password
on
lin
e
To unlock the nanoLC from nanoNavigator, follow these steps:
1. If nanoNavigator isn’t currently connected to the nanoLC, follow the steps in
“Connecting to the nanoLC” on page 6-4.
2. Select the “nanoLC... Unlock nanoLC” menu. This displays the “Unlock the nanoLC”
dialog box (see Figure 6-6).
Figure 6-7
3.
2373_en_E
“Unlock the nanoLC” dialog box requires the current password
Enter the current password, a number from 1-9999, and then click the “OK” button.
PHOENIX CONTACT
6-9
nanoNavigator
6.15
Updating nanoLC Firmware
nanoNavigator provides a straightforward capability to update the firmware on the nanoLC.
Only perform this operation when instructed to do so by Phoenix Contact or your local
system administrator.
on
lin
e
co
m
po
ne
nt
s.
co
m
To update the firmware, follow these steps:
1. Start nanoNavigator (see “Starting nanoNavigator” on page 2-4). If already started,
close any open project by select the “File... Close Project” menu. You should see the
“nanoNavigator Startup” dialog box (see Figure 2-1 on page 2-4).
2. Click the “Run Connection Wizard” button to display the “nanoLC Connection Wizard”
(Figure 6-8).
Figure 6-8
6-10
PHOENIX CONTACT
The “nanoLC Connection Wizard”
2373_en_E
Running Projects and Controlling the nanoLC
Click the “nanoLC Utilities” button to display the “nanoLC Utilities” dialog box
(Figure 6-9).
Figure 6-9
co
Click the “Update Firmware” button to display the “Update nanoLC Firmware” dialog
box (Figure 6-10).
co
m
po
ne
nt
s.
4.
The “nanoLC Utilities” dialog box
m
3.
The “Update nanoLC Firmware” dialog box
lin
e
Figure 6-10
5.
on
6.
7.
Use the “Browse” button to locate the nanoLC update package. Double-click or select
the file, and then click the “Open” button.
Once the file path appears in the “Update Package” field, click the “Start” button to
begin the update process.
Follow the on-screen instructions to update the nanoLC firmware and, if present, the
display firmware.
You can find additional information for updating the nanoLC firmware by visiting
www.download.phoenixcontact.com.
2373_en_E
PHOENIX CONTACT
6-11
nanoNavigator
6.16
Clearing a nanoLC Project
on
lin
e
co
m
po
ne
nt
s.
co
m
nanoNavigator provides a technique to totally remove a project from the nanoLC. This
generally isn’t required because loading a new project to the nanoLC automatically removes
the old one. However, to manually remove a project, follow these steps:
1. Start nanoNavigator (see “Starting nanoNavigator” on page 2-4). If already started,
close any open project by select the “File... Close Project” menu. You should see the
“nanoNavigator Startup” dialog box (see Figure 2-1 on page 2-4).
2. Click the “Run Connection Wizard” button to display the “nanoLC Connection Wizard”
(Figure 6-11).
6-12
PHOENIX CONTACT
Figure 6-11
The “nanoLC Connection Wizard”
2373_en_E
Running Projects and Controlling the nanoLC
Click the “nanoLC Utilities” button to display the “nanoLC Utilities” dialog box
(Figure 6-9).
Figure 6-12
co
Click the “Clear Project” button.
Confirm the operation by clicking the “Yes” button in the warning dialog that appears.
on
lin
e
co
m
po
ne
nt
s.
4.
5.
The “nanoLC Utilities” dialog box
m
3.
2373_en_E
PHOENIX CONTACT
6-13
on
lin
e
co
m
po
ne
nt
s.
co
m
nanoNavigator
6-14
PHOENIX CONTACT
2373_en_E
Section 7
This section provides information about:
– Verifying projects
– Forcing data values
– Using Execution Tracing
Verifying a Project ............................................................................................................................7-3
nanoLC Monitor Window .................................................................................... 7-4
7.1.1
Charts Tab ........................................................................................... 7-4
7.1.2
Block or Element Tab........................................................................... 7-6
7.1.3
Forces Tab .......................................................................................... 7-6
7.1.4
System Flags Tab ................................................................................ 7-7
7.2
Forcing Data Values ........................................................................................... 7-7
7.3
Using Execution Tracing in nanoNavigator......................................................... 7-8
on
lin
e
co
m
po
ne
nt
s.
co
m
7.1
2373_en_E
PHOENIX CONTACT
7-1
on
lin
e
co
m
po
ne
nt
s.
co
m
nanoNavigator
7-2
PHOENIX CONTACT
2373_en_E
Verifying a Project
7
Verifying a Project
Monitor window
on
lin
e
co
Figure 7-1
m
po
ne
nt
s.
co
m
nanoNavigator provides verification support (Monitor mode) for nanoLCs. nanoNavigator
must be connected to the nanoLC (see section "Connecting to the nanoLC" on page 6-4)
before Monitor mode is available. To start Monitor mode, select the “nanoLC... Monitor”
menu. In Monitor mode, nanoNavigator displays:
– A “nanoLC Monitor” window that includes four tabs:
– Flow Chart or Ladder Chart – This tab lists all the data values used or modified in
the visible chart. The tab changes to reflect the type of chart.
– Blocks or Elements – This tab lists all the data values used or modified in a selected
block in the chart.
– Forces – This tab lists all forced data values.
– System Flags – This tab lists available system flags and their current values.
2373_en_E
PHOENIX CONTACT
7-3
nanoNavigator
Display the status of all charts in the project by selecting the “View... Chart Explorer”
menu to display the Chart Explorer. This window, in addition to permitting selection of
a chart to open, displays the status of each chart (“Enabled” or “Waiting”) and the block
or element that is currently executing (see Figure 7-2).
ne
nt
s.
co
m
–
When displaying a chart, it shows the history of execution and the current block or
element.
m
–
Chart Explorer in Monitor mode
po
Figure 7-2
lin
e
co
If opening a chart, nanoNavigator displays the running status of that chart. This includes
displaying values of data items in selected blocks or elements in a Locals window. It also
includes an indication of the executing block or element.
on
7.1
nanoLC Monitor Window
The “nanoLC Monitor” window opens automatically when selecting the “nanoLC... Start
Monitor” menu. This window provides real-time access to data item values. The four tabs
display all data items used or modified in the visible chart or a selected block, and all forced
data values. The following sections describe these tabs in more detail.
7.1.1
Charts Tab
The “nanoLC Monitor... Charts” tab lists all data values used or modified in the open chart.
The name in the tab changes to reflect the type of chart being monitored.
7-4
PHOENIX CONTACT
2373_en_E
Verifying a Project
co
m
Use this window to change or force values.
The “nanoLC Monitor... Flow Charts” tab lists flow chart data values
s.
Figure 7-3
nt
To modify or force a data or I/O value, right-click on the row that contains the data item. The
pop-up menu has the choices shown in Table 7-1
Setting
Description
Input
Force ON
Sets the Input bit ON (see “Forcing Data
Values” on page 7-7).
Force OFF
Sets the Input bit OFF (see “Forcing Data
Values” on page 7-7).
UnForce
Removes Force setting.
Outputs and Flags
Turn ON
Sets the output or flag bit ON. The value
can change under program control.
Turn OFF
Sets the output or flag bit OFF. The value
can change under program control.
Force ON
Sets the output bit or flag ON (see “Forcing
Data Values” on page 7-7).
Force OFF
Sets the output bit or flag OFF (see
“Forcing Data Values” on page 7-7).
UnForce
Removes Force setting.
Set Value
Displays a pop-up dialog box that permits
setting a value for the register.
Zero Value
Sets the register or timer/counter to zero.
Set Accumulator
Displays a pop-up dialog box that permits
setting the accumulated count.
Zero Accumulator
Sets the accumulated count to zero.
Set Preset
Displays a pop-up dialog box that permits
setting the preset done value.
Zero Preset
Sets the value of the preset done to zero.
on
lin
e
co
po
Type of Data Item
Registers
Timer/Counters
2373_en_E
ne
Force options available depending on data item type
m
Table 7-1
PHOENIX CONTACT
7-5
nanoNavigator
7.1.2
Block or Element Tab
nt
s.
co
m
The “nanoLC Monitor... Blocks” tab or “nanoLC... Elements” tab lists all data values used or
modified in a selected cell. In addition, use this window to change or force values.
Figure 7-4
The “nanoLC Monitor... Blocks” tab lists a block’s data values
Forces Tab
m
7.1.3
po
ne
To modify or force a data or I/O value, right-click on the row that contains the data item. The
pop-up menu has the same choices listed in “Charts Tab” on page 7-4.
on
lin
e
co
The “nanoLC Monitor... Forces” tab lists all data values used or modified in the running
project. In addition, use this window to change or force values.
Figure 7-5
The “nanoLC Monitor... Forces” tab lists forced data items
To modify or force a data or I/O value, right-click on the row that contains the data item. The
pop-up menu has the same choices listed in “Charts Tab” on page 7-4.
7-6
PHOENIX CONTACT
2373_en_E
Verifying a Project
7.1.4
System Flags Tab
nt
s.
co
m
The “nanoLC Monitor... System Flags” tab (see Figure 7-6) lists all system flags available to
nanoNavigator and their current value. System flags provide status information that the
control program can access. For a list of all available system flags, see “Technical Appendix
– System Flags”.
Forcing Data Values
po
7.2
The “nanoLC Monitor... System Flags” tab lists all system flags
ne
Figure 7-6
co
m
Use the “nanoLC Monitor... Forces” tab to view all forced items (see Figure 7-5). nanoLC
permits forcing input, output, flag data items, and the values of timers/counters. This
provides a valuable verification capability. When a data item has a forced value, the value
won’t change due to different input states or under program control. However, forcing a data
value doesn’t make a permanent programming change, nor does it change a preset value.
on
lin
e
Forcing a value doesn’t change a preset or permanently modify the value.
To add forces, follow these steps:
1. Use the “nanoLC Monitor... Charts” tab (see “Charts Tab” on page 7-4) or “nanoLC
Monitor... Blocks” tab (see “Block or Element Tab” on page 7-6).
2. Open a chart or select a block that references the data item.
3. Right-click the data item to force.
4. Select “Force On”, “Force Off”, or “Set Value” as desired.
Be sure to remove all forces before running a project in a production environment.
2373_en_E
PHOENIX CONTACT
7-7
nanoNavigator
7.3
Using Execution Tracing in nanoNavigator
Open charts in Monitor mode automatically provide execution tracking. With execution
tracking, nanoNavigator color codes blocks or elements to indicate if they were recently
executed. The color coding is:
– Green: Always executed on every scan
– Yellow: Sometimes executed
– Red: (Enable block only) The chart is inactive
– Gray: Never executed
on
lin
e
co
m
po
ne
nt
s.
co
m
These colors are defaults. To select custom colors, see “Debug Tab” on page A-9.
7-8
PHOENIX CONTACT
2373_en_E
Section 8
This section provides information about:
– Installing and starting nanoNavigator
– Using flow charting for the first time (Flow Charting Primer)
– Connecting nanoNavigator to the nanoLC
– Creating a flow chart project
– Verifying the project
Flow Chart Tutorial ...........................................................................................................................8-3
Flow Charting Primer .......................................................................................... 8-3
8.1.1
Introduction and History....................................................................... 8-3
8.1.2
Flow Charts.......................................................................................... 8-4
8.1.3
Data Items ........................................................................................... 8-7
8.2
Designing a Control Project ................................................................................ 8-7
8.2.1
Auto-mode Flow Chart ......................................................................... 8-8
8.2.2
Status Flow Charts............................................................................. 8-14
8.2.3
Diagnostic Flow Chart........................................................................ 8-16
8.2.4
Recovery Flow Chart ......................................................................... 8-18
8.3
Project Execution.............................................................................................. 8-19
8.3.1
Solving Flow Charts ........................................................................... 8-19
8.3.2
Flow Chart Execution Order............................................................... 8-19
8.4
Creating a Project ............................................................................................. 8-21
8.4.1
Creating the Brake Control Program .................................................. 8-22
8.4.2
Creating Left Turn Flow Chart ............................................................ 8-26
co
m
po
ne
nt
s.
co
m
8.1
Downloading and Verifying the Project ............................................................. 8-37
8.5.1
Downloading the Project .................................................................... 8-37
8.5.2
Connecting to the Simulator............................................................... 8-39
8.5.3
Monitoring the Project........................................................................ 8-42
8.5.4
Verifying a Project.............................................................................. 8-43
on
lin
e
8.5
2373_en_E
PHOENIX CONTACT
8-1
on
lin
e
co
m
po
ne
nt
s.
co
m
nanoNavigator
8-2
PHOENIX CONTACT
2373_en_E
Flow Chart Tutorial
8
Flow Chart Tutorial
8.1
Flow Charting Primer
This flow charting primer is for new users that have no experience with flow chart
programming. It provides a brief introduction to flow chart programming concepts
specifically as they relate to programming the nanoLC using nanoNavigator.
Introduction and History
m
8.1.1
s.
co
Although flow charting predates 1947, it was formally introduced at that time as a way to
clearly communicate computer program designs. This ‘new method’ of using labeled blocks
to show the order of a process became so successful that the American National Standards
Institute (ANSI) developed standards for flow charts in the early 1970s.
ne
nt
After that, flow charts became a standard for displaying all types of procedures (product
launches, quality practices, troubleshooting documentation, etc.), as well as a very reliable
means for monitoring and controlling electro-mechanical devices through PC-based
programs. This is because people from all walks of life could easily understand a graphical
path with instructions of what to do along the way.
po
Flow charts are step-by-step procedures written using blocks (actions and decisions) and
flow lines. Flow lines indicate direction of movement (or path) from block-to-block. Flow
charts are simple to write, easy to understand, and programming knowledge isn’t required
to write a flow chart!
co
m
In control programs, flow chart paths return to a desired point in the path – to repeat the
process. Generally, it takes multiple flow charts to create a control project, although it is
conceivable that simple projects may require only one flow chart.
on
lin
e
Control projects are a set of flow charts that control a process. Control projects run on a
computer (like the nanoLC or a PC). The computer runs a program that scans through userdesigned flow charts in a desired sequence. To do this, projects need to perform the
following tasks:
– Control the process by monitoring inputs
– Manipulate outputs as required
– Display status information (normal conditions)
– Display diagnostic information (abnormal conditions)
– Recover from an error
nanoLC solves all flow charts in a project on each scan cycle (for more information on scan
cycles and flow chart execution, see “Project Execution” on page 8-19).
2373_en_E
PHOENIX CONTACT
8-3
nanoNavigator
8.1.2
Flow Charts
nanoNavigator uses flow charts to design control programs, and nanoLC executes projects
that use flow chart control programs. The symbols in the flow chart depict two classes of
items: action blocks and branching blocks.
Action Block
co
m
An action block is a box (see Figure 8-1) representing an operation on the data in the
system, which may include input or output data. In the flow chart, an action block has one
entry point (top) and one exit point (bottom). nanoNavigator has four types of action blocks
that are described later (see “Types of Action Blocks” on page 8-5).
N
ne
Branching
Block
nt
s.
Action
Block
po
Y
Flow chart segment showing an action and branching block
m
Figure 8-1
co
Branching Block
on
lin
e
A branching block is a diamond-shaped box (see Figure 8-1) that represents a branch in the
control path based on available data. A branching block may compare one variable to
another, a variable to a constant, or a true or false condition. Branching blocks have one
entry point (top) and two exit points (right side and bottom). nanoNavigator has two types of
branching blocks that are described later (see “Types of Branching Blocks” on page 8-5).
8-4
PHOENIX CONTACT
Using just action and branching blocks, flow charts can have complete control of I/O
systems, or control a machine or process. A project may consist of one or several flow
charts.
2373_en_E
Flow Chart Tutorial
Types of Action Blocks
co
m
po
ne
nt
s.
co
m
nanoNavigator has three types of action blocks: Control, Message, and Move. Control
blocks (see Figure 8-2) initiate an action such as turning on an output or resetting a timer.
One Control block can have up to four control expressions. Control expressions set values
for flags, turn outputs on and off, and control timers and counters.
on
lin
e
Figure 8-2
Action blocks
Message blocks select a message number (from 0 to 31) to display on the Operator Panel.
The Message Editor (see “Using the Message Editor” on page 3-31) specifies messages to
display.
Move blocks simply move data from one data item to another. The source data item remains
unchanged.
Types of Branching Blocks
Branching blocks (both Decision and Compare blocks) perform a test and determine which
of two paths to take after the test. Each branching block has one entry point and two exit
points indicating Yes and No paths from the block. By default, the bottom connector is the
Yes path, and the right side is the No path.
The standard orientation of a flow chart is top-to-bottom for ease in reading.
2373_en_E
PHOENIX CONTACT
8-5
nanoNavigator
ne
nt
s.
co
m
Both Decision and Compare blocks appear as diamonds in the flow chart (see Figure 8-3).
Since the Wait block has an implicit branch to itself, it also appears as a diamond.
Decision, Compare, and Wait blocks appear as diamonds
po
Figure 8-3
co
m
Decision blocks examine the state of a data item using a Boolean comparison. For example,
a Decision block can test inputs or outputs to determine if they are ON or OFF or
transitioning from one state to the other. A Decision block can have one or two decision
expressions. If there are two expressions, an OR or AND condition links them. For example,
a Decision block could have the following expressions:
– Input1 ON AND Input2 OFF
lin
e
Use Compare blocks to compare two data items. For example, a Compare block can
compare an integer register value to a constant or another register. A Compare block can
compare values using one of the following comparison operators:
on
= (Equal To)
> (Greater Than)
< (Less Than)
>= (Greater Than or Equal To)
<= (Less Than or Equal To)
IsEven (doesn’t have a second data item to compare to)
The Wait block inserts a wait period in the execution of the flow chart. A Wait block can have
a wait period set in seconds or hours, minutes, and seconds as a constant or as a value in
a register. If the wait duration is zero, the block defaults to one scan cycle.
8-6
PHOENIX CONTACT
2373_en_E
Flow Chart Tutorial
8.1.3
Data Items
Data items provide labels for inputs, outputs, timers, messages, and internal storage. In
nanoNavigator, the Data Item Editor labels data items (up to 30 characters). Data items
appear in flow chart blocks to control a project. Each label “personalizes” the item (timer,
counter, etc.), output (valve, motor, LED, etc.), or monitor (pressure gauge, flow meter,
switch, etc.). Personalizing data items helps identify an item’s purpose whenever it’s used
in a flow chart block. Therefore, make sure the label (or name) reflects the purpose of the
data item. For instance, some input names in a greenhouse project might be: “Greenhouse
3 Temperature”, “GH3 Water Flow Rate”, “GH3 Windows Opened”, “GH3 Windows
Closed”; output names might be: “GH3 Valve”, “Open GH3 Windows”, “Close GH3
Windows”, “GH3 Sun Lamps”.
on
lin
e
co
m
po
ne
nt
s.
co
m
nanoNavigator supports the nine data item types available on the nanoLC. They are:
– Input – The number available depends on the configuration of the nanoLC. Inputs are
on or off.
– Analog Input – An unsigned integer that represents gradually changing
voltages/values input to the nanoLC. The number available depends on the
configuration of the nanoLC. See “Handling Analog Values” on page 5-16.
– Output – The number available depends on the configuration of the nanoLC. Outputs
are on or off.
– Analog Output – An unsigned integer that represents gradually changing
voltages/values output from the nanoLC. The number available depends on the
configuration of the nanoLC. See “Handling Analog Values” on page 5-16. Analog
inputs provide gradually changing voltages/values.
– Timer/Counter – Maximum of 64 total timers and counters.
– High-Speed Counter – Maximum of 2. May be enabled or disabled by project.
– Register – Maximum of 64. Configurable as Unconfigured, Integer, Date, Time of Day,
Duration (HH:MM:SS or msec). Registers can have an initial value and may be
retentive (see “Duration, Preset, and Retentive Values” on page 5-8).
– Flag – Maximum of 128 binary flags. Flags can have an initial value (set=1) and may be
retentive (see “Duration, Preset, and Retentive Values” on page 5-8).
– Keypad Key – Maximum of 16 keys available if the optional Operator Panel is present
on the nanoLC. The keys include the digits 0-9, four arrow keys, and “OK”. In addition,
there is a “Message Input Ready” Keypad Key data item.
8.2
Designing a Control Project
Control projects generally need to accomplish the following four tasks:
– Control a process by monitoring inputs and manipulate outputs in the desired order
– Display status information (normal conditions)
– Display diagnostic information (abnormal conditions)
– Recover from an error
When considering a design, it is important to create modular flow charts that work on small
sections of the total project. Using modular design techniques makes it easier to develop,
verify, and maintain a project.
The examples on the following pages relate the basics of what needs to be done. They in
no way account for the specific events and requirements of each project.
2373_en_E
PHOENIX CONTACT
8-7
nanoNavigator
Auto-mode Flow Chart
co
8.2.1
m
Because there are common needs in almost every project, certain flow chart structures
have become common as well. Each is recognized by its characteristic shape in the same
way that building tools (tape measure, hammer, circular saw, etc.) are recognized by their
shapes, so it’s important to note that flow charts:
– Commonly consist of repeating block patterns. These patterns become easy to
recognize what they do by how they’re laid out.
– Don’t stop at the end, but return to a desired point (determined by the application) in the
flow chart to do the work all over again.
– Have label blocks to identify what each block is doing at every step of the process – a
very important feature.
– Vary from the examples in this guide depending on what is required, while staying
within their intended purpose and behavior.
po
ne
nt
s.
Because auto-mode flow charts are written to control process actions automatically, an
auto-mode flow chart is the equivalent of a company’s project manager with one or two main
priorities:
– Initialize the project at the beginning of a flow chart to determine if desired inputs are at
the correct state and/or value, set all desired outputs to the correct state and/or value,
and then (usually) wait for input from a user and/or machine to begin controlling a
process automatically.
– Control the project, which entails reading inputs, controlling actions, for example,
starting timers and reading when they’re done, updating counters, turning outputs
on/off.
co
m
Depending on the control process(es), the project could require:
– One flow chart to control the entire project.
– A separate flow chart for each major process to be controlled.
on
lin
e
Because auto-mode flow charts control widely different processes, their layout and look
vary a great deal, but no matter what it controls, this type of flow chart does three things (see
Figure 8-4):
– Turn something on in an action block, like an output to open a greenhouse window, or
an output to turn on a sprinkler system, and start a timer to begin timing how long the
output should be on.
– Monitor, in a branching block, if the thing turned on is done, for instance, did the
opening window hit a switch (an input device used to monitor if something is at a
desired position), or is the timer done – signaling that it’s time to turn off the sprinkler
system?
– Turn off the same output in an action block that was turned on earlier.
8-8
PHOENIX CONTACT
2373_en_E
Flow Chart Tutorial
Turn on and start timer
nt
s.
co
m
Test for completion
po
ne
Turn off and reset timer
An auto-mode flow chart example
m
Figure 8-4
co
Therefore, it’s common to use the construct shown in Figure 8-4 along with variations (the
blocks don’t have to be used next to each other) because, if a flow chart turns something
on, it usually needs to turn it off at some point.
lin
e
As some operations take longer to complete than others, certain auto-mode flow charts
will take longer to complete than others.
on
Example 1: Auto-Mode Flow Chart Controls the Order in Which Processes Occur
In this example, the auto-mode flow chart controls a project the same way every time
because flow goes through each process in the same order every time. There are three
parts to the flow chart.
– Initialize the project
– Wait for starting event
– Control the process
This example and the next serve as ideas for controlling processes in a project. The
project takes everything into account that needs to be controlled in order for the process
to operate safely and repeatedly. A project can have more than one auto-mode flow chart
if necessary – each controlling a specific process in the project. For example, if a project
controls a bowling alley, it could have a flow chart controlling the pin setter, another
controlling the ball return, and a third controlling a game display with each flow chart
named for the process it controls.
2373_en_E
PHOENIX CONTACT
8-9
nanoNavigator
Action blocks at the beginning ensure outputs are turned to desired states (usually OFF),
timers and counters reset, etc., so nothing happens until the starting event initiates action
(see Figure 8-5). Depending on the needs of the project, use one or more action blocks to
perform this initialization.
Daisy-chain
branching blocks to
verify all inputs at
desired state
ne
nt
s.
co
m
Initialize outputs
and timers
Initialization of the project could look like this
po
Figure 8-5
m
Branching blocks “daisy-chained” together (see Figure 8-5) ensure that desired inputs are
in desired states before the process begins. Depending on the project, use one or more
branching blocks for testing conditions, before proceeding to the second part, which waits
for a starting event.
Wait for start signal
on
lin
e
co
In the second part of the project, a decision block waits (see Figure 8-6) for an operator to
start the operation by pressing a key or moving a switch to the correct position (on or off).
Figure 8-6
8-10
PHOENIX CONTACT
Use a branching block to wait for signal to start process
2373_en_E
Flow Chart Tutorial
co
m
po
ne
nt
s.
co
m
The third part of the project (see Figure 8-7), controlling the process, turns something on (for
instance an output), checks to make sure it’s done, and then turns that same output off. After
that, flow, in this case, is routed back to the decision block that waits for someone to start
the process over again. Depending on the application requirements, flow could be routed
elsewhere.
Project control consists performing I/O as required
on
lin
e
Figure 8-7
2373_en_E
PHOENIX CONTACT
8-11
nanoNavigator
Example 2: Auto-Mode Flow Charts that Control by Following Process Needs
This example shows two flow charts that control a project by monitoring when something
needs to be done and then does it.
on
lin
e
co
m
po
ne
nt
s.
co
m
The first flow chart (see Figure 8-8) stays in a current action (raising tank temperature,
starting the agitation cycle, and adding of catalyst) until that action is done. Therefore, any
remaining actions cannot be attempted until the one above it is done. When the last action
is taken care of, flow then goes back to the top to see if it’s still “Okay to Run” the process.
It also checks to see if a user has pressed “Emergency Stop”.
Figure 8-8
8-12
PHOENIX CONTACT
Tank control example one
2373_en_E
Flow Chart Tutorial
on
lin
e
co
m
po
ne
nt
s.
co
m
The second flow chart (see Figure 8-9) shows how to add more initial checks at the
beginning with the rest of the flow chart so that each action initiates a function. After
examining all process functions, flow returns to the top, verifies that operating conditions are
valid, and then repeats.
Figure 8-9
2373_en_E
Tank control example two
PHOENIX CONTACT
8-13
nanoNavigator
8.2.2
Status Flow Charts
on
lin
e
co
m
po
ne
nt
s.
co
m
Status flow charts have a characteristic repeating three-block pattern (see Figure 8-10).
This structure is the quickest way to:
– Monitor project events (for example, switches, valves, temperature, pressure, operator
actions) in a decision or compare block.
– Immediately display status in associated action blocks.
– Do it all over again.
Figure 8-10
8-14
PHOENIX CONTACT
Sample status flow chart example
2373_en_E
Flow Chart Tutorial
A key characteristic of this type of flow chart is that no block, between the first and last two
blocks, loops a flow line back to itself or to a block above it. Only the last two action blocks
loop back to the first block.
When the project is running, this flow chart executes from top-to-bottom every time no
matter the path it takes.
Variations on the Status Flow Chart
on
lin
e
co
m
po
ne
nt
s.
co
m
As long as the flow chart doesn’t loop back to any of the inner blocks, there are many
conceivable variations on the basic status flow chart. Figure 8-11 and Figure 8-12 show two
possibilities.
2373_en_E
Figure 8-11
Sample status flow chart variation 1
PHOENIX CONTACT
8-15
po
ne
nt
s.
co
m
nanoNavigator
Diagnostic Flow Chart
co
8.2.3
Sample status flow chart variation 2
m
Figure 8-12
on
lin
e
A diagnostic flow chart looks for any project-stopping errors (for example, an Emergency
Stop) and current process actions, which usually originate in the auto-mode flow chart(s).
When an action is in progress, the diagnostic flow chart looks for faults. These faults can be
improbable, probable, and those that indicate an error when an event doesn’t occur after a
certain period of time. If a fault occurs, the diagnostic flow chart displays a message, or turns
necessary outputs ON or OFF (for example, turn on an LED to indicate a specific error, turn
off a motor to stop a given action), which can vary per error, application requirements, and
safety regulations.
Flow then goes back to the next decision block to check if the next error occurred for that
same action. Once the flow chart has checked all possible error conditions for a given
action, the flow chart checks to see if the next action is occurring.
Whether or not an error occurred, the flow chart checks to see if an operator cleared a fault
that may have occurred. If so, the flow chart clears the existing error message and turns off
any error indicators.
Figure 8-13 illustrates a diagnostic flow chart for a greenhouse application. Although it does
not show all possible error conditions, it provides an excellent example of the concepts
discussed above.
8-16
PHOENIX CONTACT
2373_en_E
Flow Chart Tutorial
E-Stop Actions
m
po
ne
nt
s.
co
m
Check for
projectstopping
errors
on
lin
e
co
Check for faults
Send message
Set outputs
ON/OFF
Check for operator
action
Clear message
and indicators
Figure 8-13
2373_en_E
Sample diagnostic flow chart
PHOENIX CONTACT
8-17
nanoNavigator
The diagnostic flow chart shown in Figure 8-13 illustrates general layout and ideas generally
needed in diagnosing faults. It doesn’t account for the specific needs of all projects.
Depending on project needs, including applicable safety regulations and considerations, it’s
possible to write diagnostic flow charts to look for one or more errors for a given action (the
example shows checking for three possible errors for any given action). Therefore, the size
and layout of a specific project diagnostic flow chart will vary from this one. However, the
functionality should be very close.
8.2.4
Recovery Flow Chart
nt
s.
co
m
The job of a recovery flow chart is to put all outputs (such as a window controls and valves)
back to a safe position and/or state after a fault occurs.
lin
e
Decision blocks check
to see if a state exists
that requires recovery
co
m
po
ne
Wait for recovery
condition(s)
If recovery required,
set output states
on
If no recovery required,
perform other actions
as required.
Figure 8-14
8-18
PHOENIX CONTACT
Sample recovery flow chart
2373_en_E
Flow Chart Tutorial
Important characteristics of its structure are:
– Each recovery task checked and acted on independently.
– With the exception of the top decision block looping on itself (very important for this flow
chart), the rest of the recovery flow chart is similar to a status flow chart (Figure 8-12 on
page 8-16).
With greater familiarity creating flow charts using nanoNavigator, consider removing the
top decision block and placing the recovery condition testing in the Enable block (see
“Enable Block” on page 3-13).
Project Execution
m
8.3
nt
s.
co
When the nanoLC is in run mode, it repeatedly scans through the project and executes flow
chart(s). Project execution occurs in the following sequence:
– Check the state (digital) and value (analog) of all inputs.
– Solve all enabled flow charts in numeric order, skipping any flow charts that are
disabled (see “Solving Flow Charts”).
– Send updated digital outputs.
Solving Flow Charts
po
8.3.1
ne
Each scan cycle includes completion of these three steps, and the nanoLC continuously
repeats scan cycles until explicitly stopped or turned off.
on
lin
e
co
m
On the first scan after selecting “run” on the nanoLC or the “nanoLC... Run” menu in
nanoNavigator, the nanoLC executes each enabled flow chart in the order in which it
appears in the Chart Explorer (see “Flow Chart Execution Order”). In each enabled flow
chart, execution begins with the block connected to the Enable block (see “Enable Block”
on page 3-13). The scan continues in that flow chart until a flow line routes back to a block
that has already been scanned. It marks that block and leaves the flow chart to scan the next
enabled flow chart in the same manner until all enabled flow charts have executed. It then
sends all updated outputs (ON or OFF) to output devices. On the next and following scans,
the nanoLC reads inputs, executes enabled flow charts starting where it left off (at the
“marked block”) continuing until flow routes back to a block that’s already been examined in
this particular scan, and then sends updated outputs. This continues until the nanoLC is
turned off.
8.3.2
Flow Chart Execution Order
As discussed above, nanoLC executes all flow charts in every scan cycle. Use the Chart
Explorer to specify the order of chart execution (see “Changing Execution Order” on
page 3-8).
The Chart Explorer displays both flow charts and ladder charts. Execution order is based
on the order specified in the Chart Explorer regardless of the type of chart.
Because it’s possible to have more than one flow chart controlling the same output (for
example, one or more auto-mode flow charts, a diagnostic flow chart, and a recovery flow
chart), consider placing the diagnostic flow chart last in the list or next-to-last before the
recovery flow chart.
2373_en_E
PHOENIX CONTACT
8-19
nanoNavigator
Flow Chart Explorer
m
Figure 8-15
po
ne
nt
s.
co
m
The nanoLC scans flow charts in numeric order as they appear in the Chart Explorer (shown
Figure 8-15) starting with the flow chart at #1 (“Status” in the example), then #2, and so on.
Therefore, if more than one flow chart is controlling a given output, the enabled flow chart
with the highest number on the list has the highest precedence for that output in each scan.
In other words, if flow chart #2 turns an output on and flow chart #3 turns it off, the output
would be off once the outputs are sent to the bus.
on
lin
e
co
If there is only one flow chart in the project, the last block to control the output in the current
scan has precedence.
8-20
PHOENIX CONTACT
2373_en_E
Flow Chart Tutorial
8.4
Creating a Project
This sample project is a control program for vehicle lights including turn indicators and brake
lights. With flow chart programming, it is easy to create a project using nanoNavigator. To
begin, notice that the flow chart workspace looks like a spreadsheet with row numbers and
column letters (see Figure 8-16). Identify specific cells of the workspace as with a
spreadsheet, so cell A0 is the first cell in the upper-left corner, and cell B0 is the cell in the
second column, first row.
Menus
co
m
Toolbar
Row
labels
nt
s.
Toolbar
Magnifier
po
ne
Column
labels
on
lin
e
Status line
Scrollbars
co
m
Workspace
(showing the
Flow Chart Editor)
Figure 8-16
Grid address
nanoLC status indicators
Initial flow chart window
A new flow chart always has an Enable block in cell A0. For more information about the
Enable block, see “Enable Block” on page 3-13. The Block toolbar provides easy placement
of different flow chart blocks in the workspace. It is above the flow chart workspace. The
basic technique is to click a Block toolbar button, and then click a cell location in the
workspace to drop the block in position. Flow charts can only have one block per cell.
For further information on the elements on the nanoNavigator window and Flow Chart
Editor, see “Exploring Flow Charts” on page 3-3.
2373_en_E
PHOENIX CONTACT
8-21
nanoNavigator
8.4.1
Creating the Brake Control Program
To begin creating the vehicle brake light control program, follow these steps:
1. Click the “Decision” button in the Block toolbar.
2. Click cell A1 to drop the Decision block (for more information on Decision blocks, see
“Branching Blocks” on page 3-14 and “Decision Block” on page 4-35).
nanoNavigator also supports drag-and-drop of a block from the toolbar to a cell in the flow
chart.
Click the “Control” button in the Block toolbar.
Click cell A2, and then repeat to place a Control block in cell B2 (for more information
on Control blocks, see “Action Blocks” on page 3-22 and “Control Block” on page 4-33).
m
3.
4.
lin
e
co
m
po
ne
nt
s.
co
Now, enter control information in each block. To do that, follow these steps:
1. Double-click the Decision block to display the “Decision Block... Configuration” tab (see
Figure 8-17). Use this dialog box to specify a True/False condition to test.
on
Figure 8-17
8-22
PHOENIX CONTACT
2.
3.
4.
5.
The “Decision Block... Configuration” tab
Use the “Data Type” drop-down list to select “Input”.
Use the “Data Item” drop-down list to select “I-02”.
Use the “Condition” drop-down list to select “ON”.
Click the “OK” button. Notice that the Decision block now displays “IS Input 02 ON”.
2373_en_E
Flow Chart Tutorial
Using Meaningful Data Item Names
on
lin
e
3.
4.
Click the plus (+) sign in front of “Input” to display available inputs. The number of inputs
that appear depends on the configuration of the nanoLC.
In the “Label” column, select “Input 02”.
With “Input 02” selected, type “Brake Input”. This is the new, friendly name for “Input
02”. Notice that this input has “I-02” in the “DI” column. This is the data item name used
on the nanoLC. In nanoNavigator, use either the “DI” or the friendly name in the “Label”
column. In most cases, nanoNavigator displays both names.
co
2.
The Data Item Editor initially displays all available data types
m
Figure 8-18
po
ne
nt
s.
co
m
nanoNavigator provides for the creation of meaningful names for inputs, outputs, and all
other data item types. To create meaningful names of up to 30 characters, use the Data Item
Editor. Follow these steps to create a meaningful name for Input 02:
1. Select the “View... Data Items” menu to display the Data Item Editor.
Friendly data item names aren’t stored or displayed on the nanoLC. On the nanoLC,
reference data items by the “DI” name.
5.
Continue naming data items needed, or wait and name them as programming
continues. For this tutorial, create the data items listed in Table 8-1.
For more information on Retentive data items, see “Duration, Preset, and Retentive
Values” on page 5-8. For more information on timers, see “Using Timers and Counters”
on page 5-11.
2373_en_E
PHOENIX CONTACT
8-23
nanoNavigator
Table 8-1
Data Items for Brake Control Example
Data Type
DI
Label
Retentive
Type
Duration
I-00
Left Turn Input
Input
I-01
Right Turn Input
Input
I-02
Brake Input
Input
I-03
Hazard Input
Output
O-00
Left Turn Output
Output
O-01
Left Brake Output
Output
O-02
Right Brake Output
Output
O-03
Right Turn Output
Timer/Counter
TC-00
Left Turn Timer
Y
Seconds
.800
Timer/Counter
TC-01
Right Turn Timer
Y
Seconds
.800
Timer/Counter
TC-02
Hazard Timer
Y
Seconds
.500
s.
co
m
Input
nt
Add Control Block Expressions to Brake Control
on
lin
e
co
m
po
ne
Now, return to the flow chart view to continue programming the Brake Control flow chart. In
this section, add expressions to the two Control blocks. Follow these steps:
1. Select the “Window... Flow chart 1” menu.
2. Double-click the Control block in cell A2 to display the “Control Block” dialog box.
3. In “Expression Item 1”, select the following from the drop-down lists:
– Data Type = Output
– Data Item = Left Brake Output
– Action = TurnOn
4. In “Expression Item 2”, select the following from the drop-down lists:
– Data Type = Output
– Data Item = Right Brake Output
– Action = TurnOn
5. Click the “OK” button.
6. Now, double-click the Control block in cell B2 to display its “Control Block” dialog box.
7. In “Expression Item 1”, select the following from the drop-down lists:
– Data Type = Output
– Data Item = Left Brake Output
– Action = TurnOff
8. In “Expression Item 2”, select the following from the drop-down lists:
– Data Type = Output
– Data Item = Right Brake Output
– Action = TurnOff
9. Click the “OK” button.
Now that all the blocks in the flow chart are defined, it’s time to connect them to show the
direction of flow.
Connect flow chart blocks at any time – before or after entering expressions in one or more
blocks.
8-24
PHOENIX CONTACT
2373_en_E
Flow Chart Tutorial
Connect Flow Chart Blocks
ne
nt
s.
co
m
In this section, connect the blocks to show how control flows from one block to another.
Follow these steps:
1. Hover the mouse pointer over the line extending out of the bottom of the Enable block.
The region around the exit point of the block highlights in a semi-circle with its center at
the exit line.
2. Click anywhere in the highlighted region.
3. Move the mouse pointer down to the top of the Decision block. A line extends out of the
exit point and grows as the mouse moves.
4. When the top of the Decision block highlights, click anywhere in the highlighted region
to define the end point of the connection.
5. From the bottom of the Decision block, click the exit region, and then click the entry
region of the Control block at A2.
6. From the bottom of the Control block at A2, click the exit region, move the mouse
pointer to the entry region of the Decision block at A1, and then click. nanoNavigator
automatically chooses the best route for the line.
7. From the right side of the Decision block, click the exit region, and then click the entry
region of the Control block at B2.
8. From the bottom of the Control block at B2, click the exit region. Move the mouse
pointer to the entry region of the Decision block at A1, and then click. nanoNavigator
automatically chooses the best route for the line.
on
lin
e
co
m
po
The completed flow chart should look like Figure 8-19.
Figure 8-19
2373_en_E
Brake control flow chart
PHOENIX CONTACT
8-25
nanoNavigator
Saving the Program
Now, save the flow chart program. Follow these steps:
1. Select the “File... Save Flow Chart” menu.
2. In the “Flow Chart Name” dialog box, enter “BrakeControl”.
3. Click the “OK” button.
8.4.2
Creating Left Turn Flow Chart
Table 8-2
Left Turn Flow Chart Blocks
co
m
Create the left turn flow chart using the same techniques described in creating the brake
control flow chart. Follow these steps:
1. Select the “File... New Flow Chart” menu.
2. Use Table 8-2 to create the flow chart blocks and enter expressions in each block.
Cell
Expression 1
Decision
A1
Input; “Left Turn Input”; ON
Control
B1
Timer/Counter; “Left Turn
Timer”; Stop
Control
A2
Output; “Left Turn Output”;
TurnOn
Decision
A3
Timer/Counter; “Left Turn
Timer”; Done
Decision
B3
Input; “Left Turn Input”; ON
Control
A4
Output; “Left Turn Output”;
TurnOff
lin
e
Decision
nt
Timer/Counter; “Left Turn
Timer”; Done
B6
Input; “Left Turn Input”; ON
C6
Output, “Left Turn Output”;
TurnOff
Timer/Counter; “Left Turn
Timer”; Restart
Timer/Counter; “Left Turn
Timer”; Restart
on
Control
ne
po
m
A5
co
Decision
Expression 2
s.
Block Type
8-26
PHOENIX CONTACT
2373_en_E
Flow Chart Tutorial
Connect the flow chart blocks as indicated in Table 8-3.
Table 8-3
Flow Line Connections
Cell
From Bottom
A0
X
A1
X
From Right
To
A1
A2
A1
X
B1
B1
X
A1
A2
X
A3
A3
X
A4
X
B3
X
X
A4
X
A5
X
X
B6
X
ne
B6
nt
A5
s.
B3
co
A3
X
X
B3
A3
C6
A5
A1
B6
C6
A5
A1
on
lin
e
co
m
po
C6
m
3.
2373_en_E
PHOENIX CONTACT
8-27
nanoNavigator
on
lin
e
co
m
po
ne
nt
s.
co
m
The completed flow chart should look like Figure 8-20 and Figure 8-21. If the flow lines don’t
look like this, see “Manually Creating Flow Lines” below. Be sure to save the flow chart and
give it a descriptive name, like “LeftTurn”.
Figure 8-20
8-28
PHOENIX CONTACT
Completed “LeftTurn” flow chart (top half)
2373_en_E
co
m
po
ne
nt
s.
co
m
Flow Chart Tutorial
Completed “LeftTurn” flow chart (bottom half)
lin
e
Figure 8-21
on
Manually Creating Flow Lines
2373_en_E
If any automatic routing decisions that nanoNavigator makes aren’t adequate, delete the
flow line and manually create a new one. For example, if the route from C6 to A1 is
confusing, do the following:
1. Select the line by clicking anywhere along it. When selected, the line highlights (red by
default).
2. Press the <Delete> key to delete the line.
3. Click the exit region of block C6, and notice that a grid of light-colored (orange by
default) squares appear (nine per cell).
4. Click the square in the lower-right corner of cell C6.
5. If necessary, scroll up to view row 2.
6. Click the square in the lower-right corner of cell C0.
7. Click the square in the center-bottom of cell A0.
8. Click the top of the Decision block in A1 to complete the flow line.
PHOENIX CONTACT
8-29
nanoNavigator
Displaying Output – Creating Messages
To view what the project is doing, it is easy to set up messages to display on the optional
nanoLC Operator Panel. If the nanoLC does not include an Operator Panel, this section may
still be worthwhile to see how operators can interact with the display and keys. To create the
display flow chart program, follow these steps:
1. Select the “View... Data Items” menu to display the Data Item Editor.
2. Click the plus button in front of “Display Messages” to view the 31 available message
items.
3. Change the message item “Label” and “Type” for the first nine message items as shown
in Table 8-4.
Label
M-00
Background
M-01
LeftTurnOff
M-02
LeftTurnOn
M-03
RightTurnOff
M-04
RightTurnOn
M-05
LeftBrakeOff
ne
LeftBrakeOn
RightBrakeOff
m
M-07
RightBrakeOn
co
Select the “View... Messages” menu to open the Message Editor. The Message Editor
defines messages that a control program can write to the optional Operator Panel.
Messages may also define inputs that the operator needs to provide via the built-in
Operator Panel keys.
Leave the first line of the message blank, and leave the “Clear Line” check box selected
(selected by default) for line 1.
lin
e
4.
Time of Day
po
M-06
M-08
Type
nt
Data Item
co
Message Data Items
s.
Table 8-4
m
“Type” refers to the input type expected in response to a displayed message. The
operator provides input via nanoLC Operator Panel keys.
on
5.
When a flow chart program executes a Message block, the entire message is written to
the display. Only pixels specifically highlighted get written. The “Clear Line” check box
(selected by default) causes the nanoLC to clear the entire line before writing the new data
to the display. For more information about the Message Editor, see “Using the Message
Editor” on page 3-31.
6.
7.
8-30
PHOENIX CONTACT
In the second and third line, enter the letters “nano” centered (beginning with the ninth
pixel). Clear the “Clear Line” check box for both lines\.
In the fourth line, position the highlighted box in the eleventh position, and then use the
“Insert Data Entry Item” group to do the following:
– Use the “Return Type” drop-down list to select “Time of Day”.
– Click the “Insert” button.
2373_en_E
Flow Chart Tutorial
The message should look like Figure 8-22. Click the “Save” button.
on
lin
e
co
m
po
ne
nt
s.
co
m
8.
2373_en_E
Figure 8-22
Message M-00, Background
9. Use the “Current Message” drop-down list to select “M-01, LeftTurnOff”.
10. Leave the first and fourth lines blank, and clear the “Clear Line” check boxes (selected
by default).
PHOENIX CONTACT
8-31
nanoNavigator
on
lin
e
co
m
po
ne
nt
s.
co
m
11. In the second and third lines, enter a “space” in the first three pixels. Figure 8-23 shows
the resulting Message Editor.
8-32
PHOENIX CONTACT
Figure 8-23
Message M-01, LeftTurnOff
12. Click the “Save” button.
13. Use the “Current Message” drop-down list to select “M-02, LeftTurnOn”.
14. Leave the first and fourth lines blank, and clear the “Clear Line” check boxes (selected
by default).
2373_en_E
Flow Chart Tutorial
on
lin
e
co
m
po
ne
nt
s.
co
m
15. In the second and third lines, use the “Insert Symbol” keys to enter a the left-pointing
arrow in the first three pixels. Figure 8-24 shows the resulting Message Editor.
2373_en_E
Figure 8-24
Message M-02, LeftTurnOn
16. Follow the same procedure to create the “RightTurnOff” and “RightTurnOn” messages
with right-pointing arrows on the right side of the message display.
17. Follow similar procedures to create the “LeftBrakeOff” and “RightBrakeOff” messages.
For “LeftBrakeOff” message, enter the “space” keys in the fifth through seventh pixels
in the second and third lines. For the “RightBrakeOff” message, use the fifth through
seventh pixels counting from the right-side of the display.
PHOENIX CONTACT
8-33
nanoNavigator
on
lin
e
co
m
po
ne
nt
s.
co
m
18. Follow similar procedures to create the “LeftBrakeOn” and “RightBrakeOn” messages.
For “LeftBrakeOn” message, enter the up-arrow symbol key in the fifth through seventh
pixels in the second line and the down-arrow symbol key in the same pixels in the third
line. For the “RightBrakeOn” message, use the fifth through seventh pixels counting
from the right-side of the display. Figure 8-25 shows the resulting Message Editor.
Figure 8-25
Message M-08, RightBrakeOn
Displaying Messages – Creating the Flow Chart
After defining messages, create a flow chart that displays appropriate messages depending
on the state of data items during project execution.
1. Create a new flow chart.
2. In cell A1, enter a Message block.
3. Double-click the Message block and select the message, “M-00 Background” as the
“Message #”.
4. Enter a Decision block in the following cells: A2, B2, C2, and D2.
5. Enter a Control block in the following cells: A3, B3, C3, and D3.
8-34
PHOENIX CONTACT
2373_en_E
Flow Chart Tutorial
Enter the expressions and connect the blocks as shown in Figure 8-26.
m
po
ne
nt
s.
co
m
6.
The top half of the display flow chart
on
lin
e
co
Figure 8-26
2373_en_E
PHOENIX CONTACT
8-35
nanoNavigator
Complete the bottom half of the flow chart as shown in Figure 8-27.
on
lin
e
co
m
po
ne
nt
s.
co
m
7.
Figure 8-27
8-36
PHOENIX CONTACT
The bottom half of the display flow chart.
2373_en_E
Flow Chart Tutorial
8.
9.
Connect the flow from the exit of the Message blocks in cell A9 and B9 to the input of
the Decision block at cell A2.
Save the flow chart with the name “Display”.
At this point, it is time to begin verifying the project. It is good programming practice to verify
modules one at a time rather than waiting until all the flow charts in the project are ready.
In this case, verifying could have begun with part of the Display flow chart and either the
BrakeControl or LeftTurn flow charts finished. For this tutorial, however, working on both
BrakeControl and LeftTurn prior to writing the complete Display flow chart provided more
experience with flow charting and the Flow Chart Editor.
m
To verify the project in its current state, go forward to “Downloading and Verifying the
Project” before returning to “Completing the Project”.
co
Completing the Project
Downloading and Verifying the Project
nt
8.5
s.
As an exercise, create a RightTurn flow chart and a Hazard flow chart using concepts
learned. Use the LeftTurn flow chart as an example of what is required.
po
ne
After completing the project, or enough of it to begin verifying, save the project (use the
“File... Save Project” menu). Then, there are two choices for verifying:
– Download the project to a connected nanoLC and verify it there.
– Connect and verify the project using the simulator.
Downloading the Project
co
8.5.1
m
The following sections go through both options.
on
lin
e
Downloading a project to a connected nanoLC is simple. Follow these steps:
1. If nanoNavigator is not connected to the nanoLC, follow the instructions in “Connecting
to a nanoLC” on page 2-13.
2. Do one of the following:
– Select the “nanoLC... Download”. nanoNavigator automatically makes the logical
connection to the nanoLC. Click the “OK” button in the message dialog box.
– Select the “nanoLC... Download & Go” menu. nanoNavigator automatically makes
the logical connection to the nanoLC and begins execution after downloading the
project.
2373_en_E
PHOENIX CONTACT
8-37
nanoNavigator
po
The “Project Information... Messages” tab with error information
on
lin
e
co
m
Figure 8-28
ne
nt
s.
co
m
That’s it, unless nanoNavigator detects an error while preparing the download. If an error
occurs, nanoNavigator displays the “Project Information... Messages” tab with a list of
messages nanoNavigator creates as it verifies the project.
8-38
PHOENIX CONTACT
2373_en_E
Flow Chart Tutorial
8.5.2
Connecting to the Simulator
To simulate a project, select the “nanoLC... Simulate Project” menu or click the “Simulator”
button on the standard toolbar. This displays the “nanoLC Monitor” window. If a flow chart
is open when started, the simulator displays all the data items referenced in that flow chart.
m
po
ne
nt
s.
co
m
Simulator
Button
co
Figure 8-29
Simulator with data items displayed
lin
e
To begin simulation, click the “Start” button. Table 8-5 lists the buttons used to control the
nanoLC simulator.
on
Table 8-5
2373_en_E
Simulator buttons
Button
Description
Stop
Stops the currently executing project. Click the “Start” button to restart the
project from the beginning.
Pause
Pause the currently executing project. Click the “Resume”, “1 Scan”, or “1
Step” to resume project execution from the point where it was paused.
Resume
Resumes a paused project.
1 Scan
Resumes a paused project for one complete scan.
1 Step
Resumes a paused project for execution of one block in each currently
executing flow chart.
PHOENIX CONTACT
8-39
nanoNavigator
Monitoring Execution in the Simulator
The monitoring features of the simulator are the same as those available for monitoring a
project executing on a nanoLC. For a description of how to monitor, cross-reference, and
force data items, see “Monitoring the Project” on page 8-42. That section also describes
execution tracking in FlowView.
Additional Simulator Features
co
m
The top of the simulator window (see Figure 8-29) has buttons that you can click to simulate
operator input. The buttons are labeled “0” through “9”, plus the four arrow and “OK” buttons.
There are additional squares (initially gray colored) that simulate inputs to the base unit and
any configured I/O Expansion modules. To simulate input do one of the following:
– Clicking one of the inputs turns it green for as long as you hold the mouse button.
– Right-clicking one the inputs turns it green and latches it ON. Right-click again to turn it
OFF.
on
lin
e
co
m
po
ne
nt
s.
Simulated outputs appear as dark red squares when the output is OFF and bright red when
the output is ON. In addition, there is an area of the simulator that mimics any outputs to the
optional LCD. Figure 8-30 shows the simulator with the “Brake Switch” data item turned ON.
8-40
PHOENIX CONTACT
2373_en_E
Flow Chart Tutorial
on
lin
e
co
m
po
ne
nt
s.
co
m
The result is that the LCD mimics brake lights on both sides of the vehicle and the outputs
Q-01 and Q-02 are ON. The green flow chart elements show the current execution path in
the BrakeControl flow chart.
2373_en_E
Figure 8-30
Simulation of the nanoLights project
PHOENIX CONTACT
8-41
nanoNavigator
8.5.3
Monitoring the Project
Once nanoLC has a project downloaded to it, nanoNavigator can start, stop, and monitor its
execution by viewing flow charts and data items. nanoNavigator can even modify data
items, inputs, and outputs.
To monitor the project, follow these steps:
1. Select the “nanoLC... Run” menu.
2. Select the “nanoLC... Start Monitoring” menu or click the “Start Monitoring” button on
the Main toolbar. This displays the “nanoLC Monitor” window (see Figure 8-31). For
more information about this window and how to use it, see “nanoLC Monitor Window”
on page 7-4.
m
Start
Monitoring
Button
co
m
po
ne
nt
s.
co
When attempting to monitor a stopped project, nanoNavigator provides the opportunity to
automatically begin execution on the nanoLC.
The “nanoLC Monitor... Flow Charts” tab
lin
e
Figure 8-31
on
The “nanoLC Monitor... Flow Charts” tab displays the status of all data items in the current
flow chart. For more information, see “Charts Tab” on page 7-4.
Select any block in the flow chart to display data item values in that block. This also brings
the “nanoLC Monitor... Blocks” tab to the front. For more information, see “Block or Element
Tab” on page 7-6.
Execution Tracking
Use nanoNavigator to view the execution track of any flow chart in the project. In Monitor
mode, open flow charts automatically provide execution tracking. Execution tracking is the
display of color-coded blocks to indicate whether or not blocks were recently executed. The
color coding is:
– Green: Always executed on every scan
– Yellow: Sometimes executed
– Gray: Never executed
8-42
PHOENIX CONTACT
2373_en_E
Flow Chart Tutorial
po
ne
nt
s.
co
m
When entering Monitor mode, nanoNavigator continues to display whatever is in the
workspace. To open a chart, use the Chart Explorer. To do this:
1. Select the “View... Chart Explorer” menu to display the Chart Explorer. In Monitor mode,
the Chart Explorer has two additional columns of information. The first gives the status
of each chart (enabled, waiting), the second provides the cell and type of block that last
executed at the end of the most recent scan.
Either double-click one of the charts in the list, or select a chart and click the “Open”
button at the bottom of the window. In either case, the chart opens.
co
2.
The Chart Explorer
m
Figure 8-32
lin
e
Alternatively, select the “File... Open Chart...” menu, and then select a flow chart from the
cascade menu.
on
8.5.4
Verifying a Project
In addition to viewing flow charts with their execution track and data item values as they
change dynamically, nanoNavigator can force data values to cause flow chart execution to
take different paths. Another important tool to verify and correct projects is the ability to
cross-reference all locations where a data item appears in the project. This section shows
how to use these two important tools.
Forcing Data Items
nanoNavigator can force input, output, and flag data items. When a data item has a forced
value, the value won’t change due to different input states or under program control. This
provides a valuable capability to verify a project.
Be sure to remove all forces before running a project in a production environment.
Use the “nanoLC Monitor” window (see Figure 8-31 on page 8-42) to force data item values
with either the “Flow Charts” or “Blocks” tab. To force a data item value, follow these steps:
2373_en_E
PHOENIX CONTACT
8-43
nanoNavigator
1.
2.
With the project running and in Monitor mode, view the “nanoLC Monitor” window.
Using either the “Flow Charts” or “Blocks” tab, right-click anywhere in the row of the data
item to force.
Table 8-6 list the force options available depending on the type of data item.
Table 8-6
Force options available depending on data item type
Setting
Description
Input
Force ON
Sets the Input bit ON (see “Forcing Data
Values” on page 7-7).
Force OFF
Sets the Input bit OFF (see “Forcing Data
Values” on page 7-7).
UnForce
Removes Force setting.
Turn ON
Sets the output or flag bit ON. The value
can change under program control.
Turn OFF
Sets the output or flag bit OFF. The value
can change under program control.
co
Sets the output bit or flag ON (see “Forcing
Data Values” on page 7-7).
nt
Force ON
s.
Outputs and Flags
m
Type of Data Item
Sets the output bit or flag OFF (see “Forcing
Data Values” on page 7-7).
UnForce
Removes Force setting.
Set Value
Displays a pop-up dialog box that permits
setting a value for the register or
timer/counter.
Zero Value
Sets the register or timer/counter to zero.
po
m
Registers and
Timer/Counters
ne
Force OFF
on
lin
e
co
Using the “nanoLC Monitor... Forces” tab permits viewing all forced items.
Figure 8-33
8-44
PHOENIX CONTACT
The “nanoLC Monitor... Forces” tab
2373_en_E
Flow Chart Tutorial
Cross-Referencing Data Items
Cross-referencing data items is an important tool to use when verifying a project. Examples
of when to use cross-references:
– While monitoring a data item, the value changes unexpectedly
– When intending to force a data item and wanting to identify everywhere the data item is
used
– Changing a flow chart and impacting a data item... wanting to identify everywhere the
data item is used
m
po
ne
nt
s.
co
m
To cross-reference a data item, follow these steps:
1. With the project running and in Monitor mode, view the “nanoLC Monitor” window.
2. Using either the “Flow Charts” or “Blocks” tab, click the “XRef” hyperlink. This displays
the “Project Information... Cross-Reference” tab.
co
Figure 8-34
The “Project Information... Cross-Reference” tab
lin
e
The “Project Information... Cross-Reference” tab displays all locations that reference or
modify the selected data item. The “Type” is either “Flow Chart” or “Message”.
on
To quickly access any listed reference, double-click anywhere in the row. nanoNavigator
automatically opens the flow chart or Message Editor and displays the address.
2373_en_E
PHOENIX CONTACT
8-45
on
lin
e
co
m
po
ne
nt
s.
co
m
nanoNavigator
8-46
PHOENIX CONTACT
2373_en_E
A Technical Appendix – Setting Preferences
This section is for advanced users who are interested in customizing the appearance of
nanoNavigator. If satisfied with the default colors, fonts, and font sizes, there is no need to
modify any of the preferences.
General Tab
co
A1
m
The “File... Preferences...” menu displays the multi-tab ”Preferences” dialog box. Each tab
provides a set of options that configures how nanoNavigator appears on the screen. The
following sections describe each tab of the “Preferences” dialog box.
on
lin
e
co
m
po
ne
nt
s.
The “Preferences... General” tab (see Figure A-1) permits specification of options for the
Toolbar, Chart Explorer window, and Message Editor.
Figure A-1
2373_en_E
“Preferences... General” tab
PHOENIX CONTACT
A-1
nanoNavigator
A 1.1
Block Toolbar Options
This group provides the following options:
– “Show Toolbar Labels” – Select this check box to have labels appear under toolbar
buttons (the default). Clear the check box to remove the labels.
– “Toolbar Icons” – Select either large or small buttons by selecting the corresponding
radio button.
Chart Explorer
m
A 1.2
Message Editor
ne
A 1.3
nt
s.
co
The options in this group permit modification of text font, size, style, and color, as well as the
background color used for the Chart Explorer. Click the corresponding “Edit” button to
modify current settings. The “Edit” buttons associated with font selection display a standard
font selection dialog box. The “Edit” buttons associated with color selection display a color
picker dialog box. For a description of the ways to use the color picker, see “Designer Colors
Tab” on page A-5.
on
lin
e
co
m
po
The options in this group permit modification of text font, size, style, and color, as well as the
background color used for the Message Editor. Click the corresponding “Edit” button to
modify current settings. The Edit” buttons associated with font selection display a standard
font selection dialog box. The Edit” buttons associated with color selection display a color
picker dialog box. For a description of the ways to use the color picker, see “Designer Colors
Tab” on page A-5.
A-2
PHOENIX CONTACT
2373_en_E
A2
Designer Options Tab
lin
e
co
m
po
ne
nt
s.
co
m
The “Preferences... Designer Options” tab (see Figure A-2) permits specification of various
Chart Editor options.
on
Figure A-2
2373_en_E
A 2.1
“Preferences... Designer Options” tab
General
When selected, the options available in the General group do the following:
– “Show Grid Lines” – Displays grid lines in the Chart Editor.
– “Show Connection Anchors” – Displays valid anchor positions on all blocks and in the
drawing area when in Connect mode.
PHOENIX CONTACT
A-3
nanoNavigator
–
A 2.2
co
m
–
“Connection Crossing” – This group permits choosing one of the following options for
handling connection lines that cross:
– Select the “File... Open Chart... “ menu, and then select a flow chart from the
cascade menu.
– “None” – Crossing lines intersect without special graphic effects.
– “Hop Over” – One line appears to hop over the other.
– “Dive Under” – A gap appears in one line to show that it is under the other.
“Always show five columns at 100% zoom” – When selected, this check box causes the
Flow Chart Editor and Ladder Chart Editor to display five columns regardless of the
window size.
Rulers
on
lin
e
co
m
po
ne
nt
s.
The Rulers group provides the following options:
– “Show Rulers” – Displays horizontal and vertical rulers (column and row labels) along
the edge of the drawing area.
– “Ruler Options” – Provides options for background color, text color, line color, and font.
The Edit button associated with font selection displays a standard font selection dialog
box. The “Edit” buttons associated with color selection display a color picker dialog box.
For a description of the ways to use the color picker, see “Designer Colors Tab” on
page A-5.
A-4
PHOENIX CONTACT
2373_en_E
A3
Designer Colors Tab
lin
e
co
m
po
ne
nt
s.
co
m
The “Preferences... Designer Colors” tab permits selection of default colors for various
designer features (see Figure A-3).
on
Figure A-3
2373_en_E
“Preferences... Designer Colors” tab
To change the color for any feature, click the “Edit” button to display a color picker dialog
box with pre-defined colors. For additional color choices, click the “More Colors” link at the
bottom of the dialog box to display the “Color” dialog box. This dialog box repeats the basic
PHOENIX CONTACT
A-5
nanoNavigator
“Color” dialog box after clicking “Define Custom Color” button
co
Figure A-4
m
po
ne
nt
s.
co
m
colors, provides quick selection of previously defined custom colors, and provides a “Define
Custom Colors” button that expands the “Color” dialog box for custom color definition (see
Figure A-4).
on
lin
e
To add a custom color, do one of the following, and then click the “Add to Custom Colors”
button:
– Click in the color rectangle to get in the general area of the color of interest, and then
use the vertical slide to refine the selection. The rectangle pick selects “Red”, “Green”,
“Blue” (RGB) and “Hue”, “Sat” (saturation), and “Lum” (luminosity) values. The vertical
slider adjusts the luminosity (and RGB), while holding hue and saturation constant.
– Enter RGB values.
– Enter “Hue”, “Sat”, and “Lum” values.
Once defined, custom colors remain available in the “Color” dialog box until nanoNavigator
closes and reopens.
It is possible to add up to 16 custom colors, which appear in the “Custom Colors” squares
below the pre-defined “Basic Colors”.
A-6
PHOENIX CONTACT
2373_en_E
A4
Block Colors Tab
lin
e
co
m
po
ne
nt
s.
co
m
Use the “Preferences... Block Colors” tab (see Figure A-5) to define the appearance of flow
chart blocks.
on
Figure A-5
2373_en_E
“Preferences... Block Colors” tab
Select the “Fill Blocks with color” check box to use the color information on this tab. When
this box is cleared, all flow chart blocks have a white background. This tab provides options
for text and number fonts and colors for block borders, text, selected block, and selected
text. There are also separate block fill options for each of the block types. The “Edit” buttons
associated with font selections display a standard font selection dialog box. The “Edit”
buttons associated with color selection display a color picker dialog box. For a description
of the ways to use the color picker, see “Designer Colors Tab” on page A-5.
PHOENIX CONTACT
A-7
nanoNavigator
A5
Data Item Editor Tab
lin
e
co
m
po
ne
nt
s.
co
m
Use the “Preferences... Data Item Editor” tab (Figure A-6) to define the appearance of the
Data Item Editor.
on
Figure A-6
A-8
PHOENIX CONTACT
“Preferences... Data Item Editor” tab
This tab provides options for fonts and colors for the background, grid background, grid font
color, and header font and background color. The “Edit” buttons associated with font
selections display a standard font selection dialog box. The “Edit” buttons associated with
color selection display a color picker dialog box. For a description of the ways to use the
color picker, see “Designer Colors Tab” on page A-5.
2373_en_E
A6
Debug Tab
lin
e
co
m
po
ne
nt
s.
co
m
Use the “Preferences... Debug” tab (Figure A-6) to define the appearance of the Flow Chart
blocks and forced data item values in the "nanoLC Monitor" window (see “nanoLC Monitor
Window” on page 7-4) when monitoring an executing project.
on
Figure A-7
2373_en_E
“Preferences... Debug” tab
This tab provides options for fonts, colors, and grid for the "nanoLC Monitor" window. It also
provides options for Monitor mode block colors. The “Edit” buttons associated with font
selections display a standard font selection dialog box. The “Edit” buttons associated with
color selection display a color picker dialog box. For a description of the ways to use the
color picker, see “Designer Colors Tab” on page A-5.
PHOENIX CONTACT
A-9
nanoNavigator
A7
Changes Made
po
ne
nt
s.
co
m
The “Changes Made” dialog box (see Figure A-8) appears whenever there are changes to
one or more preferences. Click the “OK” button to close the dialog box. This dialog box
provides options to specify how to handle changes.
The “Changes Made” dialog box
m
Figure A-8
on
lin
e
co
Although the available options appear in two groups, only one option in the dialog box can
be selected. The options are self-explanatory.
A-10
PHOENIX CONTACT
2373_en_E
B Technical Appendix – System Flags
nanoLC has predefined system flags that provide status information during project
execution. These flags are available through nanoNavigator. The flags that appear in the
Data Item Editor depend on the configuration options specified.
Base Unit Flags
m
B1
Table B-1
co
There are eight flags associated with the base unit. They are:
Base Unit Flags
Name
Description
F-64
Real Time Clock Fault
True if RTC is missing at startup, or missing at one
hour check
F-65
Real Time Clock Battery
Low
F-66
Operator Display Fault
True if Operator Panel is not present
F-67
Comm. Expansion Fault
True if Communication Expansion Module is not
present
F-68
Serial Modbus RTU
Timeout
nt
s.
Flag
ne
po
m
F-69
Reserved 1
Always OFF
F-70
Reserved 2
Always OFF
nanoLC Stopped
Used by Modbus hosts
lin
e
co
True if Modbus RTU Timeout Value != 0; and
A Modbus RTU Command has been received
since startup; and
The timeout value was exceeded between
Modbus commands
on
F-71
B2
Ethernet Flags
There are 32 flags associated with the Ethernet module. They are:
Table B-2
2373_en_E
True if RTC is present and battery is low
Ethernet Flags
Flag
Name
Description
F-72
ETH Set Read-Only Mode
Sets all data items to be read-only when
accessed through the Ethernet port
F-73
ETH Command 01 (Reserved)
Reserved for future use
F-74
ETH Disable Port
Disables the Ethernet port from remote
access from outside network sources
F-75
ETH Request DHCP
Requests the Ethernet module to enter a
mode asking for an IP Address from a
DHCP server
PHOENIX CONTACT
B-1
nanoNavigator
Ethernet Flags
Name
Description
F-76
ETH Request BOOTP
Requests the Ethernet module to enter a
mode asking for an IP Address from a
BOOTP server
F-77
ETH Enable Web Access
Allows the Ethernet module’s web server to
be accessed from a network connection
F-78
ETH Reset to Factory Default
Resets the Ethernet module’s
configuration data to the factory default
settings. The IP Address is also reset to
0.0.0.0
F-79
ETH Command 07 (Reserved)
Reserved for future use
F-80
ETH Command 08 (Reserved)
Reserved for future use
F-81
ETH Boot Request
F-82
ETH Reset Request
F-83
ETH Command 11 (Reserved)
Reserved for future use
F-84
ETH Command 12 (Reserved)
Reserved for future use
F-85
ETH Command 13 (Reserved)
Reserved for future use
F-86
ETH Command 14 (Reserved)
Reserved for future use
F-87
ETH Command 15 (Reserved)
Reserved for future use
F-88
ETH Module OK
The Ethernet module is operating properly
F-89
ETH Connection Established
A Modbus/TCP Ethernet connection has
been established from a host computer
F-90
ETH Write Data Watchdog
The Watchdog timer has expired without
receiving a Write command from any
connected Modbus/TCP host computer
F-91
ETH DHCP Failed
The Ethernet module is configured to
obtain its address from a DHCP server, but
either the assignment failed or a DHCP
server is not present on the network
F-92
ETH BOOTP Failed
The Ethernet module is configured to
obtain its address from a BOOTP server,
but either the assignment failed or a
BOOTP server is not present on the
network
F-93
ETH IP Conflict
Another device on the network has the
same IP address as this Ethernet module
F-94
ETH Status 06 (Reserved)
Reserved for future use
F-95
ETH Status 07 (Reserved)
Reserved for future use
F-96
ETH Status 08 (Reserved)
Reserved for future use
F-97
ETH Status 09 (Reserved)
Reserved for future use
F-98
ETH Status 10 (Reserved)
Reserved for future use
PHOENIX CONTACT
s.
Requests the Ethernet module to stop
communicating to the base to allow the
base module to enter bootloader mode.
nt
ne
po
co
lin
e
on
B-2
co
m
Flag
m
Table B-2
Requests the Ethernet module reset itself
to the stored settings
2373_en_E
Table B-2
Ethernet Flags
Name
Description
F-99
ETH Status 11 (Reserved)
Reserved for future use
F-100
ETH Status 12 (Reserved)
Reserved for future use
F-101
ETH Status 13 (Reserved)
Reserved for future use
F-102
ETH Status 14 (Reserved)
Reserved for future use
F-103
ETH Status 15 (Reserved)
Reserved for future use
on
lin
e
co
m
po
ne
nt
s.
co
m
Flag
2373_en_E
PHOENIX CONTACT
B-3
on
lin
e
co
m
po
ne
nt
s.
co
m
nanoNavigator
B-4
PHOENIX CONTACT
2373_en_E
C Technical Appendix – Analog Device Scaling
This appendix describes the scaling formula and shows examples of scaling provided by
analog devices on the nanoLC.
Voltage values were read with a Fluke® digital volt meter with voltages applied by a 0 –
10-volt potentiometer. Current values were applied with a regulated DC power supply.
Voltage and Current sample settings shown below.
Scaling Formula
s.
C1
co
m
These are sample values. Your values may be slightly different or exactly the same based
on the input device type.
nt
Adding scaling to the inputs differs from the “No Scaling Applied” table. Scaling is applied
to each input with the default being 0-4095. The base firmware will calculate the new integer
values based on the scaling applied.
m
po
ne
Variable names:
– ”LowScale” is the value entered as “Scaling Lower Value.” This is the scaled value that
equates to the low limit of the range (i.e., reading 0 V for a 0-10 V range).
– “HighScale” is the value entered as “Scaling Upper Value.” This is the scaled value that
equates to the high limit of the range (i.e., reading 10 V for a 0-10 V range).
– DataValue = Value read from the analog module - This value is always in the range of
0 to 4095 (0 for low limit of range and 4095 for high limit of range).
co
With scaling applied, values in analog inputs are the “ScaledDataValue” and not the actual
“DataValue”.
lin
e
To illustrate the formula with an example, assume that “DataValue” with no scaling and a 5 V
input provides an “ActualDataValue” of 2048. A “DataValue” with 0 to 1000 scaling and a 5 V
input provides a “ScaledDataValue’ of 500.
on
The formula for the “ScaledDataValue” is:
ScaledData Value = ((( HighScale - LowScale) * DataValue) / 4096) + LowScale
For example:
If “LowScale” = 0 and “HighScale” = 100 and “DataValue” = 1024 (i.e. reading 2.5 V on a
0-10 V range),
ScaledDataValue = ((( 100 - 0) * 1024) / 4096) + 0 = 25
If “LowScale” = 1000 and HighScale = 10000 and DataValue = 1024 (i.e. reading 2.5 V on
a 0-10 V range)
ScaledDataValue = ((( 10000 -1000) * 1024) / 4096) + 1000 = 3250
If “LowScale” = 100 and “HighScale” = 0 and “DataValue” = 1024 (i.e. reading 2.5 V on a
0-10 V range)
ScaledDataValue = ((( 0 - 100) * 1024) / 4096) + 100 = 75
2373_en_E
PHOENIX CONTACT
C-1
nanoNavigator
C2
No Scaling Applied Example
Table C-1
Default scaling at 0 to 4095
4 to 20 mA
0 to 10 V
-10 to +10 V
0
4 mA = 0
0V = 0
-10 V = 0
5 mA = 264
1 V = 412
-8 V = 448
6 mA = 516
2 V = 824
-6 V = 848
8 mA = 1022
3 V = 1236
-4 V = 1248
10 mA = 1530 4 V = 1648
-2 V = 1648
co
12 mA = 2048 5 V = 2048
0 V = 2048
14 mA = 2567 6 V = 2476
2 V = 2458
s.
2048
nt
6 V = 3284
19 mA = 3837 9 V = 3714
8 V = 3698
20 mA = 4095 10 V = 4095
10 V = 4095
po
Scaling set to 70 to 90
0 to 10 V
-10 to +10 V
70
4 mA = 70
0 V = 70
-10 V = 70
5 mA = 71
1 V = 72
-8 V = 72
6 mA = 72
2 V = 74
-6 V = 74
8 mA = 74
3 V = 76
-4 V = 76
10 mA = 77
4 V = 78
-2 V = 78
12 mA = 80
5 V = 80
0 V = 80
14 mA = 82
6 V = 82
2 V = 82
16 mA = 84
7 V = 84
4 V = 84
18 mA = 87
8 V = 86
6 V = 86
19 mA = 88
9 V = 88
8 V = 88
20 mA = 90
10 V = 90
10 V = 90
co
4 to 20 mA
lin
e
on
PHOENIX CONTACT
18 mA = 3578 8 V = 3304
Device Range/
Integer Value
80
90
C-2
4 V = 2872
Scaling Applied Examples
m
Table C-2
16 mA = 3073 7 V = 2894
ne
4095
C3
m
Device Range/
Integer Value
2373_en_E
Table C-3
Scaling set to 0 to 1000
4 to 20 mA
0 to 10 V
-10 to +10 V
0
4 mA = 0
0V = 0
-10 V = 0
-4 V = 300
10 mA = 374
4 V = 400
-2 V = 400
12 mA = 500
5 V = 500
0 V = 500
14 mA = 626
6 V = 600
2 V = 600
16 mA = 749
7 V = 700
4 V = 700
18 mA = 873
8 V = 800
19 mA = 937
9 V = 900
s.
co
3 V = 300
6 V = 800
8 V = 900
10 V = 1000
4 to 20 mA
po
0 to 10 V
-10 to +10 V
4 mA = 0
0V = 0
-10 V = 0
5 mA = 0
1V = 1
-8 V = 1
6 mA = 1
2V = 2
-6 V = 2
8 mA = 2
3V = 3
-4 V = 3
10 mA = 3
4V = 4
-2 V = 4
12 mA = 5
5V = 5
0V = 5
14 mA = 6
6V = 6
2V = 6
16 mA = 7
7V = 7
3V = 7
18 mA = 8
8V = 8
4V = 8
19 mA = 9
9V = 9
5V = 9
20 mA = 10
10 V = 10
10 V = 10
m
co
lin
e
on
2373_en_E
8 mA = 249
Scaling set to 0 to 10
Device Range/
Integer Value
10
-6 V = 200
20 mA = 1000 10 V = 1000
Table C-4
5
-8 V = 100
2 V = 200
ne
1000
0
1 V = 100
6 mA = 125
nt
500
5 mA = 64
m
Device Range/
Integer Value
PHOENIX CONTACT
C-3
nanoNavigator
Table C-5
Scaling set to 0 to 2000
4 to 20 mA
0 to 10 V
-10 to +10 V
0
4 mA = 0
0V = 0
-10 V = 0
5 mA = 128
1 V = 200
-8 V = 200
6 mA = 252
2 V = 400
-6 V = 400
8 mA = 499
3 V = 600
-4 V = 600
10 mA = 748
4 V = 800
-2 V = 800
12 mA = 1000 5 V = 1000
14 mA = 1253 6 V = 1200
2 V = 1200
16 mA = 1499 7 V = 1400
4 V = 1400
s.
18 mA = 1747 8 V = 1600
nt
m
co
lin
e
on
C-4
PHOENIX CONTACT
8 V = 1800
10 V = 2000
Scaling set to 100 to 1000
Device Range/
Integer Value
1000
19 mA = 1874 9 V = 1800
20 mA = 2000 10 V = 2000
po
Table C-6
550
6 V = 1600
ne
2000
100
0 V = 1000
co
1000
m
Device Range/
Integer Value
4 to 20 mA
0 to 10 V
-10 to +10 V
4 mA = 100
0 V = 100
-10 V = 100
5 mA = 158
1 V = 190
-8 V = 190
6 mA = 213
2 V = 280
-6 V = 280
8 mA = 324
3 V = 370
-4 V = 370
10 mA = 436
4 V = 460
-2 V = 460
12 mA = 550
5 V = 550
0 V = 550
14 mA = 664
6 V = 640
2 V = 640
16 mA = 774
7 V = 730
4 V = 730
18 mA = 886
8 V = 820
6 V = 820
19 mA = 943
9 V = 910
8 V = 910
20 mA = 1000 10 V = 1000
10 V = 1000
2373_en_E
D Appendix
D1
List of Figures
m
Section 1
co
Section 2
“nanoNavigator Startup” dialog box ................................................... 2-4
Figure 2-2:
The "nanoLC Connection Wizard" ..................................................... 2-5
Figure 2-3:
“nanoLC Configuration” dialog box .................................................... 2-7
Figure 2-4:
“Configure Base Unit” dialog box ...................................................... 2-8
Figure 2-5:
The “Configure Serial Port” dialog box ............................................... 2-9
Figure 2-6:
The “Configure RTC” dialog box ...................................................... 2-10
Figure 2-7:
The “nLC-IO-4AI” configuration dialog box ...................................... 2-11
Figure 2-8:
The “Configure Ethernet” dialog box configures the Ethernet
option ............................................................................................... 2-12
nt
ne
po
nanoLC RS-232 programming connection ...................................... 2-14
co
m
Figure 2-9:
s.
Figure 2-1:
Section 3
on
lin
e
Figure 3-1:
2373_en_E
nanoNavigator showing a flow chart window ..................................... 3-3
Figure 3-2:
nanoLC status icons .......................................................................... 3-4
Figure 3-3:
Main toolbar ....................................................................................... 3-4
Figure 3-4:
Chart Explorer .................................................................................... 3-6
Figure 3-5:
The “Import Logic Chart” dialog box ................................................... 3-8
Figure 3-6:
The “Import Logic Chart” dialog box with a project selected .............. 3-9
Figure 3-7:
Vertically tiled flow chart windows .................................................... 3-10
Figure 3-8:
From left to right, “Cut”, “Copy”, and “Paste” buttons ....................... 3-12
Figure 3-9:
“Undo” and “Redo” buttons .............................................................. 3-12
Figure 3-10:
Every new flow chart opens with a predefined Enable block ............ 3-13
Figure 3-11:
The “Enable Block” dialog box ......................................................... 3-13
Figure 3-12:
Decision and Compare blocks appear as diamonds ........................ 3-15
Figure 3-13:
“Compare Block... Configuration” tab ............................................... 3-16
Figure 3-14:
“Decision Block... Configuration” tab ................................................ 3-19
Figure 3-15:
Action blocks ................................................................................... 3-22
Figure 3-16:
“Control Block... Configuration” tab .................................................. 3-23
PHOENIX CONTACT
D-1
nanoNavigator
Figure 3-17:
“Message Block... Configuration” tab ............................................... 3-25
Figure 3-18:
“Move Block... Configuration” tab .................................................... 3-26
Figure 3-19:
“Wait Block... Configuration” tab ...................................................... 3-27
Figure 3-20:
Sample flow chart with flow lines connecting all blocks .................. 3-29
Figure 3-21:
“Compare Block... Comments” tab .................................................. 3-30
Figure 3-22:
Use Message Editor to define and edit messages in a project ......... 3-31
Figure 4-1:
“Select Type of First Chart” dialog box ............................................... 4-3
Figure 4-2:
nanoNavigator showing a ladder chart window .................................. 4-4
Figure 4-3:
nanoLC status icons .......................................................................... 4-5
Figure 4-4:
Main toolbar ....................................................................................... 4-5
Figure 4-5:
Chart Explorer .................................................................................... 4-7
Figure 4-6:
The “Import Logic Chart” dialog box ................................................... 4-9
Figure 4-7:
The “Import Logic Charts” dialog box with a project selected ........... 4-10
Figure 4-8:
Vertically tiled ladder chart windows ................................................ 4-11
co
s.
nt
ne
“Undo” and “Redo” buttons .............................................................. 4-13
Enable block .................................................................................... 4-14
m
Figure 4-10:
po
Figure 4-9:
m
Section 4
The “Enable Block” dialog box ......................................................... 4-15
Figure 4-12:
New ladder chart with first rung showing default contact
and coil ............................................................................................ 4-16
Figure 4-13:
Placing Decision Contacts in different arrangements ....................... 4-17
on
lin
e
co
Figure 4-11:
D-2
PHOENIX CONTACT
Figure 4-14:
“Decision Contact” dialog box .......................................................... 4-18
Figure 4-15:
Decision Contact symbols ............................................................... 4-18
Figure 4-16:
“Ladder Compare Contact” dialog box ............................................ 4-20
Figure 4-17:
Compare Contact symbols .............................................................. 4-21
Figure 4-18:
“Control Coil” dialog box .................................................................. 4-23
Figure 4-19:
Control Coil symbols ........................................................................ 4-23
Figure 4-20:
“Message Coil” dialog box ............................................................... 4-25
Figure 4-21:
Message Coil symbol ....................................................................... 4-25
Figure 4-22:
Message coil latching logic example ................................................ 4-26
Figure 4-23:
“Move Coil” dialog box ..................................................................... 4-27
Figure 4-24:
Move Coil symbol ............................................................................ 4-27
Figure 4-25:
Use the Message Editor to define and edit messages
in a project ....................................................................................... 4-28
2373_en_E
Section 5
The Data Item Editor initially displays all available data types ............ 5-4
Figure 5-2:
The Data Item Editor with an opened data type ................................. 5-5
Figure 5-3:
The “Project Information... CrossReference” tab ................................ 5-6
Figure 5-4:
“Move Block... Configuration” tab .................................................... 5-13
Figure 5-5:
The nLC-IO-4AI” configuration dialog box ........................................ 5-16
Figure 5-6:
“Move Block” dialog box showing analog input to register
configuration .................................................................................... 5-17
Figure 6-1:
“Connection Settings” dialog box ....................................................... 6-3
Figure 6-2:
The “Project Information... Messages” tab ......................................... 6-4
Figure 6-3:
“Select COM Port” dialog box ............................................................ 6-5
Figure 6-4:
“New Password” dialog box requests the current password .............. 6-7
Figure 6-5:
“Set nanoLC Date & Time” dialog box ................................................ 6-8
Figure 6-6:
The “Lock the nanoLC” dialog box requires the current password ..... 6-9
co
m
Figure 5-1:
nt
ne
“Unlock the nanoLC” dialog box requires the current password ......... 6-9
The “nanoLC Connection Wizard” ................................................... 6-10
m
Figure 6-8:
po
Figure 6-7:
s.
Section 6
The “nanoLC Utilities” dialog box ..................................................... 6-11
Figure 6-10:
The “Update nanoLC Firmware” dialog box ..................................... 6-11
Figure 6-11:
The “nanoLC Connection Wizard” ................................................... 6-12
Figure 6-12:
The “nanoLC Utilities” dialog box ..................................................... 6-13
on
Section 7
lin
e
co
Figure 6-9:
2373_en_E
Figure 7-1:
7-3
Figure 7-2:
Chart Explorer in Monitor mode ......................................................... 7-4
Figure 7-3:
The “nanoLC Monitor... Flow Charts” tab lists flow chart
data values ........................................................................................ 7-5
Figure 7-4:
The “nanoLC Monitor... Blocks” tab lists a block’s data values .......... 7-6
Figure 7-5:
The “nanoLC Monitor... Forces” tab lists forced data items ................ 7-6
Figure 7-6:
The “nanoLC Monitor... System Flags” tab lists all system flags ........ 7-7
PHOENIX CONTACT
D-3
nanoNavigator
Section 8
Flow chart segment showing an action and branching block ............. 8-4
Figure 8-2:
Action blocks ..................................................................................... 8-5
Figure 8-3:
Decision, Compare, and Wait blocks appear as diamonds ................ 8-6
Figure 8-4:
An auto-mode flow chart example ..................................................... 8-9
Figure 8-5:
Initialization of the project could look like this ................................... 8-10
Figure 8-6:
Use a branching block to wait for signal to start process .................. 8-10
Figure 8-7:
Project control consists performing I/O as required ......................... 8-11
Figure 8-8:
Tank control example one ................................................................ 8-12
Figure 8-9:
Tank control example two ................................................................ 8-13
Figure 8-10:
Sample status flow chart example ................................................... 8-14
Figure 8-11:
Sample status flow chart variation 1 ................................................. 8-15
nt
s.
co
m
Figure 8-1:
Sample status flow chart variation 2 ................................................. 8-16
Figure 8-13:
Sample diagnostic flow chart ........................................................... 8-17
Figure 8-14:
Sample recovery flow chart .............................................................. 8-18
Figure 8-16:
Initial flow chart window ................................................................... 8-21
The “Decision Block... Configuration” tab ........................................ 8-22
m
Figure 8-17:
Flow Chart Explorer ......................................................................... 8-20
po
Figure 8-15:
ne
Figure 8-12:
The Data Item Editor initially displays all available data types .......... 8-23
Figure 8-19:
Brake control flow chart ................................................................... 8-25
Figure 8-20:
Completed “LeftTurn” flow chart (top half) ....................................... 8-28
Figure 8-21:
Completed “LeftTurn” flow chart (bottom half) ................................. 8-29
on
lin
e
co
Figure 8-18:
D-4
PHOENIX CONTACT
Figure 8-22:
Message M-00, Background ............................................................ 8-31
Figure 8-23:
Message M-01, LeftTurnOff ............................................................. 8-32
Figure 8-24:
Message M-02, LeftTurnOn ............................................................. 8-33
Figure 8-25:
Message M-08, RightBrakeOn ........................................................ 8-34
Figure 8-26:
The top half of the display flow chart ................................................ 8-35
Figure 8-27:
The bottom half of the display flow chart. ......................................... 8-36
Figure 8-28:
The “Project Information... Messages” tab with error
information ....................................................................................... 8-38
Figure 8-29:
Simulator with data items displayed ................................................. 8-39
Figure 8-30:
Simulation of the nanoLights project ................................................ 8-41
Figure 8-31:
The “nanoLC Monitor... Flow Charts” tab ......................................... 8-42
Figure 8-32:
The Chart Explorer ........................................................................... 8-43
Figure 8-33:
The “nanoLC Monitor... Forces” tab ................................................. 8-44
Figure 8-34:
The “Project Information... Cross-Reference” tab ............................ 8-45
2373_en_E
Appendix A
Figure A-1:
“Preferences... General” tab ............................................................. A-1
Figure A-2:
“Preferences... Designer Options” tab .............................................. A-3
Figure A-3:
“Preferences... Designer Colors” tab ................................................ A-5
Figure A-4:
“Color” dialog box after clicking “Define Custom Color” button ........ A-6
Figure A-5:
“Preferences... Block Colors” tab ..................................................... A-7
“Preferences... Data Item Editor” tab ................................................ A-8
Figure A-7:
“Preferences... Debug” tab ............................................................... A-9
Figure A-8:
The “Changes Made” dialog box .................................................... A-10
co
m
Figure A-6:
nt
s.
Appendix B
ne
Appendix C
on
lin
e
co
m
po
Appendix D
2373_en_E
PHOENIX CONTACT
D-5
on
lin
e
co
m
po
ne
nt
s.
co
m
nanoNavigator
D-6
PHOENIX CONTACT
2373_en_E
D2
List of Tables
Section 1
Table 1-1:
Revisions ............................................................................................ 1-3
Table 1-2:
Manual Conventions for Keyboard Command .................................... 1-5
Table 3-1:
Valid Enable Block Expression ......................................................... 3-14
Table 3-2:
Valid Comparisons in a Compare Block ........................................... 3-18
Table 3-3:
Valid Comparisons in a Decision Block ............................................ 3-21
Table 4-1:
Valid Enable Element Expression ..................................................... 4-15
co
m
Section 2
ne
nt
s.
Section 3
po
Section 4
Table 4-3:
Valid Comparisons in a Compare Contact ........................................ 4-22
Valid Comparisons in a Control Coil ................................................. 4-24
co
Table 4-4:
Valid Comparisons in a Decision Contact ......................................... 4-19
m
Table 4-2:
on
lin
e
Section 5
Table 5-1:
Output and Flag Actions ..................................................................... 5-9
Table 5-2:
Supported Data Types...................................................................... 5-10
Table 5-3:
Valid Current Date, Day, Time Comparisons .................................... 5-11
Table 5-4:
Move Summary ................................................................................ 5-15
Table 5-5:
Analog Value Mapping ..................................................................... 5-16
Table 7-1:
Force options available depending on data item type ......................... 7-5
Section 6
Section 7
2373_en_E
PHOENIX CONTACT
D-7
nanoNavigator
Section 8
Data Items for Brake Control Example.............................................. 8-24
Table 8-2:
Left Turn Flow Chart Blocks.............................................................. 8-26
Table 8-3:
Flow Line Connections ..................................................................... 8-27
Table 8-4:
Message Data Items......................................................................... 8-30
Table 8-5:
Simulator buttons.............................................................................. 8-39
Table 8-6:
Force options available depending on data item type ....................... 8-44
Table B-1:
Base Unit Flags ................................................................................. B-1
Table B-2:
Ethernet Flags ................................................................................... B-1
m
Table 8-1:
s.
co
Appendix A
ne
nt
Appendix B
po
Appendix C
Table C-1:
Default scaling at 0 to 4095................................................................ C-2
Table C-3:
co
Table C-4:
Scaling set to 70 to 90 ....................................................................... C-2
m
Table C-2:
Scaling set to 0 to 10 ......................................................................... C-3
Scaling set to 0 to 2000 ..................................................................... C-4
Table C-6:
Scaling set to 100 to 1000 ................................................................. C-4
lin
e
Table C-5:
on
Appendix D
Scaling set to 0 to 1000 ..................................................................... C-3
D-8
PHOENIX CONTACT
2373_en_E
D3
Control block....................................................3-22, 3-23
Editing .................................................................3-24
Control coil................................................................4-23
Summary.............................................................4-24
Counters .................................................. 5-8, 5-11, 5-12
Creating messages ..........................................3-32, 4-29
Cross-references ........................................................5-6
Customer support .......................................................1-5
Cut-Copy-Paste ........................................................3-12
Index
A
Action block ...................................................... 3-22, 8-4
Analog input ..............................................................2-11
Analog output..............................................................5-7
Analog values ................................................. 5-16, 5-17
Block
Comments...........................................................3-30
Multiple selection.................................................3-11
Selecting .............................................................3-11
BootP ........................................................................2-12
Branching block ..........................................................8-4
on
lin
e
co
m
2373_en_E
co
s.
Data ........................................................................... A-8
Data items
Cross-Reference ...................................................5-6
Data Item Editor ....................................................5-4
Data types and formats .......................................5-10
Data type descriptions ................................................5-7
Analog output ........................................................5-7
Counter .................................................................5-8
Display message...................................................5-7
Flag .......................................................................5-7
High-speed counter...............................................5-7
Input ......................................................................5-7
Keypad key ...........................................................5-8
Output ...................................................................5-8
Register.................................................................5-8
Timer .....................................................................5-8
Data types.................................................................5-10
Date ..........................................................................5-11
Decision block.......................................... 3-14, 3-19, 8-5
Editing .................................................................3-20
Summary.............................................................3-21
Decision contact .......................................................4-17
Summary.............................................................4-19
DHCP........................................................................2-12
Display message.........................................................5-7
Download.............................................................6-5, 6-6
Drawing area........................................................3-4, 4-4
Duration ......................................................................5-8
nt
po
Chart Explorer ..................................................... 3-6, 4-7
Execution order ............................................. 3-8, 4-9
Flow chart............................................................3-11
Import ............................................................ 3-8, 4-9
Ladder chart ........................................................4-10
Monitor mode ........................................................7-4
Coils..........................................................................4-13
Column labels ..................................................... 3-4, 4-4
COM Interface...........................................................2-12
Command button ........................................................1-4
Compare block..........................................................3-15
Editing .................................................................3-17
Summary .............................................................3-17
Compare contact.......................................................4-19
Summary .............................................................4-22
Configure Base Unit ....................................................2-8
Configure Ethernet ....................................................2-12
Configure RTC ..........................................................2-10
Configure Serial Port ...................................................2-9
Configuring RS-232 and RS-485.................................2-8
Connecting flow chart blocks ....................................3-28
Connection settings ....................................................6-3
Connection Wizard.......................................... 6-10, 6-12
Connections..............................................................3-28
Crossing ............................................................... A-4
Multiple selection.................................................3-11
Selecting .............................................................3-11
Contacts....................................................................4-13
D
ne
C
m
B
E
Enable block ....................................................3-13, 4-14
Enter Password...........................................................6-7
Execution order....................................................3-8, 4-9
PHOENIX CONTACT
D-9
nanoNavigator
Compare contact.................................................4-19
Contacts and coils...............................................4-13
Control coil ..........................................................4-23
Decision contact..................................................4-17
Deleting ...............................................................4-10
Displaying multiple ..............................................4-11
Editing .................................................................4-12
Enable block........................................................4-14
Message coil .......................................................4-25
Move coil .............................................................4-27
New.......................................................................4-8
Open .....................................................................4-8
Renaming..............................................................4-8
Rungs..................................................................4-16
Saving .................................................................4-12
m
G
lin
e
co
Grid
Turning on and off ......................................... 3-5, 4-6
H
High-speed counter ....................................................5-7
on
I
co
s.
nt
ne
M
po
Firmware update .......................................................6-10
Flags ................................................................... 5-7, B-1
Flow chart
Compare block ....................................................3-15
Connecting blocks...............................................3-28
Control block .......................................................3-23
Decision block .....................................................3-19
Deleting .................................................................3-9
Displaying..............................................................3-7
Displaying multiple ..............................................3-10
Editing .................................................................3-11
Enable block........................................................3-13
Message block ....................................................3-25
Move block ..........................................................3-26
New .......................................................................3-7
Open .....................................................................3-7
Renaming..............................................................3-7
Saving .................................................................3-11
Wait block............................................................3-27
Force data items ............................... 7-6, 7-7, 8-40, 8-43
m
F
I/O Expansion slots ...................................................2-10
Import charts ....................................................... 3-8, 4-9
Initial data item name values .......................................5-8
Input ............................................................................5-7
IP Address ................................................................2-12
IPassign.exe .............................................................2-12
K
Keyboard commands..................................................1-5
Keypad key .................................................................5-8
Keywords ....................................................................1-4
L
Magnifier ...................................... 3-3, 3-4, 4-4, 4-5, 8-21
Main ............................................................................4-4
Main toolbar .........................................................3-4, 4-5
Major version ............................................................2-13
Memory Module ..........................................................6-6
Menu selections..........................................................1-4
Menus ..................................................................3-3, 4-4
Message block......................................... 3-22, 3-25, 8-5
Message coil.............................................................4-25
Message Editor................................................3-31, 4-28
Creating messages ....................................3-32, 4-29
Preferences.......................................................... A-2
Minor version ............................................................2-13
Modbus TCP.............................................................2-12
Monitor mode.......................................................7-3, 7-4
Monitor window...........................................................7-4
Blocks tab .............................................................7-6
Charts tab..............................................................7-4
Forces tab ......................................................7-6, 7-7
System Flags tab...................................................7-7
Move block .............................................. 3-22, 3-26, 8-5
Move coil...................................................................4-27
Move function ...........................................................5-13
Moving different data types .................................5-14
Moving same data types .....................................5-14
Summary.............................................................5-15
Multiple selection ......................................................3-11
Ladder chart................................................................4-3
D-10
PHOENIX CONTACT
2373_en_E
R
nanoLC
Connect.................................................................6-4
Firmware update .................................................6-10
Lock ......................................................................6-9
Password ..............................................................6-7
Running.................................................................6-7
Set date and time ..................................................6-8
Stopping ................................................................6-7
Unlock ...................................................................6-9
nanoNavigator Startup ................................................2-4
nLC 50 IO AI 4/SF ........................................... 2-11, 5-16
nLC-COM-ENET-MB1 ..............................................2-12
nLC-IO-4AI................................................................2-11
Real-time clock .........................................................2-10
Register ......................................................................5-8
Retentive data item name values ................................5-8
Row labels ...........................................................3-4, 4-4
RS-232........................................................................2-8
RS-485........................................................................2-8
Rulers ........................................................................ A-4
Rungs .......................................................................4-16
Running a project........................................................6-7
S
s.
nt
po
P
on
lin
e
co
m
Page grid............................................................. 3-4, 4-4
Pointer tool................................................................3-28
Preferences
Block Colors page ................................................ A-7
Data Item Editor page........................................... A-8
Designer Colors page........................................... A-5
Designer Options page......................................... A-3
General tab........................................................... A-1
Message Editor .................................................... A-2
Setting .................................................................. A-1
Preset..........................................................................5-8
Project.......................................................................2-13
Download to Memory Module................................6-6
Download to nanoLC.............................................6-5
Running.................................................................6-7
Simulation ...........................................................8-39
Stopping ................................................................6-7
Upload from Memory Module ................................6-6
Upload from nanoLC .............................................6-5
Project Information ......................................................6-4
2373_en_E
Scaling Analog Data .................................................5-16
Scrollbars.............................................................3-4, 4-5
Select COM Port .........................................................6-5
Selecting blocks and connections.............................3-11
Serial port....................................................................2-8
Set nanoLC Date & Time ............................................6-8
Simulator...................................................................8-39
I/O .......................................................................8-40
Monitoring execution ...........................................8-40
Start Monitoring ...................................................3-5, 4-6
Static IP Address ......................................................2-12
Status line ............................................................3-4, 4-5
Stop Monitoring....................................................3-5, 4-6
Stopping a running project ..........................................6-7
Subnet Mask.............................................................2-12
ne
O
Operator Panel..........................................................2-11
Output ................................................................. 5-8, 5-9
co
m
N
T
Technical support .......................................................1-5
Time..........................................................................5-11
Time and date ...........................................................5-11
Timer..................................................................5-8, 5-11
Reset...................................................................5-12
Restart.................................................................5-12
Start.....................................................................5-12
Stop.....................................................................5-12
Toolbar.................................................................3-3, 4-4
Buttons................................................................. A-2
Labels .................................................................. A-2
Main ...............................................................3-3, 4-5
Options................................................................. A-2
PHOENIX CONTACT
D-11
nanoNavigator
U
Upload ................................................................ 6-5, 6-6
USB ............................................................................2-8
W
Wait block ................................................ 3-22, 3-27, 8-6
Watchdog Timeout....................................................2-12
m
X
co
XRef ............................................................................5-6
Z
on
lin
e
co
m
po
ne
nt
s.
Zooming.............................................................. 3-6, 4-7
D-12
PHOENIX CONTACT
2373_en_E