1
User’s Guide
The Chartsmith manual and application is provided under license and may only be used or copied
in accordance with the terms specified in the license, as displayed when the application is installed.
All information found in this manual is subject to change without notice and does not represent a
commitment on the part of Blacksmith Technologies, Inc. Blacksmith Technologies, Inc. will from
time to time revise the software described in this manual and reserves the right to make such
changes without obligation to notify the purchaser.
All company names, information, and data used in sample charts in this manual and in sample
software are fictitious.
Copyright @1994-2005 Blacksmith Technologies, Inc. All Rights Reserved.
Blacksmith and Chartsmith are trademarks of Blacksmith Technologies, Inc. Keynote, Mac, Mac
OS X, and the Mac Logo, are trademarks of Apple Computer, Inc., registered in the U.S. and other
countries. All other product names are trademarks of their respective companies.
The enclosed software and documentation (the "SOFTWARE") were developed at private expense
and no portion of the SOFTWARE is in the public domain. The SOFTWARE is furnished to the
Government licensee as "Restricted Computer Software" as that term is defined in Federal
Acquisition Regulation ("FAR") 52.227-19 and is "Commercial Computer Software" as that term is
defined in Department of Defense Federal Acquisition Regulation Supplement ("DFARS")
227.471.
As such, the Government licensee agrees that the SOFTWARE is supplied to the Government
pursuant to FAR 52.227-19 (c)(2) or DFARS 252.227-7013(c)(1), as applicable.
RESTRICTED RIGHTS LEGEND: Use, duplication, or disclosure by the Government is subject to
restrictions as set forth in subparagraph (c)(l) (ii) of the Rights in Technical Data and Computer
Software clause at DFARS 252.227-7013. Blacksmith Technologies, Inc., 11654 Plaza America Dr.
# 744, Reston VA 20190-4700
Table of Contents
TOC
Table of Contents
TUTORIALS ............................................................................................................................................................ 8
OVERVIEW ............................................................................................................................................................. 9
QUICK-START TUTORIAL ...................................................................................................................................... 9
Getting Started................................................................................................................................................. 9
The Basic Elements .......................................................................................................................................10
Working in the Data View Window ..............................................................................................................11
The Inspector Panel.......................................................................................................................................12
Adding New Charts to a Document ..............................................................................................................14
Exporting and Saving ....................................................................................................................................15
INTERMEDIATE TUTORIAL ..................................................................................................................................16
Overview ........................................................................................................................................................16
Working in the Data View Window ..............................................................................................................16
Working in the Chart Window ......................................................................................................................20
Working with the Inspector Panel ................................................................................................................21
Templates .......................................................................................................................................................30
ADVANCED TUTORIAL ........................................................................................................................................31
Overview ........................................................................................................................................................31
Working in the Data View Window ..............................................................................................................31
Working in the Chart Window ......................................................................................................................33
Miscellaneous Stuff........................................................................................................................................34
CONCEPTS............................................................................................................................................................37
OVERVIEW ...........................................................................................................................................................38
THE CHART W INDOW .........................................................................................................................................38
Adding Charts to Documents........................................................................................................................39
Navigating Among and Reordering Charts .................................................................................................39
Resizing Charts..............................................................................................................................................40
Dragging Color, Images, and Templates into the Chart Window..............................................................40
Moving and Resizing Chart Elements ..........................................................................................................40
Editing Text in the Basic Chart Elements ....................................................................................................41
Printing Charts ..............................................................................................................................................41
Exporting Charts ...........................................................................................................................................41
Bringing Up the Inspector Panel, Color Panel, Annotation Panel and Chart Notes Drawer .................43
THE DATA VIEW WINDOW .................................................................................................................................43
Adding, Changing and Reordering Series Columns ...................................................................................44
Adding Rows ..................................................................................................................................................45
Controlling the Display of the Basic Chart Elements .................................................................................45
Automatic Label and Data Fill .....................................................................................................................45
Decimal and Thousands Delimiters .............................................................................................................46
Importing Data From Other Sources ...........................................................................................................46
Chartsmith User’s Guide
3
TOC
Table of Contents
Import Data From Microsoft Excel®...........................................................................................................47
Chart Update Button .....................................................................................................................................48
THE INSPECTOR PANEL .......................................................................................................................................48
Sliders, Steppers and Text Fields .................................................................................................................49
Buttons for Choosing from Sets ....................................................................................................................50
USING AND INSPECTING COLOR .........................................................................................................................51
Gradient Fills.................................................................................................................................................52
Angle and Granularity in Background Gradient Fills ................................................................................52
Color Transparency and The "No Fill" Option...........................................................................................53
Series Colors..................................................................................................................................................54
USING AND INSPECTING 3D EFFECTS.................................................................................................................54
Grids...............................................................................................................................................................55
Bar and Histogram Charts............................................................................................................................55
Pie Charts ......................................................................................................................................................55
USING AND INSPECTING I MAGES ........................................................................................................................56
Images on Bars and Histograms ..................................................................................................................57
Images in Pie Slices.......................................................................................................................................58
Images in Box Annotations ...........................................................................................................................58
USING AND INSPECTING ANNOTATIONS AND TEXT ...........................................................................................58
Trend Line Equation Text Annotations ........................................................................................................59
Aligning Elements and Determining Who's on Top ....................................................................................59
INSPECTING AND EDITING TEXT .........................................................................................................................60
USING CHART NOTES ..........................................................................................................................................61
USING AND INSPECTING THE BACKGROUND ......................................................................................................62
USING AND INSPECTING THE GRID .....................................................................................................................62
The Main and Axis Inspector Buttons ..........................................................................................................63
Choosing Y Axes ............................................................................................................................................64
Choosing Grid Type ......................................................................................................................................64
Choosing Scale Orientation..........................................................................................................................64
The Auto Adjust Switch .................................................................................................................................65
Linear Scale Minimums, Maximums, Steps and Major Lines ....................................................................65
Logarithmic Scale Minimums, Maximums, Decades & Major Line ..........................................................66
Axis Line and Title Attributes .......................................................................................................................66
Displaying Lines and Ticks...........................................................................................................................67
Displaying Tic Labels....................................................................................................................................68
USING AND INSPECTING SERIES..........................................................................................................................69
Line Width & Color .......................................................................................................................................69
Display Series on Which Y-axis?..................................................................................................................70
Data Labeling ................................................................................................................................................70
Using and Inspecting Trend Lines................................................................................................................71
Using and Inspecting Error Bars .................................................................................................................73
Bar Series Inspecting ....................................................................................................................................74
Area Series Inspecting...................................................................................................................................75
Pie Series Inspecting .....................................................................................................................................75
4
Chartsmith User’s Guide
Table of Contents
TOC
Line, Base-Error, Hi-Lo, Hi-Lo-Open-Close, XY, Scatter, and Bubble Series Inspecting .......................77
Bubble Series Inspecting ...............................................................................................................................78
Histogram Series Inspecting .........................................................................................................................79
Intensity Scatter Series Inspecting................................................................................................................79
USING AND INSPECTING THE LEGEND ................................................................................................................80
USING TEMPLATES ..............................................................................................................................................81
Creating Templates .......................................................................................................................................82
What is Saved for Each Element...................................................................................................................83
Using Templates To Start and Change Charts ............................................................................................84
Being Careful with Grids and Series............................................................................................................84
CREATING CHARTS .............................................................................................................................................85
Charts with Bars Series.................................................................................................................................85
Charts with Lines Series ...............................................................................................................................85
Charts with Area Series ................................................................................................................................85
Charts with Hi-Lo and/or Hi-Lo-Open-Close Series ..................................................................................85
Charts with Base-Error Series......................................................................................................................86
Charts with Pie Series ...................................................................................................................................86
Charts with XY Series....................................................................................................................................86
Charts with Scatter Series.............................................................................................................................86
Charts with Histograms ................................................................................................................................87
Charts with Bubble Series.............................................................................................................................87
Charts with Intensity Scatter Plots ...............................................................................................................87
Charts with a Double or Right Side Y-axis..................................................................................................87
Charts with Trend Lines................................................................................................................................88
Charts with Error Bars .................................................................................................................................88
Charts with a Horizontal Grid......................................................................................................................88
Charts with a 3D Grid...................................................................................................................................88
Charts with Annotations................................................................................................................................89
Charts with Images........................................................................................................................................89
Charts with Stacked Images..........................................................................................................................89
Charts with Log and Semi-log Grids............................................................................................................89
Charts from Templates ..................................................................................................................................89
LINKING CHARTS WITH LINKBACK ....................................................................................................................90
Linking Charts to Other LinkBack Applications .........................................................................................90
Edit Linked Chartsmith Charts from Other LinkBack Applications ..........................................................90
Saving Edited LinkBack Charts ....................................................................................................................90
REFERENCE.........................................................................................................................................................91
OVERVIEW ...........................................................................................................................................................92
THE CHARTSMITH MENU ....................................................................................................................................92
About Chartsmith...........................................................................................................................................92
Preferences ....................................................................................................................................................92
Check for Updates .........................................................................................................................................97
Chartsmith User’s Guide
5
TOC
Table of Contents
License............................................................................................................................................................97
Feedback ........................................................................................................................................................97
Purchase.........................................................................................................................................................97
Services ..........................................................................................................................................................97
Hide Chartsmith, Hide Others, Show All, and Quit Chartsmith ................................................................98
THE FILE MENU ...................................................................................................................................................98
Open ...............................................................................................................................................................98
New .................................................................................................................................................................99
New From Template ......................................................................................................................................99
Open Recent ...................................................................................................................................................99
Save ................................................................................................................................................................99
Save As .........................................................................................................................................................100
Export Document.........................................................................................................................................100
Save All.........................................................................................................................................................100
Revert to Saved ............................................................................................................................................100
Close.............................................................................................................................................................100
Page Setup ...................................................................................................................................................100
Print..............................................................................................................................................................101
THE EDIT MENU ................................................................................................................................................101
Undo Command ...........................................................................................................................................101
Redo Command............................................................................................................................................101
Cut ................................................................................................................................................................101
Copy..............................................................................................................................................................101
Paste .............................................................................................................................................................102
Paste Special................................................................................................................................................102
Select All.......................................................................................................................................................103
Special Characters ......................................................................................................................................103
THE FORMAT MENU ..........................................................................................................................................103
Font and Text Menus...................................................................................................................................103
Bring To Front.............................................................................................................................................104
Send To Back ...............................................................................................................................................104
Align Menu...................................................................................................................................................104
Position ........................................................................................................................................................104
THE CHART MENU ............................................................................................................................................105
Add Chart.....................................................................................................................................................105
Add Chart From Template ..........................................................................................................................105
Delete ...........................................................................................................................................................105
Apply Template ............................................................................................................................................105
Save As Template.........................................................................................................................................106
Set Chart Size...............................................................................................................................................107
Size To Fit Window......................................................................................................................................107
Normalize .....................................................................................................................................................107
Show Chart Notes ........................................................................................................................................107
Export Image................................................................................................................................................107
6
Chartsmith User’s Guide
Table of Contents
TOC
THE DATA VIEW MENU ....................................................................................................................................107
Data Viewer .................................................................................................................................................108
Data Fill Panel ............................................................................................................................................108
Add Rows......................................................................................................................................................110
Add Series Columns.....................................................................................................................................110
Size To Fit ....................................................................................................................................................110
Transpose Data............................................................................................................................................110
Transpose Labels.........................................................................................................................................110
Select Labels Only .......................................................................................................................................110
Toggle Y Axis ...............................................................................................................................................111
Import ASCII Data ......................................................................................................................................111
Import From Excel ......................................................................................................................................111
Update Import From Excel / Update All Excel Imports ...........................................................................111
THE TOOLS MENU .............................................................................................................................................111
Inspector.......................................................................................................................................................112
Colors ...........................................................................................................................................................112
Annotate .......................................................................................................................................................112
WINDOW ............................................................................................................................................................113
HELP ..................................................................................................................................................................113
Chartsmith Help ..........................................................................................................................................113
Chartsmith Users Manual...........................................................................................................................113
Chartsmith Release Notes ...........................................................................................................................113
Chartsmith FAQ ..........................................................................................................................................113
Cool Features in Chartsmith ......................................................................................................................113
GLOSSARY .........................................................................................................................................................115
GLOSSARY .........................................................................................................................................................116
Chartsmith User’s Guide
7
1
Tutorials
Tutorials
1
Overview
The Chartsmith tutorials are the simplest and fastest way to come up to speed with
the application. There are three tutorials intended for the following audiences:
Quick Start Tutorial
Intended for those that are completely new to Chartsmith, or need some
introduction to the terminology of the application. This tutorial will provide an
overview of the application and how it works.
Intermediate Tutorial
Intended for those that have worked a little bit with the application and have some
basic knowledge of how it works, but want a more through understanding.
Advanced Tutorial
Intended for those who know how to use Chartsmith, but want to be introduced to
the advanced features.
Quick-Start Tutorial
In this tutorial, you will be introduced to the Chartsmith application and its user
interface. You will create your first chart and then export an image of that chart to
the file system. Once completed, it is recommended that you progress on to the
Intermediate Tutorial to gain full comfort with the application.
Getting Started
Launch Chartsmith
Double Click on the Chartsmith application icon. If you previously licensed
Chartsmith ignore the next step.
License Chartsmith
If Chartsmith is unlicensed, select the 'New License' option on the alert panel that
is displayed when Chartsmith is launched. Enter the license key provided or choose
Demo. If you purchased an educational license you must also enter your first and
last name. Choose the license type desired (if you're not sure about License Types,
see License Policy found at www.blacksmith.com/products/licensing_policy or
Help's "How To License Chartsmith").
Chartsmith User’s Guide
9
1
Tutorials
The Basic Elements
When Chartsmith first launches, two different windows will appear. These
windows are:
The Chart Window
This window represents a Chartsmith document. On the left it contains a tall
narrow view, called the Navigator, where the thumbnails of all charts held in the
document are displayed. On the right it contains a large rectangular area where
individual charts are displayed. This rectangular area is called the Chart View and
always displays the chart currently selected in the Navigator.
The Data View Window
This window contains the data and chart labels for the chart currently displayed in
the Chart window. The major feature in this window is a spreadsheet-like view
called the Data View. Also in this window are text fields and controls along the
top, and the Series Palette, on the right.
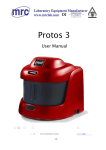
Chart Window and Data View Window
10
Chartsmith User’s Guide
Tutorials
1
By simply launching Chartsmith, a new document has been created with one chart
in it. The Chart window has two primary components: the Chart View and the
Navigator. The Navigator holds thumbnails of all of the charts in the document. At
this point there is no data in the chart, so the chart only has the fundamental,
generic elements within it, like title, subtitle, grid, and legend.
In this initial chart in your start-up document, you have one series. A series is a set
of data that is collectively drawn to the chart and represents a single sequence of
data elements.
The series is represented in the chart by some graphical form, like pies or bars. It is
also represented in the Data View by a single spreadsheet-like series column. The
first series column, by default, is labeled "A". A series column will hold the data
for the series, and has the icon of its series type at its top.
Series Column
Working in the Data View Window
Let's look at how you can work within the Data View window to establish the data
set that your chart will display.
Add Rows to the Series
To add rows (also referred to as series elements) to the series in the chart, click the
Add Row button in the Data View. The button has a plus sign on it and is located
at the bottom left corner of the Data View. Each click will result in a single row
being added to the Data View.
Add Data to the Series
Now that there are rows in the Data View, you can directly edit them by clicking
on a cell, and typing. By pressing the Return key, text control will advance to the
next row. So go ahead and type some numbers into the rows that you have added.
If you've succeeded in these steps, you now have a Bar chart in the Chart window
with a single data series in it. Let's add another series.
Chartsmith User’s Guide
11
1
Tutorials
Add a New Series
Each series column in the Data View corresponds to a series in the chart. To add a
new series to the chart, click the Add Series Column button. The button has a plus
sign on it and is located at the top right corner of the Data View.
Add Data to the New Series
Now that there is a new series, add data to it by editing its cells in the Data View.
You should see the chart immediately update by adding series elements to the chart
for this new series.
Enter a Series Label for the Series Column
Each column label can be directly edited by double-clicking the column label (by
default, the first column label is "A", second is "B", etc).
Enter Text for the Title, Subtitle, and the X and Y Axis Labels
The text fields at the top of the Data View window are used to edit chart titles and
axis labels. The corresponding text on the chart updates when you hit enter or tab,
or click outside of the text field. Note: The switches beside each text field allow
you to turn labels and titles on or off.
Hide and Unhide the Legend, Grid, Axis Labels, and Chart Titles
The chart legend, grid, axis labels and chart titles can be hidden and unhidden by
using the control switches located near the top of the Data View window.
The Inspector Panel
At this point you have a cursory introduction to the Chart window and the Data
View window. Let's introduce another window, the Inspector panel. The Inspector
panel is used to control the attributes of every element of the chart. This panel is
activated by clicking the Tools -> Show Inspector menu item, or by simply clicking
the shortcut button located on the chart view window. The button is a blue circle
with a white "i" inside.
12
Chartsmith User’s Guide
Tutorials
1
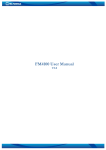
Chart View, Data View, and Inspector
Select Chart Elements to Access Controls
The Inspector panel contains controls to set the attributes for whatever graphical
object is selected in the chart. By default, the background of the chart is selected,
meaning if no other graphical element is selected, then the background is, by
default, selected. From within the Chart View, click on the legend, the Bar series,
the grid, the titles and watch as the Inspector panel updates to display the controls
for the selected object.
You should experiment with the Inspector panel to see how it interacts with the
chart. For this tutorial, we won't get into any of the details of the Inspector panel,
but will in the Intermediate Tutorial.
Chartsmith User’s Guide
13
1
Tutorials
Adding New Charts to a Document
Chartsmith charts are categorized by the types of series that they can display. When
a new chart is added to a document, the initial series type is specified. From that
point forward only series types compatible with the initial series type can be
displayed in that chart.
For example, if a new Bar chart is added to a document, only series types
compatible with the Bar series can be displayed in the new chart. Currently,
Chartsmith offers six (6) series types for a chart first created as a Bar chart. These
are: Bar, Line, Area, Hi-Lo, Open-Close-Hi-Lo, and Base-Error.
Note: While the types of series that can be displayed in a chart first created as a Bar
chart are limited, the combination of chart types that can be produced with these
series is unlimited. This is true because the number and combination of series
included in a chart is unrestricted. For example, you could create a chart with three
Bar series, or you could convert two of the Bar series to line series, creating a
mixed chart with one Bar and two line series. You could also create a chart with
two line series and four area series, eliminating the Bar series added when the chart
was first created.
Additionally, a Chartsmith series can have many display options which effectively
create different series types. For example, the series types that can be created with
a Chartsmith Bar series are: Bar, horizontal Bar, 3D Bar, 3D horizontal Bar,
stacked Bar, horizontal stacked Bar, and 3D horizontal stacked Bar, just to name a
few. All of these different series types can still be combined with other series types
such as a line series and an area series.
Add a New Chart to the Document
The document that is created when Chartsmith launches contains a single chart.
However, a document can contain any number of charts. So here you will add a
new chart to the document. To do so click on the Chart -> Add Chart -> Line
menu item. In doing so, a Line chart will be added to the document, evidenced by
the new thumbnail added to the Navigator.
Click on each of the thumbnails in the Navigator to see how you can toggle
between one chart and the other. Notice that as you toggle between the charts, that
not only does the chart displayed in the Chart View change, but the Data View
contents update to display the relevant items for the selected chart. In this way, the
Data View is similar to the Inspector panel; both update according to what is
selected.
14
Chartsmith User’s Guide
Tutorials
1
Notice that the icon at the top of the series column in the Data View changes as
you click on one chart then the other. The reason for this is that the first chart
contains a single bar series and the second chart contains a single line series.
Bar and Line Series Columns
Exporting and Saving
Export a chart to the file system
You now have two charts in your document. Select the Bar chart from within the
Navigator. You are now going to export an image of this chart to the file system.
Once there, you can put the chart image into reports, presentations, emails, etc. To
do this, click on the Chart -> Export Image menu item. Once you do this a Save
panel will display. Select the location that you would like to store this image, and
type a name for the document at the top of the save panel. At the base of the panel
you can specify what format the chart image should be.
Presently Chartsmith supports seven different image formats for export. They are
PDF, EPS, JPEG, GIF, TIFF, PNG, and PICT. If you choose a bit mapped image
format type, Chartsmith also lets you choose the image resolution. This allows you
to tailor your export for how the image will be used. Once all your selections are
made, click the Save button and your image is then saved to the file system.
Save the document
If you want to work with this Chartsmith document again in the future, you need to
save it. To do so, click the File -> Save menu item. Chartsmith documents save
just like any other application's documents.
This concludes the Quick Start Tutorial. You should now have some comfort with
creating charts, editing their data, exporting chart images, and saving. You should
have some understanding of the three primary windows in Chartsmith: the Chart
window, the Data View window and the Inspector panel. Proceed to the
Intermediate Tutorial for a more thorough coverage of the functionality contained
Chartsmith.
Chartsmith User’s Guide
15
1
Tutorials
Intermediate Tutorial
Overview
This tutorial assumes that the user has already completed the Quick Start Tutorial,
or has basic familiarity with the Data View window, the Chart window and the
Inspector panel, how to add rows and series columns, how to edit data, how to add
charts, and how to save images and documents.
In this tutorial, you will be given an introduction to all of the primary functions of
Chartsmith. At its conclusion, you should be able to handily create charts for your
reports and presentations.
Working in the Data View Window
Setup for tutorial
Launch Chartsmith, and create a new document with a single Bar chart in it.
Paste data
There are several means by which you can get data from another application into
Chartsmith. These include Copy and Paste, Mac OS X Services, importing ASCII
data files and importing from Excel files. We'll cover each of these here, though
you may certainly skip those import types that don't interest you.
Data can be copied from another application - a word processor, email application,
a spreadsheet application - and simply pasted into Chartsmith. To do this, the data
must be tab and carriage return delimited (which is the standard format supported
by spreadsheets), and must be copied to the pasteboard using Edit -> Copy menu in
the source application. Then you must select the destination cell or cells in
Chartsmith's Data View and paste using the Edit -> Paste menu. Here is some
sample data to copy and paste from this application to Chartsmith. Create a new
document with the TextEdit application (located in Applications folder on your
computer), and enter this data with tabs between the numbers.
16
Chartsmith User’s Guide
4
5
4
2
1
6
5
7
2
Tutorials
1
Select the data with your mouse and perform Edit -> Copy. Now select the top data
cell in the first series in your Data View window. If your Data View has less than
three rows or less than three columns, a panel will come forward which provides
you the option of truncating the data to just the rows and columns that you have, or
expanding the number of rows and columns so the data will fit, or canceling the
paste.
Paste Special - Pasting Data with Row/Column Labels or Non-Tab delimiters
Chartsmith allows you to paste data that contains row or column labels, and/or
contains delimiters other than tabs, with the Edit->Paste Special menu item. Create
a new document with TextEdit and enter this data; carefully noting the placement
of the semicolons.
;Beer;Chips
Cliff;12;5
Norm;55;89
Woody;5;17
Select a cell in the Data View and select Edit -> Paste Special. The Data Import
panel will come forward requesting that you select the data content and the
delimiter type. For the above data select “Data with row and column labels” and
“Semicolon” column delimiter. Select import and note how the first row and the
first column have been inserted into the row and series labels.
Create a Chart from the Services menu
Create a new document with TextEdit and enter the data below with tabs between
the entries. Now from Text Edit select the Services -> Chartsmith -> Bar Chart
menu item. If Chartsmith is not already running, it will be launched and a
document will be created. A chart will be added to the document, and you will be
prompted to indicate the content of your data (select “Data with row and column
labels”, and “Tab” for the Column Delimiter), after which your data will be
imported.
Chartsmith User’s Guide
17
1
Tutorials
Wilson High
GPA
SAT
89.9
1223
Piedmont High 82.4
945
Cortland HS
1312
84.8
(Note: If you do not see Chartsmith listed in the Services menu of this application
then Chartsmith has not been properly installed - see the Installation instructions in
ReleaseNotes.rtfd).
Most applications adhere to a standard of tab and return delimited data. However,
not all applications support Services (Microsoft Excel is one that does not); if the
Chartsmith submenu items are not highlighted when text is selected in an
application, then the application does not support Services that can be used with
Chartsmith.
Import Data From ASCII Files
Data can be imported from ASCII files by dragging the file from the Finder
directly to the Data View, or by selecting the Data View -> Import ASCII Data
menu item. The data stored in the file must adhere to the same format restrictions
of data that is pasted using Paste Special. Specify the format of the data using the
Data Import panel that is brought forward.
Import Data From Microsoft Excel®
Data can be imported from Microsoft Excel files by using the Excel Import wizard.
Your Excel file does not have to be opened, nor does Excel need to be launched to
initiate the import. However, Excel must reside on your computer. Select the Data
View -> Import From Excel menu item. Once you do so, a wizard will appear on
the Data View window, which will walk you through the selections necessary to
import your data. First you specify your workbook (i.e. file), regardless if it is
opened or not, then you specify the worksheet within it, then you specify what data
in the sheet you want. Finally, the wizard requests the contents of the data that is
being imported from Excel. At the conclusion, your data is imported into the
current Data View.
The Data View Window's Series Palette
The Data View window has a little view on the right side labeled, "Series Palette".
Via icons, this view lists all of the series types that can be added to the current
chart. The series types that can be added is determined by the initial chart type. All
18
Chartsmith User’s Guide
Tutorials
1
series types that share the same layout can be mixed in the same chart, and thus, are
available on the Series Palette. For example, a Bar series and a Pie series cannot be
added to the same chart, but Bar series and Line series can be. The Series Palette
has two functions:
(1) By double-clicking an icon in the Series Palette, a series of that type will be
added to the chart. Double-click the Bar icon, and notice that a new series column
(displaying the same Bar icon) is added to the Data View, and the legend in the
chart now lists the new series that was added.
(2) By dragging an icon from the Series Palette and dropping it onto the top of a
series column in the Data View, you can change the type of the series. So click
and drag a Line series icon from the Series Palette onto a series column with a Bar
icon. When you do this, you will have changed the series type of that series from
Bar to Line. Add a new series now by double clicking an icon in the Series Palette.
Changing the drawing order of series
The series in a chart are drawn to the chart in the same order as they are shown in
the Data View. That is, the series represented by the leftmost series column is
drawn to the chart first. The second series is drawn to the chart second, and so on.
This order can be changed by simply pressing the Control key while you click and
drag the header of the series column in the Data View. To try this feature, be sure
you have more than one series column in your Data View, then control-drag the
series column to reorder the drawing. This feature is important when two series
have the potential to draw on top of each other - like a Bar series and a Line series
might.
Chartsmith User’s Guide
19
1
Tutorials
Dragging a Series Column to Reorder the Series in a Chart
Working in the Chart Window
Moving and resizing chart elements
A Chart Legend with Selection Knobs
Any chart item that displays selection knobs when selected can be resized by
dragging a selection knob, or moved by dragging the object from any point on the
object. Selected chart objects can also be moved one pixel at a time using the
arrow keys on your keyboard. Try resizing and moving the grid, legend and titles,
by first selecting them and then either dragging the object or one of its selection
knobs. Notice that as the legend resizes the series entries in the legend shift about
accordingly - this will only be noticeable if there is more than one series in the
chart.
Resizing the chart
The chart itself can be resized in a few different ways.
(1) The bottom-right corner of the chart displays the resize icon, which can be
clicked and dragged to resize the chart's height and width. Try clicking and
dragging it. If you wish to resize the chart larger than the window will allow,
either enlarge the window first, or use the Set Chart Size menu item, described
next.
Resize Bars in the Lower Right Corner of the Chart
20
Chartsmith User’s Guide
Tutorials
1
(2) The Chart -> Set Chart Size menu item allows you to set the size of the chart in
several different units. Select this option, and a panel will display. Select the units
you wish to use in specifying the size, and select the Constrain Proportions option
if you want to maintain the aspect ratio of the chart.
(3) The Chart -> Size To Fit Window menu item will set the size of the chart to
exactly fit in the Chart window.
Note: that when the chart is made smaller, if any of the chart graphics are pushed
off the chart during the resize, a panel is displayed providing the option to
Normalize the chart. If this option is chosen, the elements of the chart are resized
and repositioned according to the new size of the chart.
Coloring the Chart
Every graphical component of a chart can be colored by simply dragging colors
onto the object. Bring forward the standard Mac OS X Color panel via the Tools ->
Show Colors menu item and drag-and-drop colors onto any element of the chart to
set its color. Try dragging colors to the chart background, the grid background, a
bar in a Bar series, the legend title, the grid labels, etc.
Note: dragging colors to the chart title and subtitle will typically be uneventful
because this sets the title’s fill color which by default is not shown.
Fonts
All of the graphical objects in the chart that display text - which includes the
legend, grid, titles, series and annotations - have their text controlled via the
standard Mac OS X Font panel. Select the legend by clicking on it, then bring up
the Font panel via the Format -> Font -> Show Fonts menu item. Then change the
font via the font panel.
The chart titles and grid axis titles are rich-text graphics. This means that the text
within them can be made up of different font styles, sizes and colors. To
demonstrate this feature double-click the title of your chart and select a subset of
the text within, then bring forward the font panel and set the font of the selected
text. Now drag a color from the color panel to the text.
Working with the Inspector Panel
We will now work with Chartsmith's Inspector panel. Bring it forward using the
Tools -> Show Inspector menu item.
Chartsmith User’s Guide
21
1
Tutorials
Chartsmith's Inspector is a panel that is used to control the attributes of every
element of the chart. Clicking on a chart element selects it and automatically
updates the Inspector panel to display the controls that are relevant to the selected
item. Some chart elements are nested and thus require a double-click to display the
relevant inspector. This behavior is known as the selection-inspection paradigm
and is the most important thing you need to know about Chartsmith. If you want to
change something in a Chartsmith chart it really is as simple as point-click-change.
In this tutorial we will not go through all of the Inspector Panels in the application.
Instead, will highlight three key Inspector Panels: Background, Bar series, and
Grid.
Background Inspector Panel
When the Inspector panel comes forward, it displays the controls for whatever is
currently selected. If nothing is selected, the Background is, by default, selected. If
something else is selected, then the Background can be selected by clicking in the
chart where no other object exists, or by simply clicking the chart thumbnail in the
Navigator. Select the background now by clicking the chart thumbnail.
The controls near the top of the Background Inspector permit the setting of the fill
type and color used in the background. From left to right the fill types are: Solid,
Linear Gradient, Concentric Gradient, Radial Gradient, and None. If the fill type is
Solid then the left most color panel determines which color is used. If the fill type
is a gradient, then both color wells are enabled so that the two colors of the
gradient fill can be specified. Set the Background fill type to be the Linear Gradient
(the second square from the left at the top of the inspector), and then specify the
second color in its color well. Finally, try toggling the colors by clicking on the
Swap Button that sits between the two color wells.
22
Chartsmith User’s Guide
Tutorials
1
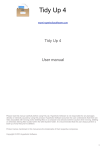
Background Inspector
Below the color wells there are three control areas that modify the parameters of
the gradient fills. The first, Granularity, determines the number of iterations used to
create the gradient effect. Higher granularity means more iterations and a smoother
effect. The second control is Angle, and is used to specify the angle used in
drawing the Linear and Radial Gradients. The third control is a small rectangle that
is a thumbnail for the Background. If either a Concentric or Radial Gradient is
specified it also shows a plus sign at the center point for the gradient. Click on
different areas of the thumbnail to change the center point for these two gradients.
Just below the Fill box on the Background Inspector is a switch and a color well for
controlling the border for the background. Turn the border on and off with the
check box and change the color of the border with the color well.
The Background will display an image if specified. The image can be set and
modified using the Image controls at the bottom of the Background Inspector. To
control how the image is displayed use the Layout and Opacity controls to achieve
the desired effect. Background images can also be set by dragging an image file
from the Finder and dropping it onto the Background.
Bar Series Inspector Panel
Many Inspectors in Chartsmith contain a tab view with two or more tabs. Each tab
controls a different set of attributes for the chart element that is under inspection.
The Inspector Panels for the different series each contain tab views with as many as
five different tabs. Here each tab stores controls different attributes sets for the
series. We'll look at each of these tabs for a Bar series. Keep in mind that this
Chartsmith User’s Guide
23
1
Tutorials
information applies to the other series inspectors as well. Select a Bar series in a
chart, then select the Style tab at the top of the inspector.
Bar Series with Style Tab
The Styles Tab stores the controls related to fundamental graphical attributes of the
series. For the Bar series, most of the controls are easily understood by
experimenting with them. The attribute at the base of this tab, which reads "Display
Series on the..." controls which Y-axis the series is measured by, when the grid has
two Y-axes. The Grid Inspector controls whether the left Y-axis (Y1), the right Y
axis (Y2), or both axes are displayed.
In addition to setting the Bar series' image by using the Set button in the Inspector
panel, an image can also be dragged and dropped onto any bar in the series.
In the Image portion of the Inspector panel, the Bar series image can be set to be
stacked by selecting “Stacked” for the Layout pop-up button. By doing this, one
instance of the image is displayed per step in the Grid. If you want to change how
many units a single image in the Bar series represents, you must change the Step
size in the Range sub-tab for the axis in the Grid, using the Grid Inspector.
24
Chartsmith User’s Guide
Tutorials
1
Bar Series with Labels Tab
The Labels tab is displayed for every series type, and its contents are always the
same. All attributes related to series labels can be set here; most notably the label
on/off is set with the Labels switch at the top of the tab. Turn labels on for your
currently selected series. Once displayed, the series labels' position, relative to the
series itself, can be set in the Inspector panel. Note, however, that the position of
each individual label can be custom set by double clicking on a series label in the
chart to select it, then dragging the label to a custom position. Try it now.
Bar Series with Shared Tab
Chartsmith User’s Guide
25
1
Tutorials
The Shared tab is displayed for a small set of series types, Bar series included. It
stores the controls for attributes that are common to all series in the chart that are
the same type as the selected series. In this case, that means all Bar series in the
chart. So, if an attribute of a series is set here, the attribute is changed for all other
series of this type in the chart. Most of the attributes set in the Bar Series Inspector
panel are only interesting if there is more than one Bar series in the chart, except
the shading attributes, which are only relevant for Bar series displayed on 3D Grid
Types.
Bar Series with Trends Tabs
The Trends tab is displayed for a subset of the series types. Within the tab you can
add mathematically derived trend lines to your series. Once one or more trends are
added to the series, the attributes for those trends can be altered. Try clicking the
Add Trend button. More information is available on trend lines in Chartsmith's online help.
The Error Bars tab is displayed for a subset of the series types. Within the tab you
can add error bars as well as specify how the error data is to be determined for your
series. More information is available on error bars in Chartsmith's on-line help.
26
Chartsmith User’s Guide
Tutorials
1
Bar Series with Error Bars Tab
Grid Inspector Panel
The Grid Inspector panel has three or four tabs that hold all the controls. These
tabs include the Main tab where the primary attributes of the grid are controlled, X
Axis tab where all of the attributes that are specific to the X Axis are controlled;
and the Y1 Axis tab where the controls for the left Y-axis are held.
If, from within the Main tab, you set the Y Axes attribute to Both, a right Y-axis is
added, i.e. the Y2-axis. This will add another tab to the Grid Inspector panel,
which reads Y2 Axis. Your Grid Inspector will then appear as:
Grid with Main Tab
Chartsmith User’s Guide
27
1
Tutorials
The contents of the X Axis, Y1 Axis and Y2 Axis tabs are identical, though each
addresses a different axis. The contents are divided between five different subpanels which are accessed via buttons labeled Axis, Range, Major, Minor, and
Labels.
Take a careful look at this structure to see how the higher-level structure is
established by the tabs, and how, for the Axis tabs, there are sub-panels used to
reach the exact axis controls you are seeking.
Grid with X Axis Tab and Axis Sub-Panel
Let's work a bit with the controls. To do so, if you don't already have one, create a
Bar chart and fill it with data. Now, from within the Main tab:
3D Grid Effect - turn on the 3D Effect and see that the Bar series gains a 3D effect
as well. This is the case for other series types too - that is, they have both a 2D and
3D representation based on the grid's 3D effect. These series include Bar, Line,
Area and Histogram. These series types can be made 2D or 3D by setting the Grid's
3D Effect.
Orientation - change the orientation of the grid to horizontal. This will convert
your Bar series from a vertical series to a horizontal series. This is applicable for
all series that can be displayed on the same grid as a Bar series, that is Bar, Line,
Area, Base-Error, High-Low, and High-Low-Open-Close.
Auto Adjust - This switch is used to enable/disable the grid feature whereby the
axis ranges, and some related attributes, are automatically adjusted based on the
ranges of the data in the series. We'll come back to this feature in a minute.
28
Chartsmith User’s Guide
Tutorials
1
Now, let's look at the Y Axis tab. First make sure that your grid is set to have a
vertical orientation in the Main tab, so your bars should be oriented vertically.
Range - In the Range sub-panel for the Y Axis (i.e. click on the Y Axis tab, then
on the Range button), you'll see three fields for the Min, Max and Step. Change
the Max to a number larger than the one that is there. The grid in the chart
immediately updates to adjust for its new range, and the Bar series is drawn
accordingly. Now change the Step to a larger number and note the change in the
chart.
By changing the range settings, you have effectively turned OFF the Auto Adjust
feature. That means that if you were to edit the data in the Data View, the axis
ranges would not adjust automatically to accommodate the new data. To have the
grid once again auto-adjust its range, go back to the Main tab and click ON the
Auto-Adjust feature.
Labels - Take a look at the Labels sub-panel for the Y Axis. There are lots of
controls here for changing the label content, color, position, rotation, and exactly
which labels should be displayed.
Continue to work your way around the Grid Inspector panel. There is a surprising
amount of control that is provided there and should be leveraged in your chart
making.
Annotations
To add annotations to your chart, click the Annotation panel shortcut button or
choose Tools -> Show Annotations, then drag any of the annotations found there to
the chart. Chartsmith provides Text, Box and Image, Line, Circle and Balloon
annotations. Adding free floating images to a chart is accomplished by dragging
and dropping an image into a Box annotation, or setting the image from the Box
Inspector panel.
Annotation
Chartsmith User’s Guide
29
1
Tutorials
Templates
Chartsmith templates store attributes for any component of a chart. Templates are
created from an existing chart and can subsequently be used to format other charts.
Create a Template From a Chart
Select any chart and select the Chart -> Save As Template menu item. In the save
panel that displays you can choose which components' attributes should be stored
to the template. Choose which chart attributes to be included in the template. By
default, templates will be saved to your ~/Library/Chartsmith folder, but this
destination can be changed in the save panel.
Apply a Template to an Existing Chart
Select a chart and select Chart -> Apply Template. You can choose which
components' attributes should be applied to the chart from the template.
Drag a Template From the Finder
Select a chart, and then find a template file in the Library/Chartsmith folder stored
in your Home folder. Drag this file from the Finder directly onto the chart to apply
the template. Alternatively, you may drag the template onto the selected chart in
the Navigator.
Apply a Template to More than One Chart
If you wish to apply a template to more than one chart, select all of the charts you
want the template applied to in the Navigator, then drag and drop the template file
from the Finder onto the Navigator, which will apply the template to all the
selected charts in the Navigator.
Create a New Document or Chart From a Template
Instead of setting up the chart, then applying a template to it, you can instead create
a new chart that has all the attributes that are stored in a template. The Chart ->
Add From Template menu item will add a new chart, based on the selected
template, to an existing document. The Document -> New From Template menu
item will create a new document whose first chart is based on the selected
template.
This concludes the Intermediate Tutorial. By performing this tutorial, you have
been introduced to the primary features and functions within Chartsmith. If you
want to learn some of the advanced features within Chartsmith, proceed to the
Advanced Tutorial.
30
Chartsmith User’s Guide
Tutorials
1
Advanced Tutorial
Overview
This tutorial will take you from competent user to expert user. The features and
techniques covered in this tutorial will give you total command of Chartsmith and
allow you to produce the finest results with the utmost of ease.
Working in the Data View Window
Setup for Tutorial
Launch Chartsmith, and create a new document with a single Bar chart in it.
All of the ways to Add Series Columns
Each column in the Data View corresponds to a series in the chart. Chartsmith
provides several ways to add a new series column to an existing chart, they are
outlined below:
(1) Select a series column by clicking once in its label cell. Hit the Enter key on the
numeric keypad. This will create a new series column immediately to the right of
the selected series in the Data View.
(2) In the Data View submenu, choose Add Series Columns, which will add any
number of new series columns immediately to the right of the selected series in the
Data View.
(3) Select a series column, then select Edit -> Copy and Edit -> Paste to duplicate
this series column.
(4) Double click one of the icons in the Series Palette. This inserts a new series, of
the type represented by the icon, immediately to the right of the selected series.
(5) Click the Add Series Column button, which will add one new series column
immediately to the right of the selected series.
All of the ways to Add Rows
(1) Select a row by clicking once in its label cell, and hit the Enter key on the
numeric keypad. This will create a new row immediately below the selected row in
the Data View.
(2) In the Data View submenu, choose Add Rows, which will add any number of
new rows immediately below the currently selected row in the Data View.
Chartsmith User’s Guide
31
1
Tutorials
(3) Select a row, then select Edit -> Copy and Edit -> Paste to duplicate this row.
(4) Click the Add Row button, which will add one new row immediately below the
currently selected row in the Data View.
Data Fill Button
Delete Row
Button
Add Series
Column Button
Delete Series
Column Button
Add Row
Button
Data View Window
Data Fill: Generating Data Sequences
Chartsmith provides a utility for automatically generating data sequences - the Data
Fill utility. Select all rows in the Data View, and then bring up the Data Fill panel
using Data View -> Data Fill panel menu item or the shortcut button on the Data
View. The Data Fill panel accepts a start value, a step value and other options.
Try a start value of "January 2003", a step of 1 and linear step units. Then try a
start value of "Q1 2001", or "11/3/1993" or "Monday". Note, the Data Fill feature
can also be used to automatically generate column (Series) and Row labels. To see
how this works select a set of rows or column and then execute the Data View ->
Select Labels Only menu item. Data Fills are not inserted into the appropriate label.
Date and Duration Data
While the typical data entered in the data cells of Chartsmith's Data View are
numbers, Chartsmith supports the input of dates and durations as valid data values.
Create an XY chart in Chartsmith, and then enter the following data.
32
Chartsmith User’s Guide
Tutorials
Jan 3
1
43
Jan 21 55
Feb 16 58
Feb 25 72
You will notice that Chartsmith charts the data but the values along the X Axis are
interpreted as numeric, rather than dates. This can be changed in the Grid
Inspector panel. To do so, select the Grid, and then click the X Axis tab in the Grid
Inspector, then the Axis sub-panel in that tab. Here you can change the Axis Type
to Date. If the resulting labels along the X-axis are not to your liking, go the
Labels sub-panel in the X Axis tab of the Grid Inspector panel, and there you can
alter the format of the X-axis labels.
If you want to use duration (i.e. relative time) values in the Data View, those are
formatted as any combination of Weeks, Days, Hours, Minutes and Seconds, with
their respective labels from the set (WwDdHhMmSs), e.g. 5W 2h 32S. When
duration data is used, the Axis Type must be set to Duration.
The Axis Sub-Panel
Working in the Chart Window
Exporting Images the Easy Way
Charts can be exported using the Chart -> Export Image menu item. But if you
want a TIFF or PDF image, then there is an easier way to export images. Simply
Chartsmith User’s Guide
33
1
Tutorials
hold down the Option key, click anywhere in the chart and drag the image out of
the Chart View. The resulting icon can be dropped into any application that
accepts dragged TIFF images. Similarly, hold down the Command key to drag out
a PDF image.
When dragging out TIFF images, the resolution of the image is set to what is
specified within Chartsmith's Preferences.
Reordering Series from within the Chart
Series in a chart can be reordered by Control-dragging the series columns in the
Data View. This function can also be performed from the Chart window. Hold
down the Control key, click a series entry in the Legend and drag the entry to the
position you would like the series to have.
Control Dragging Legend Entries
Reordering Charts in the Document
For documents with more than one chart in them, holding down the Control key
and then clicking and dragging any thumbnail in the Navigator can change the
order of the charts.
Color Previewing - Cool!
Want to see what your color choice looks like before you commit to it? Hold down
the Option key as you drag a color swatch across your chart. The color-previewing
feature will display what would happen if you were to drop the color swatch at the
current location.
Miscellaneous Stuff
Printing
Chartsmith's printing function will, by default, print the chart at its current size and
in PDF format. But you have options. Choose to print your current document, and
notice the third pop-up button. It probably says "Copies & Pages". Select this
popup and drag down to the "Chartsmith" item in the popup. Once selected, this
item displays two options in printing: (1) a choice of PDF or TIFF format for the
34
Chartsmith User’s Guide
Tutorials
1
print job, and (2) an option to size the chart to precisely fit the paper to which you
are printing.
The difference between PDF and TIFF printing is substantial. PDF printing
provides a vector image to the printer that results in crisp lines, but loses any
transparency effect in the chart. TIFF printing maintains any transparency you
have in your chart, but is a raster image that does not have crisp lines. It is
recommended that you use PDF unless you have transparency in your chart that is
important to maintain.
Preferences
Chartsmith Preferences, accessed via the Chartsmith -> Preferences menu item,
allows you to customize some of the behavior of the application. Each segment of
Preferences is noted here.
(1) Change First Series Type
Choose Chartsmith -> Preferences to bring the Preferences panel forward. Choose
the Series tab and click on the button representing the chart type, which you would
like to be the first chart in new documents. To save these changes, click the Set
button.
These changes are put into effect immediately - every new document will contain
one chart of the type you specify. Open a new document using the Document ->
New menu item to see your choices in action.
(2) Preferred Templates for New Charts
Under Templates in the Preference panel, you may specify one template for each
chart type. Once a template is specified for a given chart type, that template will be
applied to any new charts that you create of that type. This is a powerful means to
setup all your charts to look a certain way. For example, say you want to change
the background color to white and hide the Chart Subtitle in every new chart. To
do this, create a chart with these attributes, and save the background and title
attributes to a template. Then, in Preferences, set this template to be the NewChart Template for all of the chart types.
(3) Change Preferred Series Colors
When new series are added to a chart, the colors are determined from the series
colors set in the Preference panel under Series Colors.
Chartsmith User’s Guide
35
1
Tutorials
(4) Fonts
The initial fonts used for Text and Balloon annotations, and the Data View data
and labels are set within this segment of Preferences. These fonts can be changed
for each individual annotation.
(5) Auto-Update
Receive notice each time a new version of Chartsmith is released, and, at that time,
have the option of downloading.
(6) Other Preferences
The Preference panel also has a Miscellaneous tab that allows you to choose
whether a new document is opened at startup, whether backup documents are
created, if transparency is allowed in any charts, whether the Data View window is
visible when Chartsmith is not the active application, the JPEG compression rate
for image exporting, the default resolution of images that are exported from
Chartsmith, the depth of the Undo stack (i.e. how many sequential undo actions can
be taken), and the image format in which charts are copied then pasted to other
applications.
Chart Notes
Associated with each chart are textual notes that are stored with the document. To
edit these notes, click on the Chart Notes shortcut button (the pencil icon at the
upper left of a Chart window), or click the Chart -> Show Chart Notes menu item.
This will open a drawer on the Chart window into which text can be submitted. As
charts are selected with the document, the notes shown in the drawer are updated
for the selected chart.
This concludes the Advanced Tutorial. If you have worked through all three of the
tutorials, congratulations! By doing so you have gotten the best introduction to the
features and functions in Chartsmith. So good luck, and happy charting!
36
Chartsmith User’s Guide
2
Concepts
2
Concepts
Overview
Chartsmith is for making charts-visual representations of data. It keeps charts in
documents (a document can contain many charts) and displays them in Chart
windows, one for each Chartsmith document you have open.
You can make many changes to the appearance of the charts by acting directly in
the Chart window. Colors can be dropped directly on every chart element, and
images can be dragged from the Finder, or other applications that support drag and
drop, and dropped in the background, on bars and in box annotations. You can also
drag chart images out of Chartsmith and into the Finder and other applications.
The underlying data that determines the height of a chart's bars, or the size of its
pie's slices, etc. lives in the Data View window. In addition to entering data there,
you can hide and show fundamental chart elements, as well as add and change
series types and rows.
The chart elements that cannot be changed directly (the scale and labeling of the
grid, for example), can be changed by selecting the chart element and using the
controls in the Inspector panel to make your changes.
The Color panel (Mac OS X - standard) acts as a source for drag and drop color.
The Annotate panel provides drag and drop shapes for text annotation and graphic
enhancement, and a standard Mac OS X Font panel is available for changing the
font and style of all chart text.
The Chart Window
At Chartsmith's center, conceptually speaking, is the Chart window. That's where
the charts you create appear. Each document lives in its own chart window.
Documents can contain many charts but only one--called the active chart--can be
displayed at a time.
The type of chart that will appear first when you use the File -> New menu item
depends on the settings in the Preferences panel available from the Chartsmith
menu. For more information see Reference - The Chartsmith Menu - Preferences.
38
Chartsmith User’s Guide
Concepts
Shortcut
Buttons
2
Title Bar
Chart View
Navigator
Title and Subtitle
Thumbnail
Current Chart
Legend
Background
Series
Chart Indicator
Grid
Chart Window
Adding Charts to Documents
The first two entries in the Chart menu are used to add a new chart to the active
document. Chart -> Add Chart has a sub-menu for each chart type and Chart ->
Add Chart From Template is used to make a new chart from a template. The new
chart will appear immediately following the chart that is active (the current chart)
when you use the command. (See Concepts - Using Templates for information
about using templates to make new charts look like ones you've previously made.)
Navigating Among and Reordering Charts
The vertical area to the left of the chart being displayed is called the Navigator. It
contains a list, in thumbnail form, of all the charts in the document. Selecting
(clicking) a chart thumbnail in the Navigator makes that the active chart and causes
it to be displayed in the window.
Dragging in the Navigator selects several chart thumbnails at once for copying, or
applying a template to more than one chart. The selection highlight will surround
all the selected charts while the black rectangle continues to surround the active
one.
Chartsmith User’s Guide
39
2
Concepts
Holding the Control key down while you grab a chart thumbnail lets you reorder
the charts in a document by dragging and dropping them at different locations in
the Navigator.
Resizing Charts
You can resize the Chart window (as you would any other resizable Mac OS X
window) to enlarge the area available for the chart. You can either use Chart ->
Size To Fit Window menu item to expand the chart to fill the available space, or
you can grab the bottom edge, right edge, or corner of the chart area (the pointer
will change shape to indicate when you're over a "grab-able" edge or corner) and
drag it to the size you want.
Using the Chart -> Normalize Chart menu item will then resize the grid to fit the
appropriate amount of space and put the chart's title, subtitle and legend back in
their default positions. (This command is also useful as a kind of "let's start over"
command when you've been moving and resizing chart elements and want to get
back to the default arrangement.)
Dragging Color, Images, and Templates into the Chart Window
You can drag color from the Color panel and drop it directly on the various
elements in the chart. If you press the Option (Alt) key while holding a color you
can see a preview of what will happen if you were to drop the color at that location.
(This feature is especially helpful for coloring lines.)
You can drag image files from the Finder and drop them directly into the
background, or into box annotations, or into the bars, pies, areas, histograms, and
bubbles of charts with those series types.
You can drag Chartsmith templates from the Finder and drop them directly on the
active chart to apply them to that chart, or in the navigator to apply them to all
currently selected charts. You can also drag Chartsmith templates from the finder
and drop them on the Chartsmith icon on the Dock to create a new document with a
single chart formatted according to the template.
Moving and Resizing Chart Elements
You can grab and move a chart's title, subtitle, legend, grid, and annotations. You
can also click to select them and then resize and shape them by dragging their
selection handles. Using the Chart -> Normalize Chart menu item returns all
elements (except annotations) to their default positions and relative default sizes.
40
Chartsmith User’s Guide
Concepts
2
In all charts, except pie charts, you can click the legend entries within the legend to
select the corresponding series graphics in the chart. If you hold down the Control
key while you grab the legend entries, you can drag them to new positions within
the legend, moving the series graphics in the chart itself and changing the order of
the series columns in the Data View window in the process.
Editing Text in the Basic Chart Elements
Double-clicking the chart title, subtitle, and axis titles selects their text. You can
then type in new text and use the Font panel (Format -> Font - > Show Fonts) to
change the font of the selected text, and the Color panel (Tools -> Show Colors) to
change the color of the selected text.
To change the font of the text labeling the major lines on the grid (tic labels), select
the grid and use the Font panel. To change the tic label font for only one axis,
select just the axis before changing the font. Likewise, using the Font panel while
the legend is selected will change the font of all text inside. (To change the text for
the tic labels and the legend title, use the Inspector panel described later in this
section.)
Printing Charts
From the standpoint of printing, Chartsmith considers each chart in the document
to be a separate page. If the All button is selected in the Print panel, all the charts in
the document will be printed. If you would like to print multiple charts per page,
select Layout from the third pop-up button on the Print panel. Here you will find
many options for customizing your print job.
If you want color transparency to be reflected on the printed page, select
Chartsmith from the third pop-up button on the Print panel, and then click the
Bitmap button. From this panel you can also choose Size to Fit Page to enlarge or
shrink the chart(s) being printed as necessary to fit the size and layout of the page.
(Note: When you choose Bitmap, the larger the image the longer it takes to print.
Though the PDF choice can't print transparent effects, it's generally faster,
especially when you've checked Size to Fit Page.)
Exporting Charts
Chartsmith can provide PDF, EPS, TIFF, JPEG, GIF, PNG, and PICT images of its
charts via the Chart -> Export Image menu item. The top half of the Export Image
panel is a standard Mac OS X “Save As” panel. The bottom half provides controls
Chartsmith User’s Guide
41
2
Concepts
for choosing the image format, image resolution (bitmap formats only), and
compression (JPEG only).
When you use the Edit -> Copy menu item, both TIFF and PDF formats are
provided to the pasteboard. When you then use Edit -> Paste in another application,
the pasteboard will provide whichever format that application requests.
Under some circumstances you may want to force the pasting application's choice
by providing only one format to the pasteboard. If so, you can use the checkboxes
under Miscellaneous in the Preferences panel to turn off either of the formats.
Color transparency, for instance, is included in TIFF but not PDF. If you turn off
PDF in Preferences, only the TIFF format will be copied and thus available for
pasting. For more information see Reference – The Chartsmith Menu –
Preferences.
In addition to exporting charts via Edit -> Copy, you can drag chart images directly
from Chartsmith to other Mac OS X applications, which like the Finder, support
drag and drop. To drag out a TIFF image, hold down the Option (Alt) key when
you grab the chart. Use the Command key to grab a PDF image.
42
Chartsmith User’s Guide
Concepts
2
Bringing Up the Inspector Panel, Color Panel, Annotation Panel
and Chart Notes Drawer
The four buttons above the Navigator bring up (from left to right) the Annotation
panel, the Color panel, the Inspector panel, and the Chart Notes drawer, all of
which are described below in the sections following the Data View window
discussion.
Think of the Inspector, Color, and Annotation panels, plus the standard Mac OS X
Font panel available from the Format -> Font -> Show Fonts menu, as giving you
control over the surface appearance of the charts whose skeletal structure is
determined by the titles, labels and data in the Data View window (described next).
The three panels are also available via the Tools menu. The Chart Notes drawer is
available via Chart -> Show Chart Notes menu item.
The Data View Window
Think of the Data View window as a kind of inspector for the skeleton or structure
of a chart. Whether the chart surface is a set of bars or a line, it's the data in the
Data View window that determines their relative sizes. And it's the series settings
for the data columns, also in this window, that determine whether you will in fact
see bars or lines or one of the other series types supported by Chartsmith.
Document Name and
Chart Number
Column Header
Series Labels
Chart Attribute
Controls
Row Labels
Chart Update Button
Data Cells
Data Fill Panel Button
Add and Delete Series
and Rows
Series Palette
Data View Window
Chartsmith User’s Guide
43
2
Concepts
The Data View window always appears when you open or start a new document.
You can also bring it up with the Data View -> Data Viewer menu item. When it's
open, its contents always reflect the contents of the currently active chart in the
currently active Chart window. In other words, Chartsmith will let you have many
documents and thus many Chart windows open simultaneously, but there's never
more than one Data View window. If you click from chart to chart whether within
a document or across documents, the contents of the Data View window will
change accordingly.
Adding, Changing and Reordering Series Columns
Chartsmith charts are categorized by the types of series that they can display. When
a new chart is added to a document, the initial series type is specified. From that
point forward only series types compatible with the initial series type can be
displayed in that chart.
For example, if a new Bar chart is added to a document, only series types
compatible with the Bar series can be displayed in the new chart. Currently,
Chartsmith offers six (6) series types for a chart first created as a Bar chart. These
are: Bar, Line, Area, Hi-Lo, Hi-Lo-Open-Close, and Base-Error.
Note: While the types of series that can be displayed in a chart first created as a Bar
chart are limited, the combination of chart types that can be produced with these
series is unlimited. This is true because the number and combination of series
included in a chart is unrestricted. For example, you could create a chart with three
Bar series, or you could convert two of the Bar series to line series, creating a
mixed chart with one Bar and two line series. You could also create a chart with
two line series and four area series, eliminating the Bar series added when the chart
was first created.
To add a column of a specific series type, double click its icon in the Series palette.
The new column will appear immediately following the current selection or at the
end if there is no current column selection. To change a column from one series
type to another, drag a series icon (from the Series Palette) and drop it on the
column header (or group of selected columns) that you want to change.
Pressing the Enter key, on the numeric keypad, while a column is selected will also
produce a new column. Its series type will match the series type that was first used
to create the chart. This setting also determines the type for series added with the
Data View -> Add Series Columns menu item. That command brings up a panel
into which you can enter the number of series columns to be inserted.
44
Chartsmith User’s Guide
Concepts
2
Grabbing a series column while holding down the Control key will let you drag it
to a new location. (Chartsmith draws the series in a chart based on the relative
positions of the columns in the Data View window. The leftmost column is drawn
first. Sometimes you may want to rearrange the series so that the one you want on
top will be drawn last.)
Adding Rows
If one or more rows are selected, pressing Enter (on the numeric keypad) will
produce a new row immediately following the last selected row. The Data View ->
Add Rows menu item brings up a panel into which you can enter the number of
rows to be inserted. They will be inserted following the current selection or at the
end if there is no current row selection.
Controlling the Display of the Basic Chart Elements
Typing text into the Title, Subtitle, X-Axis Title, Y-Axis Title, and Y2-Axis Title
fields at the top of the Data View window places the text in the Chart. Clicking the
check boxes next to the chart element names at the top of the window hides and
shows each of those chart elements. Note, the Y1-Axis Title and Y2-Axis Title can
only be edited when their respective axis is enabled. See Concepts – Using and
Inspecting the Grid, for more information on enabling and disabling the Y1 and Y2
axes.
(To change the Legend title text, and the tic labels use the Inspector panel.)
Automatic Label and Data Fill
Clicking the small button labeled “AB123” brings up the Data Fill panel (as does
clicking Data View -> Data Fill Panel). This panel is especially useful in
conjunction with the Data View -> Select Labels Only for automating the filling of
labels with days of the week, months of the year, etc.
For example:
• In a chart with several rows, select them all and then click Data View -> Select
Labels Only menu item;
• In the Data Fill panel, enter Mon for Start, 1 for Step and select Days from the
Step Units set.
Chartsmith User’s Guide
45
2
Concepts
• Click Fill to fill the row or column headings with Mon, Tue, Wed, Thu, etc. for as
many rows as you have selected, repeating if you've selected more than seven. A
step setting of 2 would have produced Mon, Wed, Fri, etc.
• Now do it again first selecting several columns before the fill.
Both the Day and the Month settings recognize both full names and three letter
abbreviations for the days of the week and the months of the year. (January,
january, Jan, jan, Monday, monday, Mon, mon, etc.)
All four calendar settings-Days, Months, Weeks, Years-recognize a variety of date
formats, so a '10-jan' Start entry, for instance, with a Step value of 1 and Weeks
selected will produce 10-jan, l7-jan, 24-jan, 3l-jan, 7-feb, etc. The Data Fill panel
also understands quarters, so a Start of 'Q3 94' and a Step of 1 with Linear selected
produces Q3 94, Q4 94, Ql 95, etc.
For a complete listing of all the formats, including all the different date formats,
supported by the Data Fill panel, see Reference - The Data View Menu – Data Fill
Panel.
Decimal and Thousands Delimiters
Chartsmith interprets the numeric data according to the setting found in the Mac
OS X System Preferences, under the International Formats panel. If the preference
is set for period-decimal and comma-thousands, Chartsmith will interpret the data
in this way. Likewise, if the preference is set for comma-decimal and periodthousands then Chartsmith will use that setting to interpret the data.
Importing Data From Other Sources
Chartsmith provides support for importing data via Mac OS X Services, via the
Import ASCII Data, Paste, and Paste Special commands, as well as through drag
and drop of ASCII data files.
When importing data through any of these mechanisms (with the exception of
Paste), Chartsmith brings up an Import Data panel. In it you can choose a column
delimiter (Tab, Comma, Space, Colon, Semicolon, or Whitespace), and you can
designate whether the data being imported contains row and/or column labels.
Chartsmith will also produce the Import Data panel in response to the Edit -> Paste
Special and Data View -> Import ASCII Data File menu items, discussed below.
If the data you want to chart is in an application that supports Mac OS X Services,
you can select the data and choose a chart series type from the Services ->
46
Chartsmith User’s Guide
Concepts
2
Chartsmith submenu, all from within the other application. This will send your data
directly to Chartsmith to create a new chart displaying the selected data.
Chartsmith then brings up the Import Data panel, you specify the data content, your
data is loaded, and your chart is created.
When using Data View -> Import ASCII Data File, which allows you to import
data that is stored in a file having ASCII format, Chartsmith first produces an open
panel from which you select the ASCII document containing the data. Next the
Import Data panel is produced allowing you to choose a delimiter type and specify
the data content. Then, regardless of what's selected in the Data View window, it
starts with the cell in the upper left corner and imports the data, adding rows and/or
columns if necessary to fit it all in.
Dragging an ASCII file from the Finder and dropping it into the Data View is the
same as using the Data View -> Import ASCII Data File menu item.
In the Edit menu you will find two paste commands: Paste and Paste Special. Paste
assumes there are no labels in the data and that the data is delimited by tabs. Paste
Special makes no such assumptions, allowing you to specify the content through
the Import Data panel.
With both paste commands, what's selected in the Data View window determines
how the data is pasted. If only one cell is selected, Chartsmith will begin the paste
from that cell, moving to the right and down as necessary to accommodate the data.
If there are not enough rows and columns for all the data, Chartsmith will bring up
an alert panel in which you can say whether you want the sheet expanded or the
data truncated to fit.
If more that one cell is selected when you paste and there's not enough room for all
the data, the alert panel gives you the choice of canceling the operation or
truncating the data. And if more cells are selected than your paste data requires,
Chartsmith will repeat the paste data as often as it can repeat it in its entirety.
Import Data From Microsoft Excel®
Data can be imported from Microsoft Excel files by using the Excel Import wizard.
Your Excel file does not have to be opened, nor does Excel need to be launched to
initiate the import. However, Excel must reside on your computer. Select the Data
View -> Import From Excel menu item. Once you do, a wizard will appear on the
Data View window, which will walk you through the selections necessary to
import your data. First you specify your workbook (i.e. file), regardless if it is
opened or not, then you specify the worksheet within it, and then you specify what
Chartsmith User’s Guide
47
2
Concepts
data in the sheet you want. Finally, the wizard requests the contents of the data that
is being imported from Excel. At the conclusion, your data is imported into the
current Data View.
Whenever a data import from Excel has been completed Chartsmith stores all the
information required to perform an update. This allows Chartsmith to refresh the
data import at any time. Simply choose the chart to be updated and under the Data
View menu item select Update Import from Excel. If there are multiple charts in a
document that have data imported from Excel, Update All Imports from Excel will
refresh the entire document.
Chart Update Button
The Chart Update button (located just above the series palette and to the right of
the Data Fill button) is a way to turn off/on automatic chart updating. By default
Chartsmith will instantly update (redraw) the chart to reflect any changes in the
Data View window. Clicking this button will tell Chartsmith not redraw the chart
until the button is clicked again. This feature is useful when working with large
data sets. Note: Selecting any item in the Chart View automatically enables
automatic updates.
The Inspector Panel
Unlike the Data View window, which only knows which chart is selected, the
Inspector panel knows which part of the chart-background, grid, legend, series, title
text or annotation-is selected. As you click among the elements in a chart, the
Inspector's contents change to provide whatever controls are available for the
current selection.
Changing settings in the Inspector panel changes the chart element being inspected.
In general the changes take place under two circumstances: 1) as soon as you click
out of a field you can type into or press Return to leave it; and 2) when you let go
of the slider, rotation knob, etc. you're dragging.
The best way to learn what can be done with the Inspector panel is to select chart
parts and experiment. The subsections below describe Inspector controls that come
up often in many different contexts. The sections that follow describe Inspector
panel use (along with other panels) within the context of managing color, images,
text and annotations, the legend and series graphics, and the grid.
48
Chartsmith User’s Guide
Concepts
2
As in general with Mac OS X, double clicking on the text in a text field selects it,
slider knobs mean "grab and drag me," check boxes mean "click me on and off,"
and a grayed or disabled option means "not available under the circumstances," i.e.
"given the current selections in the chart and Inspector panel, this does not apply."
Shift-clicking chart parts adds to and subtracts from the current selection. When
multiple selections are meaningful, the Inspector panel provides relevant controls.
Sliders, Steppers and Text Fields
When sliders and text fields are associated, moving the slider changes the number
in the field, or you can double-click and edit the number directly.
This rotation knob with an associated text field (used for text and for pies) is really
just a text field hooked to a different looking slider knob on a circular slide.
Text fields that stand-alone respond to clicks like text fields associated with sliders.
Double-click to select the field and the text within it so you can edit the number,
then click a new selection or press Return to put the new value into effect.
Stepper controls are usually associated with text fields and like sliders allow you to
modify the text field. The up and down triangles allow you to incrementally step
through increasing or decreasing values.
Chartsmith User’s Guide
49
2
Concepts
Buttons for Choosing from Sets
All the buttons below share a common behavior: the selection highlight indicates
the current choice and there's always one and only one selection. So your action is
always the same whether you're:
50
Chartsmith User’s Guide
Concepts
2
choosing general grid controls or axis-specific ones, or
selecting the Y-axis configuration for a chart, or
picking the line type for the current selection, or
choosing markers for the current selection, or
choosing among fill options for the background.
This popup menu (as indicated by the up and down triangles in the blue area at the
right) comes from the inspector that controls automatic data labeling for all the
various series. It also allows you to choose one option from a set, but the current
selection is indicated by the text showing rather than by a selection highlight. Click
on the menu to produce the choices, drag to the one you want, then let go to set it.
Using and Inspecting Color
The most powerful Chartsmith color management tool is "Color Preview." To use
it you simply press the Option (Alt) key, drag a color from Chartsmith's Color
panel, an hold it over what you want to color to see the change that will take effect
if you drop the color at that point. (The Color panel is available either from the
Chartsmith User’s Guide
51
2
Concepts
Tools menu or via the second button, from the left, in the upper left hand corner of
the Chart window.)
Some chart items can be hard to "find" by dragging color on them-the thin line
surrounding the bars in a bar chart, for instance, or the data labels when they've
been made visible via the Inspector panel. In such cases, there's generally a color
well for the chart element in the Inspector panel to which you can drag the color
instead.
Gradient Fills
Two color wells linked like these are used to set the starting and ending colors for a
gradient fill, i.e. an area fill that starts with one color and gradually changes to
another. With a gradient fill in effect (usually accomplished by clicking a check
box), colors can be dragged into both wells. Clicking the small triangles between
them reverses the direction of the gradient fill.
In the case of Pie charts, where each pie slice has a different color, the Inspector
panel provides a Color well for the color at the center of the pie. With Gradient Fill
turned on, each slice will gradually change from that color to its series color. Color
the slices by dropping color directly on them. If you have Gradient Fill turned on,
drop color on the edge of a slice to change the color of the slice. Dropping it in the
center changes the center color and will apply to all slices.
Angle and Granularity in Background Gradient Fills
In addition to the solid fill (first box) and "No Fill" (last box) choices, there are
three gradient fill options for chart backgrounds. If you select any of the three, the
52
Chartsmith User’s Guide
Concepts
2
Granularity control becomes available, and if you select the second or fourth (from
the left) the Angle control also becomes available.
The Granularity control lets you set the number of bands in the color change from
2 to 100. The Angle control lets you set the angle that the bands run. To get a feel
for what this means, select a gradient option and set granularity to 2, then select
each of the other gradient options in turn. While the second and fourth options are
selected, change the Angle slider as well and watch the result.
If you've selected either the concentric or radial patterns (third and fourth from the
left) you can click in the image view (to the right of the Granularity and Angle
control group in the Inspector panel) to set the center point for the gradient fill.
Color Transparency and The "No Fill" Option
If a color well contains a rectangle divided on the diagonal, it means the current
color contains some transparency. The lighter the portion on the right, the greater
the transparency. You create transparency with the Opacity slider/text field near the
bottom of the Color panel. The settings can range from 100% (completely opaque)
to 0% (completely transparent).
Not all Mac OS X applications know how to deal with color transparency. If your
goal is simply a transparent background when you export the chart to other
applications, you can avoid the issue by using the Background Inspector’s “No
Fill” option. That guarantees an utterly empty background when you drag or paste
the chart somewhere else.
Another way to avoid the issue is by clicking off the Allow Use of Transparency
switch under Miscellaneous in the Preferences panel. Turning this switch off
removes the Opacity slider from the Color panel.
Also under Miscellaneous in the Preferences panel is a pair of switches for
determining what formats will be supported when you use the Edit menu's Copy
command. With both switches on, Chartsmith automatically puts both TIFF (which
contains transparency information) and PDF (which does not) on the pasteboard
when you use Copy. If you want to force the application you're pasting into to use
the TIFF format when it pastes, turn the PDF switch off here.
Use the Bitmap option on the Print panel (first select Chartsmith on the third popup button) to print color transparency effects.
Chartsmith User’s Guide
53
2
Concepts
Note: The Color panel is NOT an Inspector, i.e. it does not change in response to
changing what's selected in the chart, nor does it reflect the transparency value of
the color belonging to the current selection. To inspect and modify the contents of
a Color well click the edge of the color well. This will load the current color into
the Color panel and any changes made to the Color panel will be reflected in the
colors controlled by the Color well. Clicking the edge of a linked Color panel will
break the link and cause the Color well and the Color panel to operate
independently once again.
Series Colors
Each time you create a new series column Chartsmith chooses a color for it based
on the Series Color Look Up Table setting in the Preferences panel.
If there are more than seven series in a chart, Chartsmith reuses the settings,
repeating the order over and over as necessary. If you want different look up colors
for any series just drag and drop color on look up color you want to change.
Note: The Preferences panel is not an Inspector. Dragging new colors into it has no
effect on series, which already exist, in the current chart. Color changes in the
Preferences panel apply only to future series created in charts.
Using and Inspecting 3D Effects
Every chart in Chartsmith has an option for the grid (or pie) to be 3D. Only the
bar, line, area, histogram and pie series are drawn with a 3D effect when their grids
are 3D enabled. All remaining series are drawn to a 3D grid, but they look the same
as if the grid were 2D. Applying a 3D effect can significantly enhance a chart's
54
Chartsmith User’s Guide
Concepts
2
dramatic impact. When the 3D effect is on, Chartsmith also gives you control over
a variety of details that can enhance the effect and show it off to its best advantage.
Grids
In all charts except pies charts, the 3D effect is applied to the grid by
• selecting the grid,
• clicking the Main button at the top of the Inspector panel, and
• clicking the 3D Effect checkbox in its middle.
With the 3D Effect check box on, the three controls below it become available as
well. The first determines the depth of the grid. Values from 1 to 40 are available.
The second control, Angle, does what its label implies. Angle rotates the viewing
angle on the grid. The third control, Shading, determines the darkness of the side
and bottom panels created when the grid is made to be 3D.
Bar and Histogram Charts
When 3D effect is on for bar and histogram charts, the top and side shading of the
bars can be adjusted by first selecting one the series in the chart, followed by
clicking the Shared button at the top of the Inspector panel. This activates the Top
and Side Shading controls, which can be set between 0% (none) and 100%(dark).
Pie Charts
In pies charts, the 3D effect is applied by
• selecting the pie,
• clicking the Style button at the top of the Inspector panel, and
• clicking the 3D Effect checkbox on the left side near the top.
Chartsmith User’s Guide
55
2
Concepts
Pie charts have no grid, so the 3D effect is applied directly to the pies. First select
one or more pies, and then click the 3D Effect checkbox in the Inspector panel.
With the 3D effect on, you can use the three slider/text field controls to set the
thickness of the pies (height), how much the top and bottom appear to fall into and
out of the background (Elevation) and how much the right and left sides appear to
tilt upwards and downwards (Angle).
Using and Inspecting Images
Chartsmith supports the use of images in the following chart elements:
Bar Series
Area Series
Pie Series Slices
Histogram Series
Bubble Series
Box Annotations
Background
If you drag in an image and drop it directly one of the series listed above or box
annotation, that's where the image will appear. If you drop it anywhere else, it will
appear in the background.
Inspecting chart elements that supports images will provide, at a minimum,
controls that set image, clear image, set image layout and set image opacity.
56
Chartsmith User’s Guide
Concepts
2
The Set button is another way to specify which image is to be used. Pressing the
Set button brings up a Mac OS X Open panel that allows you to navigate through
the file system to choose the desired image.
The Clear button removes the image from the chart element.
The Layout button is a pop-up, which displays the various layout options. Image
layout options for the different chart elements vary, but as a minimum always
contain the following:
Original Size – This option does not modify the image in any way but simply
inserts it into the chart element.
Scale to Fit – This option either reduces or enlarges the image to best fit the chart
element. Scaling is preformed with a locked aspect ratio and in most cases this
option will allow the entire image to be viewed, i.e. not clipped.
Stretch to Fill – This option reduces or enlarges the image both horizontally and
vertically to fill the entire space available in the chart element.
Tile – This option starts at the bottom left corner of the chart element and inserts
multiple copies of the image, left to right, bottom to top, until the entire chart
element is filled.
The opacity control is a slider and associated text field that allows you to set the
opacity (0% to 100%), which will be used to apply the image. This setting is
important if you have anything (such as background or background color) that you
would like to partially see through the image.
Additional Inspector panel image controls are described here, organized according
to the chart element they apply to.
Images on Bars and Histograms
When you choose an image to appear on or as the bars in a bar chart or histogram,
in addition to the standard image controls the Inspector panel contains a check box
control to let you remove the fill color and the line around the bar (Image Only)
Chartsmith User’s Guide
57
2
Concepts
and adds a pop-up menu that lets you choose whether to draw one image the height
of the bar, or one image per major axis step (Stack Image).
(To change the Axis step, select the grid, then click the appropriate axis button on
the Inspector panel, choose the Range sub-panel, and enter a new value in the Step
field.)
Images in Pie Slices
When you choose an image to appear on a pie slice, in addition to the standard
image controls the Inspector panel contains a Propagate button. This button allows
you to propagate the image and image settings to the same slice in any other pies
you may have in your chart. Pie slices across different pie charts are connected by
the row where their data is located in the Data Sheet. Pie series, on the other hand,
are each drawn as stand-alone pie charts.
Images in Box Annotations
When you choose an image to appear in a box annotation, in addition to the
standard image controls the Inspector panel contains a thumbnail of the image.
Using and Inspecting Annotations and Text
You can add annotations to charts just as you add color and images-by dragging
and dropping them. In this case you drag from the Annotation panel, which can be
produced from Tools -> Show Annotations menu or from the button set at the
58
Chartsmith User’s Guide
Concepts
2
upper left hand corner of the Chart window. The five objects in this panel-text,
box, line, circle, and text balloon-can be dragged and dropped anywhere on the
chart to add commentary and graphic enhancement.
When it's open, the Annotation panel attaches itself to the upper left of the active
Chart window. It will follow the Chart window around, and will jump from Chart
window to Chart window if you click among simultaneously open Chartsmith
documents. You can tear it off and place it yourself; it will stay where you put it
until you close it or move a Chart window.
The Inspector panel controls for annotation objects are clearly labeled and
straightforward. In addition to adding commentary and aesthetic appeal, annotation
objects can be used to, in effect, replace standard chart elements like the Legend or
series labels with hand-crafted alternatives. Just use the Inspector panel to turn off
the element you want to replace, and then use the annotation objects to create what
you want instead.
The font of the text in balloon and text annotations can be changed via the standard
Mac OS X Font panel available from the Format -> Font -> Show Fonts menu
item. You can set the default font for balloon and text annotations in the
Preferences panel. (Choose Fonts in the top list on the panel and Text and Balloon
Annotations on the pop-up.)
Trend Line Equation Text Annotations
In addition to the annotations types described above, there is one fixed text
annotation type provided by Chartsmith. It is the Trend Line Equation annotation
and it is available from the Trends sub-panel located in the series inspector for all
series that support trend lines. You can add a Trend Line Equation annotation by
dragging and dropping the equation icon onto the chart. The Trend Line Equation
annotation behaves just like a standard Text annotation except the text is fixed and
at all times reflects the equation used to determine the trend line for the series.
Aligning Elements and Determining Who's on Top
The Format -> Align menu item and the Format -> Bring to Front and Format ->
Send to Back commands, let you easily line elements up and, in cases where
elements overlap, determine which are drawn on top. You'll likely use these
commands most often with annotation objects and text (like the chart title and
subtitle), but they apply as well to the grid and the legend.
Chartsmith User’s Guide
59
2
Concepts
To use the commands in the Format -> Align menu, select the items you want to
align, and then choose the command that describes what you want. Align
Horizontally makes the item which extends farthest to the left its anchor point and
moves the other objects up or down (but not right or left) as necessary to get them
all on the same horizontal line. The Format -> Align -> Alignment command
brings up a panel you can use to pick a point within the selected objects around
which to do the alignment.
Make Row also anchors its operation around the selected element that extends
farthest to the left. In addition to getting the selected elements all on the same line,
it places them side by side. It also preserves the horizontal position of the rightmost
selected element unless it has to move it to keep elements from overlapping. Align
Vertically and Make Column behave similarly, anchoring the action around the
selected element that extends closest to the top.
The Format -> Bring to Front and Format -> Send to Back commands determine
the order in which chart elements get drawn. Elements brought to the front are
drawn last and thus on top of any elements they overlap. Elements sent to the back
are drawn first and thus obscured by any element that overlaps them. If you select
several elements at once and use either of these commands, the drawing order of
the elements within the group is preserved and the whole group is moved in front
of or behind everything else.
Note: chart series can be not be aligned or reordered using these controls since they
are 'bound' to the grid. To change the drawing order of series, control drag series
columns in the Data View or legend entries in the legend.
Inspecting and Editing Text
Text annotations behave like the chart title and subtitle. They are free floating and
clicking selects them and presents Inspector panel controls for sizing, text color,
background color, rotation, and drop shadows. Double clicking selects the text for
editing and for modification via the Font and Color panels.
60
Chartsmith User’s Guide
Concepts
2
Trend line equations behave just like text annotations except that their text cannot
be edited in the chart. They are free floating and clicking selects them and presents
Inspector panel controls for sizing, text color, background color, rotation, and drop
shadows.
The text in balloon annotations and the axis titles also share their behavior. They
can't be selected for drop shadows and rotation, but double clicking selects the text
for editing and for modification via the Font and Color panels.
Tic labels and legend text cannot be selected in the chart and cannot be directly
edited there. But if the item they belong to is selected, their font and color can be
modified via the inspector and/or appropriate panels.
Series data labels behave just like tic labels, in that, if a series is selected all font
information applies to the data labels. Color can be specified by drag and drop or
via the Series Labels inspector.
Using Chart Notes
Chartsmith provide the capability for you to make notes about a chart and not have
the notes actually be part of the chart. To use this feature select the Chart -> Show
Chart Notes menu item. A drawer with a text box will slide open on the right side
of the Chart window. Click in the box to make your notes. When you select another
chart in the navigator the Chart Notes drawer will automatically update to show the
notes for that chart. Use the Format - > Text controls along with the Font and Color
panels to change the appearance of this text.
Chartsmith User’s Guide
61
2
Concepts
Using and Inspecting the Background
The default selection in a chart is the Background. That is, if no other chart element
is selected then the Background is selected. You can also inspect the Background
by selecting a thumbnail in the Navigator.
The Background inspector provides controls for the background’s fill color, border,
and image. Clicking the Border checkbox turns on the border and the associated
color well determines its color. For more information on the Fill controls; see
Concepts - Using and Inspecting Color. For more information on the Image
control; see Concepts - Using and Inspecting Images.
Using and Inspecting the Grid
In addition to using the grid to turn on the 3D effect and control some of its aspects
(described in Using and Inspecting 3D Effects), you also have considerable control
over the grid's scale and axes and how they're labeled and displayed.
62
Chartsmith User’s Guide
Concepts
2
Grid labels are
displayed for
major lines as
determined by
the axis scale
settings in the
Inspector panel.
To hide the grid altogether (or the X and/or Y1 and/or Y2 Axis title labels), use the
checkboxes at the top of the Data View window. To edit the text and change the
font settings for the grid axis titles, double click them directly to select the text. To
change the font settings for both the X and Y-axis tic labels, select the grid and use
the Font panel (available from the Format -> Font -> Show Fonts). To change the
font of just one axis, select the axis first, and then use the Font panel.
The Main and Axis Inspector Buttons
With the grid selected, choosing the Main button in the Inspector panel reveals grid
controls that apply to the whole grid-range auto adjust, which Y axes to display
(Y1, Y2, or Both), grid type (linear, semi-log and log), grid orientation (horizontal
or vertical), 3D effect management, grid background color, and grid border. (The
default for a grid's background color is complete transparency, which allows any
background images you bring in to show through the grid).
Choosing either the X Axis or Y1 Axis (or Y2 Axis if available) button produces
the same set of controls but the controls apply only to the selected axis. Axis may
also be selected by clicking on them in the chart once the grid is already selected.
That is if you wish to inspect the X-axis, first select the grid, and then click on the
X-axis.
Chartsmith User’s Guide
63
2
Concepts
Choosing Y Axes
Selecting Y1 instructs the grid to display the left side Y-axis only. Likewise,
choosing Y2 instructs the grid to display the right side Y-axis only. Selecting both
allows both axes to be displayed at the same time. Any series can be plotted against
either axis as long as it is active. Turning off a Y-axis that has a series assigned to
it will cause that series to not be drawn effectively hiding it. (see Concepts - Using
and Inspecting Series for more information). Note: that the Y2 axis is not supported
when the Scale Orientation is Horizontal (see Concepts – Using and Inspecting the
Grid - Choosing Scale Orientation).
Choosing Grid Type
Clicking Linear puts a linear scale on both axes. Semi-log puts a logarithmic scale
on one axis and a linear scale on the other. Log puts a logarithmic scale on both
axes. (Bar, Line and other one dimensional series types, have only one scaled axis
and thus can only be linear or semi-log.)
Choosing Scale Orientation
Bar, Line and other one dimensional series types have only one scaled axis. The
orientation control selection determines to which axis that scale is applied.
Choosing the vertical orientation will put it on the Y-axis and produce vertical bar
series; choosing the horizontal orientation will put it on the X-axis and produce
horizontal bar series.
64
Chartsmith User’s Guide
Concepts
2
The Auto Adjust Switch
This switch determines whether Chartsmith will automatically calculate the grid
axes' maximum, minimum and step values. With auto adjust turned on, the grid
will change automatically to accommodate the needs of the data you enter. The
default is for the switch to be on and automatic adjustment to be in effect.
To change the values manually for a scaled axis, select the Axis button in the Grid
inspector and view the Range sub-panel. Enter data in the fields described below,
first for linear scales and then for logarithmic ones. Editing any of those fields
turns Auto Adjust off. Changing scale type turns it on.
Linear Scale Minimums, Maximums, Steps and Major Lines
To set these values for a given axis, select the button for the axis you want to
change and edit the text fields that appear under the Range sub-panel.
The minimum value is the lowest value on the scale and defines its bottom
boundary on a vertical axis and the leftmost boundary on a horizontal axis. The
maximum is the highest value and defines the scale's top boundary on a vertical
axis and its rightmost boundary on a horizontal one. A linear scale's Step setting
determines how many equal-sized segments exist between the Minimum and
Maximum settings. Major lines mark the steps.
For information about control over the display of major and minor lines and ticks,
see Concepts – Using and Inspecting the Grid - Displaying Lines and Ticks
immediately following the subsection below on logarithmic scales.
Chartsmith User’s Guide
65
2
Concepts
Logarithmic Scale Minimums, Maximums, Decades & Major Line
To set these values for a given axis, select the button for the axis you want to
change and edit the text fields that appear under the Range sub-panel.
On a logarithmic scale, the Minimum and Maximum values must be an integer
power, positive or negative, of 10.
A decade is the range between two powers of 10. In spatial terms, decades are like
steps; they're all the same size in the display. The number of decades displayed is
the difference between the logarithms (exponents) of the minimum and maximum
values.
The setting in the Decades field must be an integer no smaller than 1 and no larger
than the total number of decades permitted by the grid range. It determines where
major lines are displayed and what minor line set is available.
A decade value of 1 puts a major line at every decade boundary and minor lines at
each tenth of the range between decade boundaries. Any Decades value setting
higher than 1 means: "put a major line at every multiple of the decade setting and
display minor lines for the decade boundaries in between".
Axis Line and Title Attributes
66
Chartsmith User’s Guide
Concepts
2
The Axis sub-panel under the X, Y1, and Y2 buttons reveal standard controls for
the width and color of the selected Axis line, and the color and offset of its title.
When one of the Y-axes is selected, there's also a control pair available for
deciding whether to display the axis title horizontally and above the grid
(Horizontal) or vertically and beside it (Vertical).
Displaying Lines and Ticks
With an Axis button selected in the grid inspector, selecting either the Major or
Minor sub-panels produces check boxes that let you show or hide the associated
lines and ticks, and a selection set from which to pick a line style.
You can also set the number of steps per major line in the Major sub-panel, and the
number of major lines per minor lines in he Minor sub-panel. These controls allow
to you further customize the look of the grid without change the step value. (This
option is disabled for logarithmic scales. As described in the preceding section, the
setting in the Decades field at the top of the axis controls determines how minor
lines are displayed between major ones.)
In addition these inspectors also include controls for setting the line width an color
for the major and minor lines
Chartsmith User’s Guide
67
2
Concepts
Displaying Tic Labels
With an Axis button selected in the Grid inspector, selecting the Labels sub-panel
produces the controls for displaying major line labels (tic labels) on the grid.
The labels for all scaled axes are applied to major lines in accordance with the
value in the Show Labels Every X Major Line(s) field. (In Bar, Line, and other one
dimensional data charts, the labels for the non-scaled axis are taken from the row
labels in the Data View window.) For information about what determines how
many major lines are drawn and where they're drawn, see Concepts – Using and
Inspecting the Grid, Linear scales and Logarithmic scales above.
In the Format section the pop-up list at the bottom lets you choose among ones,
thousands, millions and billions as the display unit. Choosing Thousands, Millions,
and Billions moves the decimal appropriately and appends K, M or B to the
number, respectively.
In the set of buttons above the pop-up, if parenthesis is chosen then they are used to
indicate a negative number. If parenthesis are not chosen then a minus sign is used.
The others (scientific notation, currency, percent and the thousands delimiter) can
be added and subtracted to the format by clicking them on and off. (Turning
percent on automatically multiplies the number by 100 in addition to adding the
percent sign.)
When the Specify decimal places switch is on, the text field associated with it
becomes available. You can then type in a number and press Return to set the
number of decimal places displayed in the number. When it's switched off,
Chartsmith automatically sets the number of decimal places displayed.
68
Chartsmith User’s Guide
Concepts
2
The Prefix and Postfix fields will let you place any string of characters before or
after the numerical labels. Their associated "All" check boxes let you cause the
string to be displayed with every numerical label (when All is checked on) or only
with the first one. So if, for instance, you wanted a $ before the top number on the
Y-axis but not after all the numbers below it, put a $ in the Prefix field and click
off the All switch.
Offset, rotation and color controls are also provided to allow better formatting of
the tic labels.
Using and Inspecting Series
Some series controls apply to all series. These are described first, and then
followed by sections on controls that apply only to particular series types.
You can select series either by clicking directly on them in the chart or (for all but
pie charts) by clicking their entries in the legend. Shift-clicking either place adds to
and subtracts from the current selection. If all the selected series are the same type,
the Inspector panel controls will apply to all the selected series.
A reminder: Chartsmith draws series in the order they appear in the Legend (left to
right, top to bottom), which reflects the left to right order of the series in the Data
View window. To change the order, hold down the Control key while you drag and
drop either the Legend entries (in all but pie charts) or the columns in the Data
View window. This feature can be especially useful for keeping series of different
types from obscuring each other when they're in the same chart.
Line Width & Color
The slider and associated text field, at the top of the Inspector panel for all series
(except Intensity Scatter series), provide standard control over thickness of the line
in series represented by a line, and over the thickness of the line around the series
graphic in other series. Dropping color in the color well next to it changes the line's
color.
Chartsmith User’s Guide
69
2
Concepts
Display Series on Which Y-axis?
The control for assigning a series to a given Y-axis is located at the bottom of the
Style sub-panel of the series Inspectors. Only axes that are currently enabled, via
the Grid Inspector (see Concepts – Using and Inspecting the Grid - Choosing Y
Axes), are eligible for series assignment. The entry will be grayed out if the axis is
ineligible. Note you can also toggle a series Y-axis by holding down the command
key and clicking on the series column header in the Data Sheet. Command click the
left side of the series column header and the series will be assigned to the series to
the left (Y1) axis. Command click the right side of the series column header will
assign the series to the right (Y2) axis.
Data Labeling
Control for Data Labels in located in the Labels sub-panel of all the series
inspectors. The check box located at the top of the Label sub-panel is the on/off
switch for the inclusion of data labels in the series currently under inspection. In
the Content control group, the pop-up menu lets you select whether you want to
display data (the numeric value associated with the point, bar, pie slice, etc.), row
label (the data's row name in the Data Sheet), series name (the data's column or
series name in the Data Sheet), or combinations of data and row or series labels.
The Layout controls allow you to set the position, color and formatting of the data
labels. Note: you can customize the position of individual data labels by doubleclicking on them in the chart and then dragging them to the desired location. When
70
Chartsmith User’s Guide
Concepts
2
this happens the Position pop-up menu for the series will display Custom. To return
all labels to a default location choose one of the other positions from the Position
pop-up menu.
The Decimal Places control is used in the display numeric data. If you are
displaying numeric data and wish to override the default decimal places formatting,
check the Decimal Places box and type in an integer in the associated text field.
The Percent checkbox only applies sensibly to data in charts containing Pie, Bar, or
Area series. When it's checked on, the data is displayed as a percentage of its series
total if the data belongs to a Pie series, and as a percentage of its row total for Bar
and Area series. Note: you can specify that Bar and Area series have percentage
calculations based on series total by selecting Series in the Percentage control.
The Rotation control allows you to rotate the data labels for a series. Select the
series you would like to change and use the slider or text field to specify the angle
in degrees that you wish to rotate the labels.
To change the font settings for data labels, select the series they belong to and use
the Font panel (available from the Format -> Font -> Show Fonts submenu).
Using and Inspecting Trend Lines
Trend lines are charted curves, derived from the data in a series and drawn with the
series on a chart. They are often used in scatter plots or other series types where the
overall structure (or trend) of the data in the series is not easily recognized by
looking at the series data alone. Chartsmith supports the inclusion of Trend Lines
Chartsmith User’s Guide
71
2
Concepts
for Bar, Line, Hi-Lo, Hi-Lo-Open-Close, Base-Error, XY, Scatter, and Histograms
series types.
Trend lines are created and controlled via the Trends sub-panel in the series
inspector. To add or delete a trend line press the appropriate button at the bottom
the inspector. Any number of trend lines may be added to each series that support
trend lines. The pop-up menu near the top of the Trends sub-panel allows you to
choose which trend line (if you have created more than one) you would like to
work with. Alternately you can select the trend line in the chart, or the trend lines
legend entry (if displayed) to bring up the relevant inspector. Default labels
(names) are assigned to trend line as they are created to change the label inspect the
trend line and type in a new label in the Label text field.
The Type pop-up near the top of the control set for trend line allows users to
specify the type calculation used to create the trend line. Currently, Chartsmith
supports, moving average, linear, polynomial, exponential, power, and logarithm
types of trend lines. When using the moving average trend line, period can be
specified and order for polynomial trend lines can also be entered.
The control set for line width and color are just below the Label text field in the
inspector. The Check box for Active allows you to turn off the drawing of the trend
line without deleting it. The Show Entry in Legend check box gives you the option
of creating an entry in the legend to represent the trend line. The legend entry will
display the text in the Label text field. The Draw in Front of Series checkbox tells
Chartsmith to make sure the trend line draws in front of the series so that the trend
line can still be viewed even in a data marker occupies the space on the chart.
At the lower right hand corner of the trend line inspector there is an Equation box.
This box is used to annotate the chart with a text field that contains the equation
used to calculate the trend line. Simply drag the f(x) icon out of the panel and onto
the chart.
72
Chartsmith User’s Guide
Concepts
2
Using and Inspecting Error Bars
Error Bars are marker symbols, the size of which is derived from the data in a
series (or user specified) and drawn with the series on a chart. They are used to
express the confidence of a given data point on a chart. Chartsmith supports the
inclusion of Error Bars for Bar, Line, XY, and Scatter series types.
Error Bars are created and controlled via the Error Bars sub-panel in the series
inspector. To turn on error bars for a series use the check box at the top of the
panels. Note: that if you are adding error bars to either an XY or a scatter series
you must can also specify if you want error bars for the X-axis, Y-axis, or both.
Using the pop-up at the top in concert with the check box allows you to specify this
behavior.
The inspector also lets you specify if you want symmetrical (identical positive and
negative) or asymmetrical (independent positive and negative) error bars. The
control for this is the ‘I’ and the broken ‘I’ graphics near the top. The left one
specifies symmetrical and the right one specifies asymmetrical.
The values used to draw the error bars can be determined by a percentage of the
data, a fixed amount, standard deviation of the data, standard error of the data, or
variable. The first four options are self-explanatory. If variable is chosen from the
pop-up menu the series column in the data sheet will automatically change to
provide you with a location to enter the error data associated with each data point.
If you choose to have asymmetrical error bars, turned on for both the X and Y-axis,
the series column in the data sheet will have 4 additional columns, one each for X
and Y, positive and negative error bars. Each error series column has a label
indicating which error bar it represents.
Chartsmith User’s Guide
73
2
Concepts
The bottom of the Error bar inspector sub-panel provides controls for specifying
the size shape and color for the error bars.
Bar Series Inspecting
In a bar series, each data entry in a Data View window column determines the
height of a bar drawn to represent it. If there are multiple bar series, all bars
belonging to the same series share the series color. Bars that share a row in the
Data View belong to the same group.
When the Style button is selected in the Bar Series Inspector the sub-panel presents
controls for Line Width and Color (see Concepts – Using and Inspecting Series Line Width & Color), Gradient Fill (see Concepts – Using and Inspecting Color Gradient Fills), Images (see Concepts – Using and Inspecting Images), and Axis
selection (see Concepts – Using and Inspecting the Grid - Choosing Y Axes).
When the Shared button is selected, the Inspector sub-panel presents a button pair
for switching between stacked and un-stacked bars, and two sets of sliders with
associated text fields at the bottom for controlling bar spacing and bar shading.
Note: bar shading only applies when the grid is set to 3D effect (See Concepts –
Using and Inspecting 3D Effects). The control determines the shade used on 3D
bars and helps create the illusion of a light source for the chart.
Bar spacing provides you with control over the distance used to separate bars in a
group (Bar Overlap) and the distance used to separate groups (Group Margin).
Selecting the stacked bar button automatically sets bar overlap to 100% and draws
the bottom of each new bar where the top of the last one left off. To change the
74
Chartsmith User’s Guide
Concepts
2
order of the stack, hold down the Control key and drag and drop either the series
entries in the legend or the columns in the Data View window.
Area Series Inspecting
In an area series, each data entry in a Data View window column determines the
height of a point at each row position in the chart. The area underneath a line
connecting those points is filled with the series color.
The only Area Series-specific control in the Inspector panel is the button pair that,
exists under the Shared sub-panel, and lets you choose whether to display multiple
area series as Cumulative (Stacked) or Non-Cumulative (Unstacked). Choosing
Cumulative causes the height of each point at a row location to be measured from
the point drawn before it instead of from the base axis, with the result that the areas
stack on top of each other. Note that non-cumulative stacking is not supported
when the 3D effect for the grid is turned on.
To rearrange the order of the stack, or the order in which non-cumulative areas are
drawn (to prevent them from obscuring each other or other series types), hold down
the Control key and drag and drop the series entries in the legend or the columns in
the Data View window.
Pie Series Inspecting
In a pie series, each data entry in a Data View window column determines the size
of a slice of a circle (pie) whose total size is determined by the column's total. In
pie charts, color belongs to data rows, not the series. (The pie represents the series.)
Chartsmith User’s Guide
75
2
Concepts
To select a pie series, click directly on the pie. Shift-click on other pies to add them
to the selection. To select a pie slice double click the slice.
The Style sub-panel for the Pie inspector provides controls for Line Width and
Color, 3D Effect, Series Name, Rotation and Shadow. The Series Name control
allows you to turn on and off the display of the series name under the pie chart.
Color for the Series name is specified here or can be dropped directly on the series
name in the chart. The rotation control rotates the pie around its center. When
checked the Shadow control box will instructs Chartsmith to display a Gaussian
shadow for the pie. Pie chart drop shadow controls include Angle, Offset, Blur, and
Opacity. For information about the 3D Effect controls for pies, see Concepts –
Using and Inspecting 3D Effects - Pies, and for information about the Color and
Gradient Fill controls, see Concepts – Using and Inspecting Color.
The Slice sub-panel for the Pie inspector provides controls for Color (see Concepts
– Using and Inspecting Color), Offset and Images (Concepts – Using and
Inspecting Images) uses with pie slices. The offset control allows a pie slice to be
exploded, or separated out from the rest of the pie. Each slice on each pie can have
a different offset value from 0% to 100%. Changes made in the Slice sub-panel
apply to all pies currently selected in the chart. Alternately, you can use the
Propagate button to apply changes made to the slice in one pie, to the same slices
in other pies.
Note: Since the entries in a pie legend stand not for series but for data rows, you
cannot select them or drag them around. To change the order in which the pies are
presented in charts with multiple pie series, hold down the Control key while
dragging and dropping columns in the Data View window.
76
Chartsmith User’s Guide
Concepts
2
Line, Base-Error, Hi-Lo, Hi-Lo-Open-Close, XY, Scatter, and
Bubble Series Inspecting
All these series use data markers and some also use lines to represent their data. To
Change their appearance with the Inspector panel, simply pick the data marker, line
type, etc. you want.
The Marker Color well holds the color for the data markers. Moving the Marker
Size slider or entering a number in the text field raises or lowers the size of the
marker. 36 is the maximum value it will accept, and 1 is the minimum.
• In a Line series, each data entry in the column determines the placement of a data
marker at each row position in the chart, and a line connects all the data markers.
• In an Base Error series, the first of each pair of data entries in each series column
determines the placement of a data marker at each row position in the chart. The
second of each pair of entries determines how far the error bar will extend above
and below the corresponding data marker. You can also chose the shape of the base
and error markers in the Base Error Style Inspector. Note: that the Base Error series
type is provided to support older Chartsmith documents. Starting with Chartsmith
v1.2 configurable error bars were added for a number of series.
• In a Hi-Lo series, each pair of data entries in the series column determines the
height of a pair of data markers, connected by a line, at each chart row position.
• In a Hi-Lo-Open-Close series, each set of four data entries in the column
determines the height of four data markers, connected by a line, at each row
position on the chart. (Note: When entering data for a Hi-Lo-Open-Close series, the
Open and Close values are not required.)
Chartsmith User’s Guide
77
2
Concepts
• In an XY series, each pair of data entries in the column determines the position of
a data marker in the grid. The first of each pair determines the data marker's
position relative to the X-axis. The second determines its position relative to the Yaxis. A line connects all the data markers.
• In a Scatter series, each pair of data entries in the column determines the position
of a data marker in the grid. The first of each pair determines the data marker's
position relative to the X-axis. The second determines its position relative to the Yaxis.
Bubble Series Inspecting
In a Bubble series, each data point is represented by three values, an X, Y, and Z.
The X value for each point determines the data marker's position relative to the Xaxis. The Y value determines its position relative to the Y-axis, and the Z value
determines the size of the bubble.
In the Bubble series Inspector Style sub-panel there are controls for determining
the Line Width and Color (See Concepts – Using and Inspecting Series - Line
Width and Color), Fill Color (see Concepts – Using and Inspecting Color), Image
(See Concepts – Using and Inspecting Images), and Markers (See Concepts –
Using and Inspecting Series). There is also a Bubble Shape control that lets you
determine if the bubble takes on the shape of a square or a circle.
In the Shared sub-panel of the Bubble series Inspector there are controls for setting
the scale used for determining the size of the bubbles. If X-axis is chosen then the
Z value will be plotted (via the size of the bubble), on the same scale as the X-axis.
Likewise, if Y-axis is chosen for the Z scale the Z value will be plotted with same
78
Chartsmith User’s Guide
Concepts
2
scale as the Y-axis. If Independent is chosen then the Z scale will, by default, be
sized so as to fit all the bubbles in the grid. You can increase or decrease the Z
scale, when Independent is used, by dragging the slider or entering a custom value
in the text field.
Histogram Series Inspecting
In a Histogram series, data entries in a Data View window column are analyzed to
determine the height of the bars drawn on the grid. The analysis is preformed by
looking at the minimum and maximum number in the series, calculating the gridrange, and dividing up the grid-range into a number of equal steps. The range
spanned by each steps creates a bin and is called a bin-range. The size of a bar for
each bin-range equates the to the number of times a data point in the series fell
within that bin-range. The step size and thus the bin-ranges can be set by
modifying the step size in the Grid X-axis Range Inspector sub-panel.
In almost every way inspecting a Histogram series is identical to inspecting a Bar
series (See Concepts – Using and Inspecting Series). The two key differences
between bar and histogram series are that there is not an option for stacking
histogram series, and there is no mechanism for adding error-bars to histogram
series. If more than one histogram series is created in the same chart, the series
automatically stack on top of each other.
Intensity Scatter Series Inspecting
In an Intensity Scatter series, each data point is represented by three values, an X,
Y, and Z. The X value for each point determines the data marker's position relative
to the X-axis. The Y value determines its position relative to the Y-axis, and the Z
value determines the color of the marker. Through the Style sub-panel of the
Intensity Scatter Inspector you can specify two colors, one each for the minimum
color (the color that equates to the minimum value in the series), and for the
maximum color (the color that equates to the maximum value in the series). When
the series is plotted each Z value is compared to the numeric range and a
corresponding color is picked out of the color range. This color is used to draw that
data point on the chart.
Chartsmith User’s Guide
79
2
Concepts
In almost every way inspecting an Intensity Scatter series is identical to inspecting
a Scatter series. The only difference is the selection of two colors for the color
range used in the display of the series.
Using and Inspecting the Legend
The legend, which can be hidden and shown via the Legend switch in the Data
View window, automatically builds a color and icon-coded entry key for each
series in the chart it belongs to. For all series types except pie, the legend takes its
entry names from the column labels in the Data View window. Pie chart legend
entries take their names from the row labels in the Data View window.
80
Chartsmith User’s Guide
Concepts
2
Until you change them, all entry keys take their color from the Series Color Lookup Tables in the Preferences panel or in a template if you're using one. You can
change those colors directly on the chart by dropping new colors from the Color
panel either on the legend entry keys or on the chart elements they stand for.
When the legend is selected in the active chart, the Inspector panel contains
standard controls for hiding and showing the title, and for changing the color and
appearance of the legend's background, title, border, shadow, and entry labels.
(You can also re-color the background, title and entry labels via drag and drop.)
For all series types except pie, you can select series in the chart by clicking their
legend entries. Holding down the Control key while you drag and drop the entries
rearranges the series order in the chart and the order of the series columns in the
Data View window. This series order determines the drawing order of the series in
the chart-left to right, top to bottom.
To change the font settings for the legend text, select the legend and use the
standard Mac OS X Font panel (available via the Format -> Font -> Show Fonts
submenu). The font settings for the legend title and entry labels change
simultaneously.
You can drag the legend anywhere you want within the chart and resize and
reshape it by dragging its selection handles. As you resize the legend, its layout of
rows and columns can be altered. The Inspector panel's Size to Fit Button will
automatically enlarge or shrink the legend as necessary to fit its contents. The
Normalize command in the Chart menu returns the legend to its default position at
the lower left of the chart, and resizes it as necessary to fit its contents.
Using Templates
There are some things about charts that can only be determined by the data; the
relative heights of the bars in a bar chart, for instance, or the sizes of the slices in a
pie chart. But most other aspects of a chart's appearance-the location and color of
the title, or the size, shape and location of the legend, or the image in the
background, etc.-are not data dependent. Templates provide a way to save those
non-data dependent aspects of how charts look so they can be applied to other
charts or used as the starting point for new charts.
Chartsmith User’s Guide
81
2
Concepts
Creating Templates
The simplest template to think about is actually the one with the most information
in it. Imagine that each week you need to publish a chart showing the previous
week's sales. The first time you do the chart, you have to decide what the title and
subtitle are and where you want them to be, what the series are and what they're
named, what kind of background to have, etc.
But if you save that Chart as a template by using the Chart -> Save As Template
menu item, all you'd have to do to make next week's chart is use File -> New From
Template or Chart -> Add Chart From Template, and enter the new data in the Data
View window. The chart, which would appear in response, would look just like last
week's except for differences in data.
Using the Chart -> Save As Template command brings up a Save panel with two
additional elements: a set of check boxes (Template Components) you can use to
determine which chart attributes you want to include in the template and a text field
(Template Description) into which you can enter a description to help you
remember what the template includes.
Look, for instance, at the charts pictured on the next page. The size, placement,
thickness and rotation of the pies all work together to enhance the sense of dynamic
growth in whatever it is that's being measured by the exploded slice in each pie.
The title and subtitle treatment and pie labeling add to the drama.
82
Chartsmith User’s Guide
Concepts
2
The second chart was made from a template saved from the first, but with the
check box for All Title Text turned off in the Chart -> Save As Template panel.
The result is a chart in which the pies will take on the same placement, size and
rotation, but about which no title or legend text assumptions are made.
What is Saved for Each Element
Generally speaking, checking a chart component in the Chart -> Save As Template
panel, saves the size and position of component, if relevant, plus all settings
associated with it in the Inspector panel.
Chartsmith User’s Guide
83
2
Concepts
Using Templates To Start and Change Charts
You can begin new charts from templates by using the File -> New From Template
Command or the Chart -> Add From Template command. Likewise, double
clicking a template in the Finder will create a new chart in a new document.
You can also use the Preference panel to specify templates that will be applied to
new charts for each chart type. (See Reference – The Chartsmith Menu Preferences for more information.)
Templates can be also be applied to existing charts, either by using the Chart ->
Apply Template menu item, or by directly dragging a template from the Finder and
dropping it into the Chart window. If you drop it directly on the chart, it applies to
that chart. If you drop it in the Navigator, it applies to all charts selected at the
time.
Being Careful with Grids and Series
There are limits to how completely templates that contain grid and series
information can be applied to charts that already have a grid and/or series structure
in place. The grid and series components have many possible settings within them,
some of which don't mix well when Chartsmith tries to apply settings from one to
the other.
If you apply a template from as pie to a bar chart, for example, no grid or series
information will be applied. Applied templates never add series to existing
destination charts, even when there are more series in the template than in the
destination. Note, however, that using the Chart -> Add From Template and File ->
New From Template commands will duplicate in the new chart the series stored in
the template.
When the template and the destination chart are of the same type but have different
series (bar and line, for example), the reformatting of the destination chart is
straightforward so long as the corresponding template and destination series have
the same number of data columns within them. When they do not, Chartsmith will
preserve the data in the Data View window at the time and convert all series types
according to the template. You can then use the Data View window controls and
Cut and Paste to rearrange the data/series relationships if necessary.
84
Chartsmith User’s Guide
Concepts
2
Creating Charts
Chartsmith uses a core set of series and features to produce an infinite number of
different charts. Listed here is description on how to create a few of the charts that
can be created with Chartsmith.
Charts with Bars Series
To create a Bar chart, from any open document, use Chart -> Add Chart -> Bar.
Add rows in the data sheet to expand the number of entries for the series. Double
click the Bar, Line, Area, Hi-Lo, and Hi-Lo-Open-Close icons in the Series Palette
to add more series. Enter row labels, column labels, and data in the Data Sheet to
populate the chart. Bring up the Inspector and select different chart elements to
change their parameters. Select the bar series to change its style and data labels. If
you have multiple bars series select the shared sub-panel in the inspector to change
bar overlap and shading (3D grids only).
Charts with Lines Series
To create a Line chart, from any open document, use Chart -> Add Chart -> Line.
Add rows in the data sheet to expand the number of entries for the series. Double
click the Bar, Line, Area, Hi-Lo, and Hi-Lo-Open-Close icons in the Series Palette
to add more series. Enter row labels, column labels, and data in the Data Sheet to
populate the chart. Bring up the Inspector and select different chart elements to
change their parameters. Select the line series to change its style and data labels.
Charts with Area Series
To create a Area chart, from any open document, use Chart -> Add Chart -> Area.
Add rows in the data sheet to expand the number of entries for the series. Double
click the Bar, Line, Area, Hi-Lo, and Hi-Lo-Open-Close icons in the Series Palette
to add more series. Enter row labels, column labels, and data in the Data Sheet to
populate the chart. Bring up the Inspector and select different chart elements to
change their parameters. Select the Area series to change its style and data labels.
Charts with Hi-Lo and/or Hi-Lo-Open-Close Series
To create a Hi-Lo or Hi-Lo-Open-Close chart, from any open document, use Chart
-> Add Chart -> Hi-Lo or Hi-Lo-Open-Close. Add rows in the data sheet to expand
the number of entries for the series. Double click the Bar, Line, Area, Hi-Lo, and
Hi-Lo-Open-Close icons in the Series Palette to add more series. Enter row labels,
Chartsmith User’s Guide
85
2
Concepts
column labels, and data in the Data Sheet to populate the chart. Bring up the
Inspector and select different chart elements to change their parameters. Select the
Hi-Lo or Hi-Lo-Open-Close series to change their style and data labels.
Charts with Base-Error Series
To create a Base-Error chart, from any open document, use Chart -> Add Chart ->
Base-Error. Add rows in the data sheet to expand the number of entries for the
series. Double click the Bar, Line, Area, Hi-Lo, and Hi-Lo-Open-Close icons in the
Series Palette to add more series. Enter row labels, column labels, and data in the
Data Sheet to populate the chart. Bring up the Inspector and select different chart
elements to change their parameters. Select the Base-Error series to change its style
and data labels.
Note: Base-Error Charts are legacy charts provide for backward compatibility. See
Concepts – Creating Charts – Chart with Error Bars for a much more robust Error
display.
Charts with Pie Series
To create a Pie chart, from any open document, use Chart -> Add Chart -> Pie.
Add rows in the data sheet to expand the number of slices in the pie. Double click
the Pie icon in the Series Palette to add more pies. Enter row labels, column labels,
and data in the Data Sheet to populate the chart. Bring up the Inspector and select
different chart elements to change their parameters. Select a Pie and use the 3D,
Gradient, and Shadow controls in the Inspector to change its appearance. Double
click a slice to explode or add an image to it.
Charts with XY Series
To create an XY chart, from any open document, use Chart -> Add Chart -> XY.
Add rows in the data sheet to expand the number of data points. Double click the
XY, Scatter, Histogram, and Bubble icons in the Series Palette to add more series.
Enter row labels, column labels, and data in the Data Sheet to populate the chart.
Bring up the Inspector and select different chart elements to change their
parameters. Select an XY series to change its style and data labels.
Charts with Scatter Series
To create a Scatter chart, from any open document, use Chart -> Add Chart ->
Scatter. Add rows in the data sheet to expand the number of data points. Double
86
Chartsmith User’s Guide
Concepts
2
click the XY, Scatter, Histogram, and Bubble icons in the Series Palette to add
more series. Enter row labels, column labels, and data in the Data Sheet to populate
the chart. Bring up the Inspector and select different chart elements to change their
parameters. Select a Scatter series to change its style and data labels.
Charts with Histograms
To create a Histogram chart, from any open document, use Chart -> Add Chart ->
Histogram. Add rows in the data sheet to expand the data set. Double click the XY,
Scatter, Histogram, and Bubble icons in the Series Palette to add more series. Enter
row labels, column labels, and data in the Data Sheet to populate the chart. Bring
up the Inspector and select different chart elements to change their parameters.
Select a Histogram series to change its style and data labels.
Charts with Bubble Series
To create a Bubble chart, from any open document, use Chart -> Add Chart ->
Bubble. Add rows in the data sheet to expand the number of data points. Double
click the XY, Scatter, Histogram, and Bubble icons in the Series Palette to add
more series. Enter row labels, column labels, and data in the Data Sheet to populate
the chart. Bring up the Inspector and select different chart elements to change their
parameters. Select a Scatter series to change its style and data labels.
Charts with Intensity Scatter Plots
To create an Intensity Scatter chart, from any open document, use Chart -> Add
Chart -> Intensity Scatter. Add rows in the data sheet to expand the number of data
points. Double click the Intensity Scatter icon in the Series Palette to add more
series. Enter row labels, column labels, and data in the Data Sheet to populate the
chart. Bring up the Inspector and select different chart elements to change their
parameters. Select a series to change its style and data labels.
Charts with a Double or Right Side Y-axis
To create a chart with a double or right side Y-axis, from any open document use
Chart -> Add Chart -> Series Type. Add data and any additional series that you
need, then bring up the Inspector and select the Grid. Select the Main sub-panel in
the Inspector and choose a Y-axis configuration. Y1 is the left Y-axis, Y2 is the
right Y-axis and Both displays both. Assign series to either the Y-axis by selecting
the series and making the appropriate choice at the bottom of the Style sub-panel
on series inspector.
Chartsmith User’s Guide
87
2
Concepts
Charts with Trend Lines
To create a chart with a trend line, from any open document use Chart -> Add
Chart -> Series Type. Add data and any additional series that you need, then bring
up the Inspector and select the series that you want to add a trend line to. In the
Trend sub-panel of the Inspector click the Add Trend button and use the controls
there to customize the trend line. You can have multiple trends lines for the same
series. To add a trend line to another series, select the series, click the Add Trend
button, and configure.
Charts with Error Bars
To create a chart with error bars, from any open document use Chart -> Add Chart
-> Series Type. Add data and any additional series that you need, then bring up the
Inspector and select the series that you want to error bars to. In the Error Bars subpanel of the Inspector check the Error Bars check box and use the controls there to
customize the error bars. You can enter your own error data by choosing Variable
from the pop-up menu item. To add error bars to another series, select the series,
check the Error Bars check box, and configure.
Charts with a Horizontal Grid
To create a chart with a horizontal grid, from any open document use Chart -> Add
Chart -> Series Type. Horizontal grids are only available for Bar, Line, Area, HiLo, and Hi-Lo-Open-Close charts. Add data and any additional series that you
need, then bring up the Inspector and select the Grid. Select the Main sub-panel in
the Inspector and choose a horizontal (icon with a arrow pointing to the right) grid
configuration. Note: Horizontal grids are not available when the 3D grid is enabled.
Charts with a 3D Grid
To create a chart with a 3D grid, from any open document use Chart -> Add Chart > Series Type. 3D grids are available for all charts except Pie charts. Note: Series
that do not have a 3D option will be drawn 2D on the back of the grid. Add data
and any additional series that you need, then bring up the Inspector and select the
Grid. Select the Main sub-panel in the Inspector and choose 3D grid configuration.
Note: 3D grids are not available when the horizontal grid is enabled.
88
Chartsmith User’s Guide
Concepts
2
Charts with Annotations
To create a chart with annotations, from any open document use Chart -> Add
Chart -> Series Type. Add data and any additional series that you need, and then
bring up the Annotations panel. Click and drag any of the annotations to the chart.
Select an annotation and bring up the inspector for the set of relevant controls.
Charts with Images
To create a chart with images, from any open document use Chart -> Add Chart ->
Series Type. Add data and any additional series that you need, and then select any
chart element that supports images (i.e. Background, Box annotation, Bar Series,
Pie Series, Area Series, Histogram, and Bubble Series), bring up the Inspector and
use the image controls to customize the use of images. You can also import image
files from other applications by dragging and dropping them directly on any chart
element that supports images.
Charts with Stacked Images
To create a chart with Stacked Images, from any open document, use Chart -> Add
Chart -> Bar. Add rows in the data sheet to expand the number of entries for the
series. Double click the Bar, Line, Area, Hi-Lo, and Hi-Lo-Open-Close icons in the
Series Palette to add more series. Enter row labels, column labels, and data in the
Data Sheet to populate the chart. Bring up the Inspector and select a bar series. Use
the image controls in the Inspector to import the image you want to use for the
stacked image. Click the Image Only check box to remove the bars and leave the
stacked images. You can also import image files from other applications by
dragging and dropping them directly on the bar series.
Charts with Log and Semi-log Grids
To create a chart with a Log or Semi-log grid, from any open document use Chart > Add Chart -> Series Type. Add data and any additional series that you need, then
bring up the Inspector and select the grid. Select the Main sub-panel in the
Inspector and choose Linear, Semi-log, or Log. Note: Log charts are only available
to XY, Scatter, Histogram, and Bubble charts.
Charts from Templates
To create a chart from a template, from any open document use Chart -> Add Chart
from Template. Use the open panel to find the template you would like to use. Use
Chartsmith User’s Guide
89
2
Concepts
to contents control to select which template attributes you would like to use. Click
Open. For more information see Concepts – Using Templates.
Linking Charts with LinkBack
Chartsmith supports the LinkBack as a provider. LinkBack is an emerging standard
for Mac OS X that allows users to link content from one application to another. A
user can paste content from any LinkBack-enabled application into another
LinkBack-enabled application and reopen that content later for editing with a
double-click. Changes will automatically appear in the original document again
when you save. For more information on LinkBack visit the LinkBack Project
pages.
Linking Charts to Other LinkBack Applications
Charts can be linked to other LinkBack applications simply by selecting the chart
in the Navigator and performing a Edit->Copy command. Then choose the
insertion point in the destination application and choose Edit->Paste. The chart
image in the destination application is also a link that will launch Chartsmith and
allow the chart to be changed at any time.
Edit Linked Chartsmith Charts from Other LinkBack
Applications
LinkBack linked charts can be selected for editing by double-clicking the chart.
Chartsmith will launch (if necessary) and create a new single chart document with
the selected chart. Edit this chart the same as any other Chartsmith chart.
Saving Edited LinkBack Charts
Save the Chartsmith document containing the edited charts to update the linked
chart image in the destination application.
90
Chartsmith User’s Guide
Reference
3
3
Reference
Chartsmith User’s Guide
91
3
Reference
Overview
This Reference section is organized in the same fashion as the menus in
Chartsmith, starting with the Chartsmith menu at the left and proceeding across,
expanding on the commands in each submenu and each associated panel in turn.
The Chartsmith Menu
The Chartsmith menu items provide information about Chartsmith including the
availability of updates and current licensing information. Look here as well to send
feedback, customize the application (via Preferences), and for application controls
like hide and quit.
About Chartsmith
Brings up the Chartsmith info panel where version information is found.
Preferences
Brings up the Preferences panel which can be used to adjust Chartsmith's defaults
for a variety of functions, including what formatting attributes it applies to new
charts for each chart type and what color it applies to each new series in a chart.
When you make changes in the Preferences panel, the Set and Revert buttons
become available at the bottom of the panel. Clicking Set puts the change(s) into
effect. Revert returns the settings to the way they were before changes were made,
as does closing the panel without clicking either button.
92
Chartsmith User’s Guide
Reference
3
• Series
The Series preferences lets you determine the series type that will be created when
a new document is created. Use the scroll bar to view all the series types. Click the
icon of the series you want to be the first series of new documents.
• Templates
Lets you choose a template for each chart type to determine what a new chart will
look like when the Chart -> Add Chart menu item is used, and when the default
chart in a new document is created. Click Set to bring up a standard Mac OS X
Open panel from which to select the template you want to use for the currently
selected chart Type.
Chartsmith User’s Guide
93
3
Reference
Clicking Clear removes the current selection. Clicking the Active checkbox off
leaves the template selection in place but tells Chartsmith not to use it for new
charts. Double-clicking the template's icon in the Preferences panel causes it to
display the template's thumbnail icon.
• Colors
Lets you choose seven colors to apply by default to the first seven series in a chart.
If you add series beyond seven, the pattern will repeat (i.e. color one will also be
co. eight, color two will be color nine, etc.). To change the colors, drag a color
from the Color panel and drop it on the series whose color you wish to change.
If you've made series color changes that you'd like to use again in future charts, but
don't want to change the basic settings here, save the chart as a template containing
Series attributes. (This will also save all other series attributes as well. See
Concepts – Using Templates.)
• Fonts
Lets you pick a default font type, size and style for all Text and Balloon
Annotations, and for the cells, row labels, and column labels in the Data View
window. The popup menu lets you choose the element whose font you want to
change. Clicking Set Font brings up a standard Mac OS X Font panel with which to
make the changes.
94
Chartsmith User’s Guide
Reference
3
• Update
Chartsmith can use the Internet to determine if a newer version of the application is
available. This panel allows you to control if and how often the checks will be
preformed. If you don’t want Chartsmith to automatically check for updates choose
the Manual Updates Checks switch. If you do opt for Automatic updates use the
pop-up to chose how often.
• Miscellaneous
The top left checkbox lets you determine whether Chartsmith will automatically
create a new empty document when the application is started. The second left
checkbox determines whether transparent colors are allowed in charts. The top
right checkbox determines whether to automatically create a backup copy of
Chartsmith User’s Guide
95
3
Reference
documents, and the bottom right checkbox tells Chartsmith whether to hide the
Data View window when Chartsmith is not the primary application. Note: The
primary application is the one that has its menu at the top of the screen.
The Image Export Attributes control the default behavior when a bit mapped image
type is exported from Chartsmith. This is the only place where you can control the
resolution for TIFF charts that are Option-dragged or Edit -> Copy out of the chart
view. Note: You can specify these attributes on a case-by-case basis via the Chart > Export Image menu item. See Concepts – The Chart Menu – Exporting Charts.
The TIFF and PDF checkboxes lets you decide whether the pasteboard will keep
images as TIFF, PDF or both.
The number of undo steps available in Chartsmith is at the bottom of this panel.
Limiting the number of undo steps is recommended for improved performance.
Note: When Allow use of transparency checkbox is changed and stored by clicking
the Set button, all charts are redrawn to reflect this change. This is the only
preference that affects currently existing charts.
96
Chartsmith User’s Guide
Reference
3
Check for Updates
Instructs Chartsmith to determine, via the Internet, if your version of Chartsmith is
the latest that is available. If you are running the latest version a panel is displayed
which indicates that this is the case. If a newer version is available, a panel is
displayed that tells you the lasted version that is available and provides you options
for download or to get more information.
License
Brings up the license panel where current licenses can be shown and new licenses
can be entered.
Feedback
Brings up an email form to make it easy for you to send suggestions about
Chartsmith to Blacksmith.
Purchase
Brings up the Chartsmith on-line store located at www.blacksmith.com.
Services
Chartsmith provides support for Mac OS X Services via the Chartsmith -> Services
menu item. In addition to containing a Services menu, Chartsmith will also appear
Chartsmith User’s Guide
97
3
Reference
in the Services menus of other applications. Selecting text in one of those
applications, then selecting the desired chart type in Application -> Services ->
Chartsmith submenu will bring up Chartsmith with a new document to create the
chart requested.
Hide Chartsmith, Hide Others, Show All, and Quit Chartsmith
The Hide Chartsmith, Hide Others, Show All, and Quit Chartsmith menu items all
behave as they do in every Mac OS X application.
The File Menu
The File menu contains the commands for opening, saving and closing Chartsmith
documents. A Chartsmith document is a collection of charts kept as a column of
thumbnail icons in the Navigator area of the Document window. There are no
document-wide formatting restrictions on the individual charts within a document.
Charts can be selected (by clicking or dragging in the Navigator area of the Chart
window) and cut, copied, and pasted both within and between documents. To
rearrange the order of the charts in the Navigator, hold down the Control key while
you pick the chart up with the mouse, then drag it to a new location and drop it
there.
Charts can also be dragged and dropped as images directly from the Chartsmith
Chart View into the documents of many Mac OS X applications. (Option-drag
drags a copy as a TIFF image and Command-drag drags a copy as PDF, as their
respective drag icons indicate.)
Documents can be printed in whole or in part (using the "From, To" page setting in
the Print panel). Each chart will be printed on a separate page.
Open
Brings up a standard Mac OS X Open panel for finding and opening Chartsmith
documents. See your Mac OS X documentation if you need more information
about Open panels.
When you use Open, the Chart window will appear displaying the chart which was
selected (active) the last time the document was saved. The Chart window will
appear in its last saved position at its last saved size.
98
Chartsmith User’s Guide
Reference
3
New
Creates a new Chartsmith document containing one new chart in a new Chart
window. The series type and attributes of the new chart are determined by the
settings in the Preferences panel. See Reference – The Chartsmith Menu Preferences for more information.
This command also opens the Data View window if it's not already open. If it's the
first time the Data View window has been opened during a Chartsmith session, it
will open at the position and size it was when Chartsmith was last exited.
Otherwise it will open at the position and size it had when last closed during the
session.
The contents of the Data View window always match the active chart, i.e. the one
currently displayed in the active Chart window. A new chart's Data View window
always contains a single series column or column set and a single unnamed row,
with the selection highlight marking the topmost, leftmost data cell.
New From Template
Brings up a panel for finding and choosing a Chartsmith template from which the
attributes of the first chart in the document will be set. As templates are located and
selected using the top half of the panel, the bottom half of the panel displays the
attributes associated with the selected template.
For information about what Templates can contain and how to create them, see
Reference – The Chart Menu - Save As Template, and Concepts – Using
Templates.
Open Recent
The Open Recent menu item displays a list of the most recent Chartsmith
documents. Selecting one of these recent documents opens it the same as if the
Open menu item were used.
Save
Saves any changes made to the currently active document since the last time Save
was used. If the document has not yet been titled, this command brings up a
standard Save panel. See your Mac OS X documentation if you need more
information about Save panels.
Chartsmith User’s Guide
99
3
Reference
When you save a Chartsmith document, the position and size of the Chart window
is saved along with its contents. If in the Preferences panel you've selected to have
backup documents stored, they are created when the active document is saved.
Save As
Brings up a standard Save panel. Use the panel to enter a new name and/or storage
location, and the open document will be saved and renamed accordingly when you
click OK.
Export Document
Brings up a standard Save As panel to allow you to save a version of the open
document in its current state under a new name and/or in a new location, without
changing the name or location of the open document. This menu item is also used
to create other documents from the current Chartsmith document. For example it is
possible to export a Chartsmith document to a Keynote document.
Save All
Saves changes in all currently open Chartsmith documents. A Save panel will
appear for each unnamed document, if any.
Revert to Saved
Discards all changes made in a Chartsmith document since it was last saved.
Close
Closes the active Chartsmith document. If the document has unsaved changes, you
are given the option of saving before the document closes.
Page Setup
Opens a standard Mac OS X Page Layout panel. Under the settings pop-up menu,
the Chartsmith panel allows you to set the margins for the page during a print
operation. See your Mac OS X documentation for more information on the Page
Setup panel.
100
Chartsmith User’s Guide
Reference
3
Print
Opens a standard Mac OS X Print panel. Under the third pop-up menu, the
Chartsmith panel allows you to set the output format to either PDF or Bitmap, and
offers an option to scale the chart to fit the page. Choose the Bitmap option if you
are printing charts that use opacity. See Concepts – The Chart Window – Printing
for more information on Chartsmith printing, See your Mac OS X documentation
for more information on the Print panel.
The Edit Menu
The edit menu contains commands for Undo/Redo as well as pasteboard and
Special Character controls.
Undo Command
The Undo command allows you to step backwards in the command chain. The
command is most often used to back out of an unintended change to Chartsmith.
Note: The number of Undo steps that is allowed can be set in the Chartsmith ->
Preferences -> Miscellaneous panel.
Redo Command
The opposite of the Undo command, Redo allows you to step forwards in the
command chain. The command is most often used to reapply one or more changes
that had just been undone with Undo.
Cut
Deletes the current selection and puts it on the pasteboard, replacing the previous
contents of the pasteboard. (Some chart objects, the Legend, for example, cannot
be cut. Generally these objects can be hidden via controls in the Data View
window or the Inspector.)
Copy
Puts a copy of the current selection on the pasteboard, replacing the previous
contents of the pasteboard.
Chartsmith User’s Guide
101
3
Reference
Paste
If the Chart window is the active (key) window when there is ASCII data on the
pasteboard and there is neither a text selection nor a text insertion point in the
window, Paste adds a text annotation object to the active chart and pastes the
current contents of the pasteboard into it. If there is a text insertion point or text
selection in the active chart, Paste inserts the contents of the pasteboard at the
insertion point or replaces the selection.
If the Data View window is the active (key) window when there is ASCII data on
the pasteboard and only one data cell is selected within it, Paste will place the full
contents of the pasteboard in the Data View window, beginning with the selected
cell and overwriting existing data as necessary. If there's not enough room,
Chartsmith will bring up a panel asking whether you want to expand the space or
truncate the data. Chartsmith interprets tabs to mean "new cell" and carriage returns
to mean "new line."
If multiple data cells are selected, Paste replaces the selection with the current
contents of the pasteboard. If the pasteboard data is larger than the selection,
Chartsmith gives you the option to cancel the operation or truncate the data to fit. If
the pasteboard data is smaller than the selection, Chartsmith will repeat the
pasteboard data only if there's room for all of it to be repeated. Partial repeats will
not be pasted.
The same "single cell multiple cells" rules and behavior of pasting apply when you
use the Select Labels Only command in the Data View window to confine the
selection to the label area. Carriage returns are ignored in this operation.
You can also cut and copy rows and columns in the Data View window, and
annotation objects and whole charts in the Chart window (via the navigator) for
pasting into the same or different Chartsmith documents.
Paste Special
This command is available only when the Data View window is active (key). It is
used to paste ASCII data that contains both data and labels, or to paste data that
uses a column delimiter other than tab. Using it brings up the Import Data panel in
which you can specify which character will be interpreted as meaning "begin new
column" (the Column Delimiter), and whether to treat the topmost row of data on
the pasteboard as column labels and/or the leftmost column of data on the
pasteboard as row labels.
102
Chartsmith User’s Guide
Reference
3
To use this command, begin by selecting the cell in the data cell area where you
want the topmost, leftmost data entry to appear, and then use the command to bring
up the Data Import panel, select the options you want, and click OK. Chartsmith
will overwrite existing data if necessary to carry out the command. If the available
space is insufficient to contain the full contents of the pasteboard, a panel will
appear allowing you to choose whether you want to expand the cell area or truncate
the data.
As with the Paste command, if multiple data cells are selected, Paste Special
replaces the selection with the current contents of the pasteboard. If the pasteboard
data is larger than the selection, Chartsmith gives you the option to cancel the
operation or truncate the data to fit. If the pasteboard data is smaller than the
selection, Chartsmith will repeat the pasteboard data only if there's room for all of
it to be repeated. Partial repeats will not be pasted.
Select All
Selects: 1) all the elements of the active chart if the Chart window is active (key),
2) all the text in the field if text within a field is selected, and 3) everything which
matches the current selection type (row, column, cell) if the Data View window is
active.
Special Characters
Opens a standard Mac OS X Special Characters panel. See your Mac OS X
documentation for more information.
The Format Menu
The Format menu contains the menus and commands needed to change the font,
style and alignment attributes of text. It also provides commands for moving chart
elements in front of and behind each other, aligning objects vertically or
horizontally in a chart, and setting the printing orientation and the size of the paper
you intend to print your charts on.
Font and Text Menus
These menus contain standard Mac OS X commands for changing the font, style
and alignment attributes of text. For more information about those commands, see
the Mac OS X documentation.
Chartsmith User’s Guide
103
3
Reference
Bring To Front
Places selected chart objects in front of unselected ones.
Send To Back
Places selected chart objects behind unselected ones.
Align Menu
The align menu contains commands for lining up selected chart elements. (Note:
these commands cannot be used to align series or series entries in the legend.)
• Alignment
Brings up a panel in which you can pick the point on the objects which will be used
for alignment (center, left midpoint, lower left corner, etc.), and which contains
buttons for the four commands below.
• Make Row
Anchors the action around the selected object that extends farthest to the left and
moves the other objects as necessary to put them on the same horizontal line and
ensure that no selected objects overlap one another.
• Make Column
Anchors the action around the selected object that extends closest to the top and
moves the other objects as necessary to put them on the same vertical line and
ensure that no selected objects overlap one another.
• Align Horizontally
Anchors the action around the selected object that extends farthest to the left and
moves the other selected objects up or down (but not right or left) as necessary to
get them all on the same horizontal line.
• Align Vertically
Anchors the action around the selected object that extends closest to the top and
moves the other selected objects right or left (but not up or down) as necessary to
get them all on the same vertical line.
Position
Places selected chart objects at the left, center, or right of the chart.
104
Chartsmith User’s Guide
Reference
3
The Chart Menu
The Chart menu contains commands for creating and deleting charts in a
document, for saving charts as images independent of the document, for saving and
using Chart attributes as templates, for opening the Notes peanel, and for cleaning
up the display of the active chart in the area currently available for it in the Chart
window (the "Size to Fit Window" and "Normalize" commands).
Add Chart
All "Add" commands add, select and display a new chart in the active Chartsmith
document window. The new chart will appear in the Navigator just below the chart
selected when the command is used.
Add Chart From Template
Brings up a panel for finding and choosing a Chartsmith template to determine the
attributes the new chart will contain. As templates are located and selected using
the top half of the panel, the bottom half displays the attributes associated with the
selected template. See Reference – The Chart Menu - Save As Template, for more
information about the attributes templates can contain.
Delete
Deletes the currently selected chart or charts from the active document.
Apply Template
As with Add from Template, this command brings up a panel for finding and
choosing a Chartsmith template. Templates are located and selected using the top
half of the panel, the bottom half displays the attributes associated with the selected
template. Clicking OK applies the attributes of the selected template to the chart
currently selected in the Navigator, or to the charts specified in the From and To
fields.
Templates can also be applied by dragging them directly from the Finder and
dropping them either on the chart or on the Navigator. If you drop the template on
the active chart, it will be applied to that chart. If you drop it on the Navigator, it
will apply to all the charts currently selected there.
Series and grid attributes will not be applied when they don’t make sense. For
instance a template with a Pie chart in has nothing to say about a bar chart grid or
Chartsmith User’s Guide
105
3
Reference
series. The Apply Template command does not create new series if the template
contains more series than the destination, nor will the template affect series created
after it has been applied.
Not all series contain the same number of data columns. Where there's a column
number mismatch between the template and the destination, Chartsmith creates
columns and remaps columns to series as necessary to resolve the mismatch. You
can then use Cut and Paste to move the data if necessary.
(Note: If a template that contains an annotation is applied to a chart more than
once, then duplicate copies of the annotation will exist in the chart.)
Save As Template
Brings up a panel for choosing and saving attributes of the currently selected chart
as a chart template, which can then be applied to new or existing charts. By default,
templates are stored in the Library/Chartsmith folder found in your home folder.
• Title Attributes
Saves the position, font (including size and style) and Inspector settings of the chart
title and subtitle.
• All Title Text
Saves the actual text in the title and subtitle elements, if Title Attributes is also
checked, 2) the X and Y-axis names if Grid is also checked, 3) the legend title text
if Legend is also checked, and 4) the series label text if Series is also checked.
• Series
Saves the series type and all inspector settings for each series, plus the font
(including size and style) of series labels.
• Annotations
Saves the location, size, and Inspector settings for all objects created with the
Annotation panel. For text annotations, all font information and the actual text
itself are also saved.
• Background
Saves all the Inspector settings available for chart backgrounds.
106
Chartsmith User’s Guide
Reference
3
• Legend
Saves the shape, size and position of the Legend box and its Inspector settings, plus
the font (including size and style) of the Legend title and entry labels.
• Grid
Saves the size, position and all Inspector settings for the grid, plus the font
(including size and style) of the grid labels.
Set Chart Size
Brings up a panel that lets you set the exact chart size you wants in inches,
centimeters, points, or picas. There is also a check box that lets you constrain the
height and width to remain unchanged in the resize.
Size To Fit Window
Fits the display area for the active chart to the size of the Chart window.
Normalize
Returns the title, subtitle, legend and grid for the active chart to their default (i.e.,
starting) positions and enlarges or shrinks the grid area as necessary to fit the
available chart display area.
Show Chart Notes
Causes the Chart Notes panel to expand from the right side of the chart view. For
more information; see Concepts – Using Chart Notes.
Export Image
Brings up Chartsmith’s Export Image panel. For more information, see Concepts –
The Chart Window - Exporting Charts.
The Data View Menu
The Data View menu contains commands for creating the rows and columns into
which the data to be charted will be placed, for importing data from Excel and
standard text files, and for managing the display and labeling of the data being
charted.
Chartsmith User’s Guide
107
3
Reference
You can enter any combination of characters into the Data View window's data
cells, but only combinations of characters that follow certain rules will be
recognized as numbers and charted. Row and column label cells do not distinguish
between numbers and other strings or characters. Here are the rules for being
recognized as a number:
• Any number may be preceded by a "$", in which case the" $" is ignored in order
to determine the numeric value. ($120 = 120)
• Any number may be followed by a "%", and will be charted with a value of n
divided by 100. (30% = 30/100 = 0.30)
• Scientific notation may be used, with either 'e' or 'E'. The number can include a
decimal point and a positive or negative exponent. The exponent may not include a
decimal point. 1.32e+ 12, 2E-10 and 5 .3e9, for example, are all valid.
• Commas (or periods if you have it set in System Preferences International
Formats) may be used to indicate thousands, millions, etc.
• Periods (or commas is you have it set in System Preferences International
Formats) are used to indicate decimals.
• Any number outside the range of 1x10"-38 to 1x10"38 (1e-38 to 1e38) is
considered invalid for Chartsmith calculations, and is shown as "*,, * * * * * * *"
in the data cell. Out of range numbers are treated as zero.
• White space (spaces, tabs, and new lines) may appear before or after a number
but not within it. Thus," $1.25" and" 12%" are valid numbers, but not "$ 1.25" or
"12 %."
Data Viewer
Brings forward the Data View Window.
Data Fill Panel
Brings up the Data Fill panel. The calendar options-Days, Weeks, Months, Yearson this panel are especially useful in conjunction with the Select Labels Only
command for doing "smart" fills for row and column labels.
The Start entry determines what will appear in the first cell. The Step value in
conjunction with the Step Unit setting determines what will go in each subsequent
cell. A Start entry of 1/28/94, for instance, with a Step of 1 and the Step Units set
108
Chartsmith User’s Guide
Reference
3
to Weeks will produce 1/28/94, 2/4/94, 2/11/94, etc. The following formats are
acceptable as Start entries for the calendar settings:
• Day of the Week-any day of the week as either a 3-character abbreviation or a full
day name, uppercase or lowercase, e.g. tue, Tue, TUE, tuesday, Tuesday or
TUESDAY.
• Month-any month name as either a 3-character abbreviation or a full month name,
uppercase or lowercase, e.g. feb, Feb, FEB, february, February or FEBRUARY.
• Date-Valid date formats include the following:
DD-MMM(12-jan)
DD-MMM-YY(12-Aug-93)
DD-MMM- YYYY( 3-sep-1992)
MMM- YY(Feb-92)
MMM-YYYY(mar-1993)
MM/DD(6/8)
MM/DD/YY(3/12/93 )
MM/DD/YYYY( 11/3/1993)
The following formats are acceptable as Start entries for the Linear Setting. With a
Linear setting, each new entry is produced by adding the Step value to the previous
entry.
• Quarter-an upper- or lower-case" Q" and a quarter number from 1 to 4 are
required. A trailing reference year or string is optional. Examples of valid quarter
formats: "q2", "Q1 ", "q 4 91 ", "q2 1992", "q 3 yr1992","1 q 92",...
• Mixed-any combination of alphanumeric with at least one digit. The Step value is
added through the sequence. A mixed format Start entry of "#DGK8a" would
produce "#DGK8a,#DGK9a,#DGK10a, etc."
• Word-alpha characters only. A start string of "aBC" produces a sequence of
"aBC1,aBC2,aBC3,..." .
• Alphabetic-if the start string is "A" (uppercase), the sequence will follow through
the alphabet, e.g. A, B, C, etc.
Chartsmith User’s Guide
109
3
Reference
Both the Linear setting and the Geometric one (each new value is produced by
multiplying the previous value times the step value) will accept integers or floating
point numbers for both the Start and the Step values.
The Fill by Row and Fill by Column commands apply only to data cell fills (not
label cell ones) and determine the direction of the step increase in the fill.
Add Rows
Brings up a panel into which you can enter the number of rows you want to add to
the Data View window. The rows are added after the currently selected row, or
after the last row if no row is selected.
Pressing the Enter key on the numbers keyboard inserts a new row immediately
below the currently selected row.
Add Series Columns
Brings up a panel into which you can enter the number of columns you want to add
to the Data View window. The columns are added after the currently selected
columns, or after the last column if no column is selected.
Pressing the Enter key on the numbers keyboard inserts a new column immediately
to the right of the currently selected column.
Size To Fit
Shrinks or enlarges the currently selected rows, columns or labels as necessary to
fit the data/text their cells contain.
Transpose Data
Turns row data into column data and vice versa.
Transpose Labels
Turns row labels into column labels and vice versa.
Select Labels Only
Clicking in or dragging across the label area selects all the cells in the associated
rows or columns. Using this command narrows the selection to the label area only
110
Chartsmith User’s Guide
Reference
3
so formatting and text entry can be applied to the labels without affecting the data
cells.
Toggle Y Axis
This menu item allows you to move the currently selected series from the Y1 to the
Y2-axis or vice versa. This menu item is only enabled when both Y axes are turned
on in the grid.
Import ASCII Data
Brings up a standard Open panel for choosing an ASCII text file containing data
you wish to chart using Chartsmith. Choosing a file with the Open panel brings up
another panel in which you can specify which character will be interpreted as
meaning "begin new column" (the Column Delimiter), and whether to treat the
topmost row of data on the pasteboard as column labels and/or the leftmost column
of data on the pasteboard as row labels.
Clicking OK puts the contents of the ASCII document into the cells in the Data
View window. If there's not enough room for all the data, new rows and columns
will be created as necessary. This command is not available unless the Data View
window is the active (key) window.
ASCII data stored in files can also be imported by dragging the file from the Finder
and dropping it onto the Data View. The Data Import panel will then be displayed
in which you can specify the column delimiter and data content.
Import From Excel
This menu item initiates a wizard that walks you through the process of importing
data from an Excel spreadsheet into Chartsmith. For more information, see
Concepts – The Data View Window – Import Data From Microsoft Excel.
Update Import From Excel / Update All Excel Imports
These menu items allow the user to refresh the data in Chartsmith from an Import
From Excel.
The Tools Menu
The Tools menu contains commands to bring up three panels, which provide
significant control over the appearance of charts and their elements. Each of the
Chartsmith User’s Guide
111
3
Reference
panels can also be brought up by clicking its button in the upper left hand corner of
the Chart window.
Inspector
Brings up the Chartsmith Inspector panel. The contents of this panel change in
accordance with the selection in the active chart. Broadly speaking this panel lets
you examine and change the titles, background, grid, legend, series graphics and
annotation objects in a chart. The Inspector is discussed throughout the Concepts
section of this manual within the context of the chart elements and activities it's
used for.
Colors
Brings up the standard Mac OS X Color panel with a slider that allows you to set
the opacity of the current color. Opacity means, "how much of the background
shows through items colored with this color." 100% opacity (the default) means
"no background shows through. "
Colors can be dragged from the Color panel and dropped on any chart element in
the Chart View to set its color. While color swatches are dragged over the Chart
View, their effects can be previewed before the color is dropped by holding down
the Option (Alt) key while dragging.
For more information about using the panel itself, see your Mac OS X
documentation. For more information about using it to add color to charts, see
Concepts - Using and Inspecting Color.
Annotate
Brings up the Annotation panel and attaches it to the upper left-hand corner of the
Chart window. Dragging from any of the Annotation panel's wells-text, box
(capable of displaying an image), line, circle and balloon (for displaying text and
associating it with a particular chart element), creates a copy of that annotation type
wherever you drop the dragged icon. Each type can be inspected and changed using
the Inspector.
112
Chartsmith User’s Guide
Reference
3
Window
The Window menu behaves as it does in other Mac OS X applications that follow
the Mac OS X guidelines. See your Mac OS X documentation if you need more
information about them.
Help
The Help menu provides access to resources that can help you use Chartsmith. It
includes Chartsmith Help and the Chartsmith Users Manual as well as links to the
latest release notes and other on-line resources.
Chartsmith Help
Launches the Help Viewer application loaded with Chartsmith Help. For more
information about using Help Viewer, see your Mac OS X documentation.
Chartsmith Users Manual
Displays the PDF version of this document.
Chartsmith Release Notes
Uses your default Web browser to bring up the on-line web page for Chartsmith
release notes.
Chartsmith FAQ
Uses your default Web browser to bring up the on-line web page for Chartsmith
frequently asked questions.
Cool Features in Chartsmith
Uses your default Web browser to bring up the on-line web page for Chartsmith
cool features.
Chartsmith User’s Guide
113
3
114
Reference
Chartsmith User’s Guide
4
Glossary
4
Glossary
Glossary
Annotation - a graphical element appended to a chart. Chartsmith offers four
annotation types: Text, Line, Box and Circle.
Axis - the boundaries of the Grid that are used to measure and label the chart
series. The Y Axis can be positioned on the left(Y1), right(Y2) or both the left and
right(Both).
Background - the back drop of a chart, which is always drawn behind all other
chart components.
Border - the frame around the boundary of the chart.
Chart - a graphical display of numerical data.
Chart Title - text annotations in a chart that have special meaning. They cannot be
deleted but can be hidden.
Chart View - the scroll view in the Chart Window where a chart is displayed and
its components can be manipulated.
Chart Window - the primary window in the Chartsmith user interface, it contains
the Chart View and Navigator.
Column Header - in the Data View, the region above the series label where the
series type icon is displayed.
Color Previewing - a feature that allows you to view the effect of a dragged color
before the color is actually dropped; all chart components can be color previewed
by alt-dragging color swatches to the Chart View from a color panel.
Data Element - the components of a series; each data element corresponds with a
row in the Data View.
Data Fill - a feature that produces textual and numeric sequences based on basic
parameters that are provided by the user; used to fill the labels and data cells of the
Data View.
Data View - a table provided to define a chart's series, label the series and data
elements, and enter and display data; all submenu items in the Data View menu
apply to the Data View.
Data View Window - contains the Data View, the Chart Attributes Box and the
Series Palette.
116
Chartsmith User’s Guide
Glossary
4
Drag and Drop - the act of using the mouse to drag item on screen from one
location to another, e.g. the mouse can be used to drag and drop an image file from
the Workspace onto the Chart View to set the background image.
Excel – the spreadsheet application authored by the Microsoft Corporation
Gradient - the color filling of a region using a pattern that transforms from one
color to another color.
Grid - the "graph paper" used to plot all series of the Bar/Line and XY families. A
grid includes the x- and y-axis, the major and minor lines, the axis labels and the
tick labels. Pie Series have no grid.
Inspector Panel - a panel providing controls to change or set many of the
attributes of individual chart components. Often referred to simply as the Inspector.
Legend - the key used to identify the series within a chart; In the case of Pie charts,
the legend identifies the slices within the pies. All charts contain legends.
Major Grid Line - the horizontal and vertical lines in the Grid's mesh of
perpendicular lines that correspond to numeric increments of the step value.
Minor Grid Line - the horizontal and vertical lines in the Grid's mesh of
perpendicular lines that divide the spaces between the major grid lines.
Navigator - the scroll view in the Chart Window that provides access to all charts
in a given document; charts are represented in the Navigator by thumbnail images.
Normalize - to size and reposition all chart components based on the size of the
chart.
Paste Special - a category of pasting to the Data View that provides options for the
paste content and delimiter type.
Series - the graphical format that a data set takes on when displayed in a chart. In
Chartsmith, every series has a series column (in the Data View) and a graphical
series (in the chart).
Series Columns - columns of data storage found in the Data View; each series
column has a corresponding series in the chart; the header of the series column
displays its series type; a series column can have sub-columns, such as the Hi-Lo
and XY series.
Series Palette - the view in the Data View Window that displays the icons for the
available series for the current chart type.
Chartsmith User’s Guide
117
4
Glossary
Shortcut Buttons - three buttons found on the Chart Window that access the tools
otherwise found in the Tools menu.
Template - a collection of chart attributes that can be stored as a file in the
Workspace and later applied to any number of charts to format them according to
these attributes.
Thumbnail - the tiny image that is intended to show the general makeup of a chart;
thumbnail images are used in the Navigator and in the Template Selector.
Tick Label - a label that corresponds to the value associated with the major grid
line at the label location; tick labels may or may not have a corresponding tick
mark.
Tick Mark - a small line perpendicular to and extending beyond a Grid axis;
intended to highlight the location of a major or minor line; tick marks may or may
not have a corresponding tick label.
Trend – a feature of a data series that displays the mathematical trend line
established by the data in the series.
Y1 or Y2 axis - the grid can have a Y axis positioned on the left (Y1), on the right
(Y2) or on both the left and right (Both).
118
Chartsmith User’s Guide