1
Automatic Asset Tracking System
Table of contents
Chapter 1.
Introduction ........................................................................................ 5
1.1.
Background ................................................................................................................... 6
1.2.
Project Specification ...................................................................................................... 6
1.3.
Plan of Development ..................................................................................................... 7
Chapter 2.
State of the Art ................................................................................... 8
2.1.
ZigBee/GPS.................................................................................................................... 8
2.2.
ADS-B ............................................................................................................................ 8
2.3.
GPS/GPRS/GSM ............................................................................................................. 9
2.4.
RFID .............................................................................................................................. 9
2.5.
RF/GPS Solution ............................................................................................................ 9
Chapter 3.
Automatic Asset Tracking System ................................................. 10
Chapter 4.
Hardware Implementation ............................................................... 13
4.1.
Global Positioning Systems .......................................................................................... 14
4.1.1.
General features ............................................................................................................ 15
4.1.2.
NMEA 0183 Protocols.................................................................................................... 16
4.1.3.
Connecting the GPS ....................................................................................................... 18
4.1.4.
GPS Output .................................................................................................................... 19
4.2.
Communications .......................................................................................................... 21
4.2.1.
RS-232............................................................................................................................ 21
4.2.2.
LVTTL ............................................................................................................................. 22
4.3.
Radio modules ............................................................................................................. 23
4.3.1.
Hardware components .................................................................................................. 23
4.3.2.
Characteristics ............................................................................................................... 24
4.3.3.
Functional characteristics.............................................................................................. 25
4.3.4.
Transmission process .................................................................................................... 26
4.3.5.
Tiny Tools....................................................................................................................... 29
4.3.6.
Settings .......................................................................................................................... 29
4.4.
Mounting .................................................................................................................... 34
Chapter 5.
5.1.
Software Development .................................................................... 35
Programming environment .......................................................................................... 36
5.1.1.
Python ........................................................................................................................... 36
5.1.2.
wxPython ....................................................................................................................... 36
5.1.3.
pySerial .......................................................................................................................... 36
1
Automatic Asset Tracking System
5.2.
Receiving data ............................................................................................................. 37
5.2.1.
The receiving process .................................................................................................... 37
5.2.2.
Creation of log files and data files ................................................................................. 38
5.2.3.
Reading files .................................................................................................................. 39
5.2.4.
The printing process ...................................................................................................... 40
5.3.
Graphical user interface ............................................................................................... 41
5.3.1.
Status bar....................................................................................................................... 41
5.3.2.
Menu bar ....................................................................................................................... 41
5.3.3.
Zoom function ............................................................................................................... 43
Chapter 6.
Economic Evaluation ....................................................................... 44
6.1.
Development ............................................................................................................... 44
6.2.
Implementation ........................................................................................................... 44
6.3.
Materials ..................................................................................................................... 45
6.4.
Cost-effectiveness........................................................................................................ 46
Chapter 7.
Field Tests ........................................................................................ 48
Chapter 8.
Future Improvements ...................................................................... 51
8.1.
Software ..................................................................................................................... 51
8.2.
Hardware .................................................................................................................... 51
8.3.
SWOT Analysis ............................................................................................................. 52
Chapter 9.
Conclusion ....................................................................................... 53
Chapter 10. Acknowledgment ............................................................................. 54
Chapter 11. References........................................................................................ 55
Chapter 12. Appendices....................................................................................... 56
12.1.
Responsibility matrix................................................................................................ 56
12.2.
Software source code ............................................................................................... 57
2
Automatic Asset Tracking System
Index of illustrations
Figure 1. Airport vehicle with the Tracking Device on the roof ............................................................ 10
Figure 2. Basic communication network ............................................................................................... 11
Figure 3. Communication network........................................................................................................ 12
Figure 4. Concept of trilateration .......................................................................................................... 14
Figure 5. GPS chipset from RF Solutions GT-320R................................................................................. 15
Figure 6. GPS pin connectors................................................................................................................. 15
Figure 7. Cable assembly for connection with GPS-320R modules....................................................... 18
Figure 8. Celestron interface ................................................................................................................. 19
Figure 9. GPS Output format ................................................................................................................. 19
Figure 10. DB9 Connector ..................................................................................................................... 21
Figure 11. Modems Tiny Pro : a) M868, IP67 and b) B868 .................................................................. 24
Figure 12. Connection between TinyOne Module and Computer ........................................................ 24
Figure 13. B868-TinyOne Pro ................................................................................................................ 25
Figure 14. Transparent mode ................................................................................................................ 27
Figure 15. Adressed Secured Mode ...................................................................................................... 28
Figure 16. Tiny Tools v.1.00W Software ................................................................................................ 29
Figure 17. Register configuration .......................................................................................................... 33
Figure 18. Suction cup ........................................................................................................................... 34
Figure 19. Magnetic system .................................................................................................................. 34
Figure 20. The console showing a corrupted frame.............................................................................. 38
Figure 21. Log file in which checksum errors have occurred ................................................................ 39
Figure 22. The program displaying the positions of the vehicles ......................................................... 40
Figure 23. The File menu ....................................................................................................................... 41
Figure 24. The Track menu .................................................................................................................... 42
Figure 25. The Help menu ..................................................................................................................... 43
Figure 26. Initiating the program .......................................................................................................... 43
Figure 27. Comparison of long term costs of the two systems ............................................................. 47
Figure 28. Coverage area at the Airport of Barcelona .......................................................................... 49
3
Automatic Asset Tracking System
Index of tables
Table 1. Pinout description ................................................................................................................... 16
Table 2. NMEA 0183 Protocols .............................................................................................................. 16
Table 3. GPGLL (Graphic Position Latitude and Longitude) ................................................................... 17
Table 4. GPRMC (Recommended Minimum Specific Data) ................................................................... 17
Table 5. Relation between Pins and Signal ........................................................................................... 22
Table 6. Functional characteristics of TinyPro terminal ........................................................................ 26
Table 7. Register description ................................................................................................................. 30
Table 8. Configuration of the radio modems ........................................................................................ 32
Table 9. Costs for human resources ...................................................................................................... 44
Table 10. Costs for assembling and installation .................................................................................... 45
Table 11. Material costs ........................................................................................................................ 45
Table 12. Material costs for the entire airport...................................................................................... 46
Table 13. Cumulated costs .................................................................................................................... 47
Table 14. SWOT Analysis ....................................................................................................................... 52
4
Automatic Asset Tracking System
Chapter 1. Introduction
Nowadays, companies focus on a worldwide perspective due to the increasing globalization in recent
years. Therefore, a variety of employees is needed to fulfill the global market demands. Additionally,
the majority of working methods to solve problems shift towards a more team based approach, in
which different skill sets, backgrounds and point of views are required.
Realizing these requirements, the Engineering College of Copenhagen founded the European Project
Semester (EPS). The program offers the opportunity to learn to work in teams in an international,
multicultural and interdisciplinary atmosphere and thereby providing the students with the proper
knowledge of the future work life. This year the EPS at the Escola Politècnica Superior d’Enginyeria
de Vilanova I la Geltrú, Universitat Politècnica de Catalunya is offered for the fourth time.
The European Project Semester gives students the possibility to work in a team with the same goal.
Besides the different backgrounds, the young engineers have to manage the project development by
demonstrating the skills gathered during the studies. Therefore, the variety of studies does not create
distance during the work process. Moreover, the diversification of ideas leads to discussions and
debates which will enrich each member‟s knowledge. Hence, the project offers the opportunity to
improve greatly in all the aspects possible.
The biggest hurdle to overcome is an effective communication, because it is fundamental to establish a
good team work. For this reason, not only does everyone have to get a proper usage of the English
tongue in order to share their opinions and develop the project, but also each team member needs to be
confident to express his or her ideas and criticism. Therefore, a good and friendly relationship as well
as respect for one another must be established.
This paper deals with the collaborative project „Automatic Asset Tracking System‟, which is
performed in cooperation with the AENA (Aeropuertos Españoles y Navegación Aérea) Company, in
particular with El Prat de Llobregat - Barcelona Airport, and the Escola Politècnica Superior
d’Enginyeria de Vilanova I la Geltrú. The Aena Company offers the opportunity to work on a
pioneering project for the biggest airport in Catalonia. In addition to that, we received significant
support from our supervisor Vicenç Parisi. The project resembles a great challenge for everyone
involved.
5
Automatic Asset Tracking System
1.1. Background
In 2007, the Airport of Barcelona acquired a new Terminal, in order to offer a larger variety of flight
opportunities /destinations, as well as the growing number of customers in the Air Travelling Sector.
This expansion led to an increase of 6.5% to a total of 29.2 million passengers in 2010 compared to
2009. Today the Barcelona airport is considered the 10th busiest airport in Europe.
As a result of this development, the number of supporting vehicles in the airport has increased
dramatically. Today, over 1000 buses, cars, trucks, emergency cars and other vehicles are needed to
run an airport safely and smoothly. However, the coordination and traffic control has become harder
and harder, due to the lack of an electronic surveillance system.
Until now, the airport is surveying their vehicles with the help of ground personnel communicating the
information to the Headquarters. This solution, however, is not very accurate or efficient. For this
reason, the AENA Company started to think about a better way of handling this problem. As a result
of this, a new project was founded with the title „Automatic Asset Tracking System‟. This project was
given to the EPSEVG for the European Project Semester.
Considering the fact that over one thousand vehicles are moving and surveying the Airport of
Barcelona, a system that could be implemented must have a high performance rate and reliability.
However, no matter how good the system is, it will be difficult to monitor each and every car not only
because of interferences or system limitations, but also for the controller to spot that many vehicles at
once. Hence, it would be better to decrease this number by any means possible. This leads to the
suggestion, that there is no reason to control all the airport vehicles just those that can be involved in
an accident or represent a high risk for the safety of the airport. Therefore, the vehicles, which should
be monitored, are all the cars that have access to the airstrip like: airplane tugs, fire trucks,
maintenance cars, etc.
1.2. Project Specification
The project aims to search for an existing system or develop a new solution, which is able to track all
vehicles moving in the airport area. Furthermore, the positions should be available once every second
in order to monitor the cars in real time.
Another very important specification is that the displayed position needs to be within 5 meters of the
actual location in order to clearly see if a vehicle is on a real street, on the runway or on a field. This
information can be used to prevent accidents or collisions inside the surveillance area. Therefore, the
accuracy of the entire system has to be ± 5m.
The next requirement is that the area, which needs to be covered, has a maximum range of 10 km. This
enables the possibility that the limits of the area are clearly stated and the software and maps can be
adjusted to these facts.
6
Automatic Asset Tracking System
Since no employee will have any experience with a newly developed system and in order to make the
handling of it as user friendly as possible the software part of the project also has to take some facts
into consideration.
Firstly, the interface should be easy to understand and operate in order to enable everyone to use the
system without a special training. Secondly, the software should be written in an open-source
programming language to easily implement the system without buying any licenses or patents.
Moreover, open-source based programs can be improved and evolved more smoothly in comparison to
licensed programs or languages due to the larger information freely available on the internet. Finally,
the software should run under every operating system, like Linux and Windows. Furthermore, the
program needs to be fast and accurate to fully support the hardware features and to be refreshable once
every second.
All these demands have to be combined in a system, which is not only highly reliable, efficient and
accurate, but also has to be very cost-efficient as well. Hence, a comparison between already existing
systems and the system in development has to point out the benefits of creating a new system and
spending a lot of money for the research and development. Thus, the system should always try to
spend as little as possible on parts or materials, which is why an open-source software is very useful.
1.3. Plan of Development
To guide the reader through the development and research, the report is divided into the following
sections.
I.
State of the Art. In this section an overview of the current state of the art systems
for monitoring and tracking vehicles or objects is given.
II.
Hardware Implementation. Contained in this section is a detailed description of
the components used to develop the new system.
III.
Software Development. This section presents the design and development of the
software used to run and operate the system.
IV.
Field Tests. In this part the results of the tests performed to confirm the
functionality of the system are explained in detail.
V.
Economic Evaluation. A cost analysis in comparison with other systems is
presented in this section.
VI.
Future Improvements. This section lays out the future improvements and
innovations of the new system.
VII.
Conclusion. The final section is a summary of the founded results and a critical
review of the entire project.
7
Automatic Asset Tracking System
Chapter 2. State of the Art
There are already several existing solutions in other airports around the globe to track vehicles. Also,
the biggest users of such systems are companies, who need a fleet tracking system to monitor all their
trucks and cars on the road. In the following sections, the state of the art of current systems used to
track and control cars or objects, as well as the new technology implemented in the developed system,
is described.
2.1. ZigBee/GPS
ZigBee is a wireless mesh networking standard. In combination with a GPS device it could function
similarly to our solution. The benefit of a ZigBee network is its low–cost and low-power consumption.
As a result, the low-cost enables a wide spread of this technology in wireless controls and tracking or
monitoring solutions. In addition to that the low-power consumption promises a better usage of
smaller batteries with a higher charge level. The ZigBee network is also known for its high reliability.
Even though all these attributes would fit perfectly in our concept it has one major flaw. In order to
send the data over more than 200 meters a hop is needed. Therefore, we would need a complete meshhop network around the airport area, which would lead to bigger cost due to the equipment needed as
well as an increased sending time. Consequently, our data would be send every second but arrive with
a delay at the receiver. Furthermore, the data volume, which 1000 vehicles would produce would go
beyond the recommended and supported bandwidth of ZigBee modules.
2.2. ADS-B
Automatic Dependent Surveillance-Broadcast (ADS-B) is a surveillance technology for tracking
aircrafts as part of the Next Generation Air Transportation System (NextGen). In addition to that,
some airports also provide their ground vehicles with this system to keep track on all the activity on
their landings fields, terminals and the wider airport area. The ADS-B system is used in the airports of
Frankfurt, Helsinki and other big airports. This solution uses ADS-B Out Transponders, which will
need to be installed in every modern airplane, at least in the US. It can track airplanes or vehicles
faster and much better than the radar system and it also functions in any weather condition. It sends
data to the ADS-B In Station at the airport towers. This information, which is broadcasted every
second or even faster, includes altitude, heading, speed, and distance to other airplanes or vehicles.
However, this system is relatively new and the needed technology is not that wide spread. The United
States try to have the system completely running by 2020. Nonetheless, this solution would also only
have material and installation costs, but no service fees or additional costs. It is definitely a system,
which will gain popularity in the future and is as cost efficient as any system can be.
8
Automatic Asset Tracking System
2.3. GPS/GPRS/GSM
The GPS device in combination with the GPRS function is quite similar to our new found solution.
The GPRS would take the place of our radio frequency device. The General Packet Radio Service
(GPRS) aims to send data packages to GSM and UMTS networks. Nonetheless, it needs a SIM card
and therefore a telephone contract to send the position. This leads to fixed cost every month of around
10 Euros per car, which will quickly add up. However, this system is able to track assets with a 1
second/location rate, which would meet our demands. In addition to that, there are a lot of different
systems available already. This system would be the easiest, safest and most tested/used solution due
to the fact, that it is used by a lot of companies, which have a Fleet Managing and Tracking System.
On the other hand it is also the most expensive solution considering the long term costs.
2.4. RFID
Radio-frequency identification (RFID) is a technology that uses communication through the use of
radio waves to exchange data between a reader and an electronic tag attached to an object, for the
purpose of identification and tracking. This system, however, is not able to track cars in real time. It is
normally used in supermarkets or other stores to read barcodes. Also, the manufacturing business uses
it to track their materials throughout their entire production area. This means that the system can rather
be used to restrict areas or monitor cars going in or out of a certain area, but not tracking the vehicles
in real time on the whole airport area. Nonetheless, this system would have no service fees or
additional cost than the installation and material costs. In order to be an alternative this system would
need to evolve a great deal. However, this system provides the basic level of communication of the
new system, by using those radio frequencies to send the data packages.
2.5. RF/GPS Solution
The State of the Art of the newly invented solution combines the positive aspects of the systems
mentioned in the Alternatives section of this report. The new tracking system uses a Radio Frequency
Device to communicate not only the characteristic of the object, e.g. the size, speed and classification
of the car, but also the position gained from the GPS device. Therefore, the result is a more mobile
solution that only uses one receiver. In addition to that, it functions similar to the GPS/GPRS/GSM
system, but eliminates the need of a mobile contract, because of the RF-communication.
9
Automatic Asset Tracking System
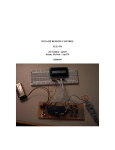
Chapter 3. Automatic Asset Tracking System
Nowadays, many companies around the world offer automatic asset tracking systems which can meet
the demands of the project. As it is mentioned in the previous chapters, the system that is going to be
designed will track the location of one thousand vehicles around the airstrip and the area of the
Barcelona Airport in real time. Therefore, the system needs to be mobile and able to support the
bandwidth needed for such an amount of cars. Consequently, the RFID system and the ZigBee
solution are not a fitting choice for the task. Furthermore, the new system should be as cost-efficient as
possible and not produce any long term costs. Thus, the GPS/GPRS solution cannot be used for our
project.
Finally, after researching the market for other available tracking systems, the choice was made to
develop a new system with a mix of the aforementioned solutions. Considering the pros and cons, it
became clear that a Radio Frequency technology will be the most appropriate communication system.
It was chosen not only due to the low costs of the transmission modules, but also because it does not
produce any additional monthly expenses. In order to make the system more mobile than the normal
RFID solution we added a GPS device to determine the position. Therefore, the data can be sent from
the RF device to one central receiver thus avoiding any fixed checkpoints for determining the position.
Our system is basically composed of a mobile device, which is used to keep track of the current
position of the vehicles, placed on the roof of each car. In addition to that, a fixed antenna, which will
receive the position, is installed in a central and high position. This combination enables the data to be
displayed on a monitor in close proximity to the receiving point.
The mobile device is a plastic box containing all the elements that establish a remote connection.
Those elements are a positioning system and a power supply, which is supports this device. The box is
designed to maintain the internal elements safe from all weather conditions. Additionally, the case has
a magnetic surface at the base which is necessary to keep the device in a fixed position on the roofs of
the cars, as displayed in figure 1.
1
Figure 1. Airport vehicle with the Tracking Device on the roof
1
The picture shown is not an actual vehicle of the Barcelona Airport.
10
Automatic Asset Tracking System
The antenna will be placed in a strategic point at the area of Terminal 2 of Aeroport el Prat de
Llobregat. In other words, this element is situated on the roof of the Technical Block Building to
eliminate interferences and improve the signal strength. The device is actually a receiver with an
external and prolonged antenna attached to it. A long antenna has to be used due to the fact that the
fixed module has to be in reach of a Personal Computer (PC), which is located inside of the building.
A transmitter, which sends the information, as well as a receiver are providing the networks
communication. Initially, the connection between the two points is made by configuring the two
modems properly. Therefore, it is crucial to select the same frequency channel to maintain a virtual
connection between the devices. Another very important aspect to take into consideration is the baud
rate, because it represents the actual speed in which the data is send. Further details about the
hardware are presented in the Hardware chapter, in the Modems section.
Aside of the communication, another important element of the system is the GPS (Global Positioning
System). The function of the GPS is to determine the mobile device‟s actual position, which is
composed of the longitude and latitude parameters, at a specific time. Moreover, a significant aspect of
the system is that it updates the location every second. In order to transmit all the information
collected by the mobile case to the fixed module, the GPS and the transmitter need to be connected to
each other. As a result, each second the acquired frames will be sent by the mobile device at a specific
frequency channel. This channel should also be used by the configured fixed module.
In figure 2 the Automatic Asset Tracking System is illustrated. On the left side the mobile case,
containing the GPS and the transmitter modem, can be seen. On the right side of the picture is an
illustration of the receiver connected to the monitor, which will display the location of the trucks at the
airport area.
Figure 2. Basic communication network
11
Automatic Asset Tracking System
Taking into account, that the system needs to cover a ten kilometer area, the addition of node router
would be recommendable. This new element doubles the possible tracking range making it a very
useful accessory. In order to fully reach the best functionality, the router has to be placed in a
strategically valuable point. The new structure of the network it is shown in figure 3.
Figure 3. Communication network
No solution that met all the requirements of the project was available at the beginning of the semester.
For this reason, a program managing the data had to be created entirely from scratch. In order to
present all the information received through the fixed antenna, the modem is connected to the
computer‟s serial port. Furthermore, the data received is managed by the application that is able to
read and analyze the information.
One of the key elements, why this project is made, is that operators should be able to monitor the
vehicles from one single screen. Therefore, the application prints a map covering the airfield and
additionally, plots all the locations of the vehicles on it, depending on the information received from
the devices.
Since the system should be able to handle the locations of at least one hundred vehicles, the program
should handle a large amount of data in real-time. Besides the importance of fluency in the program,
there are some features that will make the application as user friendly as possible. Therefore, a logging
function, recording all the received and interpreted information, has been created. The feature makes it
possible for the user to come back and check the log files if something needs to be examined.
12
Automatic Asset Tracking System
Chapter 4. Hardware Implementation
This chapter provides the reader with all the necessary information regarding any technical aspects
related to all the hardware components of the system. The materials defined as hardware are all the
tangible and physical elements included in the Automatic Asset Tracking System.
The main function of the hardware is to gain the position of a tracked vehicle and to transmit this
information to the receiver, where all the information will be interpreted and displayed. Furthermore,
due to the requirement to send the data in real-time, it is essential that all the devices are synchronized.
Also the system has to be absolutely reliable, because it not only ensures a safer airport environment,
but also logs all the files in case of an accident.
In order to determine the position of a vehicle it is crucial to implement a highly accurate GPS (Global
Positioning System) device. In addition to that, a communication network needs to be established. The
network is composed of a receiver, a transmitter and a Personal Computer (PC). The transmitter is
integrated within the same box as the GPS to send the acquired position, coordinates and other
irrelevant parameters, to the receiver. Nonetheless, the only function of the receiver is to process the
information to a Personal Computer, which analyses and processes all the information. Additionally,
the communication network operates through different frequency channels, which means that the
acquired information has to be sent through an addressed secured mode.
Considering that the aim of the project is to survey the entire airport area, the receiver has to be
positioned in a strategic place, preferably as high and free as possible. The same goal applies to the
transmitter, which is why it should be placed on the roof of the airport vehicles.
In summary, the system is basically composed of:
A GPS (Global Positioning System)
A Transmitter
A Receiver
A node Router
A Personal Computer
Connection cables/ devices
In the following subsection, a description of every device and connection used in order to develop the
first prototype will be given as well as an explanation of their essential contribution to our system.
13
Automatic Asset Tracking System
4.1. Global Positioning Systems
The GPS (Global Positioning System) is a worldwide navigation system that provides reliable location
and time information. Originally it was developed, installed and operated by the Defense Department
of the United States of America. This system works in a network of twenty-four synchronized Navstar
(Navigation System and Ranging) satellites to cover the entire surface of the Earth. These satellites
constantly send their orbital position, the exact time when they are emitting the signal and the
positions of the other GPS satellites.
In order to ensure the transmission of an accurate position, four main signals are needed. Those are the
communication signals between at least three satellites and another signal form the receiver, which is
the GPS chipset placed on the mobile case with the transmitter.
To track a position, the receiver sends an identification signal and a time signature. Using these
signals, the satellites synchronize the time signature and calculate the time it took to receive them. Due
to the cooperation between these satellites, the proper coordinates are sent back to the GPS device.
The data is transmitted as electromagnetic waves with a microwave frequency between 1.2 and 1.645
MHz. This would not be possible without the cooperation of five monitoring stations spread all over
the Earth, which control and verify the state of each of the satellites in real time.
Knowing the position of the satellites, the propagation speed of signals and the time the signal needs to
reach the receiver, the receiver's position on Earth can be calculated by trilateration. In figure 4 a
theoretical view of the trilateration concept is shown. Also, it is a common mistake to confuse
triangulation with trilateration. Triangulation, in geometrics, is a process to determine a position by
measuring the angle between known and fixed points. On the contrary, trilateration is used to
determine absolute or relative locations of points by measurement of distances, using the geometry of
spheres or triangles.
Figure 4. Concept of trilateration
14
Automatic Asset Tracking System
4.1.1. General features
The GPS chosen is a GT-320R, manufactured by RF Solutions. This device meets all the demands of
our project. The GPS module is continuously tracking all the satellites to provide accurate positioning
data. Furthermore, this device is suitable for our system because of the good performance ability, the
low purchase costs and its maximum flexibility.
Figure 5. GPS chipset from RF Solutions GT-320R
Features such as 16 parallel channel or 4100 simultaneous search bins provide fast satellite signal
acquisition and guarantee a short startup time. Furthermore, -140dB acquisition and -155dB tracking
sensibility offer a good navigation performance. Other important aspects to choose this device were
the availability of an interface, a LVTTL-level and RS-232 serial connectors. Additionally, the power
supply offers a high flexibility, 3.8V to 8V is supported.
Once the device is connected, the GPS sends the received coordinates through both output interfaces.
The information is sent each second by the previously configured protocol. In addition to that, another
useful feature of this device is that it has different types of output protocols, which are NMEA-0183,
GPGGA, GPGLL, GPGSV, GPVTG and GPZDA. The serial port interface protocol is based on the
National Marine Electronics Association‟s NMEA 0183 ASCII interface specification. This standard
is fully defined in “NMEA 0183, Version 3.01”. The default speed to transmit the data is 4800 baud.
Figure 6. GPS pin connectors
In order to establish a connection it is crucial to take the pins mentioned below into consideration.
Otherwise the GPS will experiment a malfunction or it might even damage the chipset. In the table
below different inputs and outputs of the GPS chipset are shown.
15
Automatic Asset Tracking System
Table 1. Pinout description
Pin Number
6
Signal
Serial Data Out 1
5
Serial Data In 1
4
Serial Data Out 2
3
Serial Data In 1
2
1
Power
Ground
Description
Asynchronous serial output at LVTTL level, to output
NMEA message
Asynchronous serial input at LVTTL level, to input
command message
Asynchronous serial output at RS-232 level, to output
NMEA message
Asynchronous serial input at RS-232 level, to input
command message
3.8V to 8.0V input
Ground signal
4.1.2. NMEA 0183 Protocols
In the past there were as many GPS protocols as there were GPS manufacturers. However, the NMEA
(National Marine Electronics Association) 0183 protocol has evolved to become the protocol of
choice for most software applications. The NMEA 0183 defines an electrical interface and data
protocol for communication between marine instrumentation. Furthermore, is can also be applied to
other fields. 2
Table 2. NMEA 0183 Protocols
Acronym
GGA
Name
GSA
Global Positioning System
and Fixed Data
Geographic Position
Latitude/Longitude
Global Active Satellites
GSV
Global Satellites in View
RMS
Recommended Minimum
Specific GNSS Data
GLL
Description
Time, position and fix type data.
Latitude, longitude, UTC time of position fix and
status.
GPS receiver operation mode, satellites used in the
position solution and DOP values.
The number of GPS satellites in view satellite ID
numbers, elevation, azimuth, and SNR values.
Time, date, position, course and speed data.
As seen in table 2, NMEA has different types of configuration and, depending on the protocol used,
the data transmitted includes a variety of parameters. Taking the parameters which represent the
position on a map into consideration, the most relevant information is the longitude and the latitude.
Thus, the main protocols that comply with the requests are GLL and RMS.
2
Specific Information from: www.kronosrobotics.com
16
Automatic Asset Tracking System
Having in mind that in order to send the data, it must be modified and processed. Therefore, the proper
protocol should just contain the useful information and the minimum size.
To test the prototype, the GPS device was connected to a Personal Computer. Once the correct settings
were made, a real location could be printed on a map. The messages name, which is also referred to as
the option, is composed of the characters following the $GP. Each data element is separated by a
comma and is terminated by the * character. After that the checksum is stated.
Table 3. GPGLL (Graphic Position Latitude and Longitude)
Name
Example
Description
Message ID
Latitude
N/S Indicator
Longitude
E/W Indicator
UTC Time
Status
Mode indicator
$GPGLL
2328.2329
N
12056.9328
E
161229.487
A
A
Checksum
*25
GLL protocol header
ddmm.mmmm (Degrees and minutes)
North/South
ddmm.mmmm (Degrees and minutes)
East/West
hhmmss.sss (Degrees,minutes and seconds)
A=valid position/ V=warning
N=Data invalid / A=Autonomous
D=Differential / E=Estimated
Security number to verify the data.
Table 4. GPRMC (Recommended Minimum Specific Data)
Name
Example
Description
Message ID
$GPRMC
RMC protocol header
UTC Time
161229.487
hhmmss.sss (Degrees,minutes and seconds)
Status
A
A=data valid / V=data not valid
Latitude
2328.2329
ddmm.mmmm (Degrees and minutes)
N/S Indicator
N
North/South
Longitude
12056.9328
ddmm.mmmm (Degrees and minutes)
E/W Indicator
E
East/West
Speed over ground
0.13(knots)
Speed of traveling
Course over ground
309.32º
Degrees of inclination
Checksum
*25
Security number to verify the data.
With regard to the previous tables an appropriate operating protocol had to be chosen. Even though
both protocols, RMC and GLL, can be used, the RMC protocol is the better choice, because of the
more complete and useful information, which can, for example, be used in case of an accident at the
airport. Once the PC receives the RMC message, the program will automatically log all the parameters
into an external file, which can be checked at any time. Even though, the software will only display
the latitude, longitude and time, it is very useful to save and have further information as well.
Therefore, we opted to use the RMC protocol.
17
Automatic Asset Tracking System
4.1.3. Connecting the GPS
In order to monitor and verify the correct performance of the GPS chipset, it has to be supplied with a
power between 3.8V and 8V .Moreover, the output pins have to be properly connected. Therefore, the
output pins have been manufactured with a special output plug. RF Solutions offers the possibility to
buy the right connector to make the connection between the GPS and the interface easier. The picture
number 7 shows a CBA-LS-40M cable.
3
Figure 7. Cable assembly for connection with GPS-320R modules
Once the cable was plugged into the GPS dowel, a RS-2323 connector was used to make the
connection with the interface possible. Most importantly, the Rx (Receiver pin), Tx (Transmitter pin)
and GND (Ground pin) have to be attached to the GPS chipset. After following all these steps, it was
possible to verify a behavior structure of the GPS chipset connected to the RS-2323, which is plugged
together with the RS-2323 to USB(Universal Serial Port) converter. The USB converter is very useful
because most of the current computers have a USB In/Output.
After gaining all the aforementioned information, the GPS was ready to be tested. However, to ensure
the best possible connection, a specific driver for the USB input/output had to be installed in order to
recognize the USB converter. Otherwise, it would not have been possible to monitor the GPS. These
drivers4 are free and available for all types of Personal Computers courtesy of Future Technology
Devices International Ldt. Company, who offer their products to every interested user. This tool is
called Virtual COM Port (VCP) and it causes the USB device to appear as an additional COM port
available to the PC.
The market offers a lot of free software tools to check the coordinates on the PC. The program used
during this project is called Celestron®.
4.1.3.1. GPS Software: Celestron®
Celestron is a free program, which is not only used for monitoring, but also offers the users the
function to select and configure almost all of the parameters. Especially that different type of frames
can be requested from the GPS. Another feature of this program is that it can be used to configure the
time clock of the GT-320R receiver.
3
4
Picture from RF Solutions: http://www.rfsolutions.co.uk
Drivers available at this web: http://www.ftdichip.com/Drivers/VCP.htm
18
Automatic Asset Tracking System
Since the default time is set in a UTC (Coordinated Universal Time) format, the time had to be set
forward by two hours to synchronize with Spanish real time. The user friendly interface makes it very
easy to fully understand and uses all features of this software.
Figure 8. Celestron interface
Figure 8 presents a screenshot of the GPS software. In top left corner the available satellites are
shown. In the middle all the options, which can be modified, are displayed. As a last part, at the
bottom of the picture the GPS output is exposed.
4.1.4. GPS Output
The information provided by the GPS receiver, as mentioned in previous paragraphs, can be different
depending of the protocol used. For this reason and after considering all the protocols that can fulfill
the project requirements, the Recommended Minimum Specific Protocol was chosen due to the facts
mentioned in section 5.1.2.
Figure 9. GPS Output format
19
Automatic Asset Tracking System
As presented in the previous section, the latitude and longitude are received in a specific format.
Therefore, the received data should be converted to the standard format in order to make it easier for
the software to process and display the information. To convert the received data, the format has to be
transformed from fractions of minutes to decimal degrees. In addition, there is no need to transform
the first figures because they represent the degrees and consequently are the same for both formats.
The last required change is to move the comma two digits to the left.
$GPRMC,141140.95,A,4118.4041,N,00204.9820,E,009.7,211.6,260511,000.0,W,A*29
Time: 14:11:39 Latitude: 41.3067666667 Longitude: 2.08306666667
GPS degrees and fraction of minutes format:
4118.4041 → 41.184041 → 41° 18.4041′ [1]
Decimal degrees format:
𝐷𝑒𝑐𝑖𝑚𝑎𝑙 𝑑𝑒𝑔𝑟𝑒𝑒𝑠 =
18.4041′
= 0.3067666667°
60
2
𝐷𝑒𝑔𝑟𝑒𝑒𝑠 𝑓𝑜𝑟𝑚𝑎𝑡 = 41.3067666667 °
Degrees, minutes and seconds format:
41.184041 𝐷𝑒𝑔𝑟𝑒𝑒𝑠 = 41°
𝑀𝑖𝑛𝑢𝑡𝑒𝑠 = 18′
𝑆𝑒𝑐𝑜𝑛𝑑𝑠 =
0.4041′
= 24.246′′
60
𝐷𝑒𝑔𝑟𝑒𝑒𝑠, 𝑚𝑖𝑛𝑢𝑡𝑒𝑠 𝑎𝑛𝑑 𝑠𝑒𝑐𝑜𝑛𝑑𝑠 𝑓𝑜𝑟𝑚𝑎𝑡 = 41° 18′ 24.246′′
20
Automatic Asset Tracking System
4.2. Communications
One of the most important parts of this project is the communications between the devices. Because of
high reliability that this system should present, the communication has a significant role. For this
reason all the cables should be placed in the proper way. The main signals that the system has to
manage are basically the transmitter bit (Tx), receiver bit (Rx) and common ground (GND). A very
important fact that has to be taken into account is, that the transceiver and the receiver have Tx and Rx
pins twisted to make the communication protocol possible.
For instance, to establish the connection between the GPS and the PC we use the RS-232 interface
with the purpose of making the proper settings. The transmitter modules use the same kind of interface
as well. Afterwards, the GPS and the modules are configured with the correct parameters; the
communication between these devices is made via LVTTL (Low Voltage Transistor-Transistor
Logic).
4.2.1. RS-232
This serial port is an interface for communication with the use of digital data which is sent bit by bit.
To make the link between the device and the computer a physical port is needed. It is also referred to
as COM.
Currently, this type of communication is not used much and has been replaced by the USB interface,
which is much faster. However, the serial port can still be found in industrial automation systems since
its use is simpler and cheaper, and also allows data exchange between different types of devices.
RS-232 (Recommended Standard 232) is the interface to make the communication with the devices
possible. The next figure shows the physical connector RS-232. In addition to that, the table number 5
presents the pins and corresponding signals.
5
Figure 10. DB9 Connector
The RS-232 interface is designed for short distances (up to 15 meters) as the standard for
communication speed is low (no more than 20 kilobits per second). It can work in synchronous or
asynchronous communication, and in the following channel types: simplex, half duplex or full duplex.
In a simplex channel, data is always transmitted in one direction.
5
Picture from:
http://www.hflink.com
21
Automatic Asset Tracking System
In the half duplex channel, data can travel in both directions (switching necessary, to change the
direction of transmission). In a full duplex channel, data can be transmitted in both directions
simultaneously.
Table 5. Relation between Pins and Signal
Pin
Signal
1
2
3
4
5
6
7
8
Data Carrier Detect
Received Data
Transmitted Data
Data Terminal Ready
Common Ground
Data Set Ready
Request to send
Clear to send
9
Ring Indicator
The serial port transmits and receives data through a UART (Universal Asynchronous Receiver /
Transmitter).
4.2.2. LVTTL
TTL (Low Voltage Transistor-Transistor Logic) is a simple, universal and well understood data
interface. This interface became important because it was the first time that low-cost integrated
circuits made digital techniques economically practical for tasks previously done using analog
methods. The fundamental switching action of a TTL gate is based on a multiple-emitter input
transistor.
The active operation of this input transistor removes stored charge from the output stage transistors
more rapidly than a comparable DTL gate, making TTL much faster in switching. A small amount of
current must be drawn from a TTL input to ensure proper logic levels. The total current drawn must be
within the capacities of the preceding stage, which limits the number of nodes that can be connected
(the fan out).
All standardized common TTL circuits operate when the voltage supply is 5V. If the supply (VCC) is
lower, TTL levels are no longer viable. A TTL signal is defined as "low" or L when the voltage is
between 0V and 0.8V with respect to the ground terminal, and "high" or H when between 2V and 5V.
For instance, LVTTL uses as a standard supply 3.3V. In this project the connection between the
mobile modem and GPS is made using LVTTL – LVTTL cable.6
6
http://www.rapidbridge.com/productbriefs/liqio_lvttl_pb.pdf
22
Automatic Asset Tracking System
4.3. Radio modules
The purpose of the project is to locate vehicles within a small space (less than 10km2) and to then
represent their positions on a screen thus improving overall security. To realize this and to see the
coordinates on an interface, a way to transmit this information from the spot where it is placed or runs
the track must be picked. This information is sent to a PC with the intention of monitoring the safe
landing of airplanes on the runway. To implement this system radio modules were chosen because the
other alternatives which are GPS/GPRS/GSM (Global Positioning System, General Packet Radio
Service, Global System for Mobile communications), ADS-B (Automatic Dependent SurveillanceBroadcast) and RFID (Radio-frequency identification) are too expensive. A decision has been made to
work with radio modules TinyOne Pro M868 provided by Telit RF Solution for the reason that they
have the essential characteristics required by the system: they are cheap, they use a free license
frequency band, the distance range in which they are sensitive to transmit and receive data is
significant, they are accurate and also possess some additional functions that improve the tracking
process. The information travels from the sender to the receiver through a specific channel, thus
avoiding collisions and making the communication more confident and safe.
Radio modems transmit data wirelessly, transform an analog signal to encode digital information and
also demodulate such signal to decode the transmitted information. The aim is to create a signal that
can be easily transmitted and decoded in order to reproduce the initial digital data.
Radio modems are used to create a Private Radio Network (PRN) for the Aena Company. These are
generally used in industrial applications, when real-time data communication is needed and it is
preferred to be independent from telecommunication or satellite network operators.
4.3.1. Hardware components
All the hardware components used to develop this tracking system for one airport vehicle are the
following: transmitter/receiver modems, one GPS module, connection cables and additional PCB
(printed circuit board) realized to connect the GPS to the modem. Additionally one or more node
routers can be placed at the airport to improve the covered distance range.
The classification of the chosen modems:
one fixed node: radio modem Tiny Pro M868 with IP67 (Fig.11.a ) connected to a PC
one node router: radio modem Tiny Pro B-868 (Fig.11.b) with a serial port RS232 (an
interface board + a radio module on its DIP support + an antenna)
one mobile node : radio modem Tiny Pro B-868 connected to the GPS – GT 320 RW
23
Automatic Asset Tracking System
Figure 11. Modems
Tiny Pro : a) M868, IP67 and b) B868
The fixed modem is connected to the PC through a RS-232 cable to the serial port, as shown in figure
12. Additionally, the modem receives data from the mobile device connected to the additional PCB
board with the GPS module. If it is necessary, because of distance range coverage, it can get data from
the router as well. The received data will be displayed on a graphical interface, which allows locating
the GPS module.
Figure 12. Connection between TinyOne Module and Computer
As mentioned before, the fixed modem is placed in the Technical Block Building at the T2 terminal
and the antenna is located on the rooftop of the building to improve the receiving quality and to allow
the transmission and receiving of data to be done directly.
The node router is used for instance when the distance between receiver and transmitter is too big. In
this case, the role of the router, located in a midpoint of the surveyed area, is to receive the signal from
the mobile device and to transmit it further through a specified channel to a fixed modem.
Before proceeding to more detailed explanation of the role of each device in the system, it is very
important to know the characteristics of these modems.
4.3.2. Characteristics
Two different types of modems are used to create a more complex system in addition to cover all the
set requirements. The characteristics offered by this device fulfill all the requested needs like data
transition range, frequency band, sensitivity and communication protocol. The common features will
be presented in this part of the report.
Both of the modems are powered with a power supply block of +7.5V or with a +9V battery.
24
Automatic Asset Tracking System
The distance, in an optimal environment, in which the radio modems are sensitive to receive and
transmit data is ranged between 3000 and 4000 meters. However, in zones with many infrastructural
barriers, the achieved distance is only between 200 and 300 meters which is not enough. Therefore, all
requirements for locating the modems must be strictly respected. All these limitations to the range of
the rules lead to the necessity of using an additional router or two.
The TinyOne Pro M868 radio modem with an IP67 case is a complete radio frequency solution for
tough environments and weather conditions. In the Technical Block Building, where the work
conditions are not the best the electronic parts need to be especially protected. This modem includes a
500 mW radio module with an advanced embedded firmware, as well as a reinforced hard metal
casing and a quarter wave antenna. The modem communicates with the host through a RS232- USB
cable connected to terminal blocks on the mother board.
B868 TinyOne Pro is chosen as the transmitter because this model allows having direct access to the
LV TTL and RS232 communication interface. The B868-TinyPro module, illustrated in figure 13,
consists of digital and RF parts. The tasks of these components are data coding and frequency
synthesis respectively.
Beside the interface board, there is a DIP support with an antenna available. The developing board
includes an RS-232 connector, a battery slot, a TTL level and an on-off switch. Furthermore, to
indicate the transmission of the data, the board has three LED diodes.
Figure 13. B868-TinyOne Pro
The Tiny radio module can be placed on the host boards by pick-and-place mechanism like any
integrated circuit with the following recommended parameters.
4.3.3. Functional characteristics
All the TinyPro terminals allow two types of functioning: single channel mode, which means that only
channel number one is selected, or multi channel mode, which means that at least two channels are
selected. In single channel mode the operating frequency is 869.525MHz, with an output power of
500mW. In multi channel mode the frequency is 869.4125MHz with an output power of 100mW. This
module works in temperatures between +85ºC and -40 ºC. The relative humidity for a proper
functioning of the modem varies from 20% to 75%. The sensitivity range of around 100 dB for both
functioning modes indicates a high quality. In the following table the main features are presented
which are the same for both types of modems.
25
Automatic Asset Tracking System
Table 6. Functional characteristics of TinyPro terminal
Frequency band:
869.400 - 869.650 MHz
Temperature range:
-40 ºC to +85 ºC
Relative humidity:
20% to 75%
Transmission
Single channel
Multi channel
Chanel number:
1 (869.525MHz)
10 (869.4125MHz)
Channel spacing :
wideband (ERC-Rec 70- 25 kHz (ERC-Rec 70-03)
03)
Radio bit rate :
up to 38.4 kbps
4.8 kbps
Output Power :
500mW (27dBm ± 1dB)
100mW (20dBm ± 2dB)
Reception consumption
6V-30mA, 12V - 25mA, 40 V- 20mA
Reception Sensitivity
-100dBm ± 2db
105dBm±2dB
Range:
200m
300m
3000m
4000m
In difficult environment:
In optimal environmental :
4.3.4. Transmission process
The tracking process starts when the transmitter captures data from the GPS, which is set to send a
specific message (to detect just specified parameters). The frames are addressed, checked through a
CRC, acknowledged and sent further to the receiver. Information is taken from the receiver and
processed in the developed software, where the selection of the data needed is done. After this the
coordinates are interpreted, decoded and shown on the map of the Aena airport. Therefore, all the
modems are configured.
The modules can operate under four different modes:
Transparent mode:
- the default communication protocol of the module
- data transmitting is made transparently, without encapsulation or addressing
Addressed Secured mode:
- it is used in multipoint network protocol
- each module can communicate with every other module in the same network
- the frames are addressed, checked through a CRC and acknowledged
26
Automatic Asset Tracking System
Downloader over the air:
- allows re-flashing of remote module
Auto-repeat mode:
- the module sends back the frames it has received (radio or serial) without echoing
- used for testing the module remotely
In the beginning the modems were programmed to work in transparent mode to see if they work
properly, because in this mode all the frames are transmitted transparently. This mode reproduces the
half duplex function of a RS232 serial link which means that only one device can send or receive at a
time. It allows Point to Point or Point to Multi-point transmission of data with all the modems
receiving the messages sent by any modem, as shown in figure 14.
Figure 14. Transparent mode
Every unit configured in transparent mode will receive every radio data flowing on the same
communication channel in the same frequency. In this communication mode, radio modems
automatically transmit every serial data received on their radio link, or radio data received on the serial
link.
The time between switching from reception mode to transmission mode is reduced as far as possible.
The latency time includes: the time for one character received by the modem, the carrier duration, the
time for the transmitted radio data consisting of one byte and the time to transmit one character from
the modem.
In spite of these values, no data control, neither on the serial link, nor on the radio link, is performed
by these radio modems in transparent mode. Therefore, the data control must be passed on to the
software application and, in this case, the users must adequately verify that all frames are transmitted
properly, taking into account that an interrupted transmission may lead to characters or buffer losses.
After the quality had been proven a decision was made to work in a different mode which can assure
data control. Because of this, the addressed secured mode was chosen to allow a good communication
between the modules as well. The addressed secured mode offers an optimal radio link quality given
by the multipoint access of the transparent mode in combination with the security of the secured
transparent mode. Furthermore, all modems can communicate with each other, addressing each frame
to one of them. This mode can handle 255 up to 65535 clients.
27
Automatic Asset Tracking System
Compared to the transparent mode, which addresses each data frame to a specific modem, the
addressed secured mode includes some additional features, such as:
Fully verified data transmissions
The modem works similar to the transparent mode, but differs by adding frame encapsulation
Identifying clients with a specific number added to each data frame
The receiver recognizes the transmitting modem by the first number of the data frame
The possibility to add one frame ending character is given. The addition of Carrier Return
<CR>, after each received frame is distinguishing.
Data frames can easily be transmitted simultaneously from one modem to any other modem in
the same network.
The secured algorithm of address secured mode is: if nothing is received after a delay equivalent to 3
serial time-outs after the flow control signal activation, the following frame will be considered as
going to a new modem. If something is received during this delay, it will be considered as going to the
same unit. This way, a long frame can be sent and will be split by the flow control.
Each of the radio modems are set to operate in addressed secured mode, because all the frames are
addressed, checked and acknowledged through a CRC (cyclic redundancy check). In this operation
mode the TinyOne Pro modules can communicate only if they are all part of the same „network‟. This
means, it is necessary to set the same network ID. However, it is essential to set different client
numbers as transmission addresses in order to indicate the default address to which every radio frame
will be sent. This is described in figure 5.
For both communication protocols, Transparent and Addressed Secured Mode, the LBT (Listen
Before Talk) function is available. If this function is activated, before sending data the transmitting
modem will scan the radio link and verify that it is available (no radio activity). This is done to avoid
collision.
Figure 15. Adressed Secured Mode
These modems are operating in the 869.4 – 869.65 ISM (International Science and Medical) frequency
band, with some limitations. Most of these restrictions are integrated in the conception of the module,
except for the duty cycle. The 869.400 to 869.650 MHz band is limited to a 10% duty cycle. This
means that each module is limited to a total transmission time of 6 minutes per hour.
28
Automatic Asset Tracking System
4.3.5. Tiny Tools
For each modem used in the system certain changes to the parameters and registers were made. These
changes are made by the Tiny Tools software and are depending on the function of each radio module
in the tracking process. The Tiny Tools software, provided by One RF Technology, allows
programming of Tiny PRO Modules by a PC. In figure 16, the Tiny Tools software interface is
presented.7
Figure 16. Tiny Tools v.1.00W Software
When Tiny Tools software is launched, a window appears which allows the configuration of the serial
port. It is a straightforward process and the user can rapidly choose which Com-port, Speed, Parity and
Number of Stop bits to use.
After the configuration part is finished, the detection of the modem will be started. If the link between
the modem and the software program is made and the module characteristics are shown at the bottom
of the software page, then the “Go to Tiny Tools” button can be selected and further configuration of
the modem are allowed.
4.3.6. Settings
To receive GPRMC (Recommended Minimum Specific Data) frames properly from the GPS 320RW,
the radio modems and their registers were configured in order to enable communication between them.
To configure the Tiny Pro modules, the registers were set with the Tiny Tools program. This
configuration allows access to the register by AT or Hayes commands to modify each register. A data
frame always begins with the two ASCII „AT‟ characters, standing for „Attention‟. For example, to
change the value of a register the following command is used: ATSn = m, where n is the registration
number in the value that is given. Once the register is changed by running the command AT / S, status
of all relevant registers, the new values of all registers can be seen.
7
2010. Manual TinyTools_v1.1.
29
Automatic Asset Tracking System
In the configuration module, a click on „+++‟ establishes the communication with the device. If this
link is set up, the radio module will answer „OK‟; otherwise the communication has failed and an error
message will be received. When the configuration is finished, the command „ATO‟ will reset the radio
module into functional mode. The „ATO‟ command also gives an instant access to the modems
operating mode, configured in the S220 register.
In the following table, a short description of the most important registers used to make the ideal
communication between radio modems, is presented.
Table 7. Register description
Register
Description
S200
Sets the radio channel or frequency used for communication
S201
Selects the transmission speed or baud rate
S202
Allows choosing the maximum output power or consumption of the module
S204
Sets the duration (in milliseconds) of the radio carrier sent before the data
S206
Chooses the mode of operation, single channel or multichannel
S210
Selects speed connection through the serial port
S212
Sets the format and parity of characters sent by the serial port
S213
Defines number of stop bits: 1 bit or 2 bits
S214
Timeout transmission of serial data. This indicator decides when the data frame is
finished. If nothing is received for a time equal to this timeout, the frame is finished
S216
This register works with the buffer size register S218, which sets the limit to activate
the flow Control
S220
This is the most significant register. It selects the operation mode of radio modems
S223
It represents the number of times a message will be repeated in case of non
acknowledgement, or the number of times the modem will try to send the message in
case that the radio link is not free
S226
Allows you to enable and configure the functionality of LBT . The LBT sensitivity
refers to the detection on the RF level over which the RF link is considered as occupied
S227
Activates a random waiting time before each radio transmission
S240
Activation of the stand-by mode designed for low power consumption of the radio
modem
S250
Resembles ID of the network. There can be up to 65535 networks defined, but only
one can work in a given area in each radio channel.
S252
The user can configure a custom number between 1 and 65535. Client numbers must
all be different within the same network
S256
If this register is different from zero, the frames received by the serial connection will
be sent to this address without any header detection done
30
Automatic Asset Tracking System
All the devices, modems as well as routers, are configured with the same appropriate values. After
both of the communication protocols were tested, the configurations for the application remained as
followed:
A single channel mode at a frequency of 869.525MHz, which means that the first mentioned
register is automatically set to „10‟
The radio baud rate is 38.4 kbps for all the modems; because it works in single channel mode
and allows a low power consumption value of 500mW.
To obtain broadcasting time and smaller power consumption the duration of a radio carrier
given has a value of 5ms.
For all the modems the speed rate was set to be the same as the GPS, 4800 bps.. The format has been
set without parity, which equals a value of „1‟. The serial timeout value is 3 ms, which is according to
the serial baud rate. A choice to not have a flow control on the serial link was made in order to prevent
the buffer from overflowing. Furthermore, the host must manage its outgoing data frames and activate
the LBT function in case of high sensitivity.
The number of repetition has to be kept as low as possible to ensure that the system works in real time.
In this case the value has been set to two, which is the number of times the message will be repeated in
case of non acknowledgement. Two is also the number of times the modem will try to send the
message in case of an unavailable radio link (when LBT functionality is activated).
M868/ B868-TinyPRO modems can communicate in addressed secured mode only if they are a part of
the same network. Therefore, the ID network, given by 252 register, is set to be the same for all
devices. Although there can be up to 65535 defined networks only one can work in a certain area of
each radio channel. Even though the client numbers can vary between 1 and 65535, it has to be unique
for the receiver and transmitter. The number for the system‟s mobile modem was set to 10 and for the
fixed one to 20.
For displaying the sender address, the register S255 is set to the default parameters, which in
conclusion means that each of the bits has the appropriate value. The S256 register sets the address
where the frames are being sent. Table 8 represents the values of the registers used to configure the
radio modems.
31
Automatic Asset Tracking System
Table 8. Configuration of the radio modems
Registers
Fixed
Node
Mobile
Modem
Router
Modem
S200
10
10
10
S201
3
3
3
S202
2
2
2
S204
8
8
8
S206
0
0
0
S209
0
0
0
S210
3
3
3
S212
1
1
1
S213
1
1
1
S214
5
5
5
S215
0
0
0
S216
2
2
2
S220
9
9
9
S223
2
2
2
S226
1
1
1
S227
1
1
1
S240
0
0
0
S250
0
0
0
S252
20
X
10
S255
80
80
80
S256
10
X
20
As it can be seen in the table above, the last three registers are configured with different values. This is
done because one modem is transmitting and one is receiving. The S252 register shows the assigned
client number and the register S256 indicates which modem is sending the frames. The router can
receive data from different modems as well as transmit it further to several other devices. Therefore,
the router settings are based on how many clients are used in the network.
32
Automatic Asset Tracking System
During the field tests the hardware was configured like:
Figure 17. Register configuration
This figure shows how the GPS is transmitting the coordinates of the vehicle to the mobile node,
which has the client number 10. It is set to transmit this information further to the address 20,
representing the client number of the system‟s router. The router sends the data to the fixed modem,
which has been assigned the address 30. Furthermore, the fixed modem sends the data through a
RS232-USB convertor cable to the software application. This is processing all the data and displaying
it on the user interface.
33
Automatic Asset Tracking System
4.4. Mounting
The quality and range of our system will increase if the device is mounted high, and free of and
reflective materials. Therefore, it would be best to install the system on the roof of the monitored
vehicles. In order to do this, we need a solution that can withstand the forces attacking a driving car in
addition to emerging forces of gravity. This means the mounting device must hold at least 5 kilograms.
With the purpose of achieving this goal and also providing a smooth mounting and demounting
method, several ways were taken into consideration. However, most of them would be permanently on
the car such as tape, screws or glue. In the end a decision had to be made between two solutions.
4.4.1. Suction Cup
The first solution is a suction cup. This device can easily be removed from the car once applied as well
as mounted on any other car just as soon. Furthermore, the M6 thread provides a solid way to combine
the device with the suction cup. The downside of this solution is that the surface has to be clean and
even when mounting the device. Also the suction could decrease over a longer time period, which
could lead into a loss of the box.
8
Figure 18. Suction cup
4.4.2. Magnetic System
The second and most promising solution is a magnetic system. The magnet it equipped with a safety
rubber around it to ensure no scratching on the vehicles surface. In addition to that, it also contains a
M6 thread to provide a solid connection to the box. Even though this solution is slightly more
expensive than the suction cup it provides a safer and cleaner way of mounting and demounting the
device.
Figure 19. Magnetic system
8
9
www.saugnaepfe-online.de
www.magnet-shop.net
34
9
Automatic Asset Tracking System
Chapter 5. Software Development
Although, there was a rather strict division of tasks within the team, since different people were
responsible for the implementation of software while others were mainly focusing on the hardware
development, the final success could only be achieved by cooperation of these subgroups. Therefore, it
is not possible to say that any of these parts were more important than another one. Moreover, both of
them were crucial elements of the project and depend on each other. In the following chapter the
explanation of the software part will be done.
The main task of the software used in the project is to gather all the information received by the
devices. The data is to be presented in an application that allows the user to interact with the program.
In addition to that, the software will log every event in order to offer help in case of an emergency
situation at the airport. That means that the information in the log files has to be in a readable form in
order offer the user the function to check for possible errors made by the system.
Since there is a lot of information being managed at the same time, the program needs to be as fast as
possible with the purpose of avoiding unnecessary delays that could cause the program to be
misinterpreted by the user. Additionally, the application itself needs to be somewhat user friendly
making it easy to configure and utilize it even while being run.
Bearing the requirements of the software in mind, a decision was made to split it into two independent
programs which work simultaneously and interact with one another. The first program handles the
receiving of the data and takes care of creating the additional files needed, such as the logs.
Meanwhile the other program takes care of the interaction with the user and makes sure that all the
data is displayed properly. Since all the conversions are mainly being done by the first mentioned
program, the workload of the program that handles the displaying of the data will be significantly less.
A decision was made to use only open-source solutions in order to lower the costs as much as
possible. The fact that open-source software is being used will make the future modifications a lot
more trouble-free and provides the possibility to use the software in any way needed. Apart from that,
there are already numerous examples available to use freely for programming.
The final crucial thing to mention is that the operating system under which the new programs have to
run has to be one of the Linux distributions. The reason for that is the speed and versatility of the
system. When run under Windows, some image flickering is clearly visible when the application is
refreshing the map. This issue does not occur under Linux. The distribution that was chosen is the
latest version of Ubuntu – 11.04. This system is very user friendly and fully fits the needs of the
project.
35
Automatic Asset Tracking System
5.1. Programming environment
With the intention of realizing the project in a modern way, research was carried out in order to choose
a proper programming environment. Choosing between different languages relevant for the system, a
decision was finally made to use the Python language. This is mainly due to its open source structure
that will contribute to lower the total costs of the project, but also because of its flexibility that will
make the program run smoother
5.1.1. Python
Python is an open source programming language that was developed in the end of the 1980‟s. Since its
release, the language has developed into a powerful, and at the same time easy to use, language that
supports several programming styles: structured, object oriented and functional programming.
Therefore, the user is not restricted to just one style and can feel more independent while creating a
program. A distinctive characteristic of the programming language is its clean coding structure, as it
uses indentations instead of braces to divide the code into sections. Furthermore, it does not use semicolons to state the end of each line. Additionally, Python is a version-dependent programming
language and at the moment there are two versions that are being used: 2.x and 3.x. These versions are
not fully compatible with each other. Nonetheless, new packages are being developed for Python
constantly. By installing one of these modules the language‟s potential and capabilities in the form of
new classes and functions will be extended. In the end version 2.7 was chosen because, compared to
the 3.x versions, it has got greater compatibility with additional components.
5.1.2. wxPython
The most vital extension module that is being used is wxPython. It is a wrapper, which allows the user
to create a graphical user interface (GUI) more effortlessly compared to using the native Python
interface called Tkinter. The task of wxPython is to import wxWidgets (a library written in C++) into
the programming language making additional components, for creating GUIs, available for the
programmer. With similarity to Python, wxPython is also an open source module and made in a
similar sense of simplicity.
This extension module is being used in order to create a window, which will be used to show the map
with the vehicles depicted within it. Therefore, it plays a huge role in the interpretation of the
application. Besides that, this extension is being used to offer the user the possibility to interact with
the application more naturally.
5.1.3. pySerial
Another important Python extension used in the development of the software is pySerial. It is a library
which provides support for serial connections over a wide range of different devices: Bluetooth
dongles, infra-red ports, universal serial ports and RS-232 ports.
It is mainly used for accessing the serial port and allows the data to be read directly in Python. The
RF-receiver is connected to the computer via an RS-232-to-USB adapter serial port and the received
coordinates can easily be gathered and operated on by using pySerial.
36
Automatic Asset Tracking System
5.2. Receiving data
The data received through the universal serial port is in a rather complex form before being dealt with
by the software. It contains not only the GPS coordinates, which is the most important part of the data,
but also some other information. This information needs to be filtered by selecting only the parts of
information that store information needed to display the data properly. Once a connection between the
RF-sender and the receiver has been established, the system is capable of receiving the information.
The recognition of what parts are needed is being done in a fully automatically way.
The part of the software that handles the reception of the data will utilize two text files to store the
needed data. One of those is meant to be read by the users and the other is including the data needed in
the printing process.
5.2.1. The receiving process
When the data created by the GPS is sent through the radio frequency devices, some unwanted data
will also occur. This unwanted information appears as a result of the protocols used when sending the
data. Unwanted parts are being discarded by using a function that recognizes what valuable lines of
information look alike. Afterwards, each piece of information has to be taken care of separately in
order to define all the different values, e.g. speed, course and checksum. The whole process has to be
done with assurance that no important part of the information is going to be lost.
Furthermore, it is very crucial for the accuracy of the vehicles positioning that the software can check
if the frame received is corrupted or not. Each frame is followed by a checksum in hexadecimal form.
It is calculated as an exclusive-OR function of all elements within the particular frame. To be able to
check its correctness, a function that is reviewing all the checksums of the received frames, has been
created. This function calculates the checksum of the specified frame on its own and compares it with
the received one (computed and sent by the GPS). If the outcome of the comparison between the two
checksums is different, the software will make a notification in the log file to inform the user about the
corrupted data.
37
Automatic Asset Tracking System
Figure 20. The console showing a corrupted frame
Neither the data that fails the checksum test nor the one that is inappropriate for the program is being
recorded in the log files and only data that fulfills all the criteria will be passed on for further
functions. This is a measure taken to facilitate the workload of the program, even though the original
data is always logged in its raw form for administration purposes.
5.2.2. Creation of log files and data files
Once the discarding of all the unnecessary data and the identification process are done, the vital data is
saved in a log file with the purpose of making it easier for the user to check for possible faults done by
the program. The user can, for example, check all the positioning data, timestamps and checksums if
he or she suspects that there has been an error in the displaying process. For this reason, all the data is
presented in such form that it will be easy to read and identify what the different numbers represent. It
will also be easy to localize corrupt data since the program will make a notification in the log file.
Additionally to the log files, the software simultaneously creates a separate data file including only the
pixel coordinates created from the longitude and latitude information of each frame received, as well.
This is simply done with the intention of separating files meant to be read by the users by the files that
have an actual purpose for the program. A separate data file is created for each vehicle and new
coordinates are recorded into the file as soon as new positioning information is being received. The
form of the data stored in the files is width and height in pixels. The reason of this format is to make
the process faster when it is time to print the position of the vehicles. Because of that, a function
transforming the longitude to width in pixels and latitude to height in pixels is being activated as soon
as it is time for the program to make a new entry in the data file.
38
Automatic Asset Tracking System
Figure 21. Log file in which checksum errors have occurred
Now, since the data is already received in an easy to manage form and ready to be displayed, the
second part of the software has to take care of it. This must happen in real time, i.e. as soon as new
data is written to the file, it is being interpreted and printed. In fact, it is a separate program which
presents the data for the user in such a form that it is as easily understandable as possible. This is
achieved by using the already divided files for each asset (one file per vehicle). Each second the
program is being updated, checking all the data files for new information. If a new position is located
the program is refreshed using the new data.
5.2.3. Reading files
Files, which are required for the printing process to work, are the data files (the ones with just the
pixel coordinates). A method, which searches the specified directory to find all the .txt files and writes
their paths into a list is not only being executed with the start of the program, but also with every
iteration of the program, so that if new file (new vehicle) appears while the program is already
running; it is immediately taken into account and becomes visible on the map. When found, each file
is assigned a number, which later allows the recognition of the vehicles‟ representations on the map.
This feature will be described in more detail in the following section. After that, the initial coordinates
of each objects (1,1) are put into another list. With every iteration of the program (i.e. every second),
the newest coordinates (in the form of a line) from each file are being read and compared to those read
in the previous step. If they are the same, nothing happens, but if they differ, they are replaced by the
newly read ones. The total number of refreshing cycles is being counted and displayed within the
toolbar at the bottom of the screen. As a result it is easy to check how much time has passed since the
program had been launched and what the exact amount of updates is.
39
Automatic Asset Tracking System
For safety reasons and to guarantee longer faultless uptime, the part responsible for reading the files is
handled by a separate thread. Threading is particularly useful in applications with their own graphical
user interfaces to take care of long-lasting processes running in the background. This approach ensures
that the action taking place in the background is not interrupted by user interactions.
5.2.4. The printing process
The next step is to use the coordinates in order to create a list of Icon class objects. This class gathers
all the basic properties of the icons (representing the vehicles) to be drawn within the window: the
current scale, recent position on the map and the number assigned after the corresponding file has been
found. Whenever a vehicle changes its position, the coordinates of the corresponding icon are being
superseded. The final part of each iteration of the printing process is to redraw the map of the airport
and the vehicles representations on top of it. Additionally, each of the objects marked on top of the
map has its own label in the form of the letter V followed by an appropriate number which allows the
vehicle to be identified at once. The update event of the window takes place once per second. This
frequency has been chosen based on the knowledge that new GPS data will be received with a
regularity of one second. The map, with a few vehicles marked, can be seen on figure 22.
Figure 22. The program displaying the positions of the vehicles
40
Automatic Asset Tracking System
5.3. Graphical user interface
Since the basic aim of the project is to develop a system which is able to monitor and, what is most
vital, display the movements of vehicles in the airport area, a very important aspect of the application
is to make it as user-friendly as possible, while maintaining full functionality. Therefore, adjusting the
interface to the users‟ needs was a big challenge. The appearance of the application is not entirely
ready yet. Nevertheless, the following chapter is meant to describe its current functionality.
When the program is launched, the initial window looks as depicted in figure 22. The most crucial and
largest part of the window is a map of the airport located in the central part. To help understand what
is going on, a status bar is situated in the bottom part of the application. A menu bar can be found at
the top of the interface.
5.3.1. Status bar
Located at the bottom of the window, the status bar is divided into three sections horizontally, as it can
be seen in figure 22. The one found to the left is mainly responsible for display additional informative
statements to the user. When the program is launched, the initial text represents a concise message
from the authors. Additionally, when any of the menu options is hovered over, a short message is
shown, explaining briefly what the highlighted option does. The middle section is assigned for more
important messages, like displaying the number and time of the latest update, and the information
about which menu option has been selected. Finally, the last segment of the status bar is meant for
displaying additional urgent messages.
5.3.2. Menu bar
Situated at the top part of the window, the menu bar is split into three separate menus, named File,
Track and Help. The File menu consists of two options: Choose what files to read and Quit. At this
moment, the first option is not implemented yet. Its task is to make it possible for the user to choose
some already recorded data files to display the vehicles‟ route. This should be done faster than the real
time displaying (one update per second). The quit option causes an additional window to appear which
gives the user the possibility to confirm whether to close the application or not.
Figure 23. The File menu
41
Automatic Asset Tracking System
The Track menu is composed of three options, as seen in figure 23. These options are: Draw a
simulated track, Display live tracks and Stop displaying live tracks. The first option was created with
the purpose of testing the program. It was mainly used at the time when the part responsible for
reading the data from the port had not been ready. After selecting this option, as the name clearly
states, the user is given the opportunity to draw an artificial route of an imaginary vehicle. The path is
being sketched with a red color while keeping the left mouse button pressed. The program records the
trail in the same form as if it was received via the universal serial port, i.e. using pixel coordinates.
When the route is ready, the user has to double click the left mouse button within the area of the map
and a new window will appear. Then the possibility to type in the filename and save the route as a file
with .txt extension is given. After saving the file, it will be recognized as a file created in the ordinary
manner. The user can afterwards use this file to check whether the movement is displayed properly by
using the following menu option. The second option is in fact used to start the primary feature of the
application. After choosing this option the program starts to present the current positions of the
vehicles. As the structure of both, the artificially made files and the files created by the received data,
are similar, the program will print all routes simultaneously. Details of how it is done are explained
more deeply in the section 5.2.4. (Printing process). The final option allows the user to stop displaying
the tracks without closing the application itself. Therefore, after pausing the application, when the
Display live tracks button is pressed again, the program will continue instantly from the point it was
interrupted in.
Figure 24. The Track menu
The third menu section, Help, is created to offer the user different kinds of assistance. The menu
options are Show user manual and About. If the first menu option is selected a user guide is opened.
This guide should cover all the basic functions of the program and instructions on how to use them. If
one has any doubts of how to do a specific task, the answer will be found in the guide. Finally, the
About option was created in order to present the software‟s developers and contact information of the
people responsible for the development.
42
Automatic Asset Tracking System
Figure 25. The Help menu
5.3.3. Zoom function
The program has an integrated zoom function so that each user has the opportunity to show the map in
a bigger scale. Not only will this make small details clearer, but also minor movements of the vehicles
will be easier to notice. The function works even when the application is running. By clicking the right
mouse button anywhere inside the map, the area will enlarge. After the zooming, depending on where
the button is pressed, that place will be the new center to make it as instinctive as possible. There are
two magnifying steps: the map size can be twice and three times as big as the initial size. The feature
is realized by replacing the original map with a larger one as soon as the button is clicked. Since the
resized maps do not fit inside the main window entirely, scrollbars appear in order to be able to view
the whole area.
Figure 26. Initiating the program
43
Automatic Asset Tracking System
Chapter 6. Economic Evaluation
This chapter will show in detail what costs are involved in order to develop and install such a system
in an airport. This will involve the costs of the engineers and software designers as well as the cost for
assembling such a device. Furthermore, the prices of every material used in the device will be stated
and added up to show the cost of one unit. In the end, our system will be compared to a valid existing
solution.
6.1. Development
In order to develop an Automatic Asset Tracking System, a lot of different specialists/engineers and
coordinators are needed. This means, that we need at least 2 technical engineers, 2 software designers,
1 person from the marketing and research department and a supervisor to coordinate everything.
Therefore, the chart below shows the hours one engineer or software designer would need to develop
such a system .The price per hour is not the actual hourly earnings of an engineer, but how much his
work is worth if he would do something else.
10
Table 9. Costs for human resources
Field/Department
Working Hours
Cost per
Hour
Overall Costs
Technical Engineer
400
55 €
22.000 €
Software Designer
400
55 €
22.000 €
Research/Marketing
200
55 €
11.000 €
Supervisor/Management
50
75 €
3.750 €
6.2. Implementation
The actual implementation consists of assembling the devices and then installing them on each car and
the receiver in a tower or any other location where it could operate most efficiently. This work can be
done by normal technical assistants, which do not cost as much as specialist in their fields. However,
the costs and time involved has to be taken into consideration. Therefore, the next chart shows the
time and cost to assemble the devices and, on the other hand, the installment costs to provide 1000
vehicles with this system.
10
The cost per hour are taken from Xarxa inalámbrica a la Banda ISM per a la monitorització d’un dispositiu
GPS, 2009- Bachelor Project
44
Automatic Asset Tracking System
Table 10. Costs for assembling and installation
Field/Department
Working Hours
Cost per
Hour
Overall Costs
Technical
Assistant/Assembling
1000
40 €
40.000 €
Technical
Assistant/Installation
500
40 €
20.000 €
The Assembling of the device is predicted to take 1 hour in total, which will make a total of 1000
working hours. The installation of the devices onto the cars, however, should be done in
approximately a half hour summing up to 500 working hours.
6.3. Materials
The following table lists all materials involved in a whole prototype system. In addition to that, it also
presents the cost for each of those materials and the number of those needed. In the end, the prices are
being cumulated to determine the overall price per Unit.
Table 11. Material costs
Material
Price in €
Units
Overall Price in €
GPS 320R
M868-tiny-plus with IP67
case
45,00
239,70
1,00
1,00
48,95
239,70
Tiny One Pro Demo Kit B868
with two modules
437,00
1,00
437,00
USB to RS232 Adapter
RS232- DB9
Printed Circuit Board for the
GPS
24,95
2,00
15,00
1,00
3,00
1,00
24,95
6,00
15,00
Supply Block
Magnet
Li-Ion Battery Varta
9 V Battery Duracell
Box
Cumulated Price
23,00
7,80
23,00
5,00
22,90
3,00
1,00
1,00
1,00
3,00
69,00
7,80
23,00
5,00
68,70
945,10
45
Automatic Asset Tracking System
The cumulated price represents the cost for one prototype package including a receiver, a transceiver
and a node router. However, to give a better understanding for the calculations below the prices for
each devise are as followed:
The transmitting device is composed of the GPS, the M868-tiny-plus with a IP67 case, a RS232-DB9
plug, the printed circuit Board for the GPS, a supply block, a magnet, a LI-Ion Battery, a 9v Battery
and a box, which have a combined price of 387,35€.
The receiver, on the other hand, is composed of a Tiny One Pro Demo Kit B868 with two modules, a
USB to RS232 Adapter, a RS232-DB9 plug, a supply block and a box, which has a value of 509,85€.
The node router consists of one of the two modules from the receiver (no additional costs), a supply
block a RS232-DB9 plug and a box, summing up to a price of 47,90€.
Taking into consideration that we only need one receiver and one node router, the major cost factor, as
seen in table 12, will be the transmitter, because the network consists of 1000 vehicles which have to
be tracked.
Table 12. Material costs for the entire airport
Device
Price
Units
Overall Price
Receiver
Transmitter
Node Router
509,85 €
387,35 €
47,90 €
1
1000
1
509,85 €
387.350 €
47,90 €
6.4. Cost-effectiveness
As a result of all the factors mentioned above, the development, implementation and the materials will
cost a lot of money in the beginning. However, from a long term point of view, this will be a profitable
investment as the comparison with a GPS/GPRS solution shows.
Overall Costs for the new system:
Development Costs:
58.750€
Implementation Costs: 60.000€
Material Costs:
387.907,75€
Receiver:
509,85€
Transmitter:
387.350€
Node Router:
47,90€
Overall Costs:
447.966,50€
46
Automatic Asset Tracking System
Overall Costs for a GPS/GPRS system:
0€
Development Costs:
Implementation Costs: 20.000€
100.000€
Material Cost:
10.000€
Monthly Fee:
120.000€ + 10.000€ per month
Overall Costs:
As one can see, the GPS solution is much cheaper in a short- term point of view due to the fact that the
system already exists, thus having no development costs, as well as the fact that a wide range of
products is available, which reduces the price immensely. However, in a long-term analysis the GPS
system will cost 10.000€ per month for as long as it exists. Therefore, the new system will become
profitable after 3 Years.
This development is shown in the table and graph displayed below:
Table 13. Cumulated costs
Cumulated Price New
System
447.966,50 €
447.966,50 €
447.966,50 €
447.966,50 €
447.966,50 €
447.966,50 €
Tabla
1Year
1
2
3
4
5
6
Cumulated Price GPS/GPRS System
120.000 €
240.000 €
360.000 €
480.000 €
600.000 €
720.000 €
800000
700000
600000
Year
500000
400000
Cumulated Price New System
300000
Cumulated Price GPS/GPRS
System
200000
100000
0
1
2
3
4
5
6
Figure 27. Comparison of long term costs of the two systems
47
Automatic Asset Tracking System
Chapter 7. Field Tests
This chapter will guide through every gained experience with the new system, while testing it. In the
beginning of the project every hardware or software solution was only made on a theoretical basis.
However, to present the system to the airport officials a practical test was absolutely necessary.
However, one test was not enough which lead to many more experiments in the laboratory of the
university at first. Nonetheless, during the later stages of the development, the tests had to take place
in the actual working environment to gain valid information from the results and learn about problems
that could only occur in this particular area.
Each time a newer version of system was available, tests were performed to try the new features that
had been implemented. If any mistakes or defects were discover they were dealt with at once to
improve the overall experience. After that, the tests were repeated to check if any new problems arose.
During the entire development process the whole improving-testing procedure was absolutely crucial
in order to pinpoint where the weaknesses of the system were. One of the main issues discovered
during the lab tests was that it appeared that the GPS unit needs some time to warm up. As a result,
after turning on the GPS, during first few minutes it is constantly receiving the same data even though
the unit is moving. It occurs due to the fact that the GPS unit needs some time to establish the
connection with the satellites.
After three months of working in the laboratory, the team was given the opportunity to go to
Barcelona Airport itself to perform some actual field tests. During the first introductory meeting it was
decided that a provisional antenna needed to be installed somewhere within the area of the airport in
order to try the system in its full potential. The decision was made to place it on the roof of the
Technical Block located near the Terminal 2. Due to that reason, a testing area was dedicated to the
project team inside the Technical Block building, to be able to use the received signal with ease. The
group visited the airport on three different occasions.
During the first visit the main focus was placed on getting the software to work under the required
conditions. As soon as the system was assembled, the group suffered a minor setback in the form of
compatibility issue, concerning the operating systems on the personal computers. It appeared that the
application did not work under Linux distribution Ubuntu 11.04 as it was supposed to. However, the
problem was narrowed down moderately fast to be caused by not being able to access the universal
serial port in the same manner as it was under Windows. The solution was merely a matter of
knowledge and consequently solved after doing some research. That is, after realizing that the COM
ports are not named the same way under Linux as they are under Microsoft‟s operating system.
Therefore, only some parameters had to be changed. The second problem that emerged was caused by
passing wrong arguments to one of the functions responsible for translating latitude and longitude into
pixel coordinates. The outcome was that the coordinates did not appear in the proper position. It was
resolved relatively quickly as well after doing some debugging. To sum up the first day, the system
was adapted to the circumstances of the airport and ready to be used in conditions similar to the real
ones.
48
Automatic Asset Tracking System
On the second day of field tests the time had come to test the GPS device more intensively. This was
achieved by walking around the airport area and thereby gathering data and checking for possible
errors. During these tests it was noticed that a huge amount of disturbances was present in the area,
which is supposed to be covered by the system. After some consulting with the airport personnel it
became clear that it was in fact a commonly occurring problem in the airport‟s communication.
Another problem regarding the quality of the received signal was that there is a huge amount of metal
elements present throughout the airport area. These disturbances caused a decreased signal strength
and in some cases even a complete loss of the signal. One of the possible solutions for this problem is
to install an additional router, which will collect the signal from the GPS and resend it to the fixed
antenna. Implementing this device makes it possible to double the distance range. Nevertheless, the
tests were reasonably profitable for the development of the system.
The third and last day of field tests continued in the same manner as the previous one. That day the
project team was also given access to a car, which allowed a wider test radius and also the possibility
to test the device‟s signal strength within the zone where airplanes are present. Two members of the
team were situated in the car, together with a set composed of a GPS unit and a transmitter. The rest of
the team was monitoring the receiver on a PC and ensuring the proper performance of the system. The
communication between these two parts of the team was established by walkie-talkies. The car was
driven to areas on the airport further away and closer to the location of the antenna. The strength of the
signal differed from place to place. The inspected range of reception is marked on figure 28.
Figure 28. Coverage area at the Airport of Barcelona
49
Automatic Asset Tracking System
The covered area, as displayed in the picture above, is not homogeneous. This is due to the fact that in
numerous locations within the area of the airport the signal encountered some interference with other
communication systems already present in the facilities of the airfield. Another reason that could
affect the reception of the signal is that the location of the antenna was not yet the appropriate one. In
case of the actual system implementation, the aerial would be installed in a more suitable and higher
spot. Finally, there was a huge amount of buildings and metal constructions in the region where the
tests were performed which also caused the signal to weaken. Making a reference to figure 28, the
green area represents the zone where the strength of the signal is guaranteed, could be received and
read without any problems. This range was approximately one kilometer and two hundred meters.
Based on the results of the field tests‟, the green striped area represents the zone where the system is
supposed to operate without any significant interference. However, this has not been tested due to a
lack of permission to enter the area surrounding the landing strip. The purple color corresponds to the
region where the system ought to work properly, but could be affected by some external factors. That
area has been tested, but the results were not satisfying because some major signal interruptions were
detected.
The results obtained during the different field tests confirmed much of our earlier calculations and
concerns. Even though some parts of the system did not perform as well as predicted, the results gave
directions to new ideas and knowledge. The guaranteed operating distance had been discovered and
the positioning error is estimated to be not more than 5 meters. This distance was measured without
any major obstacles weakening the signal strength.
In the last two tests besides the transmitter, which includes a GPS 320R, another GPS, GARMIN
60Cx, was used to ensure that our device send the data correctly as well as to observe the appeared
errors in the transmitting process and to check if the system is accurate enough.
This Garmin GPS uses the same protocol messages, NMEA 0183, as the new system. This GPS has
the update rate of 1/second and the accuracy of the position of the vehicle is less than 10 meters. These
two devices have been used to confirm the accuracy of one another during the testing between
terminal T1 and terminal T2. The outcome was very satisfying. For example, the coordinates shown
below were received by the Garmin GPS while testing the accuracy.
N (north) 41º 18.238
E (east)
2º 04.923
For the GPS 320 we received almost the same coordinates, only with a difference in the last number of
the frame which means that the accuracy is within 10 meters for both devices. Therefore, the accuracy
for our GPS alone is ± 5 meters of the actual position.
50
Automatic Asset Tracking System
Chapter 8. Future Improvements
This chapter explains what kind of improvements could still be done in order to enhance the
performance of the system. There are several aspects and features which could be added not only in
the hardware part, but also in the software development. In addition to that, a SWOT analysis had been
made.
8.1. Software
Even though the software has been designed and tested, it cannot be said that it is completely
finalized. The greatest importance was attached to creating a whole functionality of the most crucial
parts of the software. Therefore, the graphical user interface is not yet entirely finished. Nevertheless,
in the shape as it is in now, it can safely be implemented in the new system and the airport network. In
this section some improvements and changes, which could significantly enhance the user-application
interaction, are being proposed. Examples of what could still be done are as followed:
Implement a terminal within the main window of the application to be able to keep an eye on
all the events in just one window.
Display a list of all the observed devices with the possibility to choose which ones to show.
Add additional data to be viewed, e.g. the current speed of the vehicle and its direction.
Include warning sounds when corrupted data is received.
Replace the currently used map with one of higher resolution to be able to zoom in more.
Implement the possibility to grab the map and move it in the desired direction for more
intuitiveness than using scrollbars
Make the menu options, which are not implemented yet, available, i.e. Choose what files to
read and Show user manual, as described in the section 5.3.2.
Until this point, the focus has been put in getting only one device to work properly. Since the main
task of the system is to monitor several vehicles at once, the implementation of the identification
utility still has to be done. In order to do that, not only have some additional functions to be created,
but also some changes have to be done on the hardware side. When it comes to the hardware part,
additional frames containing the identification number of the device have to be included in the
messages sent. After this is done, the next step is to implement functions to recognize the
identification numbers and based on what the outcome is, a different file will be appended. Since the
software already detects all the activity on the serial port, it will be a rather straightforward process.
8.2. Hardware
It can be said that the hardware part is already finished, but some improvements can still be added.
Until now, as it was already mentioned, just one prototype has been implemented. For this reason, the
network has not yet been tested with more than one connected transmitter.
51
Automatic Asset Tracking System
Taking that into account, some futures improvements which can be made are:
The receiver‟s antenna can be placed in the control tower of the airport instead of the
Technical Block Building. This way the antenna is located as high as possible, which leads to
an avoidance of interference and an enlargement of the overall coverage.
Other tests are necessary to see which communication mode is the most proper one for the
entire network.
The functionality of the router must be tested at the airport field.
To improve the detection coverage of the signal between Terminal 1 and Terminal 2, it is
advisable to use more than one router.
To increase the accuracy of the vehicles‟ position, the actual GPS320R can be switched to a
superior one.
The power supply of the mobile case can be done by a car charger instead of batteries.
8.3. SWOT Analysis
In order to make our system a valid alternative, in comparison to other solutions, some actions have to
be done and some points taken in to consideration. If the suggestions stated in the table below are
followed, the new system has the potential to be a competitive system in the Automatic Asset
Tracking Systems market.
Table 14. SWOT Analysis
SWOT
Analysis
Strength
Weakness
Reduction of development
Eliminate any outside
costs and increased range
Opportunity
interference to make it a
can make one of the best
solid and consistent system
system on the market
Threat
Improve the user interface
and fluent system flow with
the improvement of the
software
52
Implementation of node
router and more accurate
GPS can eliminate any
threat of low accuracy or
range
Automatic Asset Tracking System
Chapter 9. Conclusion
Even though the current market offers numerous Asset Tracking solutions, the new and innovative
system, described in this paper, has the potential to become a major competitor in this particular field.
This system is the most cost-efficient solution available at the moment as well as it works with an
open-source based software. These facts are just two of the major achievements of this project. In
addition to that, the new system tries to transfer the best functions and abilities of other solutions to
combine them in a system that not only does a very proper and effective job, but also aims to be the
most complete system overall.
Another benefit of this system is that, once all the testing is done, the system could actually be offered
to airports or companies in need of such a system. This will cover the development costs of the project
and after some time it might even start to raise a profit which would lead into making the new system
cheaper for the users and in a long term even profitable.
Although the project has ended successfully, the developed system is far from being done. The most
essential future improvement is to execute a major testing phase where one hundred up to one
thousand vehicles are being monitored. This test could work out perfectly, while at the same time, any
kind of problems could occur. Such problems could be interference, the loss of a signal or the
bandwidth not being able to support the necessary amount of data coming from that many devices.
In order to conclude this paper and this project, it has to be stated that a good basic level has been
created to base a successful Automatic Asset Tracking system solution on it. This system reveals a lot
of potential if configured, tested and implemented correctly. Finally, the system can serve not only as
an airport surveillance system, but also in a harbor, in a production area, a major construction side or a
mid-range cab tracking system. The varieties will grow as soon as the range can be improved even
more. Taking everything into account, the system can become one of the next major systems in the
field of real-time vehicle surveillance.
53
Automatic Asset Tracking System
Chapter 10.
Acknowledgment
The EPS group would like to thank all colleagues and students who contributed to making this project
possible. We are grateful to our supervisor, Vicenç Parisi, for giving assistance and guidance through
the whole project, and to all the professors that contributed with their knowledge during the
development of the system. The EPS group is very grateful for the cooperation and interest of the
employees at Aeropuertos Españoles y Navegación Aérea, Barcelona Airport. This project would not
have been possible without their interest in developing this system. Last but not least we would like to
thank the Escola Politècnica Superior d‟Enginyeria de Vilanova i la Geltrú, Universitat Politècnica de
Catalunya and the International Coordinator of the EPS program, Patricia Benson, for giving us the
opportunity to participate in the European Project Semester.
54
Automatic Asset Tracking System
Chapter 11.
References
[1]
Carles Pérez, Xavier Cano, José Juan Guirao and Josep Maria Fàbrega, Xarxa inalámbrica a
la Banda ISM per a la monitorització d’un dispositiu GPS, 2009- Bachelor Project
[2]
Rappin, Noel and Robin Dunn. wxPython in Action. Greenwich: Manning Publications Co.,
2006
[3]
Barry, Paul. Head First Python. Sebastopol, CA: O‟Reilly Media, Inc., 2010
[4]
Bodnar, Jan. The wxPython tutorial. Online.
http://zetcode.com/wxpython/. March 10, 2011
[5]
Bodnar, Jan. The Python tutorial. Online
http://zetcode.com/tutorials/pythontutorial/. March 10, 2011
[6]
Parkin, Tim. Python Programming Language – Official Website. Online
http://www.python.org/. March 7, 2011
[7]
Wikipedia, www.wkipedia.org
[8]
M868-TINYPRO: TECHNICAL MANUALS
One RF Technology 2008, following internet URL: http://www.one-rf.com/
One RF Technology, Manual M868-TinyPro_v1.3,datasheet, 2007/2008, pp.16-18
One RF Technology, Manual B868-TinyPro_v1.3,datasheet, 2007/2008, pp.17
One RF Technology, Functionalities and Operations modes v1.3,datasheet, 2007/2008,
pp.19-20
One RF Technology, Manual DemoKit-TinyPro_v1.1,datasheet, 2007/2008, pp.16-18
One RF Technology, Manual TinyTools_v1.1,datasheet, 2007/2008, pp.18
[9]
Microchip Technology
atasheet,2009,pp.27-28
[10]
Online http://tom.pycke.be/mav/84/connecting-my-gps-eb-85-to-a-pic-microcontroller, pp.27
[11]
Online http://www.rapidbridge.com/productbriefs/liqio_lvttl_pb.pdf, pp.26
[12]
ELPRO Technologies, Wireless Solutions for Process Applications, Tech Article No. 1.3,
pp.22
[13]
Shai Vaingast, Ou Daem, Beginning Python Visualization: Crafting Visual Transformation
Scripts, 2009
Incorporated, PIC24F16KA102
www.microchip.com
55
Family
Data
Sheet,
d
Automatic Asset Tracking System
Chapter 12.
12.1.
Appendices
Responsibility matrix
Responsibility Matrix
Philipp
Leonard
Oana
Jakub
Linus
R
S
S
S
S
R
S
S
R
S
R
R
S
S
R
R
S
R
S
R
S
S
R
S
R
Interpretation of Data
R
S
Implementing Software
in Network
S
R
R
S
Research for
Alternatives
Selection of a GPS
device
Comparison of RFModules
Comparison of
Protocols
Assemble all necessary
components
Carrying out Lab Tests
S
Implementing
Hardware in Network
Creating Data Files and
Logs
Research for
Programming Language
Selction of Proper Files
to read
Cost- Evalutation
R
Layout of User
Interface
Carrying out Field Tests
R
R
R
R
R
Overall Documentation
R
R
R
R
R
R
S
S
S
S
S
S
R
R
S
R
R
S
S
S
S
R
S
S
R
Create Midterm Report
and Presentation
Structure and Writing
of the Article
Wrinting and Review of
the Final Report
Layout and Creation of
the Poster
R: Responsible S: Support
56
Automatic Asset Tracking System
12.2.
Software source code
12.2.1. Main program
import wxversion
wxversion.select("2.8")
import wx
import time
import glob
import os
import threading
myEVT_CollectLocations = wx.NewEventType() #threading events
EVT_CollectLocations = wx.PyEventBinder(myEVT_CollectLocations, 1)
class MainFrame(wx.Frame): #Automatic Vehicle Tracking Frame
def __init__(self, parent, id):
wx.Frame.__init__(self, parent, id, pos=wx.Point(0,0),
size=wx.Size(1280,800),
style = wx.DEFAULT_FRAME_STYLE ,
title='Automatic Vehicle Tracking 0.0')
# Main parameters, objects, variables ..
self.mapFolder = ''
self.panel = wx.Panel(self)
self.imageFile= 'google_map7.JPG'
self.W = (wx.Image(self.mapFolder+self.imageFile)).GetWidth()
self.H = (wx.Image(self.mapFolder+self.imageFile)).GetHeight()
self.avtDisplay = MainDisplay(self.panel,-1, self.mapFolder, self.imageFile, self.W, self.H)
self.avtStatus = AVTStatusBar(self)
self.SetStatusBar(self.avtStatus)
self.updateNumber = 0
self.threadAlive = False
self.displayTracks = False
self.drawSimulatedTrack = False
self.avtStatus.SetStatusText('Choose a task from the Menu', 1)
# A button
self.button=wx.Button(self, label="Save", pos=(0, 0))
self.Bind(wx.EVT_BUTTON, self.OnClick,self.button)
# Bindings
self.Bind(wx.EVT_CLOSE, self.Onquit)
self.Bind(EVT_CollectLocations, self.OnCollectLocations)
#Menus
self.SetUpMenus()
self.stopLiveTrack.Enable(False)
#READING
57
Automatic Asset Tracking System
def OnCollectLocations(self, evt): #functions used to collect locations
self.updateNumber = self.updateNumber +1
files = self.FileIterator()
for path in files:
self.avtDisplay.coords[files.index(path)] = self.Reader(path, self.updateNumber)
#
print path
#
print self.avtDisplay.coords[files.index(path)]
num = 0
for coordinate in self.avtDisplay.coords:
self.avtDisplay.icons[self.avtDisplay.coords.index(coordinate)]=(Icon(int(coordinate[0]),int(coordinate[1]),self.a
vtDisplay.scale, num))
num = num +1
self.avtStatus.SetStatusText('Update: '+str(self.updateNumber)+ ' at ' +time.asctime(), 1)
self.Refresh()
self.Update()
def Reader(self, filename,n): #function reading the coordinates
with open(filename) as f:
lines = f.readlines()
if len(lines)<n:
n = len(lines)
line = lines[n-1].strip().split(" ")
return line
def Reader_2(self, filename,n): #alternative function to read the coordinates
with open(filename) as f:
first = f.readline()
if (f.readline() == ''):
#checks if files consists of more than one line
return first.strip().split(" ")
else:
offset=-4
while True:
#if more than one line than gets the last line immediately
f.seek(offset, 2)
lines = f.readlines()
if len(lines)>1:
last = lines[-1].strip().split(" ")
break
offset *= 2
return last
def FileIterator(self): #function finding all the .txt files
fileList = []
for infile in glob.glob(os.path.join(os.getcwd(), '*.txt')):
fileList.append(infile)
return fileList
def SetUpMenus(self): #function creating the menus
# Menubar Begins ##############################################################
58
Automatic Asset Tracking System
self.menubar = wx.MenuBar(wx.MB_DOCKABLE)
# Menu File ###################################################################
self.file = wx.Menu()
self.chooseFiles= wx.MenuItem(self.file, -1, u"Choose what files to read")
self.chooseFiles.SetHelp(u"Choose the files")
self.file.AppendItem(self.chooseFiles)
self.Bind(wx.EVT_MENU, self.OnchooseFiles, id=self.chooseFiles.GetId())
self.file.AppendSeparator()
self.quit = wx.MenuItem(self.file, -1, '&Quit\tCtrl+Q')
self.quit.SetHelp("Exit the program")
self.file.AppendItem(self.quit)
self.Bind(wx.EVT_MENU, self.Onquit, id=self.quit.GetId())
self.menubar.Append(self.file, '&File')
# Track Menu ###################################################################
self.track = wx.Menu()
self.simulateTrack= wx.MenuItem(self.track, -1, "Draw a simulated track")
self.simulateTrack.SetHelp('Simulate the track with the mouse')
self.track.AppendItem(self.simulateTrack)
self.Bind(wx.EVT_MENU, self.OnsimulateTrack, id=self.simulateTrack.GetId())
self.liveTrack= wx.MenuItem(self.track, -1, "Display live tracks")
self.liveTrack.SetHelp('Display real time collected track')
self.track.AppendItem(self.liveTrack)
self.Bind(wx.EVT_MENU, self.OnliveTrack, id=self.liveTrack.GetId())
self.stopLiveTrack= wx.MenuItem(self.track, -1, "Stop the display of live tracks")
self.stopLiveTrack.SetHelp('Stop displaying real time collected track')
self.track.AppendItem(self.stopLiveTrack)
self.Bind(wx.EVT_MENU, self.OnstopLiveTrack, id=self.stopLiveTrack.GetId())
self.menubar.Append(self.track, '&Track')
# Menu Help ########################################################
self.help = wx.Menu()
self.manual = wx.MenuItem(self.help, -1, "Show user manual")
self.manual.SetHelp("Show user manual")
self.help.AppendItem(self.manual)
self.Bind(wx.EVT_MENU, self.Onmanual, id=self.manual.GetId())
self.about = wx.MenuItem(self.help, -1, 'About...')
self.about.SetHelp("Information about this project")
self.help.AppendItem(self.about)
59
Automatic Asset Tracking System
self.Bind(wx.EVT_MENU, self.Onabout, id=self.about.GetId())
self.menubar.Append(self.help, '&Help')
# Menubar Ends ##########################################################
self.SetMenuBar(self.menubar)
def OnchooseFiles(self,event): #function enabling viewing the files, not implemented yet
self.avtStatus.SetStatusText('Not implemented yet', 2)
time.sleep(1.0)
self.avtStatus.SetStatusText('', 2)
def Onquit(self, event): #function showing additional window after pressing the Quit option
ret = wx.MessageBox('Are you sure to quit?', '...last question', wx.YES_NO | wx.NO_DEFAULT, self)
if ret == wx.YES:
if self.threadAlive:
self.collectThread.stop()
self.threadAlive = False
#self.Close()
self.Destroy()
def OnsimulateTrack(self,event): #function activated after pressing Draw te simulated track
if self.threadAlive:
self.collectThread.stop()
self.threadAlive = False
self.displayTracks = False
self.avtStatus.SetStatusText('Draw a simulated track', 1)
self.simulateTrack.Enable(False)
self.liveTrack.Enable(False)
self.stopLiveTrack.Enable(False)
self.Refresh()
self.drawSimulatedTrack = True
def OnliveTrack(self,event): #function displaying the vehicles in real time
self.files = self.FileIterator()
del self.avtDisplay.coords[:]
del self.avtDisplay.icons[:]
for path in self.files:
self.avtDisplay.coords.append((1,1))
num = 1
for coordinate in self.avtDisplay.coords:
self.avtDisplay.icons.append(Icon(int(coordinate[0]),int(coordinate[1]),1, num))
num = num+1
self.displayTracks = True
self.collectThread=CollectThread(self)
self.collectThread.start()
self.threadAlive = True
60
Automatic Asset Tracking System
self.simulateTrack.Enable(False)
self.stopLiveTrack.Enable(True)
self.liveTrack.Enable(False)
def OnstopLiveTrack(self,event): #function to stop the real time displaying
if self.threadAlive:
self.displayTracks = False
self.avtStatus.SetStatusText('Live tracks disabled', 1)
self.collectThread.stop()
self.threadAlive = False
self.liveTrack.Enable(True)
self.stopLiveTrack.Enable(False)
self.simulateTrack.Enable(True)
self.Refresh()
def Onmanual(self,event): #function showing the manual, not yet implemented
self.avtStatus.SetStatusText('Not implemented yet', 2)
time.sleep(1.0)
self.avtStatus.SetStatusText('', 2)
def Onabout(self, event): #function displaying the About window
description = u"""This asset tracking system is a joint project between AENA and Universitat Politècnica de
Catalunya"""
licence = """ Contact: [email protected] and [email protected]"""
info = wx.AboutDialogInfo()
info.SetIcon(wx.Icon('screenruler.png', wx.BITMAP_TYPE_PNG))
info.SetName('Automatic Vehicle tracking')
info.SetVersion('0.0')
info.SetDescription(description)
info.SetCopyright('(C) 2011 AENA-UPC')
info.SetDevelopers(['Jakub Wychowaniec','Leonard Filip','Philipp Rühle','Oana Beatu','Linus Storhannus'])
info.SetLicence(licence)
wx.AboutBox(info)
class MainDisplay(wx.ScrolledWindow): #class containing the map
def __init__(self,parent, ID, mapFolder, imageFile, W, H):
wx.ScrolledWindow.__init__(self, parent,
ID,(125,10),(W,H),wx.HSCROLL|wx.VSCROLL|wx.SUNKEN_BORDER)
self.parent = parent
self.mapFolder= mapFolder
self.imatge = wx.Image(mapFolder+imageFile)
self.iH = self.H = H
self.iW = self.W = W
self.SetSize((self.W,self.H))
self.cz = self.GetClientSize()
self.scale = 1
self.shapes = []
61
Automatic Asset Tracking System
self.icons = []
self.vehicles = []
self.coords = []
self.simulatedTracks = []
self.files = self.parent.GetParent().FileIterator() #finding the .txt files
for path in self.files:
self.coords.append((1,1)) #applying initial coordinates
num = 1
for coordinate in self.coords:
self.icons.append(Icon(int(coordinate[0]),int(coordinate[1]),self.scale, num))
num = num+1
self.shapes.append(DragShape(self.imatge, self.scale))
#bindings
self.Bind(wx.EVT_ERASE_BACKGROUND, self.OnEraseBackground)
self.Bind(wx.EVT_PAINT, self.OnPaint)
self.Bind(wx.EVT_RIGHT_DOWN,self.OnRightDown)
self.Bind(wx.EVT_MOTION, self.OnMotion)
self.Bind(wx.EVT_LEFT_DCLICK ,self.OnLeftDoubleClick)
self.Refresh()
self.Update()
def OnLeftDoubleClick(self,evt): #function allowing to save the simulated track after double left click
if self.parent.GetParent().drawSimulatedTrack:
dlg = wx.FileDialog(self,"Where do you want to save the simulated track?",self.mapFolder,'',"Files TXT
(*.txt)|*.txt", wx.SAVE | wx.FD_OVERWRITE_PROMPT | wx.FD_CHANGE_DIR )
if dlg.ShowModal() == wx.ID_OK:
self.trackFile = dlg.GetPath()
self.trackFilename = dlg.GetFilename()
if self.trackFile[-4:] != '.txt':
self.trackFile= self.trackFile+ '.txt'
self.trackFilename = self.trackFilename + '.txt'
with open(self.trackFile,'w') as simulatedTrackFile:
for pt in self.simulatedTracks:
simulatedTrackFile.write(str(pt[0])+' '+str(pt[1]))
simulatedTrackFile.write('\n')
simulatedTrackFile.close()
dlg.Destroy()
del self.simulatedTracks[:]
self.parent.GetParent().drawSimulatedTrack = False
self.parent.GetParent().liveTrack.Enable(True)
self.parent.GetParent().simulateTrack.Enable(True)
self.parent.GetParent().avtStatus.SetStatusText('Simulated Track', 1)
self.parent.GetParent().avtStatus.SetStatusText('Saved in: '+ self.trackFilename, 2)
62
Automatic Asset Tracking System
def OnMotion(self, evt): #function allowing to draw simulated track on mouse movement
pt = evt.GetPosition()
if (pt[0] < self.cz[0]) and (pt[1]<self.cz[1]) and (pt[0] > 1) and (pt[1] > 1) and evt.LeftIsDown() and
self.parent.GetParent().drawSimulatedTrack :
self.parent.GetParent().avtStatus.SetStatusText('Mouse at: '+str(pt), 2)
self.simulatedTracks.append(pt)
dc = wx.ClientDC(self)
dc.Clear()
self.DrawShapes(dc)
dc.SetPen(wx.Pen(wx.RED,2))
dc.DrawLines(self.simulatedTracks)
def OnLeftUp(self, evt):
print 'LeftUp'
def OnRightDown(self, evt): #zooming dunction
if self.parent.GetParent().drawSimulatedTrack == False:
pos = evt.GetPosition()
view = self.GetViewStart()
if self.scale < 3.0:
self.scale = self.scale + 1.0
self.maxColumn = int(self.scale * self.W)
self.maxRow = int(self.scale * self.H)
self.SetScrollbars(1, 1, self.maxColumn, self.maxRow, 0, 0)
self.Scroll(view[0] + pos[0], view[1] + pos[1])
else:
self.scale = 1.0
self.SetScrollbars(1, 1, 1, 1, 0, 0)
for shape in self.shapes:
shape.ChangeScale(self.scale)
for icon in self.icons:
icon.ChangeScale(self.scale)
self.Refresh()
self.Update()
def OnPaint(self, evt): #function drawing the map and vehicles
dc = wx.PaintDC(self)
dc.Clear()
self.PrepareDC(dc)
self.DrawShapes(dc)
if self.parent.GetParent().displayTracks:
self.DrawIcons(dc)
def DrawShapes(self, dc): #drawing the map
for shape in self.shapes:
if shape.shown:
shape.Draw(dc)
63
Automatic Asset Tracking System
def DrawIcons(self, dc): #drawing the icons
for icon in self.icons:
if icon.shown:
icon.Draw(dc)
def OnEraseBackground(self, evt):
self.ClearBackground()
class DragShape: #class containing all the parameters of the map
def __init__(self, imatge, scalei):
self.imatge = imatge
self.origWidth = self.imatge.GetWidth()
self.origHeight= self.imatge.GetHeight()
self.origScale = scalei
self.upos = (0,0)
if scalei != 1 :
self.imatge.Rescale(int(self.origWidth*scalei),int(self.origHeight*scalei),wx.IMAGE_QUALITY_HIGH)
self.width = self.imatge.GetWidth()
self.height= self.imatge.GetHeight()
self.bmp = wx.BitmapFromImage(self.imatge)
self.shown = True
self.scale = 1
def ChangeScale(self,scale): #function to change the scale of the map after zooming
self.scale = scale
if self.scale == 1.0:
imageFile = 'google_map7.JPG'
if self.scale == 2.0:
imageFile = 'google_map14.JPG'
if self.scale == 3.0:
imageFile = 'google_map21.JPG'
self.imatge = wx.Image(imageFile)
self.bmp = wx.BitmapFromImage(self.imatge)
self.width = self.imatge.GetWidth()
self.height= self.imatge.GetHeight()
def Draw(self, dc): #drawing the map
memDC = wx.MemoryDC()
memDC.SelectObject(self.bmp)
dc.Blit(0, 0, self.width, self.height, memDC, 0, 0)
class Icon: #class containing all the parameters of the icons
def __init__(self, posX, posY, scale, num):
self.scale = 1.0
self.posX = posX
self.posY = posY
self.radi = 5;
64
Automatic Asset Tracking System
self.shadowColor = 'Red'
self.shown = True
self.num = num
self.font = wx.Font(16, wx.SWISS, wx.NORMAL, wx.BOLD)
if scale>1.0:
self.ChangeScale(scale)
def ChangeScale(self,scale): #changing the scale of the icons
self.scaleOld = self.scale
self.scale = scale
self.posX = int(self.posX * self.scale / self.scaleOld)
self.posY = int(self.posY * self.scale / self.scaleOld)
def Draw(self, dc): #drawing the icons
dc.SetPen(wx.Pen(self.shadowColor,1))
dc.SetBrush(wx.Brush(self.shadowColor,style=wx.SOLID))
dc.DrawCircle(self.posX,self.posY,self.radi)
#dc.SetTextForeground(self.shadowColor)
label = str(self.num)
(w,h)=dc.GetTextExtent('V'+label)
dc.SetPen(wx.Pen(wx.WHITE,1))
dc.SetBrush(wx.Brush('Yellow',style=wx.SOLID))
dc.DrawRectangle(self.posX+2*self.radi,self.posY,w+2,h) #4
dc.DrawText('V'+label,self.posX+2*self.radi+1,self.posY)
class AVTStatusBar(wx.StatusBar): #class containing the parameters of the status bar
def __init__(self, parent):
wx.StatusBar.__init__(self, parent, -1)
self.SetFieldsCount(3)
self.SetStatusWidths([-1, -1, -1])
self.sizeChanged = False
# Field 0
self.SetStatusText("EPS for AENA-UPC, 2010/11", 0)
class CollectEvent(wx.PyCommandEvent): #event used to collect the coordinates using threading
def __init__(self, etype, eid):
wx.PyCommandEvent.__init__(self, etype, eid)
class CollectThread(threading.Thread): #class containing parameters of threading
def __init__(self,parent):
threading.Thread.__init__(self)
self.finish = threading.Event()
self.finish.clear()
self.parent=parent
self.interval = 0.3
def stop(self): #function used to stop the threading
65
Automatic Asset Tracking System
self.finish.set()
def run(self): #function used to start the threading
while 1:
self.finish.wait(self.interval)
if self.finish.isSet():
break
#if self._finished.isSet(): return
event = CollectEvent(myEVT_CollectLocations, -1)
wx.PostEvent(self.parent, event)
if __name__ == '__main__': #initializing the window
app = wx.PySimpleApp()
avtFrame = MainFrame(parent=None, id=-1)
avtFrame.Show()
app.MainLoop()
12.2.2. Reading serial port
import serial
import time
import math
def read_pixelz(lati, longi): #function used to translate longitude and latitude into pixels
#print str(lati) + ' ' + str(longi)
lati_diff = 41.31029951631133 - lati
longi_diff = longi - 2.05843448638916
pix_row = round(lati_diff / 0.000045846)
pix_col = round(longi_diff / 0.000061222)
return(str(int(pix_col)), str(int(pix_row)))
def pixelate(line): # function used to select which lines to translate
latitude = 0.0
longitude = 0.0
split_line = line.strip().split(' ')
if split_line[0] == 'Time:':
latitude = split_line[3]
#print latitude
longitude = split_line[5]
#print longitude
return(read_pixelz(float(latitude), float(longitude)))
def check_checksum(row): #function calculating and comparing the checksums
item = row[1:]
checksum_received = ''
66
Automatic Asset Tracking System
s=0
result = True
for i in range(len(item) ):
if item[i] == '*':
checksum_received = item[i+1:i+3]
break
s = s ^ ord(item[i])
checksum_calc = ""
#convert to hex
s = "%02X" % s
checksum_calc += s
print "Checksum calculated: %s" % checksum_calc
print "Checksum received: %s" % checksum_received
if checksum_received != checksum_calc:
result = False
else:
pass
return (result, checksum_calc, checksum_received)
def read_coords(row): #function reading and splitting the received frames
latitude = ''
longitude = ''
t_seconds = ''
roow=row.strip().split(',')
if roow[0] != '$GPRMC':
pass
else:
t_seconds = str(roow[1][0:2]) +':'+ str(roow[1][2:4]) +':'+ str(roow[1][4:6])
latitude = str(float(roow[3][0:2]) + float(roow[3][2:])/60.0)
latitude_degrees = str(int(roow[3][0:2]))
latitude_minutes = str(int(roow[3][2:4]))
latitude_seconds = str(float(roow[3][4:])*60.0)
longitude = str(float(roow[5][0:3]) + float(roow[5][3:])/60.0)
longitude_degrees = str(int(roow[5][0:3]))
longitude_minutes = str(int(roow[5][3:5]))
longitude_seconds = str(float(roow[5][5:])*60.0)
return(t_seconds,
latitude,latitude_degrees,
latitude_minutes,
latitude_seconds,
longitude_degrees, longitude_minutes, longitude_seconds)
ser=serial.Serial('/dev/ttyUSB0',4800) #opening the port
path = "../data/GPS-%4d-%02d-%02d-%02d-%02d-%02d.txt"
filename = path % time.localtime()[0:6]
with open(filename,'w') as f: #a instead of w?
with open('coordinatez.txt', 'a') as f2:
67
longitude,
Automatic Asset Tracking System
while True: #loop finding and analyzing first proper line
line_begin=ser.readline().split(',')
first_line = ''
first_line_to_print = ''
if line_begin[0] != '$GPRMC':
pass
else:
for element in line_begin:
if line_begin.index(element) == 12:
f.write(element)
#printing the line into the log file
first_line_to_print += element
first_line += element
break
f.write(element+',')
first_line_to_print+= element+','
first_line += element + ','
break
print first_line_to_print,
(outcome, calc, rec) = check_checksum(first_line)
if not outcome:
#calculating pixels and checksums and printing on the screen and
into the files
print "Frame corrupted, not recorded"
f.write ('----------------CHECKSUM ERROR calculated:' + calc + ', received: ' + rec + '----------------\n\n')
else:
(time, lati, lati_d, lati_m, lati_s, longi, longi_d, longi_m, longi_s) = read_coords(first_line)
(pixel_column, pixel_row) = pixelate('Time: ' + time + ' Latitude: ' + lati + ' Longitude: ' + longi)
f2.write (pixel_column + ' ' + pixel_row + '\n')
print 'Pixels: ' + pixel_column + ' ' + pixel_row
f.write ('Time: ' + time + ' Latitude: ' + lati + ' Longitude: ' + longi + '\n')
print time + ' ' + lati + ' '+ longi + ' ' +lati_d + '*' + lati_m + "'" + lati_s + '"N' + ' '+ longi_d + '*'+ longi_m
+ "'" + longi_s + '"E' + '\n'
f.write('\n')
while True:
#loop dealing with the rest of the received frames
with open(filename,'a') as f:
with open('coordinatez.txt', 'a') as f2:
line = ser.readline()
f.write(line)
#printing into the log file
print line,
(outcome, calc, rec) = check_checksum(line)
if not outcome:
#calculating pixels, checksums and printing on the screen and into the files
print "Frame corrupted, not recorded"
f.write ('----------------CHECKSUM ERROR calculated:' + calc + ', received: ' + rec + '----------------\n\n')
else:
(time, lati, lati_d, lati_m, lati_s, longi, longi_d, longi_m, longi_s) = read_coords(line)
(pixel_column, pixel_row) = pixelate('Time: ' + time + ' Latitude: ' + lati + ' Longitude: ' + longi)
print 'Pixels: ' + pixel_column + ' ' + pixel_row
68
Automatic Asset Tracking System
f2.write (pixel_column + ' ' + pixel_row + '\n')
f.write ('Time: ' + time + ' Latitude: ' + lati + ' Longitude: ' + longi + '\n')
print time + ' ' + lati + ' '+ longi + '\n' +lati_d + '*' + lati_m + "'" + lati_s + '"N' + ' '+ longi_d + '*'+ longi_m
+ "'" + longi_s + '"E' + '\n'
f.write('\n')
69