1
TEMS™ Investigation 9.0
Data Collection
User’s Manual
This manual is provided by Ericsson AB without any kind of warranty.
Improvements and changes in this description due to typographical errors or
inaccuracies in current information, or improvements to programs and/or
equipment may be made by Ericsson AB at any time without notice. These
changes will, however, be incorporated into new editions of this manual.
No part of this publication may be reproduced, transmitted, stored in a
retrieval system, nor translated into any human or computer language, in any
form or by any means, electronic, mechanical, magnetic, optical, chemical,
manual or otherwise, without the prior written permission of the copyrighted
owner, Ericsson AB.
TEMS is a trademark owned by Telefonaktiebolaget L M Ericsson.
All other trademarks are the property of their respective holders.
© Ericsson AB 2008. All rights reserved.
Publication number: LZT 108 9851 R1B
Contents
Contents
1. Introduction
1
1.1. Fundamentals of TEMS Investigation 9.0 . . . . . . . . . . . . . . . . . . . . . 2
1.1.1. Modules: Data Collection and Route Analysis . . . . . . . . . . . . 2
1.1.2. Package Options – Licensing. . . . . . . . . . . . . . . . . . . . . . . . . 3
1.1.3. Connectable Equipment . . . . . . . . . . . . . . . . . . . . . . . . . . . . . 3
1.2. What’s New in TEMS Investigation 9.0 . . . . . . . . . . . . . . . . . . . . . . . 4
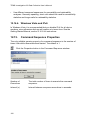
1.2.1. WiMAX Support . . . . . . . . . . . . . . . . . . . . . . . . . . . . . . . . . . . 4
1.2.2. Using the Sony Ericsson Z750i as Scanner . . . . . . . . . . . . . . 5
1.2.3. New and Strengthened WCDMA Scanning Modes with
Sony Ericsson Z750i . . . . . . . . . . . . . . . . . . . . . . . . . . . . . 5
1.2.4. GSM Scanning with Sony Ericsson Z750i . . . . . . . . . . . . . . . 6
1.2.5. Refined C/I Measurement for GSM . . . . . . . . . . . . . . . . . . . . 6
1.2.6. SQI-MOS for GSM and WCDMA . . . . . . . . . . . . . . . . . . . . . . 6
1.2.7. AQM (PESQ) for CDMA . . . . . . . . . . . . . . . . . . . . . . . . . . . . . 7
1.2.8. WAP-based Streaming. . . . . . . . . . . . . . . . . . . . . . . . . . . . . . 7
1.2.9. WAP 2.0 Support . . . . . . . . . . . . . . . . . . . . . . . . . . . . . . . . . . 7
1.2.10. Support for New User Terminals . . . . . . . . . . . . . . . . . . . . . 7
1.2.11. Support for New Scanners . . . . . . . . . . . . . . . . . . . . . . . . . . 8
1.2.12. Support for New GPS Devices . . . . . . . . . . . . . . . . . . . . . . . 8
1.2.13. Support for Windows Vista . . . . . . . . . . . . . . . . . . . . . . . . . . 8
1.2.14. Enhanced TEMS Portfolio Compatibility . . . . . . . . . . . . . . . 8
1.3. Other Recent New Features in TEMS Investigation . . . . . . . . . . . . . 9
1.3.1. CDMA Support . . . . . . . . . . . . . . . . . . . . . . . . . . . . . . . . . . . . 9
1.3.2. HSUPA Support . . . . . . . . . . . . . . . . . . . . . . . . . . . . . . . . . . 10
1.3.3. GAN (UMA) Monitoring . . . . . . . . . . . . . . . . . . . . . . . . . . . . 10
1.3.4. Audio Quality Measurement (AQM) with PESQ . . . . . . . . . . 10
1.3.5. Video Telephony Quality Index (VTQI). . . . . . . . . . . . . . . . . 11
1.3.6. Video Streaming and VSQI Enhancements . . . . . . . . . . . . . 11
1.3.7. New Missing Neighbor Events . . . . . . . . . . . . . . . . . . . . . . . 11
1.3.8. TPC per Cell (Sony Ericsson UEs). . . . . . . . . . . . . . . . . . . . 12
1.3.9. Logfile Post-processing with Python Scripts . . . . . . . . . . . . 12
1.3.10. Route Analysis: New Tasks . . . . . . . . . . . . . . . . . . . . . . . . 12
1.3.11. Event Counter Window in Data Collection . . . . . . . . . . . . . 13
LZT 108 9851 R1B
i
TEMS Investigation 9.0 Data Collection User’s Manual
1.4. What’s in This Manual (and What’s Not). . . . . . . . . . . . . . . . . . . . . 13
1.5. Definitions . . . . . . . . . . . . . . . . . . . . . . . . . . . . . . . . . . . . . . . . . . . . 15
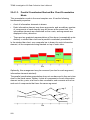
2. Basics of TEMS Investigation Data Collection
17
2.1. Recommended Skills . . . . . . . . . . . . . . . . . . . . . . . . . . . . . . . . . . .
2.2. Installing TEMS Investigation . . . . . . . . . . . . . . . . . . . . . . . . . . . . .
2.3. Starting TEMS Investigation Data Collection . . . . . . . . . . . . . . . . .
2.4. Quick Guide to the User Interface. . . . . . . . . . . . . . . . . . . . . . . . . .
3. User Interface
20
3.1. User Modes. . . . . . . . . . . . . . . . . . . . . . . . . . . . . . . . . . . . . . . . . . .
3.2. Workspaces and Worksheets . . . . . . . . . . . . . . . . . . . . . . . . . . . . .
3.3. The Toolbars. . . . . . . . . . . . . . . . . . . . . . . . . . . . . . . . . . . . . . . . . .
3.3.1. Equipment Control Toolbar . . . . . . . . . . . . . . . . . . . . . . . . .
3.3.2. Connections Toolbar . . . . . . . . . . . . . . . . . . . . . . . . . . . . . .
3.3.3. Record Toolbar . . . . . . . . . . . . . . . . . . . . . . . . . . . . . . . . . .
3.3.4. Replay Toolbar. . . . . . . . . . . . . . . . . . . . . . . . . . . . . . . . . . .
3.3.5. Report Toolbar . . . . . . . . . . . . . . . . . . . . . . . . . . . . . . . . . . .
3.3.6. Route Analysis Toolbar . . . . . . . . . . . . . . . . . . . . . . . . . . . .
3.3.7. File and View Toolbar . . . . . . . . . . . . . . . . . . . . . . . . . . . . .
3.4. The Status Bar . . . . . . . . . . . . . . . . . . . . . . . . . . . . . . . . . . . . . . . .
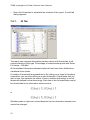
3.5. The Menu Bar . . . . . . . . . . . . . . . . . . . . . . . . . . . . . . . . . . . . . . . . .
3.6. Keyboard Shortcuts . . . . . . . . . . . . . . . . . . . . . . . . . . . . . . . . . . . .
4. The Navigator
20
21
22
22
23
23
23
24
24
24
24
26
27
28
4.1. Menu Tab . . . . . . . . . . . . . . . . . . . . . . . . . . . . . . . . . . . . . . . . . . . .
4.2. Info Element Tab. . . . . . . . . . . . . . . . . . . . . . . . . . . . . . . . . . . . . . .
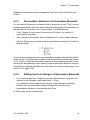
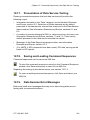
4.2.1. Presentation Attributes of Information Elements . . . . . . . . .
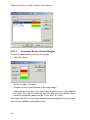
4.2.2. Editing the Color Ranges of Information Elements . . . . . . .
4.2.2.1. Automatic Setup of Color Ranges. . . . . . . . . . . . . . .
4.2.2.2. Manual Setup of Color Ranges . . . . . . . . . . . . . . . . .
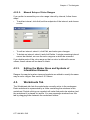
4.2.3. Editing the Marker Sizes and Symbols of Information
Elements . . . . . . . . . . . . . . . . . . . . . . . . . . . . . . . . . . . . .
4.3. Worksheets Tab . . . . . . . . . . . . . . . . . . . . . . . . . . . . . . . . . . . . . . .
ii
17
17
17
18
28
28
29
29
30
31
31
31
Contents
5. Cell Data
32
5.1. Creating a Cell File in XML Format . . . . . . . . . . . . . . . . . . . . . . . . . 32
5.2. Creating a Cell File in CEL Format . . . . . . . . . . . . . . . . . . . . . . . . . 33
5.3. Loading Cell Files . . . . . . . . . . . . . . . . . . . . . . . . . . . . . . . . . . . . . . 33
5.4. Loading Cell Data from TEMS CellPlanner . . . . . . . . . . . . . . . . . . . 33
5.5. Use of Cell Data in Presentations . . . . . . . . . . . . . . . . . . . . . . . . . . 33
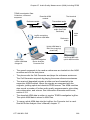
6. Connecting External Equipment
35
6.1. Connectable Equipment . . . . . . . . . . . . . . . . . . . . . . . . . . . . . . . . . 35
6.2. Connection Procedure: Terminology. . . . . . . . . . . . . . . . . . . . . . . . 35
6.3. Plugging In External Equipment . . . . . . . . . . . . . . . . . . . . . . . . . . . 36
6.3.1. Plugging In Phones . . . . . . . . . . . . . . . . . . . . . . . . . . . . . . . 36
6.3.2. Plugging In Scanners . . . . . . . . . . . . . . . . . . . . . . . . . . . . . . 36
6.3.3. Plugging In GPS Units . . . . . . . . . . . . . . . . . . . . . . . . . . . . . 37
6.3.4. Plugging In Equipment Cases . . . . . . . . . . . . . . . . . . . . . . . 37
6.3.5. Plugging In Standalone AQM Modules . . . . . . . . . . . . . . . . 37
6.4. Starting TEMS Investigation Data Collection . . . . . . . . . . . . . . . . . 37
6.5. The Equipment Configuration Window: Basics . . . . . . . . . . . . . . . . 37
6.6. Automatic Detection (Enabling) of Equipment. . . . . . . . . . . . . . . . . 39
6.6.1. Scope of Autodetect Function . . . . . . . . . . . . . . . . . . . . . . . 39
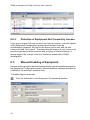
6.6.2. Presentation in Equipment Configuration Window . . . . . . . . 39
6.6.3. Detection of Equipment Not Covered by License. . . . . . . . . 40
6.7. Manual Enabling of Equipment . . . . . . . . . . . . . . . . . . . . . . . . . . . . 40
6.7.1. Details of Manual Enabling. . . . . . . . . . . . . . . . . . . . . . . . . . 41
6.7.1.1. Scanners . . . . . . . . . . . . . . . . . . . . . . . . . . . . . . . . . . 41
6.7.1.2. Data Cards . . . . . . . . . . . . . . . . . . . . . . . . . . . . . . . . 42
6.7.2. Manual Enabling of Equipment Not Covered by License . . . 43
6.8. Further Features of the Equipment Configuration Window . . . . . . . 43
6.8.1. The Refresh Function. . . . . . . . . . . . . . . . . . . . . . . . . . . . . . 43
6.8.2. Saving the Equipment Configuration . . . . . . . . . . . . . . . . . . 43
6.8.3. Re-pairing Phones with AQM Modules . . . . . . . . . . . . . . . . 44
6.8.3.1. Details and Limitations of the Re-pairing Function . . 44
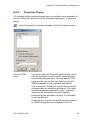
6.8.4. Properties Dialog . . . . . . . . . . . . . . . . . . . . . . . . . . . . . . . . . 45
6.8.5. EQ Item Context Menu. . . . . . . . . . . . . . . . . . . . . . . . . . . . . 46
6.8.5.1. Change Equipment Number . . . . . . . . . . . . . . . . . . . 46
6.8.5.2. Select AQM Module . . . . . . . . . . . . . . . . . . . . . . . . . 46
6.8.5.3. Change Phone Number. . . . . . . . . . . . . . . . . . . . . . . 47
6.8.5.4. Delete . . . . . . . . . . . . . . . . . . . . . . . . . . . . . . . . . . . . 47
6.9. Properties of Channels . . . . . . . . . . . . . . . . . . . . . . . . . . . . . . . . . . 47
LZT 108 9851 R1B
iii
TEMS Investigation 9.0 Data Collection User’s Manual
6.10. Connecting and Disconnecting External Equipment in TEMS
Investigation. . . . . . . . . . . . . . . . . . . . . . . . . . . . . . . . . . . . . . .
6.10.1. Connecting External Equipment . . . . . . . . . . . . . . . . . . . .
6.10.2. Disconnecting External Equipment . . . . . . . . . . . . . . . . . .
6.11. Disabling External Equipment. . . . . . . . . . . . . . . . . . . . . . . . . . . .
7. Logfiles
50
7.1. Recording Logfiles . . . . . . . . . . . . . . . . . . . . . . . . . . . . . . . . . . . . .
7.1.1. Inserting Filemarks. . . . . . . . . . . . . . . . . . . . . . . . . . . . . . . .
7.1.2. Swapping Logfiles . . . . . . . . . . . . . . . . . . . . . . . . . . . . . . . .
7.1.3. Further Recording Options. . . . . . . . . . . . . . . . . . . . . . . . . .
7.1.4. Positioning Logfiles by Pinpointing . . . . . . . . . . . . . . . . . . .
7.1.4.1. Basic Pinpointing Procedures . . . . . . . . . . . . . . . . . .
7.1.4.2. Advice on Pinpointing and Recording . . . . . . . . . . . .
7.2. Replaying Logfiles. . . . . . . . . . . . . . . . . . . . . . . . . . . . . . . . . . . . . .
7.2.1. Replay Properties . . . . . . . . . . . . . . . . . . . . . . . . . . . . . . . .
7.2.2. Searching a Logfile . . . . . . . . . . . . . . . . . . . . . . . . . . . . . . .
7.2.3. Replay Section of Status Bar . . . . . . . . . . . . . . . . . . . . . . . .
7.2.4. Logfile Information . . . . . . . . . . . . . . . . . . . . . . . . . . . . . . . .
7.3. Copying Logfiles . . . . . . . . . . . . . . . . . . . . . . . . . . . . . . . . . . . . . . .
7.4. Loading Logfiles from Other Sources . . . . . . . . . . . . . . . . . . . . . . .
7.5. Exporting Logfiles . . . . . . . . . . . . . . . . . . . . . . . . . . . . . . . . . . . . . .
7.5.1. Preparing an Export Order. . . . . . . . . . . . . . . . . . . . . . . . . .
7.5.2. Specifying the Contents of Export Files . . . . . . . . . . . . . . . .
7.5.2.1. Text File Specific Settings. . . . . . . . . . . . . . . . . . . . .
7.5.2.2. MapInfo Specific Settings . . . . . . . . . . . . . . . . . . . . .
7.5.2.3. ArcView Specific Settings . . . . . . . . . . . . . . . . . . . . .
7.5.2.4. Marconi Planet Specific Settings. . . . . . . . . . . . . . . .
7.5.2.5. Ethereal Specific Settings . . . . . . . . . . . . . . . . . . . . .
7.5.2.6. MDM Specific Settings . . . . . . . . . . . . . . . . . . . . . . .
7.5.2.7. “KPI Samples” . . . . . . . . . . . . . . . . . . . . . . . . . . . . . .
7.5.2.8. “Logfile with Uplink Data” . . . . . . . . . . . . . . . . . . . . .
7.5.2.9. Saving and Loading Export Setups. . . . . . . . . . . . . .
7.5.3. Executing Export Orders . . . . . . . . . . . . . . . . . . . . . . . . . . .
7.6. Generating Logfile Reports . . . . . . . . . . . . . . . . . . . . . . . . . . . . . . .
7.6.1. IE Tab . . . . . . . . . . . . . . . . . . . . . . . . . . . . . . . . . . . . . . . . .
7.6.2. Events Tab. . . . . . . . . . . . . . . . . . . . . . . . . . . . . . . . . . . . . .
7.6.3. Mobiles Tab . . . . . . . . . . . . . . . . . . . . . . . . . . . . . . . . . . . . .
7.6.4. Scanned Channels Tab . . . . . . . . . . . . . . . . . . . . . . . . . . . .
7.6.5. User Details Tab . . . . . . . . . . . . . . . . . . . . . . . . . . . . . . . . .
iv
47
47
48
49
50
51
52
52
53
54
55
55
56
56
57
57
57
58
59
60
61
63
65
66
67
67
67
67
68
68
68
69
70
72
72
73
73
Contents
7.6.6. Saving and Loading Report Setups . . . . . . . . . . . . . . . . . . . 73
7.6.7. Generating the Report . . . . . . . . . . . . . . . . . . . . . . . . . . . . . 73
7.6.8. Report Contents . . . . . . . . . . . . . . . . . . . . . . . . . . . . . . . . . . 74
7.7. Generating KPI Reports (UMTS). . . . . . . . . . . . . . . . . . . . . . . . . . . 74
7.7.1. Threshold Values Tab . . . . . . . . . . . . . . . . . . . . . . . . . . . . . 75
7.7.2. User Details Tab. . . . . . . . . . . . . . . . . . . . . . . . . . . . . . . . . . 76
7.7.3. Generating the Report . . . . . . . . . . . . . . . . . . . . . . . . . . . . . 76
7.8. Merging Logfiles with Uplink (MTR) Data . . . . . . . . . . . . . . . . . . . . 76
7.8.1. The Merging Algorithm . . . . . . . . . . . . . . . . . . . . . . . . . . . . . 76
7.8.2. Limitations of the Merging Algorithm . . . . . . . . . . . . . . . . . . 78
7.8.3. Performing the Merge. . . . . . . . . . . . . . . . . . . . . . . . . . . . . . 78
7.8.4. Accuracy of the Alignment . . . . . . . . . . . . . . . . . . . . . . . . . . 81
7.8.5. Example . . . . . . . . . . . . . . . . . . . . . . . . . . . . . . . . . . . . . . . . 82
8. GSM Scanning
85
8.1. Scanning Methods. . . . . . . . . . . . . . . . . . . . . . . . . . . . . . . . . . . . . . 85
8.2. Frequency Scanning Mode . . . . . . . . . . . . . . . . . . . . . . . . . . . . . . . 85
8.2.1. Channel Selection . . . . . . . . . . . . . . . . . . . . . . . . . . . . . . . . 87
8.2.2. BSIC Decoding. . . . . . . . . . . . . . . . . . . . . . . . . . . . . . . . . . . 88
8.2.3. C/I Scanning. . . . . . . . . . . . . . . . . . . . . . . . . . . . . . . . . . . . . 89
8.2.4. System Information Decoding . . . . . . . . . . . . . . . . . . . . . . . 89
8.2.5. CW Scanning . . . . . . . . . . . . . . . . . . . . . . . . . . . . . . . . . . . . 89
8.3. Performing a Scan. . . . . . . . . . . . . . . . . . . . . . . . . . . . . . . . . . . . . . 89
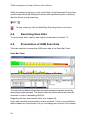
8.4. Recording Scan Data . . . . . . . . . . . . . . . . . . . . . . . . . . . . . . . . . . . 90
8.5. Presentation of GSM Scan Data . . . . . . . . . . . . . . . . . . . . . . . . . . . 90
8.6. Replaying Scan Data. . . . . . . . . . . . . . . . . . . . . . . . . . . . . . . . . . . . 91
8.7. Defining Your Own Channel Groups . . . . . . . . . . . . . . . . . . . . . . . . 91
9. WCDMA Scanning
92
9.1. Scanning Methods and Scanning Capacity. . . . . . . . . . . . . . . . . . . 92
9.2. Performing a Scan. . . . . . . . . . . . . . . . . . . . . . . . . . . . . . . . . . . . . . 94
9.3. Recording Scan Data . . . . . . . . . . . . . . . . . . . . . . . . . . . . . . . . . . . 94
9.4. CPICH Scanning (with SCH Scanning). . . . . . . . . . . . . . . . . . . . . . 94
9.4.1. Scan Setup. . . . . . . . . . . . . . . . . . . . . . . . . . . . . . . . . . . . . . 94
9.4.2. CPICH Scanning with Sony Ericsson Z750i. . . . . . . . . . . . . 95
9.4.3. CPICH Scanning with PCTel SeeGull LX/EX. . . . . . . . . . . . 97
9.4.4. CPICH Scanning with Anritsu. . . . . . . . . . . . . . . . . . . . . . . . 99
9.4.5. Manual Scrambling Code/UARFCN Selection . . . . . . . . . . 101
9.4.6. Presentation: General . . . . . . . . . . . . . . . . . . . . . . . . . . . . 103
LZT 108 9851 R1B
v
TEMS Investigation 9.0 Data Collection User’s Manual
9.4.7. Presentation: “CPICH Scan” Bar Charts . . . . . . . . . . . . . .
9.4.8. Presentation: “CPICH Data” Status Windows . . . . . . . . . .
9.4.9. Presentation: “CPICH Scan” Line Charts. . . . . . . . . . . . . .
9.4.10. Presentation: Synch Channel Data Window . . . . . . . . . .
9.4.11. Presentation: “Finger Info” Status Windows . . . . . . . . . .
9.4.12. Presentation: BCH Scanning . . . . . . . . . . . . . . . . . . . . . .
9.4.13. Customizing the Presentation . . . . . . . . . . . . . . . . . . . . .
9.4.13.1. Sorting of Scrambling Codes . . . . . . . . . . . . . . . .
9.4.13.2. Presenting Scrambling Codes from Multiple
UARFCNs . . . . . . . . . . . . . . . . . . . . . . . . . . . .
9.5. SCH Timeslot Scanning . . . . . . . . . . . . . . . . . . . . . . . . . . . . . . . .
9.5.1. Setup of SCH Timeslot Scan . . . . . . . . . . . . . . . . . . . . . . .
9.5.2. Presentation: SCH Timeslot Scan Bar Chart . . . . . . . . . . .
9.6. CW Scanning . . . . . . . . . . . . . . . . . . . . . . . . . . . . . . . . . . . . . . . .
9.6.1. Setup of CW Scan . . . . . . . . . . . . . . . . . . . . . . . . . . . . . . .
9.6.1.1. Channel Selection . . . . . . . . . . . . . . . . . . . . . . . . . .
9.6.2. Presentation: CW Scan Bar Chart . . . . . . . . . . . . . . . . . . .
9.7. Spectrum Analysis . . . . . . . . . . . . . . . . . . . . . . . . . . . . . . . . . . . .
9.7.1. Scan Setup . . . . . . . . . . . . . . . . . . . . . . . . . . . . . . . . . . . .
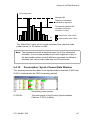
9.7.2. Presentation: Spectrum Analysis Bar Charts . . . . . . . . . . .
9.8. Network Search . . . . . . . . . . . . . . . . . . . . . . . . . . . . . . . . . . . . . .
9.8.1. Scan Setup . . . . . . . . . . . . . . . . . . . . . . . . . . . . . . . . . . . .
9.8.2. Presentation. . . . . . . . . . . . . . . . . . . . . . . . . . . . . . . . . . . .
9.9. Presenting WCDMA Scan Data in Status Windows . . . . . . . . . . .
9.10. Replaying Scan Data . . . . . . . . . . . . . . . . . . . . . . . . . . . . . . . . .
9.11. Defining Scrambling Code or UARFCN Groups . . . . . . . . . . . . .
10. CDMA Scanning
109
110
110
111
112
112
113
114
115
115
117
117
118
119
120
120
120
123
10.1. Scanning Methods and Scanning Capacity . . . . . . . . . . . . . . . .
10.2. Performing a Scan . . . . . . . . . . . . . . . . . . . . . . . . . . . . . . . . . . .
10.3. Recording Scan Data . . . . . . . . . . . . . . . . . . . . . . . . . . . . . . . . .
10.4. Pilot Scanning . . . . . . . . . . . . . . . . . . . . . . . . . . . . . . . . . . . . . . .
10.4.1. Scan Setup . . . . . . . . . . . . . . . . . . . . . . . . . . . . . . . . . . .
10.4.2. Manual Pilot/RF Channel Selection . . . . . . . . . . . . . . . . .
10.4.3. Presentation: “PN Scan” Bar Charts . . . . . . . . . . . . . . . .
10.4.4. Presentation: Strongest Scanned PN Bar Chart . . . . . . .
10.5. CW Scanning . . . . . . . . . . . . . . . . . . . . . . . . . . . . . . . . . . . . . . .
10.5.1. Setup of CW Scan . . . . . . . . . . . . . . . . . . . . . . . . . . . . . .
10.5.1.1. Channel Selection . . . . . . . . . . . . . . . . . . . . . . . . .
10.5.2. Presentation: CW Scan Bar Chart . . . . . . . . . . . . . . . . . .
vi
103
104
105
107
108
108
109
109
123
124
124
124
124
128
128
129
129
129
131
132
Contents
11. WiMAX Scanning
133
11.1. Scanning Capabilities . . . . . . . . . . . . . . . . . . . . . . . . . . . . . . . . . 133
11.2. General Scan Settings . . . . . . . . . . . . . . . . . . . . . . . . . . . . . . . . 133
11.3. Preamble Scanning . . . . . . . . . . . . . . . . . . . . . . . . . . . . . . . . . . . 134
11.3.1. Preamble Scan Specific Settings . . . . . . . . . . . . . . . . . . . 134
11.4. RSSI (CW) Scanning. . . . . . . . . . . . . . . . . . . . . . . . . . . . . . . . . . 136
11.5. Presentation . . . . . . . . . . . . . . . . . . . . . . . . . . . . . . . . . . . . . . . . 136
12. Command Sequences (with Data Service
Testing)
137
12.1. Capabilities of Phones. . . . . . . . . . . . . . . . . . . . . . . . . . . . . . . . . 137
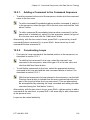
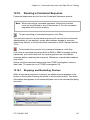
12.2. Composing and Editing a Command Sequence . . . . . . . . . . . . . 137
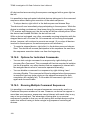
12.2.1. Adding a Command to the Command Sequence. . . . . . . 139
12.2.2. Constructing Loops . . . . . . . . . . . . . . . . . . . . . . . . . . . . . 139
12.2.3. Editing the Command Sequence . . . . . . . . . . . . . . . . . . . 140
12.3. Command Categories . . . . . . . . . . . . . . . . . . . . . . . . . . . . . . . . . 140
12.4. Assigning Commands to Phones . . . . . . . . . . . . . . . . . . . . . . . . 140
12.5. Timeouts . . . . . . . . . . . . . . . . . . . . . . . . . . . . . . . . . . . . . . . . . . . 142
12.6. General Commands . . . . . . . . . . . . . . . . . . . . . . . . . . . . . . . . . . 143
12.7. Recording Commands. . . . . . . . . . . . . . . . . . . . . . . . . . . . . . . . . 144
12.8. Voice/Video Commands . . . . . . . . . . . . . . . . . . . . . . . . . . . . . . . 145
12.9. Equipment Control Commands . . . . . . . . . . . . . . . . . . . . . . . . . . 147
12.10. Application Testing Commands: General . . . . . . . . . . . . . . . . . 147
12.11. Commands for Dial-up Networking Sessions . . . . . . . . . . . . . . 148
12.11.1. Connect Commands. . . . . . . . . . . . . . . . . . . . . . . . . . . . 148
12.11.1.1. Dial Up, Hang Up . . . . . . . . . . . . . . . . . . . . . . . . 148
12.11.1.2. PS Attach, PS Detach . . . . . . . . . . . . . . . . . . . . . 151
12.11.2. Session Commands . . . . . . . . . . . . . . . . . . . . . . . . . . . . 151
12.11.2.1. About Phonebook Entries . . . . . . . . . . . . . . . . . . 151
12.11.2.2. Timeout Parameters for Session Commands . . . 152
12.11.2.3. FTP . . . . . . . . . . . . . . . . . . . . . . . . . . . . . . . . . . . 153
12.11.2.4. HTTP . . . . . . . . . . . . . . . . . . . . . . . . . . . . . . . . . . 155
12.11.2.5. Ping . . . . . . . . . . . . . . . . . . . . . . . . . . . . . . . . . . . 156
12.11.2.6. E-mail . . . . . . . . . . . . . . . . . . . . . . . . . . . . . . . . . 156
12.11.2.7. Video Streaming . . . . . . . . . . . . . . . . . . . . . . . . . 158
12.12. Commands for SMS, MMS, and WAP . . . . . . . . . . . . . . . . . . . 160
12.13. Commands for KPI Calculation (UMTS) . . . . . . . . . . . . . . . . . . 163
LZT 108 9851 R1B
vii
TEMS Investigation 9.0 Data Collection User’s Manual
12.14. Tips and Tricks . . . . . . . . . . . . . . . . . . . . . . . . . . . . . . . . . . . . .
12.14.1. Synchronization . . . . . . . . . . . . . . . . . . . . . . . . . . . . . . .
12.14.2. MS and DC Assignment. . . . . . . . . . . . . . . . . . . . . . . . .
12.14.3. Collecting Data for RAN Tuning Reports . . . . . . . . . . . .
12.14.4. Windows Vista and IPv6 . . . . . . . . . . . . . . . . . . . . . . . .
12.15. Command Sequence Properties. . . . . . . . . . . . . . . . . . . . . . . .
12.16. Running a Command Sequence. . . . . . . . . . . . . . . . . . . . . . . .
12.16.1. Stopping and Restarting Devices. . . . . . . . . . . . . . . . . .
12.16.2. Options for Individual Commands . . . . . . . . . . . . . . . . .
12.16.3. Running Multiple Command Sequences . . . . . . . . . . . .
12.17. Presentation of Data Service Testing . . . . . . . . . . . . . . . . . . . .
12.18. Saving and Loading Command Sequences . . . . . . . . . . . . . . .
12.19. Data Session Error Messages . . . . . . . . . . . . . . . . . . . . . . . . .
12.19.1. General Data Service Error Messages . . . . . . . . . . . . .
12.19.2. RAS Error Messages . . . . . . . . . . . . . . . . . . . . . . . . . . .
12.19.3. FTP Error Messages . . . . . . . . . . . . . . . . . . . . . . . . . . .
12.19.4. E-mail Error Messages . . . . . . . . . . . . . . . . . . . . . . . . .
12.19.5. Video Streaming Error Messages . . . . . . . . . . . . . . . . .
12.19.6. MMS Error Messages . . . . . . . . . . . . . . . . . . . . . . . . . .
12.19.7. WAP Error Messages . . . . . . . . . . . . . . . . . . . . . . . . . .
13. Device Properties
178
13.1. Overview of Control Function Support in Devices . . . . . . . . . . .
13.2. Properties of Sony Ericsson Phones . . . . . . . . . . . . . . . . . . . . .
13.2.1. General Properties. . . . . . . . . . . . . . . . . . . . . . . . . . . . . .
13.2.1.1. Access Class Control Tab. . . . . . . . . . . . . . . . . . .
13.2.1.2. Call Tab. . . . . . . . . . . . . . . . . . . . . . . . . . . . . . . . .
13.2.1.3. Discard Messages Tab . . . . . . . . . . . . . . . . . . . . .
13.2.1.4. Lock on PLMN Tab . . . . . . . . . . . . . . . . . . . . . . . .
13.2.2. WCDMA Properties . . . . . . . . . . . . . . . . . . . . . . . . . . . . .
13.2.2.1. BLER Target Tab . . . . . . . . . . . . . . . . . . . . . . . . .
13.2.2.2. RAT Control Tab . . . . . . . . . . . . . . . . . . . . . . . . . .
13.2.2.3. WCDMA Cell Bar Control Tab. . . . . . . . . . . . . . . .
13.2.2.4. WCDMA Cell Selection Control Tab . . . . . . . . . . .
13.2.2.5. WCDMA RRC Radio Capability Control Tab . . . .
13.2.2.6. Tabs Listing Messages and Mode Reports. . . . . .
13.2.3. GSM Properties . . . . . . . . . . . . . . . . . . . . . . . . . . . . . . . .
13.2.3.1. GSM Band Control Tab. . . . . . . . . . . . . . . . . . . . .
13.2.3.2. GSM C/A Tab . . . . . . . . . . . . . . . . . . . . . . . . . . . .
viii
164
164
165
165
166
166
167
167
168
168
169
169
169
170
171
172
173
174
175
177
178
180
180
180
181
182
182
182
182
183
184
184
186
186
187
187
187
Contents
13.2.3.3. GSM Dedicated Mode Tab (and Related Toolbar
Buttons) . . . . . . . . . . . . . . . . . . . . . . . . . . . . . . 187
13.2.3.4. GSM EDGE Capability Control Tab . . . . . . . . . . . 188
13.2.3.5. GSM Idle Mode Tab . . . . . . . . . . . . . . . . . . . . . . . 188
13.2.3.6. GSM Speech Codec Tab . . . . . . . . . . . . . . . . . . . 190
13.2.3.7. GSM TxPower Control Tab . . . . . . . . . . . . . . . . . . 190
13.3. Properties of Motorola UEs . . . . . . . . . . . . . . . . . . . . . . . . . . . . . 190
13.3.1. Logs . . . . . . . . . . . . . . . . . . . . . . . . . . . . . . . . . . . . . . . . . 190
13.3.1.1. Basic Logs Tab . . . . . . . . . . . . . . . . . . . . . . . . . . . 191
13.3.1.2. Extended Logs Tab . . . . . . . . . . . . . . . . . . . . . . . . 192
13.3.2. Control Functionality. . . . . . . . . . . . . . . . . . . . . . . . . . . . . 192
13.3.2.1. RAT/Band/Frequency/Cell Lock Tab. . . . . . . . . . . 193
13.3.2.2. UE Handling Tab . . . . . . . . . . . . . . . . . . . . . . . . . . 193
13.3.2.3. Cell Barring Tab . . . . . . . . . . . . . . . . . . . . . . . . . . 194
13.3.2.4. Layer 3 Ignore Tab . . . . . . . . . . . . . . . . . . . . . . . . 194
13.3.2.5. SMS Tab . . . . . . . . . . . . . . . . . . . . . . . . . . . . . . . . 194
13.4. Properties of Nokia UEs . . . . . . . . . . . . . . . . . . . . . . . . . . . . . . . 195
13.4.1. Band/Channel Control Tab. . . . . . . . . . . . . . . . . . . . . . . . 195
13.4.2. Cell Barring Tab . . . . . . . . . . . . . . . . . . . . . . . . . . . . . . . . 195
13.4.3. RAT Lock Tab . . . . . . . . . . . . . . . . . . . . . . . . . . . . . . . . . 195
13.4.4. Sector Lock Tab . . . . . . . . . . . . . . . . . . . . . . . . . . . . . . . . 195
13.5. Properties of Nokia GSM Phones . . . . . . . . . . . . . . . . . . . . . . . . 196
13.5.1. Band/Channel Control Tab. . . . . . . . . . . . . . . . . . . . . . . . 196
13.5.2. Cell Barring Tab . . . . . . . . . . . . . . . . . . . . . . . . . . . . . . . . 196
13.5.3. FTD (Field Test Display) Log Mask Tab. . . . . . . . . . . . . . 197
13.5.4. GAN Mode Selection Tab. . . . . . . . . . . . . . . . . . . . . . . . . 198
13.5.5. Trace Log Mask Tab . . . . . . . . . . . . . . . . . . . . . . . . . . . . 199
13.6. Properties of Qualcomm Chipset Based Devices . . . . . . . . . . . . 200
13.6.1. Data Reduction Tab (CDMA) . . . . . . . . . . . . . . . . . . . . . . 201
13.6.2. NV Item Read/Write Tab (UMTS). . . . . . . . . . . . . . . . . . . 201
13.7. Properties of GPS Units . . . . . . . . . . . . . . . . . . . . . . . . . . . . . . . 202
14. Events
203
14.1. Presentation of Events . . . . . . . . . . . . . . . . . . . . . . . . . . . . . . . . 203
14.2. Predefined and User-defined Events . . . . . . . . . . . . . . . . . . . . . 203
14.3. Setting Up a User-defined Event. . . . . . . . . . . . . . . . . . . . . . . . . 203
14.3.1. Adding a Layer 3 Message to the Event Expression . . . . 204
14.3.2. Adding an Information Element Criterion to the Event
Expression . . . . . . . . . . . . . . . . . . . . . . . . . . . . . . . . . . 205
14.3.3. Adding an Event to the Event Expression . . . . . . . . . . . . 205
LZT 108 9851 R1B
ix
TEMS Investigation 9.0 Data Collection User’s Manual
14.3.4. Adding an Operator/Delimiter to the Event Expression . .
14.4. Editing User-defined Events . . . . . . . . . . . . . . . . . . . . . . . . . . . .
14.5. Deleting User-defined Events . . . . . . . . . . . . . . . . . . . . . . . . . . .
14.6. Example of Event Definition . . . . . . . . . . . . . . . . . . . . . . . . . . . .
14.7. Audio Indications for Events . . . . . . . . . . . . . . . . . . . . . . . . . . . .
14.7.1. Adding Audio Indications . . . . . . . . . . . . . . . . . . . . . . . . .
14.7.2. Editing Audio Indications . . . . . . . . . . . . . . . . . . . . . . . . .
14.7.3. Activating Audio Indications . . . . . . . . . . . . . . . . . . . . . . .
14.7.4. Deactivating Audio Indications. . . . . . . . . . . . . . . . . . . . .
14.7.5. Muting All Audio Indications. . . . . . . . . . . . . . . . . . . . . . .
14.7.6. Saving and Loading Audio Indications. . . . . . . . . . . . . . .
14.7.7. Deleting Audio Indications . . . . . . . . . . . . . . . . . . . . . . . .
15. Presentation: Basics
211
15.1. The Data: Information Elements and Events . . . . . . . . . . . . . . .
15.2. Types of Presentation Window . . . . . . . . . . . . . . . . . . . . . . . . . .
15.3. Window Updating and Synchronization . . . . . . . . . . . . . . . . . . .
15.4. Color Ranges . . . . . . . . . . . . . . . . . . . . . . . . . . . . . . . . . . . . . . .
15.5. Other Window Properties . . . . . . . . . . . . . . . . . . . . . . . . . . . . . .
15.6. Export/Import of Presentation Windows . . . . . . . . . . . . . . . . . . .
15.6.1. Export. . . . . . . . . . . . . . . . . . . . . . . . . . . . . . . . . . . . . . . .
15.6.2. Import. . . . . . . . . . . . . . . . . . . . . . . . . . . . . . . . . . . . . . . .
16. Status Windows
206
206
206
206
208
208
209
209
209
209
210
210
211
211
212
212
213
213
213
213
214
16.1. General . . . . . . . . . . . . . . . . . . . . . . . . . . . . . . . . . . . . . . . . . . . . 214
16.2. Setting Up Status Window Contents. . . . . . . . . . . . . . . . . . . . . . 214
16.3. Changing Status Window Properties . . . . . . . . . . . . . . . . . . . . . 217
17. Event Counter Windows
220
17.1. Window Tabs . . . . . . . . . . . . . . . . . . . . . . . . . . . . . . . . . . . . . . .
17.2. Copying Window Contents . . . . . . . . . . . . . . . . . . . . . . . . . . . . .
17.3. Resetting Event Counter Windows . . . . . . . . . . . . . . . . . . . . . .
17.4. Changing Event Counter Window Contents and Properties . . . .
17.4.1. General Tab . . . . . . . . . . . . . . . . . . . . . . . . . . . . . . . . . . .
17.4.2. Events Tab. . . . . . . . . . . . . . . . . . . . . . . . . . . . . . . . . . . .
x
220
220
221
221
221
221
Contents
18. Message Windows
222
18.1. Changing Message Window Contents and Properties . . . . . . . . 222
18.1.1. General Tab . . . . . . . . . . . . . . . . . . . . . . . . . . . . . . . . . . . 222
18.1.2. Messages Tab . . . . . . . . . . . . . . . . . . . . . . . . . . . . . . . . . 222
18.1.3. Events Tab . . . . . . . . . . . . . . . . . . . . . . . . . . . . . . . . . . . . 223
18.1.4. Columns Tab . . . . . . . . . . . . . . . . . . . . . . . . . . . . . . . . . . 223
18.2. Plain-text Message Decoding . . . . . . . . . . . . . . . . . . . . . . . . . . . 223
18.3. Presentation of Discarded Messages . . . . . . . . . . . . . . . . . . . . . 224
18.4. Message Window Catch-up . . . . . . . . . . . . . . . . . . . . . . . . . . . . 224
18.5. Message Window Synchronization . . . . . . . . . . . . . . . . . . . . . . . 224
18.6. Freezing a Message Window . . . . . . . . . . . . . . . . . . . . . . . . . . . 225
18.7. Window-specific Features . . . . . . . . . . . . . . . . . . . . . . . . . . . . . . 225
18.7.1. IP Analysis Window . . . . . . . . . . . . . . . . . . . . . . . . . . . . . 225
18.7.2. Mode Reports Window . . . . . . . . . . . . . . . . . . . . . . . . . . . 226
19. Video Streaming and the Video Monitor
(UMTS)
227
19.1. How to Test Video Streaming . . . . . . . . . . . . . . . . . . . . . . . . . . . 227
19.2. The Video Monitor . . . . . . . . . . . . . . . . . . . . . . . . . . . . . . . . . . . . 228
19.2.1. Properties of the Video Monitor . . . . . . . . . . . . . . . . . . . . 228
19.3. Evaluating Video Streaming Performance . . . . . . . . . . . . . . . . . 229
19.4. Troubleshooting Video Streaming . . . . . . . . . . . . . . . . . . . . . . . . 229
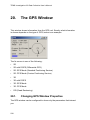
20. The GPS Window
230
20.1. Changing GPS Window Properties . . . . . . . . . . . . . . . . . . . . . . . 230
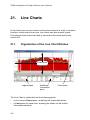
21. Line Charts
232
21.1. Organization of the Line Chart Window. . . . . . . . . . . . . . . . . . . . 232
21.2. Contents of the Line Chart Panes . . . . . . . . . . . . . . . . . . . . . . . . 233
21.3. Time Scale . . . . . . . . . . . . . . . . . . . . . . . . . . . . . . . . . . . . . . . . . 234
21.4. Changing Line Chart Contents and Properties . . . . . . . . . . . . . . 235
21.4.1. Adding Charts. . . . . . . . . . . . . . . . . . . . . . . . . . . . . . . . . . 235
21.4.2. Editing General Properties of a Chart . . . . . . . . . . . . . . . 235
21.4.3. Editing the Contents of a Chart . . . . . . . . . . . . . . . . . . . . 235
21.4.4. Presenting Data from a Different Device . . . . . . . . . . . . . 239
21.4.5. Deleting a Chart . . . . . . . . . . . . . . . . . . . . . . . . . . . . . . . . 239
LZT 108 9851 R1B
xi
TEMS Investigation 9.0 Data Collection User’s Manual
21.5. Exporting the Line Chart Window . . . . . . . . . . . . . . . . . . . . . . . . 239
22. Bar Charts
240
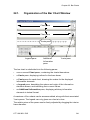
22.1. Organization of the Bar Chart Window . . . . . . . . . . . . . . . . . . . .
22.2. Contents of the Bar Chart Panes . . . . . . . . . . . . . . . . . . . . . . . .
22.3. Setting Up General Bar Chart Properties . . . . . . . . . . . . . . . . . .
22.3.1. Adding Charts . . . . . . . . . . . . . . . . . . . . . . . . . . . . . . . . .
22.3.2. Deleting a Chart . . . . . . . . . . . . . . . . . . . . . . . . . . . . . . . .
22.3.3. Editing General Properties of a Chart . . . . . . . . . . . . . . .
22.4. Setting Up Bar Chart Contents . . . . . . . . . . . . . . . . . . . . . . . . . .
22.4.1. Presentation Mode, Data, Colors . . . . . . . . . . . . . . . . . . .
22.4.1.1. Single IE Presentation Mode. . . . . . . . . . . . . . . . .
22.4.1.2. Multiple IE Components Presentation Mode. . . . .
22.4.1.3. Parallel Coordinates/Stacked Bar Chart
Presentation Mode . . . . . . . . . . . . . . . . . . . . . .
22.4.2. Interval and Labeling . . . . . . . . . . . . . . . . . . . . . . . . . . . .
22.4.3. Additional Information . . . . . . . . . . . . . . . . . . . . . . . . . . .
22.4.4. Presenting Data from a Different Device . . . . . . . . . . . . .
22.5. Examples of Bar Chart Presentations. . . . . . . . . . . . . . . . . . . . .
22.6. Exporting the Bar Chart Window. . . . . . . . . . . . . . . . . . . . . . . . .
23. Map Windows
250
254
255
255
256
258
259
23.1. Highlights of This Chapter. . . . . . . . . . . . . . . . . . . . . . . . . . . . . .
23.2. Map Concepts. . . . . . . . . . . . . . . . . . . . . . . . . . . . . . . . . . . . . . .
23.3. Constructing a GeoSet from Map Files. . . . . . . . . . . . . . . . . . . .
23.4. Positioning Bitmap and TIF Maps . . . . . . . . . . . . . . . . . . . . . . . .
23.4.1. Specifying the Map Position. . . . . . . . . . . . . . . . . . . . . . .
23.4.2. Specifying the Map Scale . . . . . . . . . . . . . . . . . . . . . . . .
23.4.3. Setting the Map’s North Direction . . . . . . . . . . . . . . . . . .
23.5. Presenting Data: Themes . . . . . . . . . . . . . . . . . . . . . . . . . . . . . .
23.5.1. Themes and Theme Types . . . . . . . . . . . . . . . . . . . . . . .
23.5.2. Presentation Layers . . . . . . . . . . . . . . . . . . . . . . . . . . . . .
23.5.3. Presenting Information Elements . . . . . . . . . . . . . . . . . . .
23.5.3.1. Notes on Route Plotting and Updating . . . . . . . . .
23.5.4. Presenting Events . . . . . . . . . . . . . . . . . . . . . . . . . . . . . .
23.5.5. Presenting Cell Information . . . . . . . . . . . . . . . . . . . . . . .
23.5.5.1. The Cell Theme. . . . . . . . . . . . . . . . . . . . . . . . . . .
23.5.5.2. The Cell Line Theme. . . . . . . . . . . . . . . . . . . . . . .
23.5.5.3. The Cell Color Theme . . . . . . . . . . . . . . . . . . . . . .
xii
241
242
243
243
243
244
244
245
246
247
259
259
260
262
262
263
263
263
264
264
265
267
268
269
270
272
275
Contents
23.5.5.4. The Cell ARFCN Theme (GSM) . . . . . . . . . . . . . . 278
23.5.6. Presenting Pinpointing . . . . . . . . . . . . . . . . . . . . . . . . . . . 279
23.5.7. Editing Themes . . . . . . . . . . . . . . . . . . . . . . . . . . . . . . . . 280
23.5.8. Visibility of Themes . . . . . . . . . . . . . . . . . . . . . . . . . . . . . 280
23.5.9. Reordering Themes . . . . . . . . . . . . . . . . . . . . . . . . . . . . . 280
23.5.10. Deleting Themes . . . . . . . . . . . . . . . . . . . . . . . . . . . . . . 281
23.6. The Right-hand Pane . . . . . . . . . . . . . . . . . . . . . . . . . . . . . . . . . 281
23.6.1. Information on Single Theme Markers (Info Tab). . . . . . . 281
23.6.2. Theme Statistics (Info and Graph Tabs) . . . . . . . . . . . . . 282
23.6.3. Theme Legend (Legend Tab). . . . . . . . . . . . . . . . . . . . . . 283
23.7. Layers . . . . . . . . . . . . . . . . . . . . . . . . . . . . . . . . . . . . . . . . . . . . . 283
23.7.1. Adding Presentation Layers . . . . . . . . . . . . . . . . . . . . . . . 284
23.7.2. Layer Control . . . . . . . . . . . . . . . . . . . . . . . . . . . . . . . . . . 284
23.8. Map Context Menu . . . . . . . . . . . . . . . . . . . . . . . . . . . . . . . . . . . 286
23.8.1. The Scale Bar. . . . . . . . . . . . . . . . . . . . . . . . . . . . . . . . . . 286
23.8.2. Previous View. . . . . . . . . . . . . . . . . . . . . . . . . . . . . . . . . . 286
23.8.3. View Entire Layer . . . . . . . . . . . . . . . . . . . . . . . . . . . . . . . 286
23.8.4. Setting the Map Projection . . . . . . . . . . . . . . . . . . . . . . . . 286
23.9. The Map Window Toolbar . . . . . . . . . . . . . . . . . . . . . . . . . . . . . . 286
23.10. GeoSet Manager . . . . . . . . . . . . . . . . . . . . . . . . . . . . . . . . . . . . 288
23.10.1. Layer Control . . . . . . . . . . . . . . . . . . . . . . . . . . . . . . . . . 288
23.10.2. Projections . . . . . . . . . . . . . . . . . . . . . . . . . . . . . . . . . . . 288
24. The General Window
289
25. Key Performance Indicators – KPIs (UMTS)
290
25.1. Purpose of KPIs . . . . . . . . . . . . . . . . . . . . . . . . . . . . . . . . . . . . . 290
25.1.1. Accessibility . . . . . . . . . . . . . . . . . . . . . . . . . . . . . . . . . . . 290
25.1.2. Retainability . . . . . . . . . . . . . . . . . . . . . . . . . . . . . . . . . . . 291
25.1.3. Integrity. . . . . . . . . . . . . . . . . . . . . . . . . . . . . . . . . . . . . . . 291
25.2. Obtaining KPIs in TEMS Investigation . . . . . . . . . . . . . . . . . . . . 291
25.2.1. General Procedure . . . . . . . . . . . . . . . . . . . . . . . . . . . . . . 291
25.2.2. Points to Bear in Mind . . . . . . . . . . . . . . . . . . . . . . . . . . . 292
26. Speech Quality Index – SQI (UMTS)
293
26.1. Background . . . . . . . . . . . . . . . . . . . . . . . . . . . . . . . . . . . . . . . . . 293
26.2. Input to the SQI-MOS Algorithm . . . . . . . . . . . . . . . . . . . . . . . . . 293
LZT 108 9851 R1B
xiii
TEMS Investigation 9.0 Data Collection User’s Manual
26.3. SQI-MOS Output. . . . . . . . . . . . . . . . . . . . . . . . . . . . . . . . . . . . .
26.4. Alignment of SQI-MOS and PESQ . . . . . . . . . . . . . . . . . . . . . . .
26.4.1. Notes on PESQ for Wideband . . . . . . . . . . . . . . . . . . . . .
26.5. Comparison with Other Radio Parameters . . . . . . . . . . . . . . . . .
294
295
296
297
27. Audio Quality Measurement (AQM) including
PESQ
298
27.1. Audio Quality Measurement in TEMS Investigation . . . . . . . . . .
27.2. Obtaining and Presenting AQM Data . . . . . . . . . . . . . . . . . . . . .
27.2.1. Prerequisites . . . . . . . . . . . . . . . . . . . . . . . . . . . . . . . . . .
27.2.2. Practical Considerations . . . . . . . . . . . . . . . . . . . . . . . . .
27.2.3. Recording AQM Data. . . . . . . . . . . . . . . . . . . . . . . . . . . .
27.3. Merging Uplink AQM Data into Logfiles . . . . . . . . . . . . . . . . . . .
27.4. Presenting AQM Data . . . . . . . . . . . . . . . . . . . . . . . . . . . . . . . . .
27.4.1. Information Elements . . . . . . . . . . . . . . . . . . . . . . . . . . . .
27.4.2. PESQ Key Performance Indicator (KPI) . . . . . . . . . . . . .
28. Video Telephony Quality Index – VTQI
303
28.1. General Properties of VTQI . . . . . . . . . . . . . . . . . . . . . . . . . . . .
28.2. What VTQI Is Based On . . . . . . . . . . . . . . . . . . . . . . . . . . . . . . .
28.3. What VTQI Does Not Consider. . . . . . . . . . . . . . . . . . . . . . . . . .
28.4. Update Rate . . . . . . . . . . . . . . . . . . . . . . . . . . . . . . . . . . . . . . . .
29. Video Streaming Quality Index – VSQI
303
303
304
304
305
29.1. General Properties of VSQI . . . . . . . . . . . . . . . . . . . . . . . . . . . .
29.2. What VSQI Is Based On . . . . . . . . . . . . . . . . . . . . . . . . . . . . . . .
29.3. What VSQI Does Not Consider. . . . . . . . . . . . . . . . . . . . . . . . . .
29.4. Static and Dynamic VSQI . . . . . . . . . . . . . . . . . . . . . . . . . . . . . .
29.4.1. Static VSQI . . . . . . . . . . . . . . . . . . . . . . . . . . . . . . . . . . .
29.4.2. Dynamic (Realtime) VSQI . . . . . . . . . . . . . . . . . . . . . . . .
30. C/I Measurement (GSM)
298
300
300
300
300
301
302
302
302
305
305
306
306
306
307
309
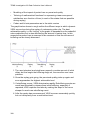
30.1. Why C/I? . . . . . . . . . . . . . . . . . . . . . . . . . . . . . . . . . . . . . . . . . . . 309
30.2. Requirements on a Robust C/I Measure. . . . . . . . . . . . . . . . . . . 309
30.3. Details on C/I Measurements . . . . . . . . . . . . . . . . . . . . . . . . . . . 310
xiv
Contents
30.4. Accuracy . . . . . . . . . . . . . . . . . . . . . . . . . . . . . . . . . . . . . . . . . . . 310
30.5. An Example . . . . . . . . . . . . . . . . . . . . . . . . . . . . . . . . . . . . . . . . . 310
31. Uplink (MTR) Data (GSM)
312
31.1. Uplink Data: MTR Files . . . . . . . . . . . . . . . . . . . . . . . . . . . . . . . . 312
31.1.1. Supported MTR File Versions . . . . . . . . . . . . . . . . . . . . . 312
31.2. Utilizing Data from Uplink Files . . . . . . . . . . . . . . . . . . . . . . . . . . 313
31.2.1. Uplink Data on Handovers . . . . . . . . . . . . . . . . . . . . . . . . 313
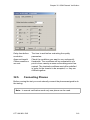
31.3. Merging Uplink Files with TEMS Logfiles . . . . . . . . . . . . . . . . . . 313
31.4. Presentation of Uplink Data. . . . . . . . . . . . . . . . . . . . . . . . . . . . . 313
32. GSM Channel Verification
315
32.1. The GSM Channel Verification Window . . . . . . . . . . . . . . . . . . . 315
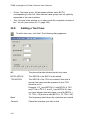
32.2. Adding a Test Case. . . . . . . . . . . . . . . . . . . . . . . . . . . . . . . . . . . 316
32.3. Editing and Removing Test Cases . . . . . . . . . . . . . . . . . . . . . . . 317
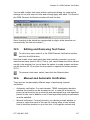
32.4. Manual and Automatic Verification . . . . . . . . . . . . . . . . . . . . . . . 317
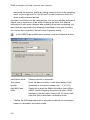
32.5. Connecting Phones . . . . . . . . . . . . . . . . . . . . . . . . . . . . . . . . . . . 319
32.6. Running the Test . . . . . . . . . . . . . . . . . . . . . . . . . . . . . . . . . . . . . 320
32.6.1. Getting Started . . . . . . . . . . . . . . . . . . . . . . . . . . . . . . . . . 320
32.6.2. Manual Verification. . . . . . . . . . . . . . . . . . . . . . . . . . . . . . 320
32.6.3. Automatic Verification. . . . . . . . . . . . . . . . . . . . . . . . . . . . 321
32.6.4. Example . . . . . . . . . . . . . . . . . . . . . . . . . . . . . . . . . . . . . . 321
32.7. Stopping the Test . . . . . . . . . . . . . . . . . . . . . . . . . . . . . . . . . . . . 322
32.8. Resetting a Test Case. . . . . . . . . . . . . . . . . . . . . . . . . . . . . . . . . 322
32.9. Summary of Test Case Status Values . . . . . . . . . . . . . . . . . . . . 322
32.10. Creating Test Reports . . . . . . . . . . . . . . . . . . . . . . . . . . . . . . . . 323
32.11. Saving and Opening Tests . . . . . . . . . . . . . . . . . . . . . . . . . . . . 324
32.12. Notes on Performance . . . . . . . . . . . . . . . . . . . . . . . . . . . . . . . 324
32.13. Error Conditions . . . . . . . . . . . . . . . . . . . . . . . . . . . . . . . . . . . . 324
33. Support Contact Information
326
Appendix A. Keyboard Shortcuts
327
A.1. General Shortcuts . . . . . . . . . . . . . . . . . . . . . . . . . . . . . . . . . . . . . 327
A.2. Drive Testing Shortcuts. . . . . . . . . . . . . . . . . . . . . . . . . . . . . . . . . 327
LZT 108 9851 R1B
xv
TEMS Investigation 9.0 Data Collection User’s Manual
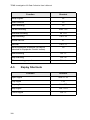
A.3. Replay Shortcuts . . . . . . . . . . . . . . . . . . . . . . . . . . . . . . . . . . . . . 328
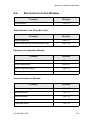
A.4. Shortcuts for Active Window. . . . . . . . . . . . . . . . . . . . . . . . . . . . . 329
Appendix B. File Types in TEMS Investigation
Data Collection
331
Appendix C. Manual Enabling of External
Equipment
332
C.1. Phones . . . . . . . . . . . . . . . . . . . . . . . . . . . . . . . . . . . . . . . . . . . . . 332
C.2. Scanners . . . . . . . . . . . . . . . . . . . . . . . . . . . . . . . . . . . . . . . . . . . 336
C.3. GPS Units. . . . . . . . . . . . . . . . . . . . . . . . . . . . . . . . . . . . . . . . . . . 337
Appendix D. Text Export Format for Logfiles
338
D.1. General. . . . . . . . . . . . . . . . . . . . . . . . . . . . . . . . . . . . . . . . . . . . . 338
D.2. File Header. . . . . . . . . . . . . . . . . . . . . . . . . . . . . . . . . . . . . . . . . . 338
D.3. Data . . . . . . . . . . . . . . . . . . . . . . . . . . . . . . . . . . . . . . . . . . . . . . . 339
Appendix E. Notes on Third-party Logfile Export
Formats
340
E.1. Export to MapInfo . . . . . . . . . . . . . . . . . . . . . . . . . . . . . . . . . . . . .
E.2. Export to ArcView . . . . . . . . . . . . . . . . . . . . . . . . . . . . . . . . . . . . .
E.3. Export to Marconi Planet . . . . . . . . . . . . . . . . . . . . . . . . . . . . . . .
E.4. Export to Ethereal. . . . . . . . . . . . . . . . . . . . . . . . . . . . . . . . . . . . .
E.5. Export to MDM . . . . . . . . . . . . . . . . . . . . . . . . . . . . . . . . . . . . . . .
Appendix F. Logfile Report
342
F.1. Header . . . . . . . . . . . . . . . . . . . . . . . . . . . . . . . . . . . . . . . . . . . . .
F.2. Logfile Information . . . . . . . . . . . . . . . . . . . . . . . . . . . . . . . . . . . .
F.3. Statistics . . . . . . . . . . . . . . . . . . . . . . . . . . . . . . . . . . . . . . . . . . . .
F.4. Charts . . . . . . . . . . . . . . . . . . . . . . . . . . . . . . . . . . . . . . . . . . . . . .
F.5. File and Directory Naming . . . . . . . . . . . . . . . . . . . . . . . . . . . . . .
F.5.1. Files . . . . . . . . . . . . . . . . . . . . . . . . . . . . . . . . . . . . . . . . . .
F.5.2. Directory . . . . . . . . . . . . . . . . . . . . . . . . . . . . . . . . . . . . . .
xvi
340
340
341
341
341
343
343
343
344
345
345
346
Contents
Appendix G. KPI Report (UMTS)
347
G.1. Report Header . . . . . . . . . . . . . . . . . . . . . . . . . . . . . . . . . . . . . . . 347
G.2. Overview of KPIs for Circuit-switched Services . . . . . . . . . . . . . . 347
G.2.1. Diagram of Circuit-switched KPIs and Timeouts . . . . . . . . 348
G.2.2. Service Non-Accessibility [%] . . . . . . . . . . . . . . . . . . . . . . 349
G.2.3. Setup Time [s] . . . . . . . . . . . . . . . . . . . . . . . . . . . . . . . . . . 349
G.2.4. Speech Quality on Sample Basis [dBQ] . . . . . . . . . . . . . . 349
G.2.5. Speech Quality, Call Average [MOS-PESQ] . . . . . . . . . . . 349
G.2.6. Call Cut-off Ratio [%] . . . . . . . . . . . . . . . . . . . . . . . . . . . . . 349
G.3. Overview of KPIs for Packet-switched Services. . . . . . . . . . . . . . 349
G.3.1. Diagrams of Packet-switched KPIs and Timeouts. . . . . . . 351
G.3.2. Service Independent KPIsv . . . . . . . . . . . . . . . . . . . . . . . . 356
G.3.3. General Data Service KPIs . . . . . . . . . . . . . . . . . . . . . . . . 357
G.3.4. WAP KPIs . . . . . . . . . . . . . . . . . . . . . . . . . . . . . . . . . . . . . 358
G.3.5. MMS KPIs . . . . . . . . . . . . . . . . . . . . . . . . . . . . . . . . . . . . . 358
G.3.6. Streaming KPIs . . . . . . . . . . . . . . . . . . . . . . . . . . . . . . . . . 359
G.4. Timeouts. . . . . . . . . . . . . . . . . . . . . . . . . . . . . . . . . . . . . . . . . . . . 360
G.4.1. Interdependence of KPIs; Dependence of KPIs on
Timeouts . . . . . . . . . . . . . . . . . . . . . . . . . . . . . . . . . . . . 361
G.5. Logfile Information . . . . . . . . . . . . . . . . . . . . . . . . . . . . . . . . . . . . 361
G.6. File and Directory Naming . . . . . . . . . . . . . . . . . . . . . . . . . . . . . . 361
G.6.1. Files . . . . . . . . . . . . . . . . . . . . . . . . . . . . . . . . . . . . . . . . . . 361
G.6.2. Directory . . . . . . . . . . . . . . . . . . . . . . . . . . . . . . . . . . . . . . 362
Appendix H. Technical Notes on PCTel Scanners 363
H.1. Reference Point for Signal Level Measurement . . . . . . . . . . . . . . 363
H.2. Antenna Cable Attenuation. . . . . . . . . . . . . . . . . . . . . . . . . . . . . . 363
Index
LZT 108 9851 R1B
365
xvii
TEMS Investigation 9.0 Data Collection User’s Manual
xviii
Chapter 1. Introduction
1.
Introduction
Thank you for choosing TEMS Investigation 9.0 – the leading air-interface
test tool for wireless networks. TEMS Investigation represents Ericsson’s
continuing commitment to Making Wireless Better.
To get the most out of TEMS Investigation, please take the time to read this
user manual in order to gain an in-depth understanding of the product
features.
We at Ericsson are confident that TEMS Investigation will satisfy all your
measurement needs and that it will become an indispensable tool in your
daily work.
LZT 108 9851 R1B
1
TEMS Investigation 9.0 Data Collection User’s Manual
1.1.
Fundamentals of TEMS Investigation 9.0
TEMS Investigation 9.0 is an air interface test tool for UMTS and CDMA
cellular networks, supporting all of
•
GSM/GPRS/EGPRS (including interaction with GAN [UMA])
•
WCDMA/HSDPA/HSUPA
•
cdmaOne/cdma2000/1xEV-DO
The product is also capable of scanning WiMAX carriers.
TEMS Investigation enables monitoring of voice and video telephony as well
as a variety of data services over packet-switched and circuit-switched
connections.
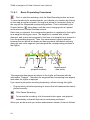
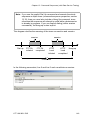
1.1.1.
Modules: Data Collection and Route Analysis
TEMS Investigation combines data collection, realtime analysis and postprocessing – all in one product. It is divided into two modules, Data Collection
and Route Analysis:
Data Collection
Route Analysis
Data Collection is the part of TEMS Investigation that interfaces with phones
and other measurement devices, collects data, and records it in logfiles. It
also allows presentation and analysis of a single logfile at a time. To
customers familiar with TEMS, the Data Collection module can be described
as essentially encompassing the functionality of the older technology-specific
2
Chapter 1. Introduction
products TEMS Investigation GSM, TEMS Investigation WCDMA, and TEMS
Investigation HSDPA. It also includes major functionality found in TEMS
Investigation CDMA 4.0.
Route Analysis is a module that permits rapid analysis of multiple logfiles,
originating from TEMS Investigation itself or from TEMS Automatic, TEMS
DriveTester, or TEMS Pocket. Statistical binning of logfile data by area, time,
or distance is supported.
The means of presentation – maps, line charts, and so on – are
fundamentally the same in both modules.
Route Analysis also includes RAN Tuning, a reporting tool for UMTS data
(packet-switched and circuit-switched). RAN Tuning evaluates the network in
terms of accessibility, mobility, coverage, and retainability. The output ranges
from management reports to detailed diagnostics.
1.1.2.
Package Options – Licensing
The data collection functionality is optional. Customers who dispense with
TEMS Investigation supported data collection are still able to use the nonrealtime functions of the Data Collection application (single-logfile replay,
logfile export, etc.). The Route Analysis component is always in the package.
Supported cellular technologies can be freely selected and combined, except
that WCDMA always comes with GSM support included.
The Base Package provides the ability to collect data with Sony Ericsson
phones in UMTS networks and with Qualcomm chipset based terminals in
CDMA networks. Other phones are licensed separately for each supplier or,
in the case of Qualcomm, for each chipset.
The Base Package permits data collection with one phone at a time. A
separate license option is available for collecting data with multiple phones
concurrently.
Audio quality measurement (AQM), including PESQ, is likewise sold as a
separate option. This option includes all required hardware as well as the
ability to connect that hardware to TEMS Investigation. Audio quality
measurement is supported for both GSM/WCDMA and CDMA.
1.1.3.
Connectable Equipment
TEMS Investigation 9.0 supports a wide variety of user terminals, including
ones from Sony Ericsson, LG, Motorola, Nokia, Qualcomm, Novatel, Sierra
LZT 108 9851 R1B
3
TEMS Investigation 9.0 Data Collection User’s Manual
Wireless, Option, and Samsung. They allow extensive monitoring of both
UMTS and CDMA networks and of GSM–UTRAN as well as
cdmaOne–cdma2000–1xEV-DO interaction.
GAN- (UMA-)capable GSM equipment is supported.
A variety of devices are supported for GSM, WCDMA, CDMA, and WiMAX
scanning.
GPS units can be connected for geographical positioning. Manual positioning
(“pinpointing”) is supported, with indoor measurements in mind.
See the Getting Started Manual, section 4.1 for further details on the range of
connectable equipment.
The number of external devices that can be connected simultaneously in the
application is dependent on many factors, such as whether a data service is
being run. See the Release Note for further information.
1.2.
What’s New in TEMS Investigation 9.0
1.2.1.
WiMAX Support
TEMS Investigation 9.0 introduces the ability to scan WiMAX carriers with a
DRT4301A WiMAX scanner. The supported bands are 2.3 GHz, 2.5 GHz,
and 3.5 GHz. (The 3.3 GHz band will be added in the future.)
WiMAX scanning capabilities are as follows:
•
WiMAX preamble scan
•
Continuous Wave scan
•
WiMAX MAC decoding
4
–
FCH
–
DL-MAP
–
UL-MAP
–
Downlink Channel Descriptors (DCD)
–
Uplink Channel Descriptors (UCD)
Chapter 1. Introduction
1.2.2.
Using the Sony Ericsson Z750i as Scanner
The Sony Ericsson Z750i phone can be used as a scanner in both GSM and
WCDMA networks and has a rich set of scan modes implemented. With its
wide frequency band coverage (WCDMA 850/1900/2100; GSM 850/900/
1800/1900) and its added benefit of reducing and potentially eliminating the
need for a far more expensive external scanner, the Sony Ericsson Z750i
offers excellent value for money as a scanning device for both GSM and
WCDMA.
1.2.3.
New and Strengthened WCDMA Scanning Modes
with Sony Ericsson Z750i
CPICH Scanning
The Sony Ericsson Z750i can perform CPICH scanning of up to 12
UARFCNs at a time. This is equivalent to the full number of carriers that can
be accommodated on the WCDMA 2100 MHz band (each carrier requiring
5 MHz of bandwidth).
RSCP, Ec/No, and timing are all obtained separately for each Rake finger.
System Information Message decoding can be performed as an option for
CPICH scanning. This captures a snapshot of the System Information
Messages once for each cell camped on. However, an additional mode is
also offered which focuses on continuous monitoring of System Information
messages. See “BCH Scanning” below.
BCH Scanning
This form of scanning is focused on System Information Message decoding.
One good reason to keep constant watch on System Information Messages is
to become thoroughly informed of cell configurations, not least neighbor
relations. An example of refined output in TEMS Investigation that can be
based on SIBs is the Missing Neighbor Detection event which warns about
missing neighbors in WCDMA.
One piece of data found in the SIB is an uplink interference measurement.
This is particularly interesting for HSUPA, where the guiding principle of
scheduling is to provide (as far as possible) all UEs with all the resources
they need while also making sure that the total uplink interference does not
exceed the accepted maximum. The uplink interference measurements are
extracted as information elements in TEMS Investigation.
LZT 108 9851 R1B
5
TEMS Investigation 9.0 Data Collection User’s Manual
Network Search
This function is highly useful for obtaining a bird’s-eye view of an unfamiliar
WCDMA network. It will detect all WCDMA carriers (UARFCNs) that are in
use on each WCDMA band (2100 MHz, 1900 MHz, 850 MHz). On each
carrier found, one cell is detected and presented.
In network search scanning mode it is also possible to detect inappropriate
allocation of UARFCNs resulting in carrier overlap. A mobile phone in regular
phone mode, once it has found a WCDMA carrier, automatically assumes
that there are no further UARFCNs within ±3 MHz of the detected carrier and
is therefore unable to spot overlapping carriers. In contrast, a Sony Ericsson
Z750i in scan mode is usually able to identify all carriers, overlapping or not,
thus allowing faulty frequency allocations to be easily found and rectified.
1.2.4.
GSM Scanning with Sony Ericsson Z750i
The Sony Ericsson Z750i is the first quad-band phone with GSM scanning
capability to be connectable in TEMS Investigation.
Note further that the GSM scanning mode can alternatively be used as a
spectrum analyzer for the purpose of detecting WCDMA carriers. This is
possible for all WCDMA bands that coincide with GSM bands (currently
including 850, 900, 1800, and 1900 MHz).
1.2.5.
Refined C/I Measurement for GSM
A more sophisticated algorithm has been introduced for computing C/I in
GSM networks. The new algorithm provides higher resolution at the top end
of the radio quality range. This is of great interest for packet-switched data
(EDGE in particular), because great performance improvements are obtained
as the C/I rises to 20 dB and beyond. In EDGE the maximum throughput per
timeslot is not approached until C/I goes up to around 35 dB: only then can
data be put through at full throttle, using the MCS-9 modulation coding
scheme which employs the smallest amount of channel error protection and
accommodates the largest payload.
1.2.6.
SQI-MOS for GSM and WCDMA
A new and thoroughly reworked SQI (Speech Quality Index) algorithm, used
to judge the user-perceived quality of GSM and WCDMA voice calls, is
introduced. The new SQI is presented on the MOS scale (1–5), and for this
reason it is referred to as “SQI-MOS”. The SQI algorithm has also been
6
Chapter 1. Introduction
recalibrated to align its output more closely with the PESQ speech quality
measure. Both of these changes serve to enhance the interpretability of SQI
scores.
The old SQI in dBQ (named simply “SQI” as before) is still available in the
product.
Like the old SQI model, the model producing SQI-MOS is wholly parametric,
which keeps the hardware requirements for its computation to a minimum.
1.2.7.
AQM (PESQ) for CDMA
Audio quality measurement with PESQ is now offered for CDMA as well. The
method of measurement and the interpretation of the results are the same as
for UMTS.
1.2.8.
WAP-based Streaming
WAP-based streaming setup is now available as an option in the command
sequence tool.
1.2.9.
WAP 2.0 Support
WAP 2.0 is now supported by the WAP and Video Streaming commands in
the command sequence.
1.2.10.
Support for New User Terminals
Please check the TEMS website for a completely up-to-date list of
connectable user terminals: www.ericsson.com/solutions/tems/support/
investigation/sup_ti.shtml. At the time of writing, the list of new connectable
user terminals is as follows:
UMTS
•
Sony Ericsson Z750i
•
Nokia N95
•
Nokia 6120
•
Nokia 6121
•
Motorola Razr2 V9 US
LZT 108 9851 R1B
7
TEMS Investigation 9.0 Data Collection User’s Manual
•
Sierra Wireless Aircard 880/880E
•
Sierra Wireless Aircard 881/881E
CDMA
•
LG RD6230
•
Samsung X799
1.2.11.
Support for New Scanners
Please check the TEMS website for a completely up-to-date list of
connectable scanners: www.ericsson.com/solutions/tems/support/
investigation/sup_ti.shtml. At the time of writing, the list of new connectable
scanners is as follows:
•
PCTel LX 1x 800
•
PCTel LX 1x 1900
•
PCTel LX 1x 800 Basic
•
PCTel LX 1x 1900 Basic
•
PCTel LX 1x 800/1900 Basic
1.2.12.
Support for New GPS Devices
•
NMEA-HS Holux GPSlim 236 BT
•
NMEA-HS Holux GPSlim 236 USB
1.2.13.
Support for Windows Vista
TEMS Investigation can now execute on PCs running Windows Vista.
1.2.14.
Enhanced TEMS Portfolio Compatibility
TEMS Investigation 9.0 can read logfiles from TEMS Automatic 7.0 and
TEMS Pocket 6.0.
8
Chapter 1. Introduction
1.3.
Other Recent New Features in TEMS
Investigation
This section recaps some other functionality added to TEMS Investigation
since the last major release (8.0).
1.3.1.
CDMA Support
TEMS Investigation has integrated CDMA support into what was previously a
UMTS-specific product. The cdmaOne, cdma2000, and EV-DO functionality
is broadly similar to what was previously found in the separate product TEMS
Investigation CDMA but also introduces important new features:
•
Data collection with terminals based on Qualcomm chipsets MSM5100
(cdma2000), MSM6500 (EV-DO Rev 0), and MSM6800 (EV-DO Rev A).
•
Wide range of radio and network measurements supported. A few
examples of areas covered:
•
•
–
Access Probe information
–
Finger information (cdma2000 and EV-DO)
–
Active Set (cdma2000 and EV-DO)
–
Details on forward and reverse link FCH, SCH0, and DCCH channels
–
cdma2000 soft handoff
Scanning with PCTel SeeGull LX:
–
Pilot scan mode: All pilots/selected pilots/Top N on one or several
frequencies.
–
“Follow phone” scan mode: In this mode, the scanner uses as
“master” a CDMA phone that is also connected in the application. The
scanner will at all times scan the same RF channel and PN offset that
the phone is using.
–
Information obtained in follow phone mode is extracted into new
information elements: Polluter search (including recent history) and
missing neighbor information.
–
RSSI (CW) scan mode.
TEMS Investigation logfiles can be exported in MDM format.
LZT 108 9851 R1B
9
TEMS Investigation 9.0 Data Collection User’s Manual
1.3.2.
HSUPA Support
Simply put, HSUPA (High Speed Uplink Packet Access) brings the same
refinements to the UTRAN uplink as HSDPA brought to its downlink. That is,
the purpose of HSUPA is to increase the maximum user throughput, to
decrease the user delay, and to increase the system capacity. HSUPA is also
known as Enhanced Uplink, EUL.
TEMS Investigation introduces a set of new information elements for
diagnosing HSUPA performance (beyond basic throughput values, which are
of course also obtained). These include: Average Serving Grant; Average ETFCI; DTX Rate; UE Happy Rate; New Transmission Rate; Retransmission
Rate; Number of times the transmission was limited by power; Number of
times the transmission was limited by serving grant.
Besides the information elements, HSUPA mode reports are presented in the
Mode Reports message window.
1.3.3.
GAN (UMA) Monitoring
TEMS Investigation supports the GAN-capable Nokia 6086 GSM handset.
Using this phone it is possible to
•
obtain GAN-specific information elements, including WLAN Signal Level
and RSSI, WLAN Access Point MAC Address and SSID;
•
generate GAN events: rove-in/rove-out; handover between GERAN and
GAN.
1.3.4.
Audio Quality Measurement (AQM) with PESQ
PESQ, short for Perceptual Evaluation of Speech Quality, is the industry
standard for speech quality measurement and a tried and tested tool in TEMS
Automatic. It is now available in TEMS Investigation also.
The PESQ algorithm measures end-to-end speech quality by comparing one
party's undistorted input signal (serving as reference) with the degraded
version of the same signal received by the other party. The severity of the
degradation as perceived by human listeners is assessed using highly refined
models of the human ear and the brain's processing of auditory input.
The PESQ algorithm is defined by the ITU standard P.862. For in-depth
information about PESQ, see also www.pesq.org.
Other audio quality measurements performed by TEMS Investigation include
echo delay, echo attenuation, and volume measurement.
10
Chapter 1. Introduction
1.3.5.
Video Telephony Quality Index (VTQI)
This is an Ericsson proprietary algorithm for judging the quality of video calls.
It is a no-reference method based primarily on BLER and on information
about the codec and bit rate used to encode the video and audio signals.
1.3.6.
Video Streaming and VSQI Enhancements
Video Streaming Testing
Video streaming testing has been extended to support live streaming, that is,
reception of live broadcasts and repeating playlists sent out from streaming
servers.
Video streaming can optionally be done through an RTSP proxy.
Streaming sessions are saved (to AVI files) exactly as they unfolded, i.e. with
rebuffering events included in the file.
Video Streaming Quality Inde4x (VSQI)
The VSQI quality measure for video streaming has been refined in various
ways, now conforming to ongoing standardization work within ITU-T where
Ericsson takes part. Refinements (all applying to static VSQI, as opposed to
the dynamic version) include:
•
General performance improvement (closer match with subjectively rated
quality)
•
Improved handling of packet loss
•
Improved handling of the combined effect of rebuffering and packet loss
1.3.7.
New Missing Neighbor Events
Missing Neighbor Events Based on Phone Data (GSM/WCDMA)
Two new Missing Neighbor events have been introduced which are triggered
by data from phones, thus providing a reliable indication of missing
neighbors. The new events supplement the pre-existing one (for WCDMA)
which is based on scan data only.
LZT 108 9851 R1B
11
TEMS Investigation 9.0 Data Collection User’s Manual
Missing Neighbor Events Based on Scanner-decoded Sys Info (GSM/
WCDMA)
TEMS Investigation already has several Missing Neighbor events, some
based on phone data and others based on scanner data. What is new in this
version is the ability to identify missing neighbors (in both GSM and WCDMA)
using only a PCTel SeeGull scanner, without relying on a cell file to indicate
existing neighbor relations. This is done by letting the scanner decode
System Information broadcast by the cell. The System Information contains
the cell's current neighbor list and so eliminates the need to have a cell file
loaded in the application.
1.3.8.
TPC per Cell (Sony Ericsson UEs)
This function enables inspection of power control commands from each cell in
the active set separately, as opposed to the aggregate power control decision
resulting from combining cells in soft handover. The cell-specific commands
can be read out from the plain-text decoding of the TPC per Cell mode report
delivered by Sony Ericsson UEs.
1.3.9.
Logfile Post-processing with Python Scripts
A new API is provided for extracting arbitrary data from logfiles – information
elements, events, plain-text decoding of messages – using Python scripts.
This is a powerful feature enabling users to do their post-processing any way
they like: compose customized reports, compute KPIs of their choice, etc. A
number of sample Python scripts are provided with the application.
1.3.10.
Route Analysis: New Tasks
The Route Analysis application has been augmented with two new tasks,
both using the Map window:
•
a benchmarking task, ideal for comparing PESQ and other quality
measures between operators
•
a filtering task for GSM, where the displaying of route markers is restricted
to user-selected values of ARFCN and BSIC.
12
Chapter 1. Introduction
1.3.11.
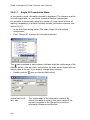
Event Counter Window in Data Collection
In the Data Collection application a new window has been created that keeps
track of how many times various events have occurred, in real time as well as
during replay. The set of events to display is fully user-configurable.
1.4.
What’s in This Manual (and What’s Not)
This book covers TEMS Investigation 9.0 Data Collection. It concentrates on
how to use that application once it has been installed and all external devices
are connected and ready for use. The manual gives a comprehensive
account of all functions in the Data Collection application.
A separate User’s Manual is provided for TEMS Investigation 9.0 Route
Analysis.
A further volume, Information Elements and Events, provides full details on all
IEs and events found in the two applications. It also lists and describes all
preconfigured presentation windows.
Besides these reference manuals, a Getting Started Manual is provided
which covers all preliminaries; crucially the following:
•
Configuring the PC for TEMS Investigation
•
Installing the TEMS Investigation software
•
Licensing issues
•
Configuring the PC and phones for data services
The chapter on connecting external equipment is found in the present
document.
External Equipment
The basics on external devices are covered in the Getting Started Manual,
chapter 4.
In the remainder of this book, external devices are discussed further
whenever certain capabilities are required in order for a function in TEMS
Investigation Data Collection to be supported. The manual does not describe
the full range of functions and capabilities of the connectable phones. For
exhaustive information, please refer to the documentation accompanying the
phones. The same applies to all other third-party products mentioned in the
manuals.
LZT 108 9851 R1B
13
TEMS Investigation 9.0 Data Collection User’s Manual
Data Service Testing
Configuration of the PC and external devices is covered in the Getting Started
Manual. The present document describes how to conduct data sessions from
within TEMS Investigation Data Collection using the command sequence
(see chapter 12).
Equipment Cases
The TEMS equipment cases, designed to accommodate phones and other
equipment during drive tests, are not covered here but have their own
manuals. These, however, sometimes refer to TEMS Investigation
documentation.
Readme File, Release Note
Some technical issues not addressed in this manual are dealt with in the file
Readme.rtf in the TEMS Investigation installation folder. The same
information is reproduced in the Release Note issued with the current
release.
FAQ
Many questions regarding TEMS Investigation are answered in the FAQ
sections found on the Web at www.ericsson.com/tems under the link “Tech
support”.
Technical Support
If you have a question about TEMS Investigation which is not answered in
any of the manuals nor in any of the other sources mentioned above, please
contact technical support. Contact information is given on the Web at
www.ericsson.com/tems under the link “Contact TEMS”.
TEMS On-line Subscription Service
To sign up for the TEMS on-line subscription service, please go to
www.ericsson.com/tems and click the link “TEMS Subscription Service”. This
free service includes e-mail notification of TEMS product launches, version
upgrades and patches, as well as the on-line newsletter TEMS News.
14
Chapter 1. Introduction
1.5.
Definitions
This section explains a number of central concepts in TEMS Investigation
Data Collection which are frequently referred to in this user manual.
Data Services
This term refers to services requiring a data connection (either circuitswitched or packet-switched), as opposed to voice calls.
Event
An event is a signal generated by the TEMS Investigation software in order to
indicate that something worthy of note has occurred, either in the cellular
network or in connected equipment. A number of events are predefined.
Besides these, you can define events of your own.
All predefined events are found in Information Elements and Events,
chapter 7.
User-defined events are specified by logical expressions which trigger the
event when they evaluate to true. These expressions can contain predefined
events, Layer 3 messages, and conditions involving information elements.
Information Element
Information elements are pieces of numeric or text-format data that are
presentable in the TEMS Investigation user interface. All information
elements handled by TEMS Investigation Data Collection are found in
Information Elements and Events, chapter 3.
Information Element, Argument of
Many information elements contain an array of values rather than a single
value. To pick one item from the array, an argument is used.
For instance, the GSM information element Neighbor RxLev contains the
signal strengths of all neighboring channels (there may be up to 32). To
present the signal strength of a particular neighbor channel, you must specify
an argument in the form of a neighbor index between 1 and 32.
Complete details on the arguments of information elements are given in
Information Elements and Events, chapter 3.
LZT 108 9851 R1B
15
TEMS Investigation 9.0 Data Collection User’s Manual
Message
The term “message” in this user manual generally denotes an air interface
message described in the wireless technology specifications, most often a
Layer 3 message. A “message window”, however (chapter 18), may list either
air interface messages, or mode or error reports produced by phones, or
messages from various protocols, or events. Similarly, in the “Find in Logfile”
dialog (section 7.2.2), a “message” may be an air interface message or a
phone mode report.
Mode Report
A mode report is a status or measurement report generated by a phone.
Phone
The term “phone” covers both GSM phones, UMTS (WCDMA/GSM) user
equipments (UEs), and CDMA phones. When a subset is meant, a suitable
qualifier is prefixed, and/or a more precise term is used (“GSM phone”, “Sony
Ericsson GSM phone”, “Nokia UE”, “Kyocera CDMA phone”, etc.).
Some user terminals supported by TEMS Investigation are in fact data cards
rather than phones. The word “terminal” is therefore sometimes used instead
of “phone”, without any difference in meaning from the point of view of TEMS
Investigation.
Scanner
The term “scanner” denotes a device dedicated to scanning, for example a
PCTel scanner. Phones with scanning capabilities are not referred to as
scanners.
16
Chapter 2. Basics of TEMS Investigation Data Collection
2.
Basics of TEMS Investigation
Data Collection
This chapter guides you through some fundamentals of TEMS Investigation
Data Collection.
2.1.
Recommended Skills
Since TEMS Investigation Data Collection is a Windows application,
familiarity with Windows is useful. To obtain a genuine understanding of the
presented information, you need a working knowledge of the wireless
technologies concerned.
2.2.
Installing TEMS Investigation
See chapters 3 and 5 in the Getting Started Manual.
2.3.
Starting TEMS Investigation Data Collection
Once installed, the Data Collection application can be launched from the Start
menu.
Note: We recommend that you plug the external equipment you are
going to use into the PC before starting TEMS Investigation.
•
Choose Start → Programs → Ericsson → TEMS Products → TEMS
Investigation 9.0 Data Collection.
In Windows Vista you must run the application as administrator. This option is
selected by right-clicking the Start menu item above and choosing Properties
→ Shortcut tab → Advanced.
LZT 108 9851 R1B
17
TEMS Investigation 9.0 Data Collection User’s Manual
2.4.
Quick Guide to the User Interface
This section gives a quick overview of the TEMS Investigation Data
Collection user interface. The user interface is described in more detail in
chapters 3 and 4.
Menu bar
Toolbars
Worksheet
Navigator
Status bar
Workspace and Worksheets
The entity that stores all the windows and settings used in a working session
is called the workspace. Only one workspace can be open at a time.
To manage your windows more smoothly, you can divide your workspace into
several worksheets. Up to ten worksheets can be active simultaneously.
Toolbars
Through the toolbars all the central functions are accessible. Most of the
toolbar buttons are mirrored in the menus.
18
Chapter 2. Basics of TEMS Investigation Data Collection
Navigator
From the Navigator, you can open presentation windows, change the color
ranges of information elements, and manage your worksheets.
The Navigator is especially useful for configuring the workspace at the
beginning of a session.
Menu Bar
The menus mirror most of the toolbars as well as the Navigator’s Menu and
Worksheets tabs.
Status Bar
The Status bar displays symbols and short messages that indicate the current
status of the application.
LZT 108 9851 R1B
19
TEMS Investigation 9.0 Data Collection User’s Manual
3.
User Interface
This chapter goes through the user interface in more detail, and can be seen
as an expanded version of section 2.4.
3.1.
User Modes
TEMS Investigation Data Collection can be run in two different modes, one
for testing and recording, and one for replay and analysis:
•
Drive testing mode: The information presented on the screen is obtained
from data-collecting devices connected to the PC. In drive testing mode
you can record new logfiles.
•
Replay mode: The presented information is read from a logfile. In this
mode you replay logfiles for inspection and analysis. You can also use the
recording function to copy material between logfiles.
The two modes are mutually exclusive. At the beginning of a session, the
application is in replay mode. As soon as you connect external equipment,
however, it switches to drive testing mode and remains in this mode as long
as some external device is connected. Disconnecting all external devices
returns the application to replay mode.
This means that:
•
If you have a logfile open, you must close it before you can connect
external devices.
•
To be able to open a logfile, you must first disconnect all connected
external devices.
Note: You do not set the working mode explicitly in the user interface,
nor is the current mode shown there. The terminology is used in
the manual to clarify how things work.
20
Chapter 3. User Interface
3.2.
Workspaces and Worksheets
The environment that stores all the windows and settings used in a working
session is called the workspace. Settings include information on connected
external devices. Only one workspace can be open at a time.
When you start TEMS Investigation Data Collection for the first time, a default
workspace is opened. This also happens if you have never saved a
workspace. After you have saved a workspace for the first time, the
workspace last saved will be opened each time you start the application.
To start the application without loading any existing workspace, go to the
directory <TEMS Investigation install dir>\Application and give the following
command:
investigation.exe -newwksp
Besides the default workspace, which contains a bit of everything, some
further predefined workspaces are supplied in the Application subdirectory.
These are geared towards data collection, troubleshooting, and postprocessing. By default, workspaces reside in the following directory:
•
Windows Vista: C:\Users\<user>\Documents\TEMS Product Files\TEMS
Investigation 9.0\Workspaces
•
Windows XP: C:\Documents and Settings\<user>\My Documents\TEMS
Product Files\TEMS Investigation 9.0\Workspaces
with workspaces for different cellular technologies kept apart in
subdirectories.
Note: You cannot save changes to the predefined workspaces. To save
your modifications, save workspace under a different name.
To manage your windows more smoothly, you can divide your workspace into
several worksheets. This is already done in the default workspace, which has
a number of worksheets dedicated to different purposes, as shown by their
designations. Up to ten worksheets can be active simultaneously.
Workspaces are handled from the File and View toolbar (see section 3.3.7 for
further details), or alternatively from the File menu. Worksheets are handled
from the Worksheet menu, which can also be accessed by right-clicking in a
worksheet.
TEMS Investigation 9.0 Data Collection cannot load workspaces from older
TEMS Investigation versions.
LZT 108 9851 R1B
21
TEMS Investigation 9.0 Data Collection User’s Manual
3.3.
The Toolbars
The toolbars in the main window give speedy access to the most central
functions of TEMS Investigation Data Collection. Most of these functions are
mirrored in the menus (see section 3.5, page 26).
3.3.1.
Equipment Control Toolbar
This toolbar is accessible in drive testing mode.
Selected Equipment: Combo box holding all enabled and connected
external devices (strictly speaking, all channels of each device; see
section 6.5, page 37).
Scanning Task: Shows the current scanning task (if any) assigned to
the device selected in the Selected Equipment combo box. If the
device is not capable of scanning, this box is grayed and contains the
text “Not a Scanning Device”. See chapters 8–11 about scanning.
Connect: Connect the external device displayed in the combo box to
the left on the toolbar.
Disconnect: Disconnect the external device displayed in the combo
box.
See chapter 6, page 35 about connecting external equipment.
Start/Stop Scanning: Start/stop a scan.
Scan Properties: Set up a scan.
Redial: (In idle mode:) Redial the last call. (In dedicated mode:)
Terminate the ongoing call. In the latter case, the receiver symbol is
crossed out.
Equipment Properties: Set properties of the phone or GPS unit.
Properties of external devices are described in chapter 13, page 178.
22
Chapter 3. User Interface
3.3.2.
Connections Toolbar
Connect All: Connect all enabled external devices.
Disconnect All: Disconnect all connected external devices.
3.3.3.
Record Toolbar
Start/Stop Recording: Start/stop recording a logfile. When you
stop the recording, the logfile is closed.
Insert Filemark: Insert a filemark in the logfile.
Pause/Resume Recording: Pause the recording and end the
current route in the logfile/Resume recording, starting a new route.
Swap Logfiles: Close the current logfile and continue the recording to
a new file.
For a full description of the recording function, see section 7.1, page 50.
Recording properties are set from the Logfile menu. See section 7.1.3, page
52.
3.3.4.
Replay Toolbar
This toolbar is accessible in replay mode.
Open/Close Logfile: Open a logfile/Close the logfile that is
currently open.
Rewind Logfile: Rewind the logfile to the beginning.
Play/Stop Logfile: Replay the logfile/Stop logfile replay. The
speed of the replay is variable and is set from the Logfile menu; see
section 7.2.1, page 56.
Step Logfile: Advance one step in the logfile.
Fast-forward Logfile: Play the logfile at high speed.
Find in Logfile: Search the logfile.
LZT 108 9851 R1B
23
TEMS Investigation 9.0 Data Collection User’s Manual
Information: Show information about the logfile.
See section 7.2, page 55.
3.3.5.
Report Toolbar
Generate Report: Generate a report from one or several logfiles.
See section 7.6, page 69.
Generate Report KPI (UMTS only): Generate a KPI report from KPI
samples (which have in turn been exported from logfiles).
See section 7.7, page 74.
3.3.6.
Route Analysis Toolbar
TEMS Investigation Route Analysis: Launch the Route Analysis
application.
3.3.7.
File and View Toolbar
New Workspace: Create a new workspace.
Open Workspace: Open a saved workspace.
Save Workspace: Save a workspace.
Print: Print the selected window.
Print Preview: Show a preview of the window printout.
Toggle Full Screen: Toggle between full screen and normal mode.
3.4.
The Status Bar
The Status bar at the bottom of the main window displays symbols and short
messages concerning the current status of the application. It is divided into
the following sections:
24
Chapter 3. User Interface
Help Section
Shows a help text when you point to a button or combo box on the main
window toolbars, otherwise directs you to the online help:
Replay Section (Replay Mode)
Shows the name of the logfile being replayed and indicates the percentage of
the file that has been replayed.
Recording Section (Drive Testing Mode)
Shows the name of the file being recorded, its current size (number of reports
from the phone), and the number of filemarks inserted (see section 7.1.1,
page 51).
Connections Section
Shows the status of external equipment. Each channel of each device (see
section 6.5, page 37) is represented by a symbol with or without a color
indication.
The following symbols are used:
Phone or scanner
Phone data cable
GPS unit
On the status bar, the symbols appear in that order from left to right: phones/
scanners, data cables, GPS units. Devices of the same type are sorted by the
number in their designations (“MS1”, etc.) with the lowest number first.
LZT 108 9851 R1B
25
TEMS Investigation 9.0 Data Collection User’s Manual
The status of the equipment is shown by adding various elements to the basic
symbols:
Symbol
Meaning
(Red light)
The external device has been enabled but not connected in
TEMS Investigation and is therefore not ready to be used. (It
might not even be connected physically to the PC.)
(Green light and red triangle)
The GPS unit has been connected in TEMS Investigation but
reports an invalid position.
(Green light)
The external device has been connected in TEMS
Investigation. It is ready for use, or is being used.
(Green light and padlock)
The phone connected to the port is busy scanning.
3.5.
The Menu Bar
File Menu
Apart from holding some standard File menu commands, this menu mirrors
part of the File and View toolbar.
View Menu
From here you choose which toolbars and which other tools should be visible.
The Full Screen mode hides the Navigator.
Logfile Menu
The Logfile menu mirrors the Record, Replay, and Route Analysis toolbars.
From here you can also set recording and replay properties, and export
logfiles (see sections 7.1.3, 7.2.4, and 7.5).
26
Chapter 3. User Interface
Scanning Menu
The Scanning menu mirrors the part of the Equipment Control toolbar that is
to do with scanning.
Presentation, Control, and Configuration Menus
These menus mirror the Menu tab of the Navigator.
Worksheet Menu
From this menu you manage your worksheets.
Window Menu
This is a standard window manager.
Help Menu
Gives access to online help, containing the same information as this manual,
and to the about page.
3.6.
Keyboard Shortcuts
A number of central operations in TEMS Investigation Data Collection, as well
as many standard file and edit operations, can also be performed from the
keyboard. A list of keyboard shortcuts is found in appendix A, page 327.
LZT 108 9851 R1B
27
TEMS Investigation 9.0 Data Collection User’s Manual
4.
The Navigator
The Navigator pane, located on the left in the TEMS Investigation Data
Collection main window, allows you to set up and manage your workspace.
The Navigator has the following tabs:
•
one that lists the types of windows provided (Menu tab: section 4.1)
•
one that lists information elements (Info Element tab: section 4.2)
•
one that gives an overview of your current workspace configuration
(Worksheets tab: section 4.3).
You can hide the Navigator by switching to Full Screen mode (done from the
View menu or from the File and View toolbar). Once you are done setting up
and configuring your workspace, you may find it helpful to hide the Navigator
in order to free the entire screen for your worksheets.
4.1.
Menu Tab
The Menu tab lists most types of windows that are available in the
application. They are divided into the categories Presentation, Control, and
Configuration. To open a window, double-click the corresponding symbol, or
drag the symbol from the Navigator to the worksheet where you want it. All
Navigator windows can also be opened from the menu bar.
See Information Elements and Events, chapter 8 for descriptions of the
contents of individual presentation windows. How the windows work and how
they can be configured is covered in the present document: see chapters
15–23.
The control and configuration windows are also described in this volume.
Please use the alphabetical index to locate them.
4.2.
Info Element Tab
The Info Element tab lists all the information elements handled by TEMS
Investigation Data Collection.
28
Chapter 4. The Navigator
Regarding information element categories, see Information Elements and
Events.
4.2.1.
Presentation Attributes of Information Elements
For all numeric information elements (that is, those not of type “Text”) can be
defined presentation attributes which determine the graphical presentation of
the element as a function of its numeric value. The attributes are:
•
Color: Range of colors used to encode the IE value (in a variety of
presentation windows).
•
Size: Range of plot marker sizes encoding the IE value in Map windows.
•
Symbol: Range of plot marker shapes (symbols) encoding the IE value in
Map windows.
Some numeric elements have such presentation attributes defined by default;
others do not. The attributes are edited from the Info Element tab; see section
4.2.2. When you add an information element to a presentation window, these
settings are automatically used unless you have specified a different usage in
that particular window (possible only with colors in certain window types; see
section 15.4, page 212).
4.2.2.
Editing the Color Ranges of Information Elements
•
If you want to add color ranges to an information element, right-click the
element in the Navigator and select Add → Color.
•
If you want to edit the default color ranges of an information element,
double-click the information element to expand it and show the
presentation attributes, then double-click Color.
In either case, continue as follows:
LZT 108 9851 R1B
29
TEMS Investigation 9.0 Data Collection User’s Manual
4.2.2.1.
Automatic Setup of Color Ranges
This is the easiest way to set up color ranges.
•
Click Auto Setup.
•
Set the number of intervals.
•
Choose colors for the extremes of the value range.
•
Check the Via Color box if you want to use a specific color in the middle of
the range. If you do not check the Via Color box, the intermediate color is
chosen automatically based on the “From” and “To” colors.
When you click OK, a color range is created automatically with evenly sized
intervals and suitable intermediate colors.
30
Chapter 4. The Navigator
4.2.2.2.
Manual Setup of Color Ranges
If you prefer to assemble your color range interval by interval, follow these
steps:
•
To add an interval, click Add, set the endpoints of the interval, and choose
a color.
•
To edit an interval, select it, click Edit, and make your changes.
•
To delete an interval, select it and click Delete. A single remaining interval
cannot be deleted, nor can the color range as a whole be removed.
If you delete parts of the color range so that no color is defined for some
values, these values will be drawn in black.
4.2.3.
Editing the Marker Sizes and Symbols of
Information Elements
Ranges for map plot marker sizes and symbols are edited in exactly the same
way as color ranges. See section 4.2.2 above.
4.3.
Worksheets Tab
The Worksheets tab lists the worksheets currently active in the workspace.
Each worksheet is represented by a folder containing the windows in this
worksheet. Double-clicking on a symbol will make that particular window (and
the worksheet it is placed on) active. You can rearrange windows from this
tab by dragging them between the worksheet folders.
LZT 108 9851 R1B
31
TEMS Investigation 9.0 Data Collection User’s Manual
5.
Cell Data
TEMS Investigation can present information on individual cells in cellular
networks. In particular, it is possible to draw cells on maps and to display cell
names in various windows. Cell data is also made use of in logfile reports.
Cell data can be provided in two ways:
•
in a plain-text XML file (*.xml) whose format is common to several TEMS
products: See section 5.1.
•
in a file with a plain-text, TEMS Investigation specific format (*.cel). This
format is for UMTS only. GSM and WCDMA cells can be mixed in one file.
See section 5.2.
CDMA cell files in TEMS Investigation CDMA CSV format can be converted
to the XML format: see the Route Analysis User’s Manual, section 17.3.
Regarding TEMS Investigation CDMA CSV cell files in general, see the
Route Analysis User’s Manual, appendix D.3.
5.1.
Creating a Cell File in XML Format
The XML-format cell file uses two XML schemas, which are found in the
directory XMLSchema beneath the TEMS Investigation installation directory:
•
The schema TEMSDataTypes.xsd defines TEMS-specific XML data
types, derived from the fundamental data types set down in the XML
specification.
•
The schema TEMSCell.xsd defines XML attributes and elements that
embody cell and site data, relying on the data types in
TEMSDataTypes.xsd.
The most convenient way of composing XML-format cell files is to load the
above schemas into a suitable XML development tool, and fill in the data from
there.
A full description of the XML format is found in the Route Analysis User’s
Manual, appendix D.
32
Chapter 5. Cell Data
5.2.
Creating a Cell File in CEL Format
The CEL format is a unified version allowing both GSM and WCDMA cells in
the same file. It is described exhaustively in the Route Analysis User’s
Manual, appendix C.
If you use a spreadsheet application to edit CEL files, be sure to save them in
tab-delimited plain text format. Otherwise, unwanted characters might be
inserted which prevent TEMS Investigation from interpreting the file correctly.
5.3.
Loading Cell Files
To make a cell file active, it must be loaded in the General window. You can
have several cell files loaded in the application at the same time.
•
From the Navigator, open the General window.
•
In the General window, double-click the item “Cellfile Load”.
•
To add a cell file, click the Add button and browse to select your file. The
cell file is added in the list box.
•
To remove a cell file from the list, select it and click Remove. To remove all
cell files, click Remove all.
•
When you are done selecting cell files to load, click OK.
The set of loaded cell files can be modified at any time.
If multiple files of the same type (CEL or XML) are loaded, the information in
all files is correlated in the presentation. However, if you load both CEL and
XML files, no attempt is made to correlate CEL and XML cell information;
rather, cell information is presented separately from each type of file.
5.4.
Loading Cell Data from TEMS CellPlanner
TEMS CellPlanner uses the XML format for cell data. XML cell files created
with TEMS CellPlanner can be loaded into TEMS Investigation.
5.5.
Use of Cell Data in Presentations
Once cell data has been loaded, the following functions become available in
the application:
•
Drawing of cells and indication of neighbor relations and channel usage
on the map. See sections 23.5.5.1, 23.5.5.3, and 23.5.5.4.
LZT 108 9851 R1B
33
TEMS Investigation 9.0 Data Collection User’s Manual
•
Serving cell and handover indication on the map. See section 23.5.5.2.
•
Presentation of cell data on the Info tab of a Map window. See section
23.6.
•
In logfile reports: Association of statistics with individual cells.
Computation of cell ranking based on these statistics. See appendix F.3.
•
Presentation of cell names in status windows, line charts, and bar charts.
Configuration of status windows is covered in sections 16.2–16.3. Line
charts: section 21.4.3. Bar charts: section 22.4.
•
(With WCDMA scan data:) Best server indication on the map, based on
scan data. See section 23.5.5.2.
•
(With WCDMA scan data:) Generation of an event detecting (probable)
missing neighbors. See Information Elements and Events, section 7.3.
34
Chapter 6. Connecting External Equipment
6.
Connecting External
Equipment
This chapter describes how to establish contact with external devices in
TEMS Investigation. Please note that the hardware key must be plugged in
before you can connect external devices. See the Getting Started Manual,
section 7.3.
Nearly all of the external devices supported by TEMS Investigation are
automatically detected and enabled by the application after they have been
plugged into the PC.
A few types of equipment must still be enabled manually. This option always
exists as a fallback if the automatic detection fails.
Note: We recommend that you plug your equipment into the PC before
starting TEMS Investigation.
Concerning preparations for running data services, see the Getting Started
Manual, chapter 8. Please note that the configuration of Dial-up Networking
(setup of phonebook entries) in Windows must still be done manually.
Concerning PC and scanner configuration for using a WiMAX scanner, see
the Getting Started Manual, chapter 9.
6.1.
Connectable Equipment
See the Getting Started Manual, chapter 4.
6.2.
Connection Procedure: Terminology
When you have plugged an external device into a PC port, two steps must be
performed in TEMS Investigation before you can start using it: the device
must first be enabled, then connected (in an abstract sense of the word). The
opposites of “enable” and “connect” are “disable” and “disconnect”.
LZT 108 9851 R1B
35
TEMS Investigation 9.0 Data Collection User’s Manual
The word “connect” is sometimes also used to refer to the act of connecting a
device physically to a PC port. The context always makes clear which is
meant.
6.3.
Plugging In External Equipment
Note that devices may be mounted in an equipment case, so that they will not
be plugged directly into the PC.
6.3.1.
Plugging In Phones
Nearly all supported phones connect to the PC via USB. A single USB cable
connects the USB port on the phone to a USB port on the PC; both TEMS
measurements and data service measurements are transferred through this
cable. The two measurement categories are however kept apart in TEMS
Investigation (“MS” vs. “DC”) by means of the virtual COM port numbers
generated by Windows. See section 6.6.
The CDMA phone Samsung SCH A900 uses a serial cable for TEMS
measurements and a USB cable for data service measurements.
6.3.2.
Plugging In Scanners
•
PCTel SeeGull EX and SeeGull LX MM2 scanners connect via USB.
•
Other PCTel SeeGull LX scanners connect to a COM port.
•
Anritsu ML8720 scanners connect to a COM port.
•
Anritsu ML8740/8741 scanners connect via USB.
•
DRT4301A scanners connect to an Ethernet port, either directly on the
PC or via a local area network.
36
–
If the scanner is connected directly to the PC, a 100BaseT crossover
cable is used for this purpose.
–
If the scanner and PC are to communicate over a local area network,
both should be connected to local area network ports with normal
100BaseT cables.
Chapter 6. Connecting External Equipment
6.3.3.
Plugging In GPS Units
•
The GPS units sold as accessories to TEMS Investigation (Holux GPSlim
236) connect via Bluetooth or USB.
•
Other supported GPS units connect via Bluetooth or through a USB or
COM port.
6.3.4.
Plugging In Equipment Cases
The TC-1520 and TC-1520B equipment cases connect via USB.
6.3.5.
Plugging In Standalone AQM Modules
The standalone AQM module connects to the PC via USB. An audio cable is
connected between the AQM module and its associated phone. The AQM
module also requires a separate 12 V power supply (the voltage provided
through the USB connector is insufficient).
6.4.
Starting TEMS Investigation Data Collection
Launch the application from the Start menu:
•
Choose Start → Programs → Ericsson → TEMS Products → TEMS
Investigation 9.0 Data Collection.
In Windows Vista you must run the application as administrator. This option is
selected by right-clicking the Start menu item above and choosing Properties
→ Shortcut tab → Advanced.
6.5.
The Equipment Configuration Window:
Basics
All devices that are known to TEMS Investigation, whether automatically
detected or manually added, are listed in the Equipment Configuration
window. In the example below, a Sony Ericsson K800i phone has been
autodetected.
LZT 108 9851 R1B
37
TEMS Investigation 9.0 Data Collection User’s Manual
Each device is represented in the Equipment Configuration window by an
“EQ” item, containing within it one further item (called “channel”) for each data
source furnished by the device:
•
for user terminals, an “MS” channel representing TEMS measurements
and a “DC” channel representing data service measurements
•
for scanners, an “MS” channel
•
for GPS units, a “PS” channel (P for “positioning”).1
A common index is assigned to all of EQ, MS, and DC. You can change that
number: see section 6.8.5.1.
The colored dot to the left of each channel shows the status of the channel in
TEMS Investigation: red means “not connected”, green means “connected”.
How to connect channels is explained in section 6.10.
The Number/Port column shows the phone number for each user terminal
EQ. For channels, it shows to what port the channel is connected.
The IMEI/AQM/ESN column shows
•
IMEI for UMTS phones (in the EQ row)
•
ESN for CDMA phones (in the EQ row)
•
serial number for DRT scanners (in the EQ row)
•
the identity of an AQM module paired with the phone (in the MS row).
The IMSI column shows the IMSI of an UMTS phone’s subscription (in the
EQ row).
At present the EQ designation is mainly used in the Equipment Configuration
window. Outside this window, external devices are most often represented by
their channels (MS/DC/PS). All channels are found in the combo box on the
Equipment Control toolbar. Furthermore, for each channel of each device, a
1. GPS units built into scanners do not appear as separate devices in TEMS
Investigation.
38
Chapter 6. Connecting External Equipment
symbol appears on the main window status bar; see section 3.4, page 24 for
details.
6.6.
Automatic Detection (Enabling) of Equipment
6.6.1.
Scope of Autodetect Function
Most of the devices supported by TEMS Investigation are detected and
enabled automatically in the application.
For detailed information on what types of equipment are autodetected, please
visit our website www.ericsson.com/tems and check the Tech Support
section.
Generally, the following holds:
•
Any device with USB connectivity that has VID and PID (vendor and
product ID) properly encoded in it will be autodetected.
•
All phones (not counting data cards) are normally autodetected.
•
Certain data cards functioning as user terminals (such as Option GT) are
autodetected, whereas others (such as Sierra Wireless) are not.
•
PCTel and DRT scanners are autodetected. Other scanners are not
autodetected.
•
GPS units that use the NMEA protocol1 as well as the Garmin GPS 18 are
autodetected. Other GPS units are not autodetected.
Devices that are not autodetected must be enabled manually. See section
6.7.
6.6.2.
Presentation in Equipment Configuration Window
Devices that have been autodetected by TEMS Investigation appear in the
Equipment Configuration window with the value “Detected” written in the Info
column.
1. This includes Bluetooth GPS units, provided that they have been paired
correctly with the PC and the PC has been appropriately configured for
Bluetooth.
LZT 108 9851 R1B
39
TEMS Investigation 9.0 Data Collection User’s Manual
6.6.3.
Detection of Equipment Not Covered by License
If you plug in a type of device for which you have no license, it will still appear
in the Equipment Configuration window (provided that it can be
autodetected). However, the text for this device will be red, and the Info
column will read “No License”. The same thing will happen if your license only
permits single-device data collection and you plug in a second device. A
device tagged “No License” cannot of course be connected in TEMS
Investigation.
6.7.
Manual Enabling of Equipment
Devices which cannot be detected automatically must be enabled manually in
the Equipment Configuration window. Manual enabling is always available as
a fallback if the automatic detection fails.
To enable a device manually:
Click the Add button in the Equipment Configuration window.
40
Chapter 6. Connecting External Equipment
Whenever a device is not autodetected, its COM ports appear in the Port
combo boxes of this dialog. Two rows are provided in the dialog to allow
enabling of two equipment channels (MS and DC).
See section 6.7.1 for instructions on specifying ports and equipment
channels.
After you have finished the Add Equipment dialog, the enabled device
appears in the Equipment Configuration window with the value “User Added”
written in the Info column:
6.7.1.
Details of Manual Enabling
Details of how to enable devices manually are given here for devices that
cannot be autodetected by the application. Regarding other devices, see
appendix C, page 332.
6.7.1.1.
Scanners
For all scanners, only row 1 in the Add Equipment dialog is used. Row 2 is
grayed out.
Anritsu ML8720
This scanner connects to a serial port.
•
Under Port, choose the port to which the scanner is connected.
•
Under Equipment Channel, there are two choices:
–
Choose “ML8720/ML8740 with GPS” if you wish to use a GPS that is
connected directly to the scanner.
–
Choose “ML8720/ML8740” if you wish to use a separate GPS unit (not
one connected to the scanner).
LZT 108 9851 R1B
41
TEMS Investigation 9.0 Data Collection User’s Manual
Anritsu ML8740/8741
These scanners connect via USB.
•
Under Port, choose None.
•
Under Equipment Channel there are two choices, as for the ML8720; see
Anritsu ML8720 above.
6.7.1.2.
Data Cards
Sierra Wireless
Use row 1 for TEMS measurements:
•
Under Port, choose the virtual COM port number assigned to the port
“Sierra Wireless Diagnostics Interface ...”.
•
Under Equipment Channel, choose “Sierra Wireless ...”.
Use row 2 for data service measurements:
•
Under Port, choose the virtual COM port number assigned to the modem
“Sierra Wireless AirCard HSDPA Modem”. To find out the COM port
number, right-click this item in the Device Manager and inspect the
Properties dialog.
•
Under Equipment Channel, choose “Qualcomm 3G Data Cable”.
See this screenshot of the Device Manager:
Data service
measurements
TEMS
measurements
42
Chapter 6. Connecting External Equipment
6.7.2.
Manual Enabling of Equipment Not Covered by
License
If you manually add a device for which you have no license, the device will
appear in the Equipment Configuration window, but the text will be red and
the Info column will read “No License” (just as for autodetected devices:
compare section 6.6.3). The device cannot be connected in TEMS
Investigation.
6.8.
Further Features of the Equipment
Configuration Window
6.8.1.
The Refresh Function
If you are working with devices that can be autodetected, but the detection
did not work as expected (for whatever reason), you can start the autodetect
procedure over from scratch. To do this:
In the Equipment Configuration window, click the Refresh button.
6.8.2.
Saving the Equipment Configuration
You can save the current setup in the Equipment Configuration window:
Click the Save button.
What this action does is to store the mapping between devices and EQ items
in the Windows registry. This means that if a device is represented by (say)
EQ3 and you save the configuration, that device will again be mapped to EQ3
the next time it is plugged into the same PC with the same Windows user
logged in.
The save function is applicable to all devices whose hardware permits a
reliable identification. Such devices include phones with their IMEIs.
If you click Save once more, the previous configuration is overwritten. To
remove all configuration information from the registry, click Save in an empty
Equipment Configuration window.
LZT 108 9851 R1B
43
TEMS Investigation 9.0 Data Collection User’s Manual
Note: TEMS Investigation no longer saves any information on
equipment configuration in the workspace.
6.8.3.
Re-pairing Phones with AQM Modules
When you match phones with AQM modules manually as described in
section 6.8.5.2, mappings between phone IMEIs and AQM module identities
are stored by TEMS Investigation in the Windows registry.
When plugging the same phones and AQM modules into the PC on a later
occasion, you can recreate the same pairings automatically in TEMS
Investigation:
Click the “Re-pair Phones with AQM Modules” button in the Equipment
Configuration window.
This function operates the same way whether your AQM modules are
standalone or mounted in an equipment case.
For each match made, the AQM identity will appear in the IMEI/AQM column
for the phone’s MS channel. If a phone could not be matched with an AQM
module, the text “No match” will be displayed briefly for that phone.
6.8.3.1.
Details and Limitations of the Re-pairing Function
The re-pairing function assumes that the phone-to-AQM-module mappings
found in the Windows registry are still valid. No check is performed that the
physical connections are in fact still the same. For example, if you are using
an equipment case and let two phones swap places, the re-pairing will be
incorrect for these phones and the AQM data will be garbage. To prevent this,
it is a good idea to label the phones and AQM modules in some suitable
manner to ensure that each phone is always hooked up to the same AQM
module.
If you have been working with different equipment configurations connected
at various times to the same PC, the following holds:
•
Only AQM modules that are physically present when you click the button
will be paired.
•
Each AQM module can only be paired with a single phone. If several
phones have previously (at different times) been using the same AQM
module, only one of them will be paired with it.
44
Chapter 6. Connecting External Equipment
6.8.4.
Properties Dialog
A Properties dialog is provided where you can configure some properties of
the set of EQs (as a whole) and of the autodetect procedure. To open this
dialog:
In the Equipment Configuration window, click the Properties button.
Exclude COM
ports
Here will be listed all COM ports (physical and virtual)
that the autodetect function cannot associate with a
recognized equipment type. This includes all COM
ports used by devices that have nothing to do with
TEMS Investigation (e.g. keyboard and mouse).
If you uncheck a COM port in this list, that port will be
excluded from the autodetect procedure. If you have
sensitive equipment attached to a port, equipment
which may be disturbed by the port scanning
performed by the autodetect function, it is advisable
to exclude that port.
(Ports that are currently occupied by devices enabled
in TEMS Investigation do not appear in the list.)
LZT 108 9851 R1B
45
TEMS Investigation 9.0 Data Collection User’s Manual
Power off on
disconnect
See section 6.10.2, page 48.
Try to reconnect if
disconnected
If you check this, TEMS Investigation will try to reestablish the connection to the external device
following a spontaneous disconnect.
GPS baud rate
Here you can override the default baud rates for GPS
units. To override the defaults, choose a baud rate
from the combo box. This rate will then be used
regardless of the type of GPS unit employed. (You
cannot set differentiated baud rates of your own.)
6.8.5.
EQ Item Context Menu
If you right-click an EQ item, a context menu pops up containing the following
commands:
6.8.5.1.
Change Equipment Number
Select a number to change the EQ index to that number. It is possible to
select an index that is already taken by another device; the two devices will
then swap indices.
6.8.5.2.
Select AQM Module
If you have purchased the audio quality measurement option, this is where
you select the AQM module with which this EQ should interact. This selection
is only applicable to phones supporting audio quality measurements (they are
listed in the Getting Started Manual, section 4.2). For devices that are not
used to perform audio quality measurements, “None” should be selected
here.
You need to pair off your EQs and AQM modules manually like this the first
time around. On later occasions, you can use the re-pairing function (see
section 6.8.3) to recreate the same pairing automatically, provided that the
physical connections between phones and AQM modules are unchanged.
AQM modules do not themselves appear as EQs in the Equipment
Configuration window.
46
Chapter 6. Connecting External Equipment
6.8.5.3.
Change Phone Number
If a phone is going to measure AQM, the number of the phone must be known
to TEMS Investigation. When you plug in a phone, the autodetect procedure
sends an AT command to it in order to find out the phone number, which is
usually stored on the SIM card. If this operation succeeds, the phone number
will display in the Number/Port column in the Equipment Configuration
window.
If no phone number shows, this may be because no phone number is defined
on the SIM, or because the phone did not respond properly to the AT
command. In such cases you need to enter the phone number manually by
using the Change Phone Number option.
The number you enter will be used for this phone from now on. It will also be
used on future occasions when the phone is plugged in, unless the AT
command succeeds at that time. A phone number retrieved by an AT
command will always override a manually entered number.
6.8.5.4.
Delete
This command disables the selected device: see section 6.11.
6.9.
Properties of Channels
Right-clicking an MS channel for a user terminal and choosing Equipment
Properties opens the Properties dialog for the user terminal. See chapter 13,
page 178.
6.10.
Connecting and Disconnecting External
Equipment in TEMS Investigation
Connecting external devices in the application is done as a separate step.
Note: If you have a logfile open, you must close it to be able to connect
equipment.
6.10.1.
Connecting External Equipment
To connect a single channel of an external device:
LZT 108 9851 R1B
47
TEMS Investigation 9.0 Data Collection User’s Manual
•
Select the channel in the combo box of the Equipment Control toolbar.
Click Connect on the Equipment Control toolbar.
To connect all channels of all external devices:
Click Connect All on the Connections toolbar.
Connected channels are accompanied by a green-light symbol in the combo
box. The symbols on the status bar and in the Equipment Configuration
window likewise turn green.
Automatic Power-on following Connect
If the external device is power supplied by an external power source (e.g. a
vehicle charger), it is powered on automatically when you click Connect or
Connect All.
6.10.2.
Disconnecting External Equipment
If you want to leave an external device plugged into the port, but disconnect a
device channel (e.g. “MS1” or “DC1”) in the application for the time being, do
as follows:
•
Choose the device channel in the toolbar combo box.
Click Disconnect on the Equipment Control toolbar.
To disconnect all channels of all external devices:
Click Disconnect All on the Connections toolbar.
For a disconnected channel, all symbols representing it revert to red.
48
Chapter 6. Connecting External Equipment
Automatic Power-off following Disconnect
If you check “Power off on disconnect” in the Properties dialog (section 6.8.4),
the device will be powered off automatically when you disconnect it. Note that
this function does not have anything to do with how the external device is
power supplied.
6.11.
Disabling External Equipment
If you want to remove an external device completely from the application,
disable it:
•
In the Equipment Configuration window, select the device (EQ item) you
want to disable.
Click the Delete button.
Alternatively, you can right-click the EQ item and choose Delete from the
context menu.
LZT 108 9851 R1B
49
TEMS Investigation 9.0 Data Collection User’s Manual
7.
Logfiles
This chapter explains:
•
how to log information received from external devices to file (section 7.1)
•
how to replay a logfile (section 7.2).
The chapter also describes:
•
copying between logfiles (section 7.3)
•
loading of logfiles from sources outside TEMS Investigation (section 7.4)
•
logfile export (section 7.5)
•
generation of logfile reports (sections 7.6, 7.7)
•
merging of logfiles with uplink data files (section 7.8).
7.1.
Recording Logfiles
Note: Connection of external devices requires plugging in a hardware
key with the appropriate license. See the Getting Started Manual,
chapter 7.
Logfiles can be recorded in the following ways in TEMS Investigation:
•
from the Record toolbar or Logfile menu
•
from within command sequences.
All these procedures produce the same type of output file, with extension .log.
The functions available for controlling the recording and modifying the logfile
are however somewhat different in each case. For instructions on how to
perform command sequence recording, consult chapter 12, page 137. The
present section deals with direct recording, which is most simply handled
from the Record toolbar.
To initiate recording of a logfile:
50
Chapter 7. Logfiles
Click Start Recording on the Record toolbar.
You are asked to name the logfile. The default naming format is
MMDD_nn.log, where MM is the current month, DD is the current day of the
month, and nn is an incrementing counter starting at 01.
Now connect your equipment if you have not already done so. (By
starting the recording first you ensure that you get all the measurement
data on file.)
•
Perform the desired tasks with your external equipment.
To pause the recording without closing the logfile, click Pause
Recording.
Click the same button once more to resume the recording.
Special events indicating pausing and resumption are written to the logfile.
Click Stop Recording to end the recording and close the logfile. Once
you have closed it, you cannot log any more data to the same file.
Alternatively, you can control the recording with the corresponding
commands in the Logfile menu.
7.1.1.
Inserting Filemarks
Filemarks are text strings which can be inserted manually in a logfile in order
to tag interesting segments in the file. Filemarks can be searched for during
logfile replay (see section 7.2 below). They are treated as events and appear
as such in presentation windows. To add a filemark:
Click Insert Filemark and enter the filemark text.
You can also insert so-called quick filemarks; see section 7.1.3 below.
LZT 108 9851 R1B
51
TEMS Investigation 9.0 Data Collection User’s Manual
7.1.2.
Swapping Logfiles
At any time while recording, you can close the current logfile immediately and
continue recording to a new file.
Click Swap Logfiles.
If the original logfile was named according to the default format, the new
logfile is named according to the format MMDD_02.log. For subsequent files
the counter is incremented further. If the original logfile was named differently
(say, mylogfile.log), the second file receives the name mylogfile_02.log, and
so on.
Note that if you have the “Quick logging” option turned on (see section 7.1.3),
you can specify that logfiles should be swapped after a given number of
messages have been logged. The manual swapping function is independent
of this option and works also when it is active.
Note: The Swap Logfiles function must not be used when recording
KPIs. All input to a KPI computation must be recorded in one file.
7.1.3.
Further Recording Options
Some additional options are available when recording logfiles.
•
52
Choose Recording Properties from the Logfile menu.
Chapter 7. Logfiles
Default Recording Folder
Here you can change the default recording directory.
Quick Logging
If you check this box, TEMS Investigation will not ask for a logfile name
before starting the recording, but create a default logfile name automatically
(with the format MMDD_nn.log as described at the start of section 7.1).
To ensure that you will not end up with impractically large logfiles, you can
check “Swap files after reaching message” and specify a limit on the number
of air interface messages in a logfile. Then, once the given number of
messages have been logged, the logfile is closed and the recording
automatically continues to a new file.
Quick Filemark
If you check this box, the filemarks you insert will simply be integers. You will
not be asked to enter a text string. Quick filemarks are useful for just marking
one position or a few positions in the logfile without having to bother with
writing comments.
Add User Info
If you check this box, you will get the opportunity to write a comment in the
logfile after concluding the recording (a text box will pop up). If you use the
swap logfiles function (see section 7.1.2), the text you enter in the box will be
written to the last logfile only.
Clear History Buffer at Start of New Logfile
If you check this box, an internal history buffer (providing quick access to
logfile data) is cleared every time you start recording a new logfile. This
reduces the consumption of disk space as well as the CPU load during
recording.
7.1.4.
Positioning Logfiles by Pinpointing
This section describes how to use the pinpointing technique for positioning
logfile data. Pinpointing is useful in environments where GPS coverage is
lacking.
LZT 108 9851 R1B
53
TEMS Investigation 9.0 Data Collection User’s Manual
7.1.4.1.
Basic Pinpointing Procedures
First, to start the recording, click the Start Recording button as usual.
To record positions for measurements, you indicate your position by clicking
on the map at regular intervals. As long as a phone is connected, clicks on
the map will be interpreted as pinpointing actions. This is indicated by the
being down, and the cursor changing into an upward
Pinpoint button
arrow whenever it enters the Map window.
Each time you pinpoint, the corresponding position is registered in the logfile
as a waypoint along your route. The waypoint is marked with a black
diamond, and a new route segment in the form of a straight line is drawn to it
from the preceding waypoint. Then, the measurement reports received
between the two points are drawn as theme symbols distributed uniformly
along the new route segment (and assigned the corresponding positions in
the logfile).
2
1
4
3
5
Route
Waypoints
(pinpoint markers)
Measurement
data points
The waypoints themselves are stored in the logfile as filemarks with the
information “Pinpoint”. Therefore the waypoints and connecting lines appear
also when the logfile is replayed.
If you want to pause the recording temporarily, without closing the logfile:
•
Pinpoint once just before pausing to ensure that all measurement data is
plotted correctly.
Click Pause Recording.
To resume the recording, click the same button again, and pinpoint
immediately so that all data can be accurately positioned.
When you are done with your entire measurement session, finish as follows:
54
Chapter 7. Logfiles
Disconnect the phone.
•
Pinpoint one last time to ensure that all data is accurately positioned.
Click Stop Recording to end the recording and close the logfile.
7.1.4.2.
Advice on Pinpointing and Recording
From section 7.1.4.1 it is clear that in order for the recorded route to agree
well with the actual one, you should pinpoint every time you change direction.
Furthermore, to obtain equal data densities in different locations, you should
try to maintain approximately the same speed throughout your route. (Note
that this is not the case in the figure in section 7.1.4.1, where the tester has
increased his speed considerably between waypoints 3 and 4.)
If you pinpoint close to the edge of the Map window, the map will scroll
automatically. It is wise not to replace the map during recording.
To optimize the performance of the Map window, you should remove all
unused themes (see section 23.5) and avoid having other presentation
windows open at the same time unless you really need them.
7.2.
Replaying Logfiles
Replay of logfiles does not require the hardware key to be plugged in.
Note: To be able to replay a logfile, you must disconnect your external
equipment.
Logfile replay is controlled from the Replay toolbar or from the Logfile menu.
The quickest method is to use the toolbar buttons:
Open/Close Logfile: Open a logfile/Close the logfile that is
currently open. Only one logfile can be open at a time.
Rewind Logfile: Rewind the logfile to the beginning.
Play/Stop Logfile: Replay the logfile/Stop logfile replay. The
speed of the replay is variable and is set from the Logfile menu; see
section 7.2.1 below. When the stop button is clicked to halt fastforwarding, all presentation windows are updated.
LZT 108 9851 R1B
55
TEMS Investigation 9.0 Data Collection User’s Manual
Step Logfile: Advance one step in the logfile, i.e. read one more
message from the phone. Note that a presentation window is not
always updated when advancing a single step or just a few steps.
Fast-forward Logfile: Play the logfile at high speed. No updating of
presentation windows takes place until the replay is stopped.
Find in Logfile: Search forward in the logfile for a time instant, a type
of event, or a type of message. See section 7.2.2 below.
Information: See section 7.2.4.
7.2.1.
Replay Properties
From the Logfile menu, you can adjust the speed of the logfile replay.
•
Choose Logfile → Play Properties.
Normal
This is the default replay speed (and the fastest).
Intermediate
Somewhat slower than Normal.
Interpretable
(Slow)
Very slow. At this speed, the screen is updated for
each new message, which is not the case for the
higher speeds.
7.2.2.
Searching a Logfile
During replay you can search a logfile for one of the following:
•
a time instant (e.g. “16:32:47”)
•
a type of event (e.g. “Call Setup”)
56
Chapter 7. Logfiles
•
a type of Layer 3 message, Layer 2 message, or mode report
•
filemarks with specified text.
To perform a search, click the Find in Logfile button on the Replay
toolbar.
The dialog that appears has separate tabs for each of the above categories.
•
Choose what you want to search for, then click either Find or Find Next.
–
If you click Find, the logfile is rewound to the beginning and then the
first occurrence of the requested item is searched for. The dialog is
closed immediately on clicking the Find button.
–
If you click Find Next, the search starts from the point to which the
replay has progressed. The dialog remains open.
When an item of the specified type has been found, the replay halts at this
point.
7.2.3.
Replay Section of Status Bar
While a logfile is being replayed, the Replay section of the status bar shows
the name of the file and indicates the percentage of the file that has been
replayed.
7.2.4.
Logfile Information
It is possible to view some information about logfiles.
Click Information on the Replay toolbar.
•
The Header tab window shows data on the logfile currently in use.
•
If the user who recorded the logfile made use of the “Add User Info” option
(see section 7.1.3), the User Info tab shows the information input by this
user.
7.3.
Copying Logfiles
It is possible to copy material from one logfile to another by recording from a
logfile that is being replayed. The replayed part of the file is then copied to a
new logfile. This function is handy if you want to study a particular segment of
a logfile more closely.
LZT 108 9851 R1B
57
TEMS Investigation 9.0 Data Collection User’s Manual
Note: The copy might not be fully equivalent to a complete logfile
created in the usual manner. For instance, if only part of a call is
copied, relevant data might be lost.
To perform the copying, follow the steps below:
•
Make sure that you are in replay mode, that is, disconnect any external
devices.
Open the logfile you want to copy from (if it is not already open).
•
Using the Replay toolbar, find the point in the logfile where you want to
start copying.
Halt the replay at this point by clicking Stop Logfile Replay.
Click Start Recording and name the logfile.
•
Using the Replay toolbar, replay the segment you want to copy. The
segment is copied as the replay proceeds.
Click Stop Recording (on the Record toolbar) when you want to stop
the copying.
Note: If you close the logfile while recording is in progress, you must
proceed by clicking Stop Recording.
It is not possible to record both phone data and logfile data in the same
logfile. You cannot have external equipment connected and replay a logfile at
the same time (see section 3.1, page 20).
7.4.
Loading Logfiles from Other Sources
TEMS Investigation Data Collection can load and replay logfiles from the
TEMS products listed below. Note that loading of files from certain sources
(marked with * below) requires a Base Package license. See the Getting
Started Manual, section 2.1.
•
TEMS Investigation 9.0, 8.x, 7.x, 6.x
•
TEMS Investigation GSM 5.x, 4.x, 3.x (except data recorded with SH888
or CF668 scanners)
58
Chapter 7. Logfiles
•
TEMS Investigation EDGE 1.x
•
TEMS Investigation WCDMA 3.x, 2.x
•
TEMS DriveTester GSM–TDMA 1.x (GSM logfiles)
•
TEMS Pocket 6.0, 5.x *
•
TEMS Automatic 7.0, 6.x (any MTU and HTU logfiles) *
•
TEMS Automatic 5.x (any MTU logfiles) *
•
TEMS Automatic 4.x (MTU logfiles recorded with GSM-only MTUs) *
•
TEMS Automatic 3.x, 2.5 *
TEMS Investigation Data Collection can also read
•
EFEM logfiles from Motorola phones *
•
MDM logfiles *
•
logfiles from Anritsu ML8720 scanners (i.e. files logged by the scanner
itself)
•
MTR files (GSM; see section 31.1, page 312)
7.5.
Exporting Logfiles
Logfiles can be exported in the following formats:
•
Text file with tab delimited data (suitable for processing in, for example, a
spreadsheet application). TEMS Automatic logfiles, too, can be exported
in this format. The text export format is described in detail in appendix D,
page 338.
•
MapInfo 3.0 (Interchange or Tab format)
•
ArcView Shapefile: about version, see appendix E.2, page 340
•
Marconi Planet DMS 3.1
•
Ethereal
•
MDM (CDMA)
Some of these formats contain multiple files for each logfile. See appendix E,
page 340 for details.
LZT 108 9851 R1B
59
TEMS Investigation 9.0 Data Collection User’s Manual
Note: Export in MapInfo, ArcView, or Planet format requires that the
data be positioned. If there is no positioning information in the
logfile, the export file will contain only a header and no route data.
7.5.1.
Preparing an Export Order
•
First, disconnect any external devices that are connected. This is
necessary in order for the export to work properly.
•
From the Logfile menu, choose Export Logfile.
Click Add. The Add Export Order dialog appears:
Format
Select the output format for your logfiles.
The choice “KPI samples (XML)” exports KPI data
from a logfile. See section 7.5.2.7.
Regarding the choice “Logfile with uplink data”, see
section 7.8. (This is not a logfile export format in the
usual sense.)
Input files
60
Type or select the logfile or logfiles you want to
export.
Chapter 7. Logfiles
Output: Merge
output
If you are exporting several logfiles and this option is
checked, all logfiles will be merged into a single set
of export files. (Logfiles are simply concatenated;
there is no sorting of messages by timestamps.) The
name given to the export files depends on the
ordering of logfiles in the Input files box.
If the “Merge output” option is unchecked, each
logfile is exported separately, and the export file set
simply retains the name of the logfile.
Output: Directory
The directory where the export files are written.
Output: Prefix,
Suffix
To the export file name you can add a descriptive
prefix and suffix if desired – e.g. downtown as prefix
and am or pm as suffix.
Output: Extension
File extension. Editable only for text files, where .fmt
is the default. Export to other formats produces files
with fixed extensions, as described in appendix E,
page 340.
•
Now click the Setup button to specify details of the export; see section
7.5.2 below.
7.5.2.
Specifying the Contents of Export Files
On clicking the Setup button, a dialog appears whose contents partly depend
on the format chosen. The Information Elements tab, however, is common to
all formats:
LZT 108 9851 R1B
61
TEMS Investigation 9.0 Data Collection User’s Manual
Here you select which information elements to include in the export. You
choose each individual element separately. From information elements with
arguments you pick one component at a time. By default the chosen item is
exported from all devices that report it.
•
To export an element, select it in the Available IEs list and click the “>”
button. If the element has arguments, you do not get the whole element at
once, but only the component with the lowest argument. To select the
component with the next higher argument, click “>” again. Repeat for all
components you want to export.
•
By default the items selected are picked from all phones. To export the
item only from specified phones, you must edit the item; see Editing the
Selected Items below.
•
To export an information element from the GSM Uplink category, choose
the category in the combo box in the Available IEs section. Elements from
different categories can be freely mixed in export files.
•
To remove an item from the Selected IEs box, select the item and click
“<”. To clear the entire Selected IEs box, click “<<”.
Editing the Selected Items
To edit an information element:
62
Chapter 7. Logfiles
•
In the Selected IEs box, select the desired item and click the Edit button
above the box. The Edit IE dialog appears.
For all export formats, you can restrict the export of a selected IE to a single
device, or change the IE argument (where one exists).
For all export formats except tab-delimited text, you can also edit the
following settings:
•
NAME field: This is the IE column heading in the export file. By default,
the column heading string consists of the IE name. (You might want to
make this string shorter.)
•
NODATA field: If you enter a string here, it will be written in the export file
whenever the IE does not have a valid value. For Planet, any string is
accepted, whereas for the remaining formats the string must be numeric
(e.g. “999”, “-1”).
As long as these settings have not been edited, the IE name is preceded by
an asterisk (*) in the Selected IEs box. Note also that the NAME and
NODATA settings are not saved along with other logfile export settings, but in
different files. See section 7.5.2.9.
Arranging Items in the Export Files
The order of the items in the Selected IEs list will also be the order in which
they come in the export files. You can rearrange the items by selecting them
and moving them using the Up and Dn buttons.
7.5.2.1.
Text File Specific Settings
Besides your chosen information elements, the text export file always
contains data on events, including user-inserted filemarks. There are no user
settings relating to the event data.
By default the text export file also contains message information.
Optionally, the export can be reduced in order to decrease the duplication of
data and the number of lines in the export file. The choice is made on the
Options tab:
LZT 108 9851 R1B
63
TEMS Investigation 9.0 Data Collection User’s Manual
Full message
information...
All messages are kept.
The following columns are optional: Message Type,
Message ID, and Hexadecimal String. Check a
column to include it. All other standard columns are
always included; see appendix D, page 338. In
addition there will be one column for each selected
IE or IE component.
If you check “Show changed IE values only”, IE
values are written out only if they have changed
since the previous message. This makes for a
considerable reduction of the export file size. If the
box is not checked, all IE values are written for every
message.
Events and
filemarks only...
Event information
64
The export file is reduced in two ways:
•
The columns Frame Number, Message ID, and
Hexadecimal String are excluded from the export
file. (The Event column is kept, as is the Event
Info column provided that the Event information
checkbox below is checked.)
•
Messages not triggering an event and containing
no changed IE values are wholly excluded.
Governs whether the Event Info column is included in
the export.
Chapter 7. Logfiles
Message options
7.5.2.2.
Check the relevant boxes in order to have Layer 2
messages, Layer 3 messages, and phones’ mode
reports exported as unabridged plain text to a
common separate file whose name ends in
_textexp.txt.
MapInfo Specific Settings
For MapInfo export (whether to Interchange or Tab format), the Options tab
looks like this:
Reports to export
data from
This setting governs what types of report from the
phone are included in the export files:
•
all reports
•
only Layer 3 reports
•
only mode reports.
By default all reports are exported.
LZT 108 9851 R1B
65
TEMS Investigation 9.0 Data Collection User’s Manual
Export message
information...
Events
Check this to include information on Layer 3 and
Layer 2 messages in the export files. The following
data is added (one column for each item):
•
Message direction (internal, uplink, downlink)
•
Message name
•
Hexadecimal string
•
Extension (containing cause values)
This setting governs the export of events.
Include file name
in file
•
Do not export events: No event information is
exported.
•
Export events but do not plot...: Events are
exported, but no event-specific symbol is used in
MapInfo when plotting on a map.
•
Export events and plot...: Events are exported,
and a unique symbol is used when plotting in
MapInfo to distinguish events from other data.
Note, however, that there is no differentiation of
event types, and that the symbol used is not one
of the default TEMS Investigation event symbols.
Check this to include the file name in the export files.
For details on MapInfo output, see appendix E.1, page 340.
7.5.2.3.
ArcView Specific Settings
Export message
information...
66
Check this to include information on Layer 3 and
Layer 2 messages in the export files. The following
data is added (one column for each item):
•
Message direction (internal, uplink, downlink)
•
Message name
•
Hexadecimal string
Chapter 7. Logfiles
For details on ArcView output, see appendix E.2, page 340.
7.5.2.4.
Marconi Planet Specific Settings
Export message
information...
Check this to include information on Layer 3 and
Layer 2 messages in the export file. The following
data is added (one column for each item):
•
Message direction (internal, uplink, downlink)
•
Message name
For details on Planet output, see appendix E.3, page 341.
7.5.2.5.
Ethereal Specific Settings
The export encompasses all of the logfile content. The “Export message
information” checkbox must be checked, otherwise the output file will be
empty.
For details on Ethereal output, see appendix E.4, page 341.
7.5.2.6.
MDM Specific Settings
MDM export is intended for logfiles recorded with Qualcomm chipset based
devices.
The export encompasses all Qualcomm-specific CDMA/WCDMA messages
in the logfile. The “Export message information” checkbox must be checked,
otherwise the output files will be empty.
For details on MDM output, see appendix E.5, page 341.
7.5.2.7.
“KPI Samples”
Select “KPI samples (XML)” in order to export KPI data from a logfile. KPI
samples are in XML format. One sample is produced for each execution of a
KPI command.
KPIs can be calculated in two slightly different ways, as explained in section
25.2, page 291. In the setup dialog you choose between “Method A” and
“Method B”.
LZT 108 9851 R1B
67
TEMS Investigation 9.0 Data Collection User’s Manual
To produce a KPI report, you feed the output from the export into the KPI
report generator: see section 7.7, page 74.
7.5.2.8.
“Logfile with Uplink Data”
This is not an ordinary logfile export format, but it has been grouped with
these for convenience; see section 7.8, page 76.
7.5.2.9.
Saving and Loading Export Setups
When you are done specifying the export, you may want to save the setup for
future use.
•
In the Setup dialog, click Save and store the file where appropriate. The
file extension will depend on the format (for example, .tex for a text-format
export setup).
•
To load a previously saved setup in the Setup dialog, click Load and
locate the setup file.
However, the NAME and NODATA settings for information elements (section
7.5.2, page 63) are not saved in the above-mentioned files. They are instead
written to DBF files that are found in the Settings directory beneath the TEMS
Investigation installation directory.
7.5.3.
Executing Export Orders
All the export orders you have defined are listed in the Export Logfile window.
•
To start executing the export orders, right-click and choose Start from the
context menu (or click the Start button in the window).
•
To abort the execution of the export orders, right-click and choose Abort
from the context menu.
A summary of the export execution appears in a popup window (“Export
Result”).
68
Chapter 7. Logfiles
7.6.
Generating Logfile Reports
Note: Route Analysis includes a reporting tool called RAN Tuning. See
the Route Analysis User’s Manual, chapter 16, page 91.
From one or several logfiles you can generate a report in HTML format which
summarizes the data in the logfiles.
For full details of logfile report contents and format, see appendix F, page
342.
•
The logfiles to be included in the report cannot be open while the report is
generated. If one of these files is currently open, close it.
•
If any external devices are connected, disconnect them. This is necessary
in order for the report generation to work properly.
To prepare a logfile report, click Generate Report on the Report toolbar.
This dialog appears:
•
First, choose the logfile or logfiles on which to base the report. Click Add
and browse for the files. Those that you choose are listed in the Files box.
•
Specify an output directory for the report. Enter a path, or click the button
labeled “...” to browse your file system.
LZT 108 9851 R1B
69
TEMS Investigation 9.0 Data Collection User’s Manual
•
Now click Properties to assemble the contents of the report. A multi-tab
dialog appears.
7.6.1.
IE Tab
The report can compare information element values with thresholds. It will
contain statistics of the type “Percentage of measurement points with RxLev
Full below –100 dBm”.
All thresholded information elements listed will also have their distributions
visualized in bar charts.
A number of thresholds are predefined in the dialog, as is seen in the above
screenshot; you can also define your own thresholds. Check those that you
wish to use, and uncheck the others. Check a cellular technology to use all
thresholds defined for that technology. Each item in the list represents a set of
two thresholds for an information element value:
or
Whether peaks or dips are counted depends on the information element and
cannot be changed.
70
Chapter 7. Logfiles
In the report, it is indicated for each threshold
•
how many times the value of the information element has crossed the
threshold (changed from a more normal value to a more extreme one)
•
how long these peaks/dips have lasted on average.
Adding User-defined Thresholds
•
To add a pair of thresholds, click the Add button.
•
Choose an information element.
•
Choose an argument (where applicable).
•
Specify the two thresholds.
•
Click Add to add this threshold pair to the list and keep the Add Threshold
dialog open.
•
Click OK to add this threshold pair to the list and close the Add Threshold
dialog.
Editing Thresholds
•
To edit a threshold, double-click it and enter the desired new value.
Editing Arguments
•
To edit the argument of the information element (where one exists),
double-click it and enter the desired new value.
Deleting Thresholds
•
To delete a threshold pair, select it and click the Delete button.
LZT 108 9851 R1B
71
TEMS Investigation 9.0 Data Collection User’s Manual
Customizing Value Ranges
The Ranges column is used to customize the drawing of distribution charts
(see appendix F.4, page 344). By default no ranges are set, and the
distribution charts are drawn in a preconfigured manner. If you set up your
own value ranges for an IE, the distribution chart will be drawn with one bar
for each range:
•
Select the desired information element.
•
Click the Edit Range button.
•
Modify the value ranges in the dialog that appears.
7.6.2.
Events Tab
The report has a section with event statistics. On this tab you choose what
event types to include in these statistics.
•
Check the events you want to include, and leave the rest unchecked.
Press Ctrl + A to select all events; press Ctrl + A again to deselect all
events.
Note: The ranking of cells in the report (“Worst Cell Indication”) is
partially based on the number of events occurring in the cell. The
algorithm counts all events, not only those signifying failures.
Therefore, in order for the cell ranking to make sense, only failure
events should be checked in this step. This is also the default
setting.
7.6.3.
•
Mobiles Tab
Check the external devices whose data you want to include in the report.
By default all devices used to record the logfile will be checked. GPS data, if
available, is included implicitly.
72
Chapter 7. Logfiles
7.6.4.
Scanned Channels Tab
Note: The settings on this tab are applicable only if your logfiles contain
scan data.
In this step you choose what scan data to present in the report. The same
dialog is used for scan data from all cellular technologies. The number
appearing within square brackets after each channel (GSM)/scrambling code
(WCDMA)/pilot number (CDMA) is the frequency band/UARFCN/RF channel.
•
Move the items that you wish to present from the Available box to the
Selected box.
For each selected item, the report will contain RxLev/code power statistics
(mean, median, min, max) and a bar chart. The averaging takes place in the
mW domain.
7.6.5.
User Details Tab
Here you can type a user name and a report number which will be printed in
the report header.
7.6.6.
Saving and Loading Report Setups
When you are done specifying the report contents, you may want to save the
setup for future use.
•
In the Report Properties dialog, click Save and store the file where
appropriate. The file extension is .rpt.
•
To load a previously saved setup into the Report Properties dialog, click
Load and locate the setup file.
7.6.7.
•
Generating the Report
In the Report wizard, click Finish.
The report will be stored under My Documents\TEMS Product Files\TEMS
Investigation 9.0\GeneratedReports.
LZT 108 9851 R1B
73
TEMS Investigation 9.0 Data Collection User’s Manual
7.6.8.
Report Contents
The logfile report has the following main sections (see appendix F, page 342
for a complete description):
•
Header: Date, Time, Prepared by
•
Logfile information: Logfile names and used equipment
•
Worst cell indication: Ranking of cells based on thresholds crossed and
events triggered
•
Thresholds: Detailed statistics on how often and in what cells each
threshold has been crossed
•
Events: Statistics on events
•
Scan data: Statistics on the signal strength of scanned channels (if any)
•
Distribution charts for thresholded parameters
•
Distribution charts for scan data (if any)
The output involving cell data naturally requires a cell file in order to be
generated.
7.7.
Generating KPI Reports (UMTS)
KPI data is exported from logfiles as “KPI samples” (section 7.5.1) in XML
format. From one or several such XML files you can generate a KPI report,
also in XML format, which presents KPIs based on the collected data. The
report XML file comes with an XML stylesheet and is directly presentable in
an XML-capable web browser.
For full details of logfile report contents and format, see appendix G, page
347.
•
If you have a logfile open, it is recommendable to close it before
generating the report.
•
If any external devices are connected, you must disconnect them.
To prepare a KPI report, click the button Generate Report KPI on the
Report toolbar. This dialog appears:
74
Chapter 7. Logfiles
•
First, choose the KPI sample or samples on which to base the report.
Click Add and browse for the files. Those that you choose are listed in the
Files box.
•
Under Output directory, specify an output directory for the report. Enter a
path, or click the button labeled “...” to browse your file system.
•
Under Template file, choose the XML stylesheet (*.xslt) that should
govern the layout of the KPI report. By default, a stylesheet stored under
<TEMS Investigation install dir>\XMLStylesheet is chosen.
Now click Properties to customize the KPI report. A multi-tab dialog appears.
7.7.1.
Threshold Values Tab
On this tab you indicate timeouts for various steps of data transfer
procedures:
LZT 108 9851 R1B
75
TEMS Investigation 9.0 Data Collection User’s Manual
•
Attach
•
PDP context activation
•
Service access; a separate timeout needs to be given for each service
•
WAP activation
•
MMS: MO transfer, notification, MT transfer
The timeouts affect the values of the corresponding KPIs measuring success/
failure ratios and time.
If a timeout is exceeded for any step of the PS access procedure, the whole
access procedure is considered as failed. When calculating the average
access time, only attempts that were successful (in the same sense) are
included. Similar handling applies to the “MMS send” and “MMS receive”
KPIs.
A more precise description of KPIs and timeouts is found in appendix G.
7.7.2.
User Details Tab
Here you can type a user name and a report number which will be printed in
the KPI report header.
7.7.3.
•
Generating the Report
In the Report wizard, click Finish.
When the KPI report is ready it will be opened in the default web browser,
provided that it supports XML.
7.8.
Merging Logfiles with Uplink (MTR) Data
It is possible to incorporate into logfiles data originating from Ericsson uplink
data files (MTR files). See chapter 31. The term “MTR file” will be used in this
section when referring to characteristics of this specific file type. Before going
through the mechanics of merging the files, it is appropriate to outline how the
merging algorithm works.
7.8.1.
The Merging Algorithm
The task of the merging algorithm is to time-align – synchronize – the
information in the uplink files with that in the logfiles. A time offset can be
76
Chapter 7. Logfiles
expected between the clock that governs uplink file time-stamping (for MTR
files, the BSC clock) and the clock in the PC on which the logfiles were
recorded.
While an uplink file contains (usually) one complete call involving a specific
phone (actually a specific IMSI, i.e. subscriber identity), a logfile can comprise
an arbitrary number of calls made by one or several phones. The typical
situation, therefore, is that a logfile corresponds to multiple uplink files, each
covering a logfile segment that concerns a single call: 1
Uplink files
idle
call
idle
call
idle
call
idle
Logfile
For each call in the logfile, the merging algorithm extracts a number of key
characteristics: start time, stop time, and information about handovers (time
of occurrence and serving cells involved). Then, each uplink file is compared
to each call in the logfile with respect to these characteristics. The uplink files
for which a reliable match has been found are finally incorporated into the
logfile, aligned as indicated by the calculated time offset. The output is a new
logfile (extension .log), augmented with the uplink information, which is
represented as being reported by a fictitious phone “MS5”.
The merging algorithm may sometimes fail for certain uplink files; typical
reasons for failure are discussed in section 7.8.2 below. When this happens,
you can put the algorithm on the right track by providing additional
information. There is also the possibility of aligning uplink files manually.
Regarding this, see section 7.8.3 under Handling Problematic Uplink Files.
1. Note, however, that both types of file may contain call fragments. Multiple
MTR files will be generated by a call if switching between BSCs occurs
during the call (provided of course that all BSCs are recording). TEMS
logfiles will contain fragments of calls whenever recording is not active
throughout a call, and also when the “Swap logfiles” function is used so
that the recording continues to a new file (section 7.1.3, page 52).
LZT 108 9851 R1B
77
TEMS Investigation 9.0 Data Collection User’s Manual
7.8.2.
Limitations of the Merging Algorithm
If the merging algorithm has enough to go on, that is, if all calls in the files can
be readily distinguished from each other by means of the characteristics
considered, the procedure is straightforward. However, if this is not the case
for some uplink file, so that there is difficulty in finding an obvious best match
for it, the procedure will fail for this file.
Problems will thus arise with sets of similar calls, especially if they are short
and lack distinctive features (namely, handover events). Multiple calls with
uniform characteristics can indeed be expected when running a command
sequence repeatedly (about command sequences, see chapter 12, page
137). Fragments of calls, whether in uplink files or logfiles, are also more
likely to be problematic, because either the start time or stop time and thus
the call duration is unknown.
Furthermore, the algorithm does not handle day transitions. Therefore, it
cannot correctly process calls beginning before and ending after midnight, or
deal with time offsets that are so large as to place part of the calls on a
different day. In other respects the size of the time offset does not affect the
performance of the algorithm.
7.8.3.
Performing the Merge
The procedure is carried out from the Export Logfile window:
•
From the Logfile menu, choose Export logfile.
In the Export Logfile window, click Add.
•
Under Input files, enter the logfile names, or click “Browse file” and select
your files. (If you choose several logfiles, the merge will be done
separately for each logfile.)
•
Under Directory, specify a directory for the output.
•
In the Format combo box, choose “Logfile with uplink data”.
•
Click the Setup button.
In the dialog that follows, you decide how to perform the merge (Method tab)
and what uplink files to include in it (Uplink files tab).
78
Chapter 7. Logfiles
Method Tab
Unless you somehow know the exact time offset beforehand, you should
begin by running the algorithm described in the previous sections. (If you do
know the offset, you may want to carry out the alignment yourself. See
section 7.8.3 under Manual Alignment.)
•
“Mobile to match in logfile” determines what logfile data is considered
when comparing it with the uplink files. If you have data from several
phones in the logfile, but uplink files for a single phone, it is appropriate to
disregard the data from the other phones: this eliminates a source of
uncertainty in the matching process and also speeds it up.
•
If you have some idea about the size of the offset, you can check “Place
bounds on uplink file offset” and enter lower and upper bounds. This, too,
increases the reliability and speed of the algorithm.
Uplink Files Tab
On this tab you choose your uplink files. You do not have to list them in any
particular order.
Running the Merging Algorithm
When you have completed the Add Export Order dialog, the specified merge
appears in the list in the Export Logfile window.
Click Start to carry out the merge.
LZT 108 9851 R1B
79
TEMS Investigation 9.0 Data Collection User’s Manual
The procedure will take some time. When it has completed, you will receive a
message (“Export Result”) stating success or failure for each uplink file. See
the example in section 7.8.5.
•
If all uplink files have been successfully matched, you are done.
•
If the algorithm has failed for some files, see Handling Problematic
Uplink Files below. Do not close the Export Result window – you will
need to inspect the information given there.
To terminate an ongoing merge, click Abort.
Handling Problematic Uplink Files
If no sufficiently reliable match is found for an uplink file, it is not included in
the output logfile. There are two possibilities: Either there is no match – the
data in the uplink file simply does not exist in the logfile –, or there is indeed a
match to be found, but the algorithm has problems identifying it, typically for
one of the reasons stated in section 7.8.2.
In the latter case, you can try to remedy the problem as follows. What the
algorithm needs in order to align the troublesome file, or files, is more precise
information about the offset. Often several calls in the logfile are good
matches and there is a problem figuring out which is the correct one. Now,
the offsets calculated for the successfully aligned uplink files (which should
be nearly identical) should be similar to that of the remaining files as well.
Therefore, you can assist the algorithm by feeding back the information on
the offset: 1
In the Export Logfile window, click the Edit Order button.
•
Click Setup.
•
On the Method tab, check “Place bounds on uplink file offset” and enter
upper and lower bounds based on the values observed in the Export
Result window. The bounds should be tight enough to ensure that a call in
the logfile cannot be mistaken for an adjacent call.
Exit the dialogs, and click Start to run the algorithm again.
With this new constraint applied, it should be possible to align all the uplink
files that have a genuine match.
1. The reasons for requiring that this be done manually are given in the
section Why the Manual Steps? below (page 81).
80
Chapter 7. Logfiles
Manual Alignment
If the procedure still fails for some files, they probably do not correspond to
anything in the logfile. It might be the case, however, that some files are
corrupt (for instance, they might be truncated). Even so, you might want of
course want to use them. There may also be a day transition problem (see
section 7.8.2). As a last resort, therefore, you can carry out the alignment by
brute force, simply assuming an offset:
•
On the Method tab, choose “Assume static offset time” and enter a value
in the box. (The offsets obtained for the successfully aligned files should
still be a good clue.)
Click Start.
The remaining files will then be aligned unconditionally with the logfile
according to the chosen offset.
You might also prefer to use this method if you have already determined the
offset outside TEMS Investigation.
Why the Manual Steps?
You may ask why the offset that has been reliably determined for some uplink
files is not automatically assumed for the other files (for which the algorithm
has initially failed). After all, this would eliminate the need for intervention by
the user.
The answer is that it has been thought safest to give a warning as soon as
something goes wrong, and leave it to the user to decide what to do next with
the concerned files. As already noted, they might not belong with the logfile at
all, or they may be damaged and possibly uninterpretable.
7.8.4.
Accuracy of the Alignment
Note: This section is to a great extent MTR file specific.
There are limits to the accuracy that can be achieved in time-aligning the
uplink files. The accuracy is affected by the following factors:
•
The time offset for an uplink file is computed as the average of the offsets
for all characteristic events detected in the call (call start, call end,
handovers, etc.). Therefore, the longer the call, the more reliable the
offset, and vice versa.
LZT 108 9851 R1B
81
TEMS Investigation 9.0 Data Collection User’s Manual
•
Measurement reports in MTR files are not tagged with time-of-day
information, but merely with a counter that is reset after each handover.
This may have the effect that the MTR measurement reports are
imperfectly synchronized with the measurement reports from the phone.
7.8.5.
Example
Suppose that we want to merge the following files:
00.axe
19.axe
02.axe
20.axe
18.axe
21.axe
Uplink files
logfile.log
TEMS
logfile
We do not know anything about the offset, and therefore we first run the
automatic algorithm without specifying any bounds:
The following result is obtained:
82
Chapter 7. Logfiles
The outcome is indicated for each uplink file:
•
A time indication after the file name means that the file was successfully
matched and merged with the logfile. The time is the offset determined for
this file. Here we see that files 02, 18, and 20 were successfully matched.
•
“ambiguous” means that several good matches were found, and it was
impossible to determine which of them is correct (here, 19 and 21).
•
“no match” means that the uplink file matched nothing in the logfile (here,
00).
In the last two cases the merge has failed. File 00 most probably does not
belong with the logfile at all, and in any case it cannot be aligned using the
algorithm. For files 19 and 21, on the other hand, it should be possible to find
a single match by specifying bounds on the offset. The offsets computed for
02, 18, 20 suggest a value close to –1570 seconds, so we fill in the dialog as
follows:
LZT 108 9851 R1B
83
TEMS Investigation 9.0 Data Collection User’s Manual
Running the algorithm once more gives
Files 19 and 21 could now be aligned unambiguously, and the procedure is
finished (file 00 must be discarded in the context).
84
Chapter 8. GSM Scanning
8.
GSM Scanning
TEMS Investigation Data Collection supports scanning of GSM radio
frequency carriers with Sony Ericsson phones1 and PCTel SeeGull LX/EX
scanners. It is possible to scan with several devices simultaneously, and
naturally the output from all of them can be displayed in parallel. How to
connect phones and scanners is described in chapter 6.
Note: A Sony Ericsson phone cannot act as an ordinary phone while it
is scanning. In particular, it cannot engage in voice calls or data
transfer.
Scanning tasks are set up from the Equipment Control toolbar, whereas the
output of scans is primarily intended to be displayed in a suite of ready-made
bar charts. However, since all scan data is available in information elements,
you are free to present it in any presentation window.
A note on terminology: GSM radio frequency carriers are sometimes referred
to below as channels for simplicity, although this is a slight abuse of the term.
Some technical data on PCTel scanners is provided in appendix H, page 363.
8.1.
Scanning Methods
You can scan an arbitrary user-selected set of channels. See section 8.2.
8.2.
Frequency Scanning Mode
This mode scans an arbitrary unchanging set of channels.
•
An ordinary GSM signal scan is supported by all scanning-capable
devices.
1. For specifics, see Information Elements and Events, section 5.2.
LZT 108 9851 R1B
85
TEMS Investigation 9.0 Data Collection User’s Manual
•
With a PCTel scanner you can also do a CW (Continuous Wave) scan if
no GSM signal but only the carrier is present. See section 8.2.5.
To set up the scan:
•
Connect the device to scan with if it is not already connected. See chapter
6. (You must have the device connected to be able to access the
Measurement Settings dialog.)
•
On the Equipment Control toolbar, in the Scanning Task combo box,
select “[GSM] Frequency Scanning”.
Click the Scan Properties button.
The Measurement Settings dialog appears. It looks slightly different
depending on what device is connected. Here is the dialog shown for a PCTel
SeeGull scanner.
Manual selection/
Channel selection
Click the button to define the set of channels to scan.
A new dialog appears; see section 8.2.1.
Don’t use internal
GPS
Check this if you do not want to use the scanner’s
internal GPS for positioning. Note that if you set up
other (i.e. WCDMA) scanning methods for the same
scanner, you must check this option for these
methods as well, otherwise the internal GPS will be
used anyway.
86
Chapter 8. GSM Scanning
Within a radius of
Not used.
Decode BSIC
See section 8.2.2.
C/I measurements
See section 8.2.3.
Decode SI on
strongest cell
See section 8.2.4.
Normal band;
Narrow band (CW)
See section 8.2.5.
There is no limit to the selectable number of channels. However, it may
happen that the task assigned exceeds the capabilities of the device. If so,
the device will scan as many channels as it is capable of.
8.2.1.
Channel Selection
You can select your channels either by checking them in the list box or by
typing a text string in the field at the bottom:
LZT 108 9851 R1B
87
TEMS Investigation 9.0 Data Collection User’s Manual
Selecting Channels from a List
•
Under Channel Group, choose a set to pick your channels from: all
channels, a frequency band, or a group that you have defined yourself
(see section 8.7, page 91).
•
The chosen channel set appears in the Selected Channels list box. Check
the channels you want to scan. To choose a set of channels, select the set
(using Ctrl-click or Shift-click as usual), right-click in the selection, and
choose Select/Deselect. Repeat to deselect. To scan all channels in the
list, right-click in the list and choose Select/Deselect All. Repeat to
deselect all channels.
Specifying Channels in a Text String
•
In the Selected Channels combo box at the bottom of the dialog,
enumerate the channels in a text string, using commas or spaces as
separators and hyphens to indicate intervals.
•
Channel numbers common to GSM 1800 and 1900 will be interpreted as
GSM 1800 channels. To indicate a GSM 1900 channel, you must add
“[1900]” after the channel number. GSM 1800 channels may optionally
have “[1800]” appended to them.
Example: “1, 3, 5-8, 512, 512-514[1900]” selects the E-GSM channels 1, 3, 5,
6, 7 and 8, the GSM 1800 channel 512, and the GSM 1900 channels 512,
513 and 514.
The Selected Channels combo box maintains a history list of previous inputs;
click the arrow to reuse these.
Note that input to the combo box overrides any selections in the list box (the
list box is cleared).
8.2.2.
BSIC Decoding
Checking the box “Decode BSIC” causes the Base Station Identity Code to
be decoded whenever possible. It should be noted that BSIC decoding is
computationally costly and considerably reduces the sample rate of the
scanning device.
PCTel scanners supplied with older versions of TEMS Investigation may lack
BSIC decoding capability. Check the Device Inquiry mode report from the
scanner to find out whether it is capable of decoding BSIC.
88
Chapter 8. GSM Scanning
8.2.3.
C/I Scanning
(PCTel scanners only)
Checking the box “C/I Measurements” causes a subset of the “C/I”
information elements to be updated, as described in Information Elements
and Events, section 3.2. PCTel scanners can be purchased with or without
the C/I scanning function enabled; check the Device Inquiry mode report from
the scanner to find out whether it has this capability (“GSM BCCH C/I”). If
available, the function can be turned on and off in the dialog.
Sony Ericsson phones cannot measure C/I in scan mode.
8.2.4.
System Information Decoding
(PCTel scanners only)
Checking the box “Decode SI on strongest cell” causes the scanner to
decode System Information messages for the strongest cell. The scanner
must suspend the regular scan in order to read System Information, and this
is therefore done only once each time the strongest cell changes. Whenever
System Information is read, the information element Neighbor (SI) ARFCN is
updated.
8.2.5.
CW Scanning
(PCTel scanners only)
For PCTel scanners you select whether to perform a GSM signal scan
(“Normal Band”) or a CW scan (“Narrow Band”). This setting applies to all
channels you select for scanning as described in section 8.2.1. It is not
possible to specify the type of scan for each channel separately.
Regardless of the type of scan selected, the measurements are delivered in
the same information elements (Scanned RxLev, etc. in the “GSM” category).
8.3.
•
Performing a Scan
On the Equipment Control toolbar, choose the device to scan with in the
combo box.
To start scanning, click the Start/Stop Scanning button.
LZT 108 9851 R1B
89
TEMS Investigation 9.0 Data Collection User’s Manual
While the scanning is going on, the combo box on the Equipment Control bar
and the status bar both display the device with a padlock symbol, indicating
that the device is busy scanning.
To stop scanning, click the Start/Stop Scanning button once more.
8.4.
Recording Scan Data
To record scan data, create a new logfile as described in section 7.1.
8.5.
Presentation of GSM Scan Data
The main vehicle for presenting GSM scan data is the Scan Bar Chart:
Scan Bar Chart
The top chart by default shows the strongest scanned channels sorted by
decreasing signal strength. The bottom chart by default shows all scanned
channels in order of ascending ARFCN.
Regarding the bar chart window itself, see chapter 22.
Scan data can also be presented in status windows. There is no predefined
status window for this purpose, but you can design one yourself: see chapter
90
Chapter 8. GSM Scanning
16, page 214. The information elements of interest are those in Information
Elements and Events, section 3.2 that are associated with scanning.
8.6.
Replaying Scan Data
If you are replaying a logfile with scan data, you will probably want to replay
the file slowly in order to see clearly what is happening. The replay speed is
set from the Logfile menu (see section 7.2.1, page 56).
8.7.
Defining Your Own Channel Groups
The set of channels displayed in the Selected Channels box is determined by
the choice in the Channel Group combo box (see section 8.2.1; the default is
All Channels). It is possible to define custom channel groups and show only
the members of such a group in the list box. You may find this convenient if
you often scan some restricted set of channels.
Note: A channel group does not define which channels are actually
scanned. It only defines the set of channels that can be selected
for scanning.
Channel groups are created and managed in the same way as scrambling
code/UARFCN groups for WCDMA; see section 9.11, page 120 for full
details.
LZT 108 9851 R1B
91
TEMS Investigation 9.0 Data Collection User’s Manual
9.
WCDMA Scanning
TEMS Investigation Data Collection supports scanning of UMTS frequencies
with one of the following devices:
•
Sony Ericsson Z750i phone operating in scan mode
•
PCTel SeeGull LX/EX scanner
•
Anritsu ML8720/8740/8741 scanner.
It is possible to scan with several such devices concurrently. How to connect
devices is described in chapter 6.
Scanning tasks are set up from the Equipment Control toolbar, whereas the
output of scans is primarily intended to be displayed in a suite of ready-made
bar charts and other windows. However, since all scan data is available in
information elements, you are free to present it in any presentation window.
The scanning presentation windows are fully synchronized with the rest of the
application.
Note that the internal GPS in a PCTel scanner, as well as a GPS connected to
an Anritsu scanner, will deliver data only while a scan is in progress.
Some technical data on PCTel scanners is provided in appendix H, page 363.
9.1.
Scanning Methods and Scanning Capacity
TEMS Investigation offers these WCDMA scanning methods, supported
using the various scanners as indicated:
92
Section Ref.
PCTel SeeGull EX
PCTel SeeGull LX
Anritsu
SE Z750i
Chapter 9. WCDMA Scanning
CPICH, static SC set
9.4
CPICH, Top N
9.4
CPICH, SIB decoding
9.4
CPICH, High Speed/High Dynamic
9.4.3
CPICH: P-SCH + S-SCH
CPICH: No. of UARFCNs
9.4
12
1/2a
4
12
9.4
SCH timeslot
9.5
Continuous Wave (CW)
9.6
Spectrum analysis
9.7
Network search
9.8
a. Depending on physical configuration.
The scanning methods are conceptually independent and can be run
concurrently by PCTel scanners. Only the scanner measurement capacity
places a limit on the possibilities of handling several scanning tasks in
parallel. For example, a SCH timeslot scan at maximum resolution requires
the full resources of the PCTel scanner, so that it cannot perform any other
tasks at the same time.
A PCTel scanner has a capacity of 2,560 measurement points. As you set up
the scanning tasks, you are continuously notified in the setup dialogs of how
many measurement points you have used up.
The Sony Ericsson Z750i does not handle concurrent execution of multiple
scanning methods (CPICH and Network search).
LZT 108 9851 R1B
93
TEMS Investigation 9.0 Data Collection User’s Manual
9.2.
Performing a Scan
Regardless of scanning method, the procedure for performing a scan is as
follows:
•
Connect the device to scan with if it is not already connected. See
chapter 6. (You must have the device connected to be able to access the
Measurement Settings dialog.)
•
Set up the scan according to one of the sections 9.4, 9.5.1, 9.6.1, or 9.7.1.
To start scanning, click the Start Scanning button.
While the scanning is going on, the status bar shows the padlock symbol
indicating that the scanner is busy.
,
To stop scanning, click the Stop Scanning button.
9.3.
Recording Scan Data
To record scan data, create a new logfile as described in section 7.1.
9.4.
CPICH Scanning (with SCH Scanning)
This method scans CPICH control channels, scrambled with cell-specific
scrambling codes. Several UARFCNs can be scanned at a time.
Where supported, the same method also scans primary and secondary
synchronization channels (P-SCH, S-SCH).
9.4.1.
•
Scan Setup
On the Equipment Control toolbar, choose the scanning device in the left
combo box, and choose “[(W)CDMA] CPICH/PN Scanning” in the right
combo box.
On the Equipment Control toolbar, click the Scan Properties button.
A dialog appears in which you choose what scrambling codes and UARFCNs
to scan, and set some scan parameters. UARFCNs and scrambling codes
are selected independently of one another. The details are different for each
brand of scanner; see below.
94
Chapter 9. WCDMA Scanning
9.4.2.
CPICH Scanning with Sony Ericsson Z750i
CPICH scanning can be set up in the following ways:
•
User-defined, static set of scrambling codes (common to all UARFCNs)
scanned. Optional snapshot SIB decoding.
•
User-defined, static set of scrambling codes (common to all UARFCNs)
scanned. Unconditional and continuous SIB decoding.
•
Strongest scrambling codes scanned (“Top N”). Optional snapshot SIB
decoding.
These setups correspond to the radio buttons in the dialog below.
Scan selected
Choose this to scan a static set of scrambling codes
on all frequencies defined under “UARFCN” below.
Up to 40 scrambling codes can be selected. Click the
Select button to pick your scrambling codes: see
section 9.4.5.
The number of scrambling codes currently selected
appears within brackets on the right.
LZT 108 9851 R1B
95
TEMS Investigation 9.0 Data Collection User’s Manual
BCH scanning
If you choose this option, you select scrambling
codes in the same way as for Scan selected, and the
same scan data will be collected. However, the
updating frequency will be considerably lower, and
the sensitivity of the scrambling code detection may
be lower as well.
The processing time freed up in this way is instead
used to decode System Information Blocks (SIBs).
This decoding is furthermore continuous, unlike that
governed by the System information option (which
see).
Scan strongest
Choose this to scan the N strongest scrambling
codes (N ≤ 40) on the chosen UARFCNs. The
scanner automatically finds the strongest scrambling
codes.
System
information
This option can be selected for Scan selected and
Scan strongest. If selected, a “snapshot” SIB
decoding will be done once every time a new cell has
become the strongest (unless that cell has previously
appeared as the strongest during the last two
minutes). On completing the SIB decoding, the
phone reverts to regular CPICH scanning. If the
strongest cell does not change within two minutes,
SIBs will be decoded again for that cell.
Cell noise floor
(Ec/Io)
Ec/Io threshold for accepting a signal on the CPICH
as a detected cell. The threshold should be adjusted
to ensure detection of cells actually present while
keeping the false detection rate down.
The default is –26 dB.
UARFCN
Here you set the UARFCNs of the frequencies on
which to scan the CPICH. The allowed range is
dependent on the frequency band. Click the Select
button to pick your UARFCNs. A dialog appears
which is analogous to that described in section 9.4.5.
The number of UARFCNs currently selected appears
within brackets on the right.
96
Chapter 9. WCDMA Scanning
9.4.3.
CPICH Scanning with PCTel SeeGull LX/EX
The set of scrambling codes to scan on each UARFCN is composed in one of
two ways:
•
user-defined, static set of scrambling codes, common to all UARFCNs
(LX only)
•
strongest scrambling codes (“Top N”)
The image below shows all settings provided in TEMS Investigation for this
scan mode. What settings are supported by the various PCTel SeeGull
models appears from the table in section 9.1. Only supported settings are
displayed in the dialog.
Scan selected
Choose this to scan a static set of scrambling codes
on all frequencies defined under “UARFCN” below.
The same scrambling codes will be scanned on the
CPICH and on the P-SCH and S-SCH.
Up to 128 scrambling codes can be selected. Click
the Select button to pick your scrambling codes: see
section 9.4.5.
The number of scrambling codes currently selected
appears within brackets on the right.
LZT 108 9851 R1B
97
TEMS Investigation 9.0 Data Collection User’s Manual
Scan strongest
Choose this to scan the N strongest scrambling
codes (N ≤ 32) on the chosen UARFCNs. The
scanner automatically finds the strongest scrambling
codes.
Data mode
It is possible to reduce the amount of data that is
presented and recorded:
•
“Full” means no reduction.
•
“Sub” means that some data is not presented or
recorded (compare sections 9.4.8 and 9.4.10).
Checking the SIR checkbox causes the scanner to
deliver the information elements “Sc ... SIR” (requires
PCTel scanner software release 5.0 or higher).
It should be noted that choosing “Sub” results in a
much faster updating of scan presentations. The
precise meaning of “Sub” depends on the scope of
the scan:
•
For “Scan selected”, Time Offset, P-SCH Ec/Io,
S-SCH Ec/Io, and Rake Finger Count are
excluded, as is SIR. (The SIR checkbox is
disabled in this case.)
•
For “Scan strongest”, only P-SCH Ec/Io and
S-SCH Ec/Io are excluded.
The default is always “Sub”.
High Dynamic,
High Speed
These are two algorithms with different priorities.
High Dynamic puts the emphasis on accuracy. Each
sample reported by the scanner is typically based on
a measurement 20 ms in length.
High Speed is faster and accordingly less accurate.
Each reported sample is typically based on a 10 ms
measurement.
SIB
Check this box to decode System Information blocks.
With this option selected, a maximum of 16
scrambling codes can be scanned.
From the SIB decoding are extracted the information
elements “Sc 1st (2nd, 3rd, 4th) Intra-freq Cells”.
98
Chapter 9. WCDMA Scanning
Dwelling time
The length of time the scanner dwells on each
scrambling code (cell) trying to decode System
Information blocks, before moving on to the next cell.
Given as a multiple of 40 ms. The default is 50 =
2000 ms.
UARFCN
Here you set the UARFCNs of the frequencies on
which to scan the CPICH, P-SCH, and S-SCH. The
allowed range is dependent on the frequency band.
Click the Select button to pick your UARFCNs. A
dialog appears which is analogous to that described
in section 9.4.5.
The number of UARFCNs currently selected appears
within brackets on the right.
Don’t use internal
GPS
Check this if you do not want to use the scanner’s
internal GPS for positioning. Note that if you set up
other scanning methods for the same scanner, you
must check this box for the other methods as well,
otherwise the internal GPS will be used anyway.
PN threshold
This is a signal code power threshold (in dB) used for
the Aggregate Ec/Io and Delay Spread
measurements (see section 9.4.7).
If the PN threshold is set too low, the Aggregate
Ec/Io and Delay Spread values will be affected by
random noise more than may be desired. By raising
the threshold you reduce the influence of random
noise correlations, and you will thus be able to
discern multipath and fading effects more accurately.
The setting –20 dB is recommended.
Used
measurement
points
9.4.4.
Number of scanner measurement points used so far
by all scanning methods together. See section 9.1.
CPICH Scanning with Anritsu
The set of scrambling codes to scan on an UARFCN is composed in one of
two ways:
•
user-defined, static set of scrambling codes, common to all UARFCNs, or
•
strongest scrambling codes (“Top N”)
LZT 108 9851 R1B
99
TEMS Investigation 9.0 Data Collection User’s Manual
Scan selected
Choose this to scan a static set of scrambling codes
on all frequencies defined under “UARFCN” below.
The same scrambling codes will be scanned on the
CPICH and on the P-SCH and S-SCH.
Up to 32 scrambling codes can be selected. Click the
Select button to pick your scrambling codes: see
section 9.4.5.
The number of scrambling codes currently selected
appears within brackets on the right.
Scan strongest
Choose this to scan the N strongest scrambling
codes (up to 32) for the chosen UARFCNs (“Top N”).
The scanner automatically finds the strongest
scrambling codes.
UARFCN
Here you set the UARFCNs of the frequencies on
which to scan the CPICH, P-SCH, and S-SCH. The
allowed range is dependent on the frequency band.
Click the Select button to pick your UARFCNs (one
or at most two, depending on the physical
configuration of the scanner). A dialog appears which
is analogous to that described in section 9.4.5.
The number of UARFCNs currently selected appears
within brackets on the right.
100
Chapter 9. WCDMA Scanning
Selective Level
This threshold (value in dB) determines how high
above the noise floor a scrambling code must reach
in order to be accepted as valid by the scanner. The
default is 4 dB.
Rake Threshold
This threshold (value in dB) determines, for a given
scrambling code, how strong a signal path must be
(in relation to the strongest signal path for that
scrambling code) in order to be accepted as valid.
Setting the threshold at n dB means that a signal
path must not be more than n dB weaker than the
strongest one. In other words, this threshold governs
how many Rake fingers will contribute to the signal.
The default is 20 dB.
P-CPICH, SCH
This setting governs the choice of cell search method
in Top N scan mode (“Scan strongest” option).
•
If P-CPICH is selected, only CPICH channels will
be scanned to find scrambling codes. (For all
scrambling codes detected in this way, however,
the scanner will measure and report on the PSCH and S-SCH as well.) This mode is useful
especially for troubleshooting of transmitters.
The P-CPICH mode cannot be used if two
UARFCNs are to be scanned. If you select two
UARFCNs, the P-CPICH radio button is grayed.
•
9.4.5.
If SCH is selected, the scanner will search for
scrambling codes that use P-SCH and S-SCH.
This is more suitable for drive testing and is the
default setting in TEMS Investigation. If you are
scanning two UARFCNs it is the only option, as
explained above.
Manual Scrambling Code/UARFCN Selection
This section describes the dialog used to select scrambling codes manually.
The dialog for selecting UARFCNs is completely analogous.
LZT 108 9851 R1B
101
TEMS Investigation 9.0 Data Collection User’s Manual
You can select your scrambling codes either by checking them in the list box
or by typing a text string in the field at the bottom:
Selecting Scrambling Codes from the List
•
In the Selected SCs list box, check the scrambling codes you want to
scan. To choose a set of scrambling codes, right-click in the selection and
choose Select. To scan all scrambling codes in the list, right-click in the list
box and choose Select All. There are also corresponding context menu
commands for deselecting scrambling codes. (The standard Windows
Ctrl-click and Shift-click operations also work.)
Specifying Scrambling Codes in a Text String
•
In the Selected SCs combo box at the bottom of the dialog, enumerate
the scrambling codes in a text string, using commas or spaces as
separators and hyphens to indicate intervals.
Example: “1, 3, 5-8, 511” selects scrambling codes 1, 3, 5, 6, 7, 8, and 511.
The Selected SCs combo box maintains a history list of previous inputs. Click
the arrow to reuse history items. Note that input to the combo box overrides
any selections in the list box (the list box is cleared).
102
Chapter 9. WCDMA Scanning
Scrambling Code Groups
Under SC Group, you can define custom subsets of scrambling codes to
govern what is displayed in the Selected SCs list. By default, all scrambling
codes are displayed. To define a subset, click the Define button; see section
8.7.
9.4.6.
Presentation: General
CPICH scan data is presented in
•
the CPICH Scan bar charts (section 9.4.7)
•
the CPICH Scan Data status window (section 9.4.8)
•
the CPICH Scan line charts (section 9.4.9)
Synchronization channels are presented in the Synch Channels window
(section 9.4.10).
9.4.7.
Presentation: “CPICH Scan” Bar Charts
The CPICH Scan bar charts present CPICH scan data. One predefined bar
chart is provided for each UMTS frequency scanned.
Each bar chart by default presents peak Ec/Io (see section 9.4.8) for each
scrambling code found. About data sorting, see section 9.4.13.1.
LZT 108 9851 R1B
103
TEMS Investigation 9.0 Data Collection User’s Manual
The updating rate is chiefly dependent on the number of live signals
encountered in the network. For a manually selected set of scrambling codes,
the updating rate is also greatly affected by the size of this set, whereas for
the “Top N” scan the number N is only marginally important (since all
scrambling codes have to be searched regardless of N).
9.4.8.
Presentation: “CPICH Data” Status Windows
The CPICH Data and CPICH Best UARFCN Data status windows both
contain a large number of columns with scan data. They differ only with
respect to sorting: CPICH Data is sorted first by UARFCN, whereas CPICH
Best UARFCN Data is sorted by Aggr Ec/Io regardless of UARFCN. The
columns have the following meanings:
SC
Scrambling code number.
Peak Ec/Io
The peak code power of the scrambling code (Ec)
relative to the total signal power in the channel (Io),
i.e. the difference between them in dB.
Peak Ec
The peak code power of the scrambling code in dBm.
Ag Ec/Io
The aggregate code power of the scrambling code
relative to the total signal power in the channel (Io),
i.e. the difference between them in dB.
Ag Ec
The aggregate code power of the scrambling code in
dBm. The aggregate code power is a measure of the
total signal power (distributed around the main peak
due to multipath propagation) that is above the PN
threshold (settable in the PCTel scanner: see section
9.4.3).
Aggr–Peak Ec
Difference in dB between the aggregate code power
(Ag Ec) and peak code power (Peak Ec), i.e. Rake
receiver gain.
Delay Spread
Time in chips from the first to the last Ec/Io peak that
is above the PN threshold. This is a measure of the
signal spreading due to multipath propagation.
RFC
Rake finger count, i.e. the number of Ec/Io peaks
(multipath components) that are above the PN
threshold.
104
Chapter 9. WCDMA Scanning
Time Offset
The time offset of the radio frame on the CPICH,
given in chips from a 1/100th second time mark
aligned with GPS time. Ranges from 0 to 38399.
SIR
Signal-to-interference ratio of the scrambling code in
dB. Measured on DPCCH.
All of these are identical with information elements having similar names but
beginning with “Sc”. See Information Elements and Events, section 3.3.
9.4.9.
Presentation: “CPICH Scan” Line Charts
The default configuration of this window is as follows:
Chart Panes
The charts present the five strongest scrambling codes. The top chart shows
Aggr Ec (in dBm) and the bottom chart shows Aggr Ec/Io (in dB).
Legend Pane
The Legend pane (bottom left) glosses either of the two charts. To switch to
the other chart, right-click and choose the desired chart from the context
menu.
Additional Information Pane
The Additional Information pane (bottom right) shows the CPICH pilot
pollution situation.
LZT 108 9851 R1B
105
TEMS Investigation 9.0 Data Collection User’s Manual
•
Poss No Of AS Members:
The active set (AS) is defined as the set of scrambling codes (SCs)
associated with channels that are assigned to a particular subscriber unit.
Here an SC is regarded as a possible active set member if it is sufficiently
strong compared to the strongest SC. The relative code power threshold
is determined by the argument within square brackets []. Note that one
cannot know for sure (on the basis of the scan data alone) whether the
possible members actually do belong to the active set.
Example: If the argument is 3 (default value), all SCs with a code power
not more than 3 dB below that of the strongest SC will be counted. In the
above figure, there are three such SCs, so the active set is judged to have
a total of four possible members.
•
Other/Own ... :
These are estimated ratios between polluting signal power and desired
signal power, based on the power threshold described above (again given
as argument to each information element) and on different assumptions
about the number of possible active set members. The four “Other/Own”
elements represent the assumptions that there is desired signal power on
1, 2, 3, and 4 SCs respectively.
For “Max N SCs”, “Own” is the sum of the code powers of the N strongest
possible active set members, if the number of possible members is at
least N; otherwise it is simply the sum of the code powers of all possible
active set members. “Other” is the sum of the code powers of all
remaining SCs.
In the example below, there are three other SCs reaching above the
threshold which is set relative to the strongest SC. However, for “Max 2
SCs”, only the strongest of the three is included in “Own”.
106
Chapter 9. WCDMA Scanning
SC code power
Strongest SC
Distance to threshold,
indicated by argument
Threshold for possible AS
members (which are
included in “Own”)
Own power, max 2 SCs
SC
Other power, max 2 SCs
The “Other/Own” ratios are of course calculated from absolute code
power values (i.e. Ec values in mW).
Note: The arguments should be kept the same for all five information
elements. It is of course possible to set each argument to any of
the permissible values, but with different arguments for different
elements you cannot really draw any useful conclusions.
9.4.10.
Presentation: Synch Channel Data Window
This window presents scan data on the synchronization channels P-SCH and
S-SCH, obtained with the CPICH scanning method.
SC
Scrambling code number.
P-SCH Ec
The peak power of the Primary Synchronization
Channel, P-SCH (in dBm).
LZT 108 9851 R1B
107
TEMS Investigation 9.0 Data Collection User’s Manual
P-SCH Ec/Io
The peak power of the P-SCH (Ec) relative to the
total signal power in the channel (Io), i.e. the
difference between them in dB.
S-SCH Ec
The peak power of the Secondary Synchronization
Channel, S-SCH (in dBm).
S-SCH Ec/Io
The peak power of the S-SCH (Ec) relative to the
total signal power in the channel (Io), i.e. the
difference between them in dB.
By default the scrambling codes are sorted by signal power with the strongest
on top. The presented data can be freely rearranged, as described in section
16.3, “Changing Status Window Properties”, on page 217.
9.4.11.
Presentation: “Finger Info” Status Windows
These windows present Rake finger information obtained during CPICH
scanning. For definitions of the information elements, see Information
Elements and Events, section 3.3.
9.4.12.
Presentation: BCH Scanning
With a Sony Ericsson Z750i, all scan data collected using the options Scan
selected and Scan strongest are obtained for BCH scanning also (though
less frequently); see sections 9.4.7–9.4.11 above regarding the presentation
of this data.
No special presentation windows are provided for BCH scanning. However,
decoded System Information Blocks are output in the Layer 3 Messages
window at a greatly enhanced rate.
One form of refined TEMS Investigation output that can be based on SIBs is
the Missing Neighbor Detection event which warns about missing neighbors
in WCDMA. See Information Elements and Events, section 7.3.
Another piece of data found in SIBs is an uplink interference measurement.
This is particularly interesting for HSUPA, where the guiding principle of
scheduling is to provide (as far as possible) all UEs with all the resources
they need while also making sure that the total uplink interference does not
exceed the accepted maximum. The uplink interference measurements can
of course be inspected in the plain-text SIB decoding, but they are also
108
Chapter 9. WCDMA Scanning
extracted as information elements; see Information Elements and Events,
section 4.4.13.
9.4.13.
Customizing the Presentation
9.4.13.1. Sorting of Scrambling Codes
You can sort scrambling codes in scanning information elements in a number
of different ways. The sorting order is set in the General window.
Note: The sorting order of the “Sc Best” elements (see Information
Elements and Events, section 3.3) is fixed and is not affected by
the General window settings.
•
Open the General window from the Navigator.
•
Double-click the item “WCDMA”.
A dialog appears with these sorting options:
•
Sort by decreasing Aggr Ec/Io (default)
•
Sort by increasing Aggr Ec/Io
•
Sort by fixed position: This means that scrambling codes are sorted by
index and are always assigned the same argument indices, that is,
scrambling code n is always found at argument index n + 1.
•
Sort by scrambling code: Scrambling codes are sorted by index; the code
with the lowest index appears at argument index 1, the code with the next
higher index at argument index 2, etc.
9.4.13.2. Presenting Scrambling Codes from Multiple UARFCNs
In the “Sc Best” information elements, all scrambling codes found on all
UMTS frequencies are collected in a single array. These elements are sorted
by signal strength (Aggr Ec/Io) in descending order, and this sorting order is
unchangeable.
Use these elements in order to view scan data from several UARFCNs in one
window.
LZT 108 9851 R1B
109
TEMS Investigation 9.0 Data Collection User’s Manual
9.5.
SCH Timeslot Scanning
This method scans timeslot-length intervals, i.e. intervals 2560 chips long, on
a Primary Synchronization Channel (P-SCH). It is useful for monitoring
synchronization reference signals sent on this channel.
It should be pointed out that this scan is wholly separate from the P-SCH and
S-SCH scans included in the CPICH scanning method (section 9.4).
9.5.1.
•
Setup of SCH Timeslot Scan
On the Equipment Control toolbar, choose the scanning device in the left
combo box, and choose “[WCDMA] SCH Scan” in the right combo box.
On the Equipment Control toolbar, click the Scan Properties button.
Compression
Rate
Don’t use internal
GPS
110
The time resolution of the scan:
•
“Every” means that a power value is reported for
every chip in the timeslot.
•
“Every 2”, etc. means that the peak (not average)
power is reported for successive segments 2, 4,
or 8 chips in length.
Check this if you do not want to use the scanner’s
internal GPS for positioning. Note that if you set up
other scanning methods for the same scanner, you
must check this box for the other methods as well,
otherwise the internal GPS will be used anyway.
Chapter 9. WCDMA Scanning
UARFCN
Here you set the UARFCN of the frequency to scan.
The frequency itself is indicated to the right of the
combo box.
Used
measurement
points
Number of scanner measurement points used so far
by all scanning methods together. See section 9.1.
9.5.2.
Presentation: SCH Timeslot Scan Bar Chart
The bar chart displays an Es/Io trace for the latest timeslot scanned (2560
chips).
Each SCH signal will show up as a spike on the trace, the height of the spike
reflecting the strength of the signal in terms of Es/Io. The legend pane gives
Es/Io for each chip, or peak Es/Io for every 2, 4, or 8 chips, depending on the
setup; see section 9.5.1. Since the SCH signals are repeated every timeslot,
the spikes will normally remain in the same positions as the trace is updated.
The updating rate is dependent on the compression rate and on network
conditions. However, if the compression rate is set to “Every 4”, the updating
interval will be on the order of 1 s.
The position of a spike shows at what point a new timeslot begins in the
current transmission. Provided that the base station clock is synchronized
with GPS time, the T_Cell parameter can be determined: the spike will be
positioned approximately at T_Cell + 140 chips, the offset being due to delay
LZT 108 9851 R1B
111
TEMS Investigation 9.0 Data Collection User’s Manual
in the scanner. If the base station is not synchronized with GPS time,
however, no conclusions can be drawn about the value of T_Cell.
In a WCDMA cell with multiple sectors, each sector will transmit/receive at a
different time offset (e.g. 0, 256, and 512 chips). The SCH timeslot scan will
then display multiple spikes within a timeslot, one for each sector. From this
the time separation between the sectors can be determined. In the lower right
pane, the parameters “Time diff 1-2” and “Time diff 2-3” are given:
•
“Time diff 1-2” indicates the time separation in chips between the
strongest peak and the second strongest.
•
“Time diff 2-3” indicates the time separation in chips between the second
strongest peak and the third strongest.
These parameters are identical with the information elements SCH TS Sc
Time Diff 1-2 and SCH TS Sc Time Diff 2-3; see Information Elements and
Events, section 3.3. Determining the time separation naturally does not
require synchronization of the base station with GPS time.
9.6.
CW Scanning
This method scans specified UMTS frequencies (UARFCNs) for a continuous
wave (CW) signal.
9.6.1.
•
Setup of CW Scan
On the Equipment Control toolbar, choose the scanning device in the left
combo box, and choose “[(W)CDMA] CW Scan” in the right combo box.
On the Equipment Control toolbar, click the Scan Properties
button.This dialog appears:
112
Chapter 9. WCDMA Scanning
Channels
Choose the UARFCNs to scan (up to 255). The
allowed UARFCN range is dependent on the band
supported by the scanner. Click the Select button to
pick your channels: see section 9.6.1.1.
Don’t use internal
GPS
Check this if you do not want to use the scanner’s
internal GPS for positioning. Note that if you set up
other scanning methods for the same scanner, you
must check this box for the other methods as well,
otherwise the internal GPS will be used anyway.
Used
measurement
points
Number of scanner measurement points used so far
by all scanning methods together. See section 9.1.
9.6.1.1.
Channel Selection
Clicking Select in the CW Scan Setup dialog brings up a new dialog which is
similar to the one for selecting scrambling codes for the CPICH scan (section
9.4.5), except that UARFCNs are listed instead.
LZT 108 9851 R1B
113
TEMS Investigation 9.0 Data Collection User’s Manual
•
Select UARFCNs either from the list box or by entering a text string in the
combo box at the bottom.
Under Channel Group, you can define custom subsets of UARFCNs to
govern what is displayed in the Selected Channels list. By default, all
UARFCNs are displayed. To define a subset, click the Define button; see
section 9.11.
9.6.2.
Presentation: CW Scan Bar Chart
This bar chart displays RSSI for each UARFCN scanned.
114
Chapter 9. WCDMA Scanning
9.7.
Spectrum Analysis
This scanning method shows downlink signal strength (RSSI) as a function of
frequency.
9.7.1.
•
Scan Setup
On the Equipment Control toolbar, choose the scanning device in the left
combo box, and choose “[WCDMA] Spectrum Analysis” in the right combo
box.
On the Equipment Control toolbar, click the Scan Properties button.
LZT 108 9851 R1B
115
TEMS Investigation 9.0 Data Collection User’s Manual
Don’t use internal
GPS
Check this if you do not want to use the scanner’s
internal GPS for positioning. Note that if you set up
other scanning methods for the same scanner, you
must check this box for the other methods as well,
otherwise the internal GPS will be used anyway.
Start frequency
Low end of the frequency range to be swept by the
scan. Given in MHz.
Stop frequency
High end of the frequency range to be swept by the
scan. Given in MHz.
Resolution
Interval between successive scan samples in kHz,
the highest selectable resolution being 5 kHz. The
legend pane will list all samples; the chart, on the
other hand, can of course only distinguish the
samples as far as the screen resolution permits.
Number of
sweeps to avg.
The number of sweeps on which to base the
presented average RSSI. The minimum number is 1,
and the maximum is 16.
116
Chapter 9. WCDMA Scanning
Used
measurement
points
9.7.2.
Number of scanner measurement points used so far
by all scanning methods together. See section 9.1.
Note that the spectrum analysis is prone to consume
a large number of measurement points. Adapt the
resolution to the width of the frequency range.
Presentation: Spectrum Analysis Bar Charts
Two charts are provided, one for the downlink (Spectrum Analysis Bar Chart)
and one for the uplink (Spectrum Analysis Uplink Bar Chart).1 They both
display RSSI as a function of frequency.
9.8.
Network Search
This function is highly useful for obtaining a bird’s-eye view of an unfamiliar
WCDMA radio environment. It will detect WCDMA carriers (UARFCNs) that
are in use on each WCDMA band (2100 MHz, 1900 MHz, 850 MHz). On each
carrier, one cell (scrambling code) is detected and presented.
1. Uplink spectrum analysis is currently not supported by any connectable
devices, but the chart is retained to allow displaying of such data from old
logfiles.
LZT 108 9851 R1B
117
TEMS Investigation 9.0 Data Collection User’s Manual
In network search mode it is also possible to detect inappropriate allocation of
UARFCNs resulting in carrier overlap. A mobile phone in regular phone
mode, once it has found a WCDMA carrier, automatically assumes that there
are no further UARFCNs within ±3 MHz of the detected carrier and is
therefore unable to spot overlapping carriers. In contrast, a Sony Ericsson
Z750i in scan mode is usually able to identify all carriers, overlapping or not,
thus allowing faulty frequency allocations to be easily found and rectified.
9.8.1.
Scan Setup
Interval 1, 2, 3
You can set up three separate UARFCN ranges to
scan in the network search. Each range can be
located on any of the listed frequency bands.
2100 Band, etc.;
Custom range
Each UARFCN range to scan may be identical to an
entire WCDMA frequency band, or it may consist of a
portion of a band. In the latter case you specify the
range endpoints under Custom range.
118
Chapter 9. WCDMA Scanning
Include additional
channels
Check this to include additional channels on the 1900
or 850 MHz band. Additional channels have
UARFCNs that are completely different from the
general channels. (See 3GPP TS 25.101 section
5.4.3–5.4.4 for details on the two kinds of channel.)
If this option is checked, all additional channels that
lie within the frequency range you have specified in
the dialog (whole band or UARFCN range) will be
included in the scan.
Cell Ec/No
threshold
Ec/No threshold for cell detection within a detected
carrier.
This threshold should be high enough to minimize
the false detection rate, yet not so high that cells
actually present may go undetected. The risk of the
latter is particularly pronounced in the case of
overlapping carriers, where all cells will be
significantly disturbed.
The default setting is –26 dB, which should be
suitable in most situations.
RSSI threshold
RSSI threshold for detecting carriers.
The default setting is –94 dB, reflecting a trade-off
between the desire to detect all networks in operation
and the wish to avoid spurious ‘hits’. Setting the
threshold too low results in very long search time
(e.g. several minutes at –100 dB).
9.8.2.
Presentation
The result of the network search is output in the Network Scanning window. It
lists all UARFCNs found, that is, the center frequency of each detected
WCDMA carrier. UARFCNs from all WCDMA frequency bands are listed in
the same column. One scrambling code (cell) is displayed for each UARFCN.
LZT 108 9851 R1B
119
TEMS Investigation 9.0 Data Collection User’s Manual
9.9.
Presenting WCDMA Scan Data in Status
Windows
Scan data can also be presented for example in status windows of your own
design. How to build a status window is covered in chapter 16, page 214. The
information elements of interest are all found in Information Elements and
Events, section 3.3.
9.10.
Replaying Scan Data
If you are replaying a logfile with scan data, you will probably want to replay
the file slowly in order to see clearly what is happening. The replay speed is
set from the Logfile menu (see section 7.2.1, page 56).
9.11.
Defining Scrambling Code or UARFCN
Groups
When selecting scrambling codes or UARFCNs manually, the set of items
displayed in the list box is determined by the choice in the SC Group or
Channel Group combo box. By default all items are displayed. It is possible to
define custom groups of scrambling codes/UARFCNs and show only the
members of such a group in the list box. You may find this convenient if you
often scan some restricted set of scrambling codes/UARFCNs.
Note: A group does not define which items are actually scanned. It only
defines the set of items that can be selected for scanning.
To create a new group, proceed as follows:
Click Scanner Properties.
•
Click the appropriate Select button.
•
In the new dialog, click the Define button next to the SC Group/Channel
Group combo box.
120
Chapter 9. WCDMA Scanning
Adding a Group
To create a new group:
•
Click Add Group, and name the group. Then proceed to add items to the
group; see below.
Once created, your group will appear in the SC Group/Channel Group combo
box in the dialog “Manual ... Selection” (section 9.4.5).
Adding Items to a Group
•
Select the group in the Groups list box.
•
Click the “Add ...” button. A dialog appears which works exactly as the
Selected SCs list box in section 9.4.5. In this dialog, select the items to
add.
Deleting Items from a Group
•
Select the items you want to delete and click the “Delete ...” button.
Deleting a Group
•
Select the group you want to delete and click Delete Group.
Saving a Group
A group can be saved on file in binary format (file extension .chn). This is
useful for instance if you want to transfer your groups to another computer.
(The groups are of course also saved when you save your workspace, but in
this case no CHN files are created, and you cannot access the groups
separately.)
LZT 108 9851 R1B
121
TEMS Investigation 9.0 Data Collection User’s Manual
•
Click Save... and name the group.
Loading a Group
•
122
Click Load... and browse to select your file.
Chapter 10. CDMA Scanning
10.
CDMA Scanning
TEMS Investigation Data Collection supports scanning of CDMA (IS-2000,
IS-856, IS-95) RF channels with a PCTel SeeGull LX scanner. It is possible to
scan with several such devices concurrently. How to connect scanners is
described in chapter 6.
Scanning tasks are set up from the Equipment Control toolbar, whereas the
output of scans is primarily intended to be displayed in a suite of ready-made
bar charts and other windows. However, since all scan data is available in
information elements, you are free to present it in any presentation window.
The scanning presentation windows are fully synchronized with the rest of the
application.
Note that the internal GPS in a PCTel scanner will deliver data only while a
scan is in progress.
Some technical data on PCTel scanners is provided in appendix H, page 363.
10.1.
Scanning Methods and Scanning Capacity
TEMS Investigation offers these CDMA scanning methods:
•
•
Pilot scanning (section 10.4)
–
Static PN set
–
Top N
–
“Follow phone” mode
CW (RSSI) scanning (section 10.5)
–
Static RF channel set
–
“Follow phone” mode
The scanning methods are conceptually independent and can be run
concurrently by the PCTel scanner. Only the scanner measurement capacity
places a limit on the possibilities of handling several scanning tasks in
parallel.
LZT 108 9851 R1B
123
TEMS Investigation 9.0 Data Collection User’s Manual
A PCTel scanner has a capacity of 2,560 measurement points. As you set up
the scanning tasks, you are continuously notified in the setup dialogs of how
many measurement points you have used up.
10.2.
Performing a Scan
The procedure for performing a scan is as follows:
•
Connect the device to scan with if it is not already connected. See chapter
6. (You must have the device connected to be able to access the
Measurement Settings dialog.)
•
Set up the scan according to one of the sections 10.4 or 10.5.
To start scanning, click the Start Scanning button.
While the scanning is going on, the status bar shows the padlock symbol
indicating that the scanner is busy.
,
To stop scanning, click the Stop Scanning button.
10.3.
Recording Scan Data
To record scan data, create a new logfile as described in section 7.1.
10.4.
Pilot Scanning
This method scans pilots, scrambled with cell-specific PN sequence offsets.
Up to four RF channels can be scanned at a time.
•
On the Equipment Control toolbar, choose the scanning device in the left
combo box, and choose “[(W)CDMA] CPICH/PN Scanning” in the right
combo box.
On the Equipment Control toolbar, click the Scan Properties button.
A dialog appears in which you set up the scan.
10.4.1.
Scan Setup
The set of pilots (PNs) to scan on each RF channel is composed in one of the
following ways:
124
Chapter 10. CDMA Scanning
•
user-defined, static set of pilots (up to 512, i.e. no restriction on number of
pilots), common to all RF channels
•
strongest pilots (“Top N”; up to N = 32) on each RF channel
•
strongest pilots (“Top N”; N = 32) on the RF channel currently used by a
CDMA phone that is also connected in the application.
Scan selected
Choose this to scan a static set of pilots (up to 128)
on all RF channels selected under “RF Channel”
below.
Click the Select button to pick your pilots: see section
10.4.2.
The number of pilots currently selected appears
within brackets on the right.
LZT 108 9851 R1B
125
TEMS Investigation 9.0 Data Collection User’s Manual
Scan strongest
Choose this to scan the N strongest pilots on the
chosen RF channels. The scanner automatically
finds the strongest pilots.
Follow UE
Choose this to scan the 32 strongest pilots on the RF
channel that the CDMA phone in the combo box is
currently using. When the phone switches to a
different RF channel, the scanner follows along
automatically.
If you choose this option, all other controls in the
dialog are disabled. The band, protocol and RF
channel information are taken from the phone.
Data mode
126
Select the scan data you wish to collect. At least one
of the boxes must be checked.
•
Ec/Io: The peak pilot Ec/Io value.
•
Pilot Delay: The number of chips between the
expected arrival time and the actual arrival time of
the signal.
•
Aggregate Ec/Io: The sum of all peak pilot Ec/Io
values above the PN threshold.a
•
Delay Spread: The number of chips between the
first and last pilot Ec/Io peak above the PN
threshold.
Chapter 10. CDMA Scanning
Timing mode
Here you select by what method the scanner should
synchronize to the base station’s transmissions.
•
GPS Only: The scanner will rely exclusively on its
internal GPS for timing.
•
Pilot Sync Only: The scanner will rely exclusively
on the Pilot and Sync channels for timing.
•
GPS Preferred: The scanner will use its internal
GPS for timing whenever possible and resort to
the Pilot and Sync channels in other cases.
This setting is enabled only if the scanner has been
purchased with the Sync Channel Timing option.
Pilot synchronization allows the scanner to operate in
indoor environments where GPS coverage is lacking.
Without the Sync Channel Timing option, the scanner
can only use its GPS for timing.
The Timing mode setting is applicable for IS-95 and
IS-2000 only, not for IS-856.
Band selection
Choose the frequency band on which to scan.
Protocol
Choose the type of network on which to scan: IS-95
(cdmaOne), IS-2000 (cdma2000), or IS-856 (EVDO).
RF Channel
Here you set the RF channels on which to scan the
selected pilots. The allowed range is dependent on
the frequency band. Click the Select button to pick
your RF channels. A dialog appears which is
analogous to that described in section 10.4.2.
The number of RF channels currently selected
appears within brackets on the right.
Don’t use internal
GPS
LZT 108 9851 R1B
Check this if you do not want to use the scanner’s
internal GPS for positioning. Note that if you set up
other scanning methods for the same scanner, you
must check this box for the other methods as well,
otherwise the internal GPS will be used anyway.
127
TEMS Investigation 9.0 Data Collection User’s Manual
Integration
(Chips)
This is the number of chips over which each signal
energy value is integrated. Setting this parameter
high improves the accuracy and reliability of the
output but also slows the scan down.
The default and recommended value is 2048 for IS2000 and IS-95, and 3072 for IS-856.
Search Window
Size
This parameter indicates the length, in chips, of the
time window in which the pilot is searched.
The maximum window search size supported by the
scanning receiver is 64. This is also the default and
recommended setting.
PN threshold
This is a signal code power threshold (in dB) used for
the Aggregate Ec/Io and Delay Spread
measurements (see Data mode above).
If the PN threshold is set too low, the Aggregate
Ec/Io and Delay Spread values will be affected by
random noise more than may be desired. By raising
the threshold you reduce the influence of random
noise correlations, and you will thus be able to
discern multipath and fading effects more accurately.
The setting –20 dB is recommended.
Used
measurement
points
Number of scanner measurement points used so far
by all scanning methods together. See section 10.1.
a. This measurement does not appear as an information element; it is only
found in scanner reports.
10.4.2.
Manual Pilot/RF Channel Selection
This is completely analogous to manual selection of UARFCNs and
scrambling codes in WCDMA; see section 9.4.5, page 101.
10.4.3.
Presentation: “PN Scan” Bar Charts
The PN Scan bar charts present pilot scan data. One predefined bar chart is
provided for each RF channel scanned.
128
Chapter 10. CDMA Scanning
Each bar chart by default presents peak Ec/Io for each pilot found. Pilots are
sorted by ascending PN offset.
The updating rate is chiefly dependent on the number of live signals
encountered in the network. For a manually selected set of pilots, the
updating rate is also greatly affected by the size of this set, whereas for the
“Top N” scan the number N is only marginally important (since all pilots have
to be searched regardless of N).
10.4.4.
Presentation: Strongest Scanned PN Bar Chart
This bar chart shows the strongest pilots scanned, regardless of RF channel.
10.5.
CW Scanning
This method scans specified RF channels for a continuous wave (CW) signal.
This is alternatively referred to as “RSSI scanning”. In TEMS Investigation,
the term “CW” is used throughout, just as for WCDMA.
10.5.1.
•
Setup of CW Scan
On the Equipment Control toolbar, choose the scanning device in the left
combo box, and choose “[(W)CDMA] CW Scan” in the right combo box.
On the Equipment Control toolbar, click the Scan Properties
button.This dialog appears:
LZT 108 9851 R1B
129
TEMS Investigation 9.0 Data Collection User’s Manual
Channels
Choose the RF channels to scan (up to 255). The
allowed RF channel range is dependent on the band
supported by the scanner. Click the Select button to
pick your channels: see section 10.5.1.1.
Follow UE
Choose this to scan the RF channel that the CDMA
phone in the combo box is currently using (plus a
number of adjacent RF channels).a When the phone
switches to a different RF channel, the scanner
follows along automatically.
If you choose this option, all other controls in the
dialog are disabled. The band, protocol and RF
channel information are taken from the phone.
Don’t use internal
GPS
Check this if you do not want to use the scanner’s
internal GPS for positioning. Note that if you set up
other scanning methods for the same scanner, you
must check this box for the other methods as well,
otherwise the internal GPS will be used anyway.
Band selection
Choose the frequency band on which to scan.
Protocol
Choose the type of network on which to scan: IS-95
(cdmaOne), IS-2000 (cdma2000), or IS-856 (EVDO).
130
Chapter 10. CDMA Scanning
Bandwidth
Used
measurement
points
•
“Normal” = CDMA band, bandwidth 1.2288 MHz.
•
“Narrow” = “Condensed” or CW band. For the
cellular (800) band, the bandwidth is 30 kHz. For
the PCS (1900) band, the bandwidth is 50 kHz.
Number of scanner measurement points used so far
by all scanning methods together. See section 10.1.
a. Specifically (n = phone’s RF channel number):
on the 800 MHz band, RF channels [n – 21 ... n + 21];
on the 1900 MHz band, RF channels [n – 13 ... n + 13];
on the 450 MHz band, RF channels [n – 26 ... n + 26] if 79 ≤ n ≤ 275,
otherwise [n – 33 ... n + 33].
10.5.1.1. Channel Selection
Clicking Select in the CW Scan Setup dialog brings up a new dialog which is
similar to the one for selecting scrambling codes for the pilot scan (section
10.4.2), except that RF channels are listed instead.
•
Select RF channels either from the list box or by entering a text string in
the combo box at the bottom.
LZT 108 9851 R1B
131
TEMS Investigation 9.0 Data Collection User’s Manual
Under Channel Group, you can define custom subsets of RF channels to
govern what is displayed in the Selected Channels list. By default, all RF
channels are displayed. To define a subset, click the Define button.
Channel groups are created and managed in the same way as scrambling
code/UARFCN groups for WCDMA; see section 9.11, page 120 for full
details.
10.5.2.
Presentation: CW Scan Bar Chart
This bar chart displays RSSI for each RF channel scanned.
132
Chapter 11. WiMAX Scanning
11.
WiMAX Scanning
TEMS Investigation has the ability to scan WiMAX carriers with a DRT4301A
scanner.
How to configure the PC and the DRT scanner for use with TEMS
Investigation is covered in the Getting Started Manual, chapter 9. How to
connect the scanner in TEMS Investigation is described in chapter 6 of this
document.
The DRT scanner has a built-in GPS, which is however currently not used by
TEMS Investigation.
11.1.
Scanning Capabilities
WiMAX scanning capabilities are as follows:
•
Supported bands are determined by the scanner and by the antennas.
Currently 2.3 GHz, 2.5 GHz, and 3.5 GHz are supported.
•
WiMAX preamble scan
•
RSSI (CW, Continuous Wave) scan
11.2.
General Scan Settings
Regardless of scan mode you need to set the following:
Band
WiMAX band to scan: one of the bands (WiMAX RF
Profiles) supported by the scanner, and the
associated OFDMA bandwidth. Regarding band
support, see section 11.1.
Channels
WiMAX channels to scan within the selected band.
Each channel is specified as a number representing
the center frequency of the channel. There is no limit
on the number of channels that can be selected.
Technology
Always “WiMAX” at present.
LZT 108 9851 R1B
133
TEMS Investigation 9.0 Data Collection User’s Manual
11.3.
Preamble Scanning
The WiMAX air interface uses OFDM as modulation method. Within an
OFDM frame, each subframe is preceded by a preamble. The preamble is
used for synchronization and channel estimation purposes.
The bandwidth scanned during preamble scanning is that of the selected
band (i.e. WiMAX RF Profile; currently either 5 or 10 MHz).
•
On the Equipment Control toolbar, choose the scanning device in the left
combo box, and choose “[WiMAX] Preamble Scanning” in the right combo
box.
11.3.1.
Preamble Scan Specific Settings
Decode
Threshold
Threshold (in dB) below which data is not decoded.
Detect Threshold
Threshold (in negative dB) below which no preamble
detection is reported.
Enable AGC
Use of AGC (Automatic Gain Control) scanning
parameter. It should normally be enabled.
Enable CFO
Measurement of Carrier Frequency Offset.
Enable DCD
Decoding
Decoding of Downlink Channel Descriptor (a
message containing information about downlink
characteristics).
Enable Downlink
Map Decoding
Decoding of downlink MAP messages. These include
the burst profile for each user, which defines the
modulation and coding scheme used on the
downlink.
Enable Frame
Prefix Decoding
Decoding of Frame Prefix (DLFP). The Frame Prefix
specifies the modulation type and number of symbols
associated with one or several downlink bursts that
follow the FCH.
Enable Preamble
CINR
Calculation of CINR, Carrier to Interference-plusNoise Ratio. The carrier is the desired signal, and the
interference can be either noise or co-channel
interference or both.
134
Chapter 11. WiMAX Scanning
Enable Preamble
Power
Calculation of preamble power.
Enable Robust
Scan
Currently not used.
Enable Statistical
Information
This must be set on for measurement statistics
(mean and standard deviation for RSSI, CINR) to be
computed.
Enable UCD
Decoding
Decoding of Uplink Channel Descriptor (a message
containing information about uplink characteristics).
Enable Uplink
Map Decoding
Decoding of uplink MAP messages. Compare Enable
Downlink Map Decoding.
Logging Mode
Currently not used. When using the DRT scanner
with TEMS Investigation, the scan data is always
recorded in regular TEMS Investigation logfiles
(*.log), regardless of how this parameter is set.
Number of
Samples for Stats
The number of samples on which to base each
computation of measurement statistics. However, the
actual number of samples used may be smaller, as
reported in the “Samples Taken” information
elements (see Information Elements and Events,
section 3.4).
Preamble Index
List
User-selected list of preambles to search for and
decode. For this field to be enabled, Top N must have
been set to zero. Conversely, if you enter a nonzero
Top N, this field is grayed.
Scan Mode
Currently not used. The setting is not applicable
since TEMS Investigation assigns only a single
Preamble scan task and a single RSSI scan task to
the scanner.
Top N
If this field is set to N, the scan will return the N
strongest preambles. Set this field to zero if you want
to scan a fixed set of preambles (defined in Preamble
Index List).
LZT 108 9851 R1B
135
TEMS Investigation 9.0 Data Collection User’s Manual
Use N=3 for CINR
Measurements
If set to True, cluster size N = 3 will be used for CINR
measurement, that is, CINR will be measured for
each segment.
If set to False, cluster size N = 1 will be used for
CINR measurement, that is, CINR will be measured
over all segments.
11.4.
RSSI (CW) Scanning
RSSI (or Continuous Wave, CW) scanning allows the operator to observe
channel activity in preparation for more thorough scans.
•
On the Equipment Control toolbar, choose the scanning device in the left
combo box, and choose “[WiMAX] Rssi Scanning” in the right combo box.
Bandwidth
11.5.
This setting is currently not applicable, since the
scanner currently supports RSSI scanning only with
250 kHz bandwidth.
Presentation
WiMAX scans are presented in a suite of predefined charts and status
windows. See Information Elements and Events, sections 8.1.5, 8.5.4, and
8.6.4.
The purpose of having views that are grouped by preamble index, rather than
by RSSI or CINR, is to provide information about all the sectors of a site. This
can help identify improperly aimed antennas, or find crossed feeders.
The purpose of having views sorted by RSSI or CINR, without any grouping
by segment, is to provide information that is helpful in determining coverage,
best server, and handover targets for neighbor lists.
136
Chapter 12. Command Sequences (with Data Service Testing)
12.
Command Sequences (with
Data Service Testing)
Command sequences are used to automate testing of voice as well as data.
They allow you to prerecord all the commands to be given to the phones
during a drive test.
•
For voice calls, if you are using several phones, you can make them call
each other automatically.
•
Data service testing encompasses the following applications: FTP, HTTP,
Ping, e-mail, SMS, WAP, MMS, and video streaming. One or several
phones can be used. With multiple phones, multiple sessions can be run
concurrently. How to prepare the PC and phone for data services is
covered in chapter 8 of the Getting Started Manual.
•
The command sequence is also used to record data on which to base
KPIs, indicating the performance of services.
Special commands are available
•
for recording all data collected while executing the command sequence.
The recordings will be ordinary logfiles (extension .log).
•
for AT commands.
12.1.
Capabilities of Phones
All phones sold with TEMS Investigation 9.0 support all commands in the
command sequence.
12.2.
Composing and Editing a Command
Sequence
Command sequences are composed in, and executed from, the Command
Sequence window found in the Control folder of the Navigator:
LZT 108 9851 R1B
137
TEMS Investigation 9.0 Data Collection User’s Manual
Click Edit in the Command Sequence window to start composing the
sequence. The window splits into three panes:
•
The available command types are organized in a tree structure in the lefthand pane.
•
The command sequence is assembled in the center pane.
•
The right-hand pane holds the arguments for the command currently
selected in the center pane. Arguments can either be grouped into
categories or be listed in alphabetical order; use the two buttons at the top
to toggle between the two display modes. At the bottom of the right-hand
pane is a box showing an explanation for the currently selected argument.
You can use the Tab key to jump between the panes.
The rest of this section deals with how to build up the command sequence. All
arguments and other details of individual commands are gone through in
subsequent sections.
138
Chapter 12. Command Sequences (with Data Service Testing)
12.2.1.
•
Adding a Command to the Command Sequence
To add a command at the end of the sequence, double-click the command
name in the tree view.
To add a command B immediately above another command A, select A
in the sequence, select the type of B in the tree view, and click the “Add
above” button.
To add a command B immediately below another command A (at the
same level of indentation), select A in the sequence, select the type of
B in the tree view, and click the “Add below” button.
Alternatively, with the tree view in focus, press Shift + up arrow key to add
command B above command A, or press Shift + down arrow key to add
command B below command A.
12.2.2.
•
Constructing Loops
First insert a Loop command at the desired position in the sequence, as
described in section 12.2.1.
To add the first command A to a loop, select the relevant Loop
command in the sequence, select the type of A in the tree view, and
click the Add Next Level button.
•
To add further commands to the loop, select the appropriate existing
command in the loop and add the new command above or below it, as
described in section 12.2.1.
With the last command of a loop selected in the sequence, use the Add
Previous Level button to indicate that the next command should not be
part of the loop but follow the Loop command. (This can alternatively
be accomplished by selecting the Loop command and adding the new
command using the “Add below” button.)
Alternatively, with the tree view in focus, press Shift + right arrow key to add a
command at the next level, or press Shift + left arrow key to add a command
at the previous level.
Loops can be nested arbitrarily.
LZT 108 9851 R1B
139
TEMS Investigation 9.0 Data Collection User’s Manual
12.2.3.
•
Editing the Command Sequence
To edit the arguments of a command, select the command in the
sequence. The arguments are displayed on the right. When the argument
pane is in focus, you can press Enter to select the value of the currently
selected argument.
To move a command one step upward in the sequence, select the
command and click the Move Up button (or press Ctrl + up arrow key).
To move a command one step downward in the sequence, select the
command and click the Move Down button (or press Ctrl + down arrow
key).
If a loop is encountered during moving of a command, the command is
inserted into the loop. To move the command out of and past the loop,
perform another move action.
To delete a command from the sequence, select the command and
click the Delete button, or press Delete on the keyboard. Deleting a
Loop command removes the entire loop with all its contents.
When you are finished editing the sequence, click the Edit button once
more so that it pops up. The tree view and argument panes are hidden,
freeing the entire window for the command sequence.
12.3.
Command Categories
The commands are divided into the following categories:
•
General (Loop, Synchronize, Wait)
•
Recording
•
Voice/Video
•
Equipment Control
•
Application Testing (including KPIs)
12.4.
Assigning Commands to Phones
For every command you must indicate to what phone or phones the
command should be given. The assignment is indicated in the string
representing the command in the sequence pane (e.g. “DC1 - HTTP Load”).
140
Chapter 12. Command Sequences (with Data Service Testing)
The “Equipment” argument of each command takes a subset of the following
values: MSn, DCn, ALL, and ANY (n = 1, 2, ...). Regarding the device
designations “MS” and “DC”, given to the phone at the time of connection,
see chapter 6, page 35.
The rules that decide whether a command is assigned to the MS or the DC
are given below. In sections 12.6–12.9, the precise assignment possibilities
are indicated for the individual commands. Commands for data service
testing are of course always assigned to the DC. It is never a problem in
practice to choose the right type of device, since in the dialog you can only
select devices that are compatible with the command you are composing.
MS
Used for:
•
everything related to voice and video telephony
•
general-purpose commands (e.g. Wait, Start Recording) that are given to
control the execution of the above tasks
DC
Used for:
•
everything related to data services
•
AT commands; this includes SMS, since that service is implemented
using AT commands
•
general-purpose commands (e.g. Wait, Start Recording) that are given to
control the execution of the above tasks
ALL
Many commands can alternatively be issued not to a single MS or DC but to
all phones participating in the sequence, i.e. all phones to which at least one
phone-specific command is given. (Note that this means there must be at
least one command assigned to a specific phone in the sequence, since
otherwise the set “ALL” will be empty.)
Whether ALL applies to MSs or DCs is generally obvious, but in a couple of
case both are meant. See sections 12.6–12.13 for full details. For Stop
Recording, ALL has a special meaning; see section 12.7.
LZT 108 9851 R1B
141
TEMS Investigation 9.0 Data Collection User’s Manual
ANY
A special assignment available for certain commands. For the meaning of this
assignment, see section 12.7.
Note: While the assignment in the user interface is always the logical
one as given above, many phones in fact use the modem also for
voice/video calls (notable exceptions are Motorola phones from
E1000 onward and all Qualcomm chipset based devices). For
such phones, the “Data Cable” device must always be enabled
and connected (see chapter 6) to allow control by a command
sequence – even if the command sequence contains only voice/
video related commands.
12.5.
Timeouts
Most commands have a Timeout parameter allowing the user to specify how
long to wait for a command to succeed. If a timeout is exceeded, the task
governed by the command is abandoned, and the execution proceeds to the
next command in the sequence.
The above does not apply to timeouts for data session commands, where the
function of the timeout is different: see session 12.11.2, “Timeout Parameters
for Session Commands“.
142
Chapter 12. Command Sequences (with Data Service Testing)
12.6.
General Commands
Command
Loop
To
N/A
Explanation/Arguments
Repeat the commands indented beneath
this command, either a fixed number of
times or for a fixed length of time.
If the fixed-time option is chosen, the
command that is being executed when the
time is up will always be allowed to finish.
Loop Type: Select how to control the
execution of the loop (see above).
Time/Count: Loop execution time (in
seconds) or number of loop executions.
How to compose loops is explained in section 12.2.2.
The entire sequence can also be set to repeat a specified number of times in
the command sequence properties (section 12.15).
Command
Synchronize
To
Explanation/Arguments
ALL
When multiple phones are involved in a
command sequence, every phone
reaching a Synchronize command will halt
at that point until all phones have reached
the same command. Only then is the
command sequence proceeded with.
See section 12.14 for examples of
situations where this command is needed.
Wait
LZT 108 9851 R1B
ALL/
one MS/
one DC
Wait a specified number of seconds.
Wait Time (s): Time to wait.
143
TEMS Investigation 9.0 Data Collection User’s Manual
Command
Wait for Events
To
one MS/
one DC
Explanation/Arguments
Wait until all of a set of specified events
have been reported by a specific phone.
Monitored Device: The phone to monitor.
Note that for data service related events,
“DCx” must be chosen; for other events,
“MSx” must be chosen.
Events: Check the events to wait for.
Timeout (s): Maximum time to wait.
12.7.
Recording Commands
Note that logfiles always record data from all connected phones, not only the
phones that participate in the command sequence (i.e. those to which some
phone-specific command is given).
Command
Start Recording
To
one MS/
one DC/
ANY
Explanation/Arguments
Start recording a logfile. (“Quick logging”
will be used; see section 7.1.3, page 52.)
Assignment to ANY means that the
recording is started when the first phone
reaches this command.
Logfile Directory: The directory where
logfiles produced by the command
sequence are stored.
Prefix, Suffix: You can add a descriptive
prefix and/or suffix to the default logfile
name (MMDD_nn.log), for example seq1
as prefix and am/pm as suffix.
Timeout (s): This timeout is not normally
needed but is provided in case the
application is not responding (for whatever
reason).
144
Chapter 12. Command Sequences (with Data Service Testing)
Command
Stop Recording
To
Explanation/Arguments
one MS/
one DC/
ALL
Stop the recording of the logfile. The logfile
is closed.
Assignment to ALL means that the
recording is stopped when the last phone
reaches this command.
Timeout (s): See Start Recording.
While recording governed by a command sequence is ongoing, the ordinary
recording mechanism (for example, the Recording toolbar in the main
window) is still enabled and will operate on that recording. You can thus stop
the recording at any time by clicking the Stop Recording toolbar button. The
execution of the command sequence is not affected by this action, except that
the anticipated Stop Recording command becomes meaningless and will
obviously fail.
12.8.
Voice/Video Commands
These commands handle voice and video telephony calls. For AQM
measurements a special type of voice call is provided. See arguments below.
Command
Dial
To
Explanation/Arguments
one MS
Dial a phone number and conduct a voice
or video call.
After dialing, the MS waits a user-specified
time for the event Call Established. If this
event does not occur, the MS may redial
the call. The redial behavior is governed by
the command arguments; see below.
Arguments of Dial Command
•
Phone Number: The phone number to call. Valid characters are: +, #, *,
0, ..., 9. For AQM measurement, this should be the number to the Call
Generator: see section 27.2.3, page 300.
•
Duration: The default planned duration of the call. Note that the total call
time may be extended if a redial occurs and the call timer is reset at that
LZT 108 9851 R1B
145
TEMS Investigation 9.0 Data Collection User’s Manual
point: see below. On the other hand, the call may be cut short by an event
selected under Terminate On Event, or by the duration expiring in the
Answer command (which see).
•
Call Type: Voice, Voice + AQM, or Video. For Voice + AQM, all redial
options are disabled.
•
Timeout (s): The time to wait for each of the following events to be
generated in turn: Call Initialization, Call Attempt, Call Setup, Call
Established. The timer is reset for each step. If a timeout occurs in any of
the steps, a redial is triggered if Timeout has been checked under Redial
Trigger(s) and the number of redials already made is less than Max.
Number of Redials.
•
Terminate On Event: If you check one or several events here, the Dial
command will terminate immediately if one of the selected events occurs.
•
Redial Trigger(s): A redial can be triggered
–
by a block or drop (except blocks due to no service or limited service)
–
by a timeout (see Timeout argument)
Check the circumstances in which a redial should be triggered.
•
Call Timer Reset on Redial: If set to True, the call timer will be reset so
that the call (if successfully established) will still be of a length equal to
Duration. If set to False, the call timer will not be reset, and the call will be
shorter than Duration.
•
Delay before Redials: The time from the moment the redial is triggered
until it is actually performed.
•
Max. Number of Redials: The maximum total number of redials to make
(whether triggered by Timeout or by blocks/drops) before giving up on the
call and proceeding with the next command in the sequence.
Command
Answer
To
one MS
Explanation/Arguments
Wait for an incoming call to arrive and
answer it when it arrives.
Arguments of Answer Command
•
146
Wait Time (s): The time to wait for a Call Attempt event to occur. If no Call
Attempt occurs within this time, the phone will abandon the Answer
command.
Chapter 12. Command Sequences (with Data Service Testing)
•
Duration (s): The default planned duration of the call. Note that the total
call time may be extended if a drop occurs followed by a redial in the other
party’s Dial command (see Dial above). On the other hand, the call may
be cut short by the duration expiring in the Dial command, or by the Dial
command being prematurely terminated by an event.
•
Restart Command on Dropped Call: If set to True, then if a drop occurs
on the receiving side, the phone will reiterate the Answer command and
start waiting for a new call. All timers are reset (for Wait Time, Timeout,
and Duration). If set to False, the phone will abandon the Answer
command following a drop.
•
Timeout (s): This parameter comes into play after the Call Attempt has
occurred. It specifies how long to wait for each of the subsequent events
Call Setup and Call Established. The timer is reset for each step. If a
timeout occurs in any of the steps, the phone will abandon the Answer
command.
12.9.
Equipment Control Commands
Command
AT Command
To
Explanation/Arguments
one DC
Any AT command that is supported by the
phone can be given.
AT Command: Enter the command here.
Timeout (s): The time to wait for a Session
End or Session Error report.
AT commands returning a printout of more than one line will be reported as
failed in the Command Sequence window (Status = “Data Session Failed”).
Nevertheless, such commands will in fact most likely have executed correctly.
The TEMS Investigation installation CD contains Sony Ericsson documents
describing all AT commands supported by various Sony Ericsson phones.
These documents can also be downloaded from developer.sonyericsson.com
(search for “AT commands”).
12.10.
Application Testing Commands: General
Application testing commands are used to test data services.
LZT 108 9851 R1B
147
TEMS Investigation 9.0 Data Collection User’s Manual
These are the main types of data sessions:
•
sessions performed using Dial-up Networking
•
sessions performed by sending AT commands to the phone
•
sessions using WinWAP.
Regarding the use of “MS” and “DC” for command assignment, see section
12.4.
Separate commands are used when KPIs are to be calculated for data
services. Read more about these in section 12.13.
12.11.
Commands for Dial-up Networking Sessions
These commands are found under “Data Services” in the tree structure.
Dial-up Networking is used for FTP, HTTP, e-mail, video streaming, and Ping.
All commands in this category are assigned to a single “DC” device.
12.11.1. Connect Commands
12.11.1.1. Dial Up, Hang Up
Dial Up and Hang Up are used to allow several data service sessions to be
conducted after one another while maintaining the same data bearer
connection.
If you do not use Dial Up and Hang Up, you must specify the dial-up
parameters in the session commands themselves; see section 12.11.2. A
new data bearer connection will then be established automatically for each
new session in the command sequence, and terminated when the session is
finished.
If you do use the separate Dial Up and Hang Up commands, be sure not to
specify dial-up and hang-up parameters in the session commands as well. If
you do the latter, a new connection will be set up for each session anyway,
rendering the use of the Dial Up command pointless.
148
Chapter 12. Command Sequences (with Data Service Testing)
Note: If you use the explicit Dial Up command and execute the whole
sequence multiple times (command sequence properties, section
12.15), then you must also include a Hang Up command, since
otherwise the sequence will attempt to redial while a data session
is already in progress. If you use implicit dialing (within session
commands), the hang-up is also implicit.
This diagram clarifies the meaning of the terms connection and session:
session
Dial-up
FTP DL
initiated
session
FTP DL
completed
HTTP
Load
initiated
HTTP
Hang-up
Load
completed
connection
In the following screenshot, line 2 and line 3 each constitutes a session:
LZT 108 9851 R1B
149
TEMS Investigation 9.0 Data Collection User’s Manual
Command Arguments
Command
Dial Up
Explanation/Arguments
Establish a data service connection.
In the packet-switched case, a PDP context is
activated (UMTS) or a PPP session established
(CDMA); in the circuit-switched case, the phone works
like an ordinary modem and performs a dial-up.
Phonebook Entry: This refers to the phonebook
entries created in Dial-up Networking (Getting Started
Manual, chapter 8). Be sure to choose the phonebook
entry associated with the correct COM port and hence
the correct phone.
Phone Number: Access phone number for the data
service (e.g. *99#). If you enter a number here, it will
override the one entered in the Dial-up Networking
settings.
User, Password: Certain operators require
authentication in order to establish a data service
connection. If this is the case for you, enter user and
password here.
Password: Server domain password.
Timeout (s): The time to wait for each of the following
events to be generated in turn: RAS Dial, IP Address
Assigned. The timer is reset for each step. If a timeout
occurs in any of the steps, the dial-up is abandoned.
Hang Up
Terminate a data service connection. In the packetswitched case a PDP context is deactivated (UMTS) or
a PPP session ended (CDMA); in the circuit-switched
case the phone performs a hang-up.
Timeout (s): The time to wait for a RAS Hangup or
PDP Context Deactivation event.
150
Chapter 12. Command Sequences (with Data Service Testing)
12.11.1.2. PS Attach, PS Detach
Command
PS Attach
Explanation/Arguments
Perform a packet service attach.
Note that this command is not needed in conjunction
with Dial Up and/or session commands, which
implicitly include the attach. (The phone may in fact
have attached automatically when powered on.) The
command is provided for the sole purpose of testing
the attach command in isolation.
Timeout (s): Time to wait for a Session End event
(attach successful) or Session Error event (attach
failed).
PS Detach
Perform a packet service detach.
Like PS Attach, this command is not needed in
conjunction with Dial Up and/or session commands,
which detach from the packet service as a final step.
The command may however be useful to make sure
that the phone is not attached to the packet service
when starting measurements (if it has attached
automatically at power-on, for example).
Timeout (s): Time to wait for a Session End event
(detach successful) or Session Error event (detach
failed).
12.11.2. Session Commands
Each session command initiates a data service session. The session is
completed before the command sequence execution proceeds to the next
command assigned to the same device.
12.11.2.1. About Phonebook Entries
The Phonebook Entry argument, present for all session commands, refers to
the phonebook entries created when configuring Dial-up Networking (Getting
Started Manual, chapter 8).
LZT 108 9851 R1B
151
TEMS Investigation 9.0 Data Collection User’s Manual
If a Dial Up command is used, the phonebook entry is specified there, and the
corresponding argument does not need to be used in the session command.
If there is no Dial Up command preceding a session command, the latter
must specify the phonebook entry (as well as the other dial-up arguments).
If you save a command sequence (see section 12.18), the phonebook entries
specified in the commands are saved along with the rest. Note that if you later
use the sequence on a different PC that has different phonebook entries
defined, and you save the sequence again, the new phonebook entries you
have selected will replace the old ones in the command sequence file.
12.11.2.2. Timeout Parameters for Session Commands
Timeouts for session commands work differently from those for other
commands (such as PS Attach/Detach). There is no timer ticking in TEMS
Investigation while a data service session is running. Rather, the timeout
setting is simply passed to the service as a specification of how long it should
keep attempting to get the data transfer going and for how long it should try to
restart the transfer in case of a later interruption. All details of checking this
are left to the service, without TEMS Investigation interfering in any way.
What is reported back to TEMS Investigation is a Session End event
(indicating a successfully completed session) or a Session Error event
(indicating that the session failed); but note again that TEMS Investigation is
not waiting for either of these events to occur within a specified time.
152
Chapter 12. Command Sequences (with Data Service Testing)
12.11.2.3. FTP
General notes on FTP:
•
For multi-phone FTP UL, use different target files for each phone.
•
Paths and file names must have correct case.
Command
FTP DL
Explanation/Arguments
Download a file from an FTP server.
Dial Up and Hang Up sections: See “About
Phonebook Entries” above.
Source File: The path and name of the file residing on
the FTP server, e.g. srcdir/srcfile.txt. No explicit root
symbol is used (no leading slash); if the file is in the
root directory, type the file name only. Note that the
correct orientation of the slashes is dependent on the
FTP server operating system.
Target File: Drive letter, path, and file name describing
where to store the file on your computer, e.g.
C:\targdir\targfile.txt. The drive letter must be included.
PASV: Enables or disables passive FTP. Note that it is
essential to set this correctly.
Port: The FTP server port. The default port number is
21.
Remote Address: The IP address of the FTP server.
This can be either an alphanumeric string, not
containing ftp:// at the beginning (for example,
ftp.myftpserver.com), or a 12-digit number. The
address may not contain a path to a subdirectory.
Account: Account name on the FTP server (if
applicable).
User: User name on the FTP server.
Password: User password on the FTP server.
Timeout (s): See “Timeout Parameters for Session
Commands” above. Should be at least 30 s.
LZT 108 9851 R1B
153
TEMS Investigation 9.0 Data Collection User’s Manual
Command
FTP UL
Explanation/Arguments
Upload a file to an FTP server.
Dial Up and Hang Up sections: See “About
Phonebook Entries” above.
Source File: Drive letter, path, and file name
identifying the file to be uploaded, e.g.
C:\srcdir\srcfile.txt. The drive letter must be included.
Target File: Path and file name describing where and
how to store the file on the FTP server, e.g. targdir/
targfile.txt. No explicit root symbol is used; if you type a
file name only, the file will be written to the root
directory. Note that the correct orientation of the
slashes is dependent on the FTP server operating
system.
PASV: Enables or disables passive FTP. Note that it is
essential to set this correctly.
Port: The FTP server port. The default port number is
21.
Remote Address: The IP address of the FTP server.
This can be either an alphanumeric string, not
containing ftp:// at the beginning (for example,
ftp.myftpserver.com), or a 12-digit number. The
address may not contain a path to a subdirectory.
Account: Account name on the FTP server (if
applicable).
User: User name on the FTP server.
Password: User password on the FTP server.
Timeout (s): See “Timeout Parameters for Session
Commands” above. Should be at least 30 s.
154
Chapter 12. Command Sequences (with Data Service Testing)
12.11.2.4. HTTP
Multiple concurrent HTTP Load sessions are supported. This means that
multiple sessions will result whenever multiple phones are used and/or some
phones are instructed to download from multiple HTTP servers.
Command
HTTP Load
Explanation/Arguments
Download a file from an HTTP server, or one file each
from several HTTP servers.
Dial Up and Hang Up sections: See “About
Phonebook Entries” above.
Remote Address(es): The IP addresses of the HTTP
servers. Click the “+” button to add one more IP
address. Each IP address can be either an
alphanumeric string, with or without http:// at the
beginning (for example, www.myserver.com/mydir/
myfile.txt), or a 12-digit number.
Port: The HTTP server port. The default port number
is 80.
Use Proxy Server: Select whether to use a proxy
server.
Proxy Port: Proxy server port number.
Proxy Address: Proxy server address.
Timeout (s): See “Timeout Parameters for Session
Commands” above.
LZT 108 9851 R1B
155
TEMS Investigation 9.0 Data Collection User’s Manual
12.11.2.5. Ping
Command
Ping Start
Explanation/Arguments
Initiate a sequence of pings.
Dial Up and Hang Up sections: See “About
Phonebook Entries” above.
Remote Address: The IP address of the server to be
pinged. This can be either an alphanumeric string or a
12-digit number.
Packet Size (byte): Size in bytes of the packet sent
with the Ping command. The maximum size is 2000
bytes.
Wait Time (ms): Time between pings in milliseconds.
Number of Pings: The number of pings to send.
There is no upper limit.
Timeout (s): See “Timeout Parameters for Session
Commands” above. (In this case, what the service will
wait for is simply a response from the pinged server.)
12.11.2.6. E-mail
Keep in mind that an e-mail must arrive at the server before it can be
downloaded by the recipient; it is therefore recommendable to insert a Wait
command of suitable duration before the Receive E-mail command.
156
Chapter 12. Command Sequences (with Data Service Testing)
Command
Receive E-mail
Explanation/Arguments
Receive an e-mail from a POP3 server.
Dial Up and Hang Up sections: See “About
Phonebook Entries” above.
Body/Attachment: Name of the file to which the email contents are to be written. All contents are written
to a single file: header fields, body text, and
attachments (if any).
Remote Address: The IP address of the POP3
server. This can be either an alphanumeric string (for
example, pop3.myserver.com) or a 12-digit number.
User: User name of e-mail account.
Password: Password for e-mail account.
Timeout (s): See “Timeout Parameters for Session
Commands” above.
Send E-mail
Send an e-mail to an SMTP server.
Dial Up and Hang Up sections: See “About
Phonebook Entries” above.
From: E-mail address of sender.
To: E-mail address of recipient.
Subject: Content of e-mail Subject field.
Body Text File: Name of file containing e-mail body
text.
Attachment: (Optional) Name of file to enclose with
the e-mail as attachment.
Remote Address: The IP address of the SMTP
server. This can be either an alphanumeric string (for
example, smtp.myserver.com) or a 12-digit number.
User: User name of e-mail account.
Password: Password for e-mail account.
Timeout (s): See “Timeout Parameters for Session
Commands” above.
LZT 108 9851 R1B
157
TEMS Investigation 9.0 Data Collection User’s Manual
12.11.2.7. Video Streaming
Command
Video Streaming
Explanation
Download streaming video from a streaming server
and play it in TEMS Investigation.
The arguments follow below.
Dial Up and Hang Up Sections
See “About Phonebook Entries” above.
WAP Load Section
This section is used when doing streaming via a WAP page.
•
WAP Streaming: Set this to true in order to enable the remaining
parameters in this section.
•
Streaming Link: The text string of the WAP page RTSP link to the stream
that is to be downloaded.
•
Remote Address: The IP address of the WAP page. The IP address can
be either an alphanumeric string, with or without http:// at the beginning
(for example, www.mywapserver.com), or a 12-digit number.
•
Connection Mode: One of CO (Connection-oriented), CL
(Connectionless), or WP-HTTP (Wireless Profiled HTTP).
–
CO and CL are used by WAP 1.x and require a WAP gateway. The
difference between the modes is essentially this: With CO, the phone
first contacts and performs a handshake with the WAP gateway before
starting to request WAP pages, whereas with CL this is not done.
–
WP-HTTP is used by WAP 2.0. This WAP version may use a WAP
proxy, but this is optional.
•
Gateway Address: (Appears when Connection Mode = CO or CL) The IP
address of the operator’s WAP gateway, given as a 12-digit number.
•
Gateway Port: (Appears when Connection Mode = CO or CL) The WSP
port on the server. The default port numbers are 9201 (CO), 9200 (CL).
•
Proxy Address: (Appears when Connection Mode = WP-HTTP; optional)
The IP address of the WAP proxy, given as a 12-digit number.
158
Chapter 12. Command Sequences (with Data Service Testing)
•
Proxy Port: (Appears when Connection Mode = WP-HTTP; optional) The
WAP proxy port number. The default is 8080.
•
User Agent: This is a string indicating, among other things, the make and
model of the device and what WAP software it has installed. (Some WAP
portals adapt their contents to the phones accessing them.)
Example of User Agent string (for Sony Ericsson K790i):
User-Agent: SonyEricssonK790i/R1JG Browser/NetFront/3.3 Profile/
MIDP-2.0 Configuration/CLDC-1.1
•
Timeout (s): See “Timeout Parameters for Session Commands” above.
Video Streaming Section
•
Source File: The file name of the video clip or streaming session
description to be downloaded from the streaming server.
•
Target Directory: If you wish to save the streamed content to a file,
specify the directory where the file should be stored.
•
Target Formats: If you wish to save the streamed content to a file,
specify the file format here. At present, the only option is AVI. The file
faithfully records the streaming session as it unfolded, preserving any
disruptions due to buffering events.
•
Target Frame Rate: The frame rate that will be used when saving the
streamed content to file. The target frame rate should be at least as high
as the native frame rate.
•
Port: The RTSP port on the streaming server. The default port number is
554.
•
Local RTP Port: Here you specify ports to use for RTP on your PC. The
port entered and the three following ports will be allocated to RTP data.
By default ports 5004–5007 are used.
•
Remote Address: The IP address of the streaming server. This can be
either an alphanumeric string (for example, myserver.com) or a 12-digit
number.
•
Use Proxy Server: Specify whether to access the streaming server
through an RTSP proxy server.
•
Proxy Address: The IP address of the RTSP proxy: alphanumeric string
or 12-digit number.
•
Prebuffering Length (s): Length (in seconds) of segment to buffer during
initial buffering. Min: 1 s. Max: 20 s.
LZT 108 9851 R1B
159
TEMS Investigation 9.0 Data Collection User’s Manual
•
Rebuffering Length (s): Length (in seconds) of segment to buffer during
rebuffering. Min: 1 s. Max: 20 s.
•
Measurement Mode: “Normal” means downloading a video clip of known
length (on-demand streaming). “Live” means tapping into a live stream or
repeating playlist delivered by a streaming server.
•
Duration (s): For Measurement Mode = “Live”, specify the duration of the
streaming session here. When this time has expired, the command
terminates.
•
Timeout (s): See “Timeout Parameters for Session Commands” above.
12.12.
Commands for SMS, MMS, and WAP
SMS is implemented with AT commands. MMS and WAP sessions are
conducted using WinWAP.
If a phone is going to send an SMS or MMS to itself, the Receive command
must follow directly after the Send command in the sequence; if some other
command intervenes, the message transfer may fail.
For SMS to work, the phone must support the following AT commands:
AT+CMGF with format 0 or 1 and AT-CMGS.
Command
Receive MMS
Explanation/Arguments
Receive an MMS.
The phone acting as recipient must not have
automatic MMS download turned on (where the phone
retrieves the MMS message from the MMS Center
automatically as soon as it receives a notification).
Dial Up and Hang Up sections: See “About
Phonebook Entries” above.
Timeout (s): See “Timeout Parameters for Session
Commands” above.
160
Chapter 12. Command Sequences (with Data Service Testing)
Command
Send MMS
Explanation/Arguments
Send an MMS.
Dial Up and Hang Up sections: See “About
Phonebook Entries” above.
Receiving Device: The phone number or e-mail
address to send the MMS to. The receiving device
may be identical with the sender (but see the
introduction to this subsection).
Source File: The file to send. A wide variety of file
types, including plain-text files and frequently used
image file formats, is supported. A file with an
extension unknown to TEMS Investigation will be sent
as an attachment to the MMS (content type
“application/octet-stream”).
Please note that operators generally impose a limit on
the MMS file size. If you encounter problems sending
MMS messages, try sending very small files to find out
whether the size limit is causing the problem.
MMS Gateway: The IP address of the operator’s WAP
(or MMS) gateway, given as a 12-digit number.
Gateway Port: The WSP port on the server. The
default port number is 9201.
MMSC URI: The URI of the MMS Center (usually
beginning with http://).
Timeout (s): See “Timeout Parameters for Session
Commands” above.
Receive SMS
Receive an SMS.
Timeout (s): See “Timeout Parameters for Session
Commands” above.
LZT 108 9851 R1B
161
TEMS Investigation 9.0 Data Collection User’s Manual
Command
Send SMS
Explanation/Arguments
Send an SMS.
Receiving Device: The phone number or e-mail
address to send the SMS to. The receiving device may
be identical with the sender (but see the introduction to
this subsection).
SMS Message: Content of SMS message; this can be
entered directly in the dialog or read from a text file.
Timeout (s): See “Timeout Parameters for Session
Commands” above.
WAP Load
Download a page from a WAP server, or one page
each from several WAP servers. Note that WAP pages
that redirect the user to a different page cannot be
downloaded.
Dial Up and Hang Up sections: See “About
Phonebook Entries” above.
Remote Address(es): The IP addresses of the WAP
pages. Click the “+” button to add one more IP
address. Each IP address can be either an
alphanumeric string, with or without http:// at the
beginning (for example, www.mywapserver.com), or a
12-digit number.
WAP Gateway: The IP address of the operator’s WAP
gateway, given as a 12-digit number.
Gateway Port: The WSP port on the server. The
default port number is 9201.
User Agent: This is a string indicating, among other
things, the make and model of the device and what
WAP software it has installed. (Some WAP portals
adapt their contents to the phones accessing them.)
Example of User Agent string (for Sony Ericsson
K790i):
User-Agent: SonyEricssonK790i/R1JG Browser/
NetFront/3.3 Profile/MIDP-2.0 Configuration/CLDC-1.1
Timeout (s): See “Timeout Parameters for Session
Commands” above.
162
Chapter 12. Command Sequences (with Data Service Testing)
12.13.
Commands for KPI Calculation (UMTS)
These commands are used to obtain data for computing KPIs. Please note
that in order to obtain KPIs, these commands and no others must be used;
the corresponding regular commands for each service (covered previously in
this chapter) do not produce the required output.
The KPI commands are similar to their non-KPI counterparts, but differ with
respect to some parameters. The following differences are common to all
commands:
•
KPI commands do not have a Timeout parameter. Rather, timeouts are
settable during post-processing so that performance requirements on
which to base the KPIs can be freely adjusted. See section 7.7.1, page
75.
•
KPI commands have an extra parameter, Location Category. This is
simply an integer label (in the range 1 ... 9999) which will appear in the
KPI report, making it easier to distinguish between test cases. See
appendix G.5, page 361.
•
KPI commands must always have their phonebook entry explicitly
indicated, since they cannot rely on a preceding Dial Up command
(compare section 12.11.2.1).
Other differences are covered in the table below. As regards parameters
shared with non-KPI commands, see the descriptions of the latter in sections
12.11.2 and 12.12. The device assignment is always the same as for non-KPI
commands.
There are no KPIs for SMS.
Command
Explanation/Arguments
KPI Voice
Corresponds to Dial with Call Type = Voice or Voice +
AQM (the same choice of call type is made in the KPI
command).
KPI FTP DL,
KPI FTP UL
Correspond to FTP DL and FTP UL respectively.
KPI HTTP
Corresponds to HTTP Load.
KPI Receive
E-mail
Corresponds to Receive E-mail.
LZT 108 9851 R1B
163
TEMS Investigation 9.0 Data Collection User’s Manual
Command
Explanation/Arguments
KPI Send E-mail
Corresponds to Send E-mail.
KPI MMS
Corresponds to a Send MMS (the assigned phone is
the sender) followed by a Receive MMS (the phone
specified under Receiving Device is the recipient).
Some of the MMS KPIs encompass both sending,
notifying, and receiving.
In order to verify that the same MMS has been sent
and received, TEMS Investigation adds a timestamp of
its own (content type “text/plain”) to the MMS.
KPI WAP
Corresponds to WAP Load.
KPI commands must be used in conjunction with Start Recording/Stop
Recording in order to have the KPI measurements recorded in a logfile.
Here is a simple example of a command sequence for KPI measurement:
For an overview of how to obtain KPIs, see chapter 25, page 290.
12.14.
Tips and Tricks
The command sequence tool gives the user great freedom in assigning tasks
to devices. It is possible to write sequences that do not work, or that produce
unpredictable results. This section gives some advice on composing
sequences.
12.14.1. Synchronization
The Synchronize command (see section 12.6) needs to be used whenever
the actions of several devices need to be aligned in time. By default, each
164
Chapter 12. Command Sequences (with Data Service Testing)
device involved in a command sequence executes its commands
independently of what the other devices are doing, so without synchronization there is no guarantee that different devices will reach a particular part
of the sequence at the same time.
•
When phones are to interact with each other at some point in the
sequence, a Synchronize command needs to be inserted immediately
before the interaction part.
•
In benchmarking applications, it is often crucial to ensure that different
phones begin their tasks at the exact same time. To accomplish this,
insert a Synchronize command immediately before the benchmarking
tasks in the sequence.
12.14.2. MS and DC Assignment
The MS and DC channels of the same phone must not be assigned
commands in parallel, as if they were independent entities. Specifically, voice
or video telephony (assigned to the MS) cannot be run in parallel with a data
service (always assigned to the DC). In other words, you cannot assign a
telephony command to MS1 and then have DC1 conduct a data session in
the next command. Rather, a Synchronize command must be inserted
between the two tasks, so that one task is finished before the next is begun.
The example below shows how such a sequence might be written:
12.14.3. Collecting Data for RAN Tuning Reports
When composing command sequences that will collect data for RAN Tuning
reports (Route Analysis User’s Manual, chapter 16), please follow these
guidelines:
•
Insert a Wait command (at least 10 s) between calls.
LZT 108 9851 R1B
165
TEMS Investigation 9.0 Data Collection User’s Manual
•
Use different command sequences for accessibility and retainability
analyses. Generally speaking, short calls should be used for accessibility
statistics and longer calls for retainability statistics.
12.14.4. Windows Vista and IPv6
In Windows Vista, it is recommended that you disable IPv6 for all device
modems, since otherwise dial-ups will require a lot more time. See the
Getting Started Manual, section 3.16.2 for instructions.
12.15.
Command Sequence Properties
The only editable generic property of a command sequence is the number of
times it should be executed when started. The default is 1.
Click the Properties button in the Command Sequence window.
Number of
Executions
The total number of times to execute the command
sequence.
Interval (s)
Interval between sequence executions in seconds.
166
Chapter 12. Command Sequences (with Data Service Testing)
12.16.
Running a Command Sequence
Command sequences are run from the Command Sequence window.
Note: When executing a command sequence, the keylock function
must not be activated in any of the phones. If it is, the command
sequence will not work properly.
To start executing a command sequence, click Start.
The phones involved in a command sequence will execute their commands
independently of one another, except when phones engage in a service
where they interact, or the Synchronize command is used. Compare section
12.14.
To terminate the execution of a command sequence, click Stop.
If you stop a command sequence while an SMS or MMS message is being
transferred, you should wait until the receiving phone has received the
message before restarting the sequence. Otherwise, unpredictable behavior
may result.
Please note that command sequences from TEMS Investigation versions
older than 7.0 cannot be run in TEMS Investigation 9.0.
12.16.1. Stopping and Restarting Devices
While a command sequence is running, an additional pane appears at the
bottom of the window showing the status of all devices involved. The status
information also appears in the command pane next to the command(s) being
executed:
LZT 108 9851 R1B
167
TEMS Investigation 9.0 Data Collection User’s Manual
All devices that are executing the sequence are tagged with a green light on
the left.
It is possible to stop and restart individual devices taking part in the command
sequence without halting the execution of the whole sequence.
•
To stop a device, right-click it in the bottom pane and choose Stop.
The device will now immediately stop participating in the sequence. While the
device is winding up whatever it has been doing (for example, concluding an
FTP session and hanging up), the dot on the left will be colored yellow. When
the device has finished this task, the dot will turn red.
While a device is stopped, any other commands requiring interaction with the
stopped device will of course fail. All commands not involving the stopped
device, however, will continue to execute as normal. (If you stop all devices
involved in the sequence, the entire sequence will terminate.)
•
To restart a stopped device, right-click it in the bottom pane and choose
Start. The device will resume participation in the sequence the next time
the sequence execution starts over from the beginning.
12.16.2. Options for Individual Commands
•
You can test a single command in a sequence by right-clicking it and
choosing Run Command. This command will then be executed in isolation
(as far as possible; any other devices that are supposed to interact with
the assigned device must of course be operated manually).
•
You can disable a command in a sequence by right-clicking it and
choosing Disable. This command will then be skipped when the sequence
is executed (and any tasks relying on the skipped command for their
completion will naturally fail). To re-enable the command, right-click it
again and choose Enable.
12.16.3. Running Multiple Command Sequences
It is possible to run several command sequences concurrently, each in a
Command Sequence window of its own. However, no device can appear in
more than one sequence; sequences cannot interact with each other in any
way or be synchronized. The advantage of being able to run several
sequences in parallel is that you can do testing with multiple devices at the
same time without having to write a single long sequence controlling all
devices.
168
Chapter 12. Command Sequences (with Data Service Testing)
12.17.
Presentation of Data Service Testing
Running command sequences that test data services will produce the
following output:
•
Information elements in the “Data” category: see Information Elements
and Events, section 3.5. Selections of these elements are by default
presented in the data service oriented line charts and in the Data Session
status window. See Information Elements and Events, sections 8.1 and
8.5.
•
A number of events pertaining to RAS, to various services, and more: see
Information Elements and Events, sections 7.3 and 7.4. These are by
default presented in the data service oriented line charts.
•
Messages in the Data Reports message window: see Information
Elements and Events, section 8.3.3.
•
(For UMTS, if KPI commands have been used:) KPI data, serving as the
basis for KPI reports.
12.18.
Saving and Loading Command Sequences
Command sequences can be saved as XML files.
To save the command sequence currently in the Command Sequence
window, click Save and specify a name for the XML file.
Regarding the saving of phonebook entries, see section 12.11.2.
To open an existing command sequence, click Open and select your
XML file.
12.19.
Data Session Error Messages
Below are listed error messages that may occur when doing data service
testing with a command sequence.
LZT 108 9851 R1B
169
TEMS Investigation 9.0 Data Collection User’s Manual
12.19.1. General Data Service Error Messages
Message
Explanation
Bad hostname
An attempt was made to use an APN without
web services.
Connection failed
A failure occurred in connecting to the server.
Connection terminated
The connection was terminated (most likely
by the server) before completion.
Connection timeout
A timeout occurred while the client was
attempting to establish a connection to the
server. Possible causes:
•
Use of incorrect port number.
•
(FTP) URI or IP address put into FTP
Account field instead of Remote Address
field.
Session aborted by user
The user aborted the session for some
reason.
Socket already open or in
use
An attempt was made to use a socket that is
already opened or already in use.
Socket creation failed
An attempt to create a socket was
unsuccessful.
Socket error
Socket binding to local port failed, or
receiving of data from the socket failed.
Possible causes:
170
•
The socket already exists when
attempting a dial-up. Try disconnecting
the data session (icon in system tray).
•
The phone has been disconnected from
TEMS Investigation. Try reconnecting the
phone.
•
(FTP) Use of leading slash for rootlocated file.
Chapter 12. Command Sequences (with Data Service Testing)
Message
The address is not valid
Explanation
Possible causes:
•
Use of non-existent URI or IP address as
remote address.
•
The DNS lookup of the host name failed.
•
(FTP) Path appended to the URI or IP
address under Remote Address (not
allowed: see section 12.11.2.3).
Timeout
A connection to the server was successfully
established, but a timeout occurred at a later
time. (Compare Connection timeout above.)
Unknown error
A failure occurred in decoding a message
from the server. Possible causes:
•
Use of forward slashes in the Target File
(local) path.
•
Phone disconnected from TEMS
Investigation. Reconnect the phone.
12.19.2. RAS Error Messages
Message
Cannot find the
phonebook entry
Explanation
The Dial-up Networking entry referenced by
the Dial Up command does not exist. Create
a new phonebook entry in Network and
Dialup Connections based upon the modem
entry for the phone (see the Getting Started
Manual, section 8.4).
This error usually occurs when the command
sequence has been transferred from another
computer: see section 12.11.2, “About
Phonebook Entries“.
Internal error
An invalid APN was used.
No answer
The remote computer did not respond.
LZT 108 9851 R1B
171
TEMS Investigation 9.0 Data Collection User’s Manual
Message
The PPP link control
protocol terminated
Explanation
Possible causes:
•
PDP Context Activation failure. See the
Activate PDP Context Reject message in
the Layer 3 Messages window for the
cause value.
•
The phone lacks an APN for the network.
Try setting the APN from the Windows
HyperTerminal by sending the following
command to the phone:
AT+CGDCONT=1, "IP","myserver.com"
(replace the final string by the correct
URI). See also the Getting Started
Manual, section 8.5.
The request has timed
out
A subsequent error occurred after an initial
PDP Context Activation error. Stop, reload,
and restart the command sequence.
Unknown error
Possible cause: Use of *99***n# as access
phone number in Dial Up (where n indicates
the nth APN entry in the phone). Some
phones do not accept this syntax.
12.19.3. FTP Error Messages
Message
Explanation
Account not accepted
The FTP account was invalid.
Cannot transfer without
valid account
The user lacked a valid account for logging in
to the FTP server.
Data port could not be
opened
The server failed to connect on the FTP data
port. (FTP utilizes two ports, a data port and a
command port.)
File access denied
The user did not have permission to access
the file on the server.
172
Chapter 12. Command Sequences (with Data Service Testing)
Message
File not found
Local directory error
Explanation
The file to upload or download was not found.
Possible causes (download):
•
The file was not in the remote directory.
•
The file was in the remote directory, but
the user lacked read permission for that
directory.
•
(FTP DL) The target file directory did not
exist, and an attempt to create it failed.
•
(FTP UL) The source file directory did not
exist.
Not able to open file for
writing
The specified file is read-only.
Password not accepted
The password was invalid.
Port command failed
Something went wrong when non-passive
mode was used. This could happen if the
client is behind a firewall.
The RETR command
failed
A failure occurred when trying to retrieve a
file from the server.
Unsufficient storage
space
There was not enough disk space available to
download the file.
User not accepted
The user name was invalid.
12.19.4. E-mail Error Messages
Message
Failed to add attachment
to the message
LZT 108 9851 R1B
Explanation
Adding an attachment failed.
173
TEMS Investigation 9.0 Data Collection User’s Manual
Message
Explanation
HELLO command was
rejected or not
responded to by the
server
The client attempted to initiate a connection
with the e-mail server, but the server did not
respond.
Invalid values of
parameters
Typically reported when the e-mail message
body or receiver/sender is missing.
Password command
timed out or rejected
Sending the password to the server failed.
The DATA command
failed
Sending the e-mail message body to the
recipient failed.
The message body is too
big
(The maximum message body size is 32 kB.)
The RETR command
failed
An attempt to retrieve a file from the server
failed.
The user command has
timed out or rejected
Sending the user name failed.
There was a problem
with the server with
respect to the RCPT
command
The e-mail server could not resolve the
identity of the message recipient.
There was no response
from the server
The client attempted to retrieve the response
code from the server, but the server did not
respond to the client's request.
12.19.5. Video Streaming Error Messages
Message
Connection failed
174
Explanation
A failure occurred in the RTSP protocol when
the streaming client was trying to initiate a
connection with the streaming server.
Chapter 12. Command Sequences (with Data Service Testing)
Message
Explanation
Data timeout
The streaming client did not receive any data
within the specified timeout period.
File not found
The requested file was not found on the
streaming server.
Host could not be
resolved
The streaming server with the specified
remote address could not be found.
Invalid parameter
Some parameters in the command sequence
setup are incorrect.
Live measurement mode
required
(Live measurement mode is required when
specifying an SDP file as source file.)
Stream setup failed
The streaming client did not succeed in
setting up the audio/video streams.
Streaming client initialization failed
A failure occurred related to adding or
connecting video/audio filters.
Streaming client internal
error
This message is usually reported due to a
failure in the RTSP communication with the
streaming server.
Unsupported payload
An attempt was made to use an unsupported
audio or video codec.
12.19.6. MMS Error Messages
Message
Explanation
Message not found on
MMSC
The message could not be located on the
MMSC.
MMS receive failure
A failure occurred when retrieving the MMS
from the MMSC.
MMS send failure
This error message has many possible
causes. They are listed below.
LZT 108 9851 R1B
175
TEMS Investigation 9.0 Data Collection User’s Manual
MMS Send Failure Causes
•
An unspecified error occurred during the processing or reception of the
corresponding request.
•
The client did not have permission or funds to perform the requested
operation.
•
An inconsistency with the message format was detected when the
corresponding request was parsed.
•
There was no MMS address (From:, To:, Cc:, Bcc:) in a proper format, or
none of the addresses belonged to the MMSC.
•
The MMSC was not able to accept the corresponding request due to
capacity overload.
•
The MMSC does not support the corresponding request abstract
message.
•
The corresponding M-Send.req as received was valid and understood by
the MMS Proxy-Relay, but some temporary condition or event caused an
error to occur.
•
The MMS Proxy-Relay was not able to handle the corresponding MSend.req due to an unspecified error on the transport layer or due to
capacity overload.
•
An unspecified permanent error occurred during the processing or
reception of the corresponding M-Send.req.
•
The corresponding M-Send.req was rejected due to failure of
authentication or authorization of the originating MMS client.
•
An inconsistency in the formats of optional or mandatory header fields or
an error in header field values was detected when the corresponding MSend.req was parsed.
•
The MMS Proxy-Relay was not able to resolve the insert-address-token
into a valid sending address.
•
The MM content in the M-Send.req was not accepted due to size, media
type, copyrights, or for some other reason.
•
The corresponding request contained a reply MM that was too large, not
within the reply charging deadline, and/or contained non-text media
elements although only text was allowed.
•
The M-Send.req contained an XMms-Reply-Charging header field with
the value “Accepted” or “Accepted text only”.
176
Chapter 12. Command Sequences (with Data Service Testing)
•
The MMS Proxy-Relay does not support reply charging. The
corresponding M-Send.req contained reply charging parameters and was
thus rejected.
•
The MMS Proxy-Relay does not support address hiding. The
corresponding M-Send.req had XMms-Sender-Visibility set to “Hide” and
was thus rejected.
Message
Explanation
MMSC redirect not
supported
The MMSC reply is a redirection request.
MMSC request error
A failure occurred following a request to the
MMSC.
MMSC unexpected reply
A reply was received in a format other than
an MMS message.
Received MMS is corrupt
The received MMS is corrupt.
12.19.7. WAP Error Messages
Message
Explanation
Failed to create WAP
stack
Something went wrong when creating the
WAP stack.
Failed to disconnect
An error occurred when disconnecting from
the server.
The GET command
failed
The requested data source could not be
retrieved.
LZT 108 9851 R1B
177
TEMS Investigation 9.0 Data Collection User’s Manual
13.
Device Properties
From TEMS Investigation you can view and modify certain properties of
connected devices. To access the property dialog of a device, do as follows:
•
Choose the device on the Equipment Control toolbar.
Click the Equipment Properties button. (Alternatively, right-click the
device in the Equipment Configuration window and choose Properties.)
13.1.
Overview of Control Function Support in
Devices
This overview covers Sony Ericsson, Motorola, and Nokia phones. Other
supported devices share little or none of the control functionality listed here.
Connectable Nokia phones that belong to the “Nokia UMTS NTM v3”
generation are Nokia 6120, 6121, and N95.
178
Chapter 13. Device Properties
GAN NTM v2
GSM NTM v2
UMTS NTM v2
Nokia
UMTS NTM v3
W600i
K600i
K790i/a
K800i
Z750i
Control Function
E1000, E1070, Razr V3x
Mot.
Razr V3xx, Razr2 V9
Sony Ericsson
Access class control
Auto answer
Barred cells, access control
BLER target control (WCDMA)
C/A measurements (GSM)
Channel verification (GSM)a
EDGE capability control
HSPA capability control
L3 messages, discard/ignore
Lock on ARFCN
Lock on GSM band
Lock on PLMN
Lock on RAT
Lock on SC
Lock on UARFCN
Lock on WCDMA band
Redial on block
Reserved cells, access control
Speech codec control (GSM)
TxPower control (GSM)
a. See chapter 32, page 315.
LZT 108 9851 R1B
179
TEMS Investigation 9.0 Data Collection User’s Manual
13.2.
Properties of Sony Ericsson Phones
This section deals with viewable and editable properties of Sony Ericsson
phones.
Properties not dependent on the network configuration can be edited as soon
as the phone has been enabled; it does not even have to be attached to a PC
port. When you connect the phone in the application, the phone retrieves all
settings you have specified for it. Network-dependent settings, however (such
as locking on a channel: see sections 13.2.3.5 and 13.2.3.3), cannot be
modified unless the phone is connected.
Any changes to the properties will apply until the phone is disabled.
This section describes all tabs appearing for Sony Ericsson phones that are
currently offered with TEMS Investigation. Some tabs appear only for a
subset of these phones, and the precise contents of some tabs differ between
phones. The screenshots below show representative examples of dialog
contents.
Functions of Dialog Buttons
Besides OK and Cancel, the Properties dialog contains the buttons Reset
and Apply. These buttons have the following functions:
•
Apply saves all the changes made (on all tabs), like OK, but without
exiting the dialog.
•
Reset restores all the default settings (on all tabs) and exits.
13.2.1.
General Properties
13.2.1.1. Access Class Control Tab
On this tab, access class settings (see 3GPP 22.011, chapter 4) can be
manipulated.
180
Chapter 13. Device Properties
Classes 0 ... 9
Every phone is by default allocated randomly to one
of these classes. You can change the default
allocation here.
Network access
for emergency
calls, etc.
(Classes 10 ... 15)
Membership of these classes entitles a phone to
make access attempts in various special situations.
Check the classes that you want the phone to be a
member of.
13.2.1.2. Call Tab
TEMS Investigation can answer incoming calls automatically, that is, simulate
off hook (auto answer). This feature ensures that network originated calls can
be properly established without any need for manual actions.
It is also possible to have the last dialed number automatically redialed.
LZT 108 9851 R1B
181
TEMS Investigation 9.0 Data Collection User’s Manual
Auto answer
Check the box to enable auto answer. Enter the call
length in seconds, or choose “Never end call”.
Redial dropped/
blocked call
Check the box to have the last dialed number
redialed after a call has been dropped or blocked.
13.2.1.3. Discard Messages Tab
Alternative name: Messages Control
For certain Sony Ericsson UEs you can discard Layer 3 messages of
specified types.
•
In the tree view, check the types of message that you want to discard.
(The UE can store up to 10 message types in its memory.)
When you click OK or Apply, the settings are sent to the phone, whereupon
the tab is blanked (all boxes are unchecked).
Discarded messages are colored red in the Layer 3 Messages window and
tagged with a special note in the plain-text decoding; see section 18.3, page
224.
13.2.1.4. Lock on PLMN Tab
You can lock the phone on a PLMN, specified by an MCC and MNC
combination. Note that this function can be meaningfully applied only if the
SIM supports multiple PLMNs. If you lock on a PLMN that is not available, the
phone will go into limited service mode.
13.2.2.
WCDMA Properties
13.2.2.1. BLER Target Tab
For certain Sony Ericsson UEs you can override the BLER target set for the
UE by the network.
182
Chapter 13. Device Properties
Normal
No modification of BLER target.
Modify
The BLER target (in percent) for the UE will change
to the value you set in the combo box.
13.2.2.2. RAT Control Tab
Alternative name: CAS System Capability Control
Certain Sony Ericsson UEs can be locked to either WCDMA or GSM. The
RAT lock function works only in idle mode.
Normal
No forcing of UE network selection.
GSM
The UE is forced to camp on a GSM network
whenever one is available.
WCDMA
The UE is forced to camp on a WCDMA network
whenever one is available.
RAT Control vs. GSM Settings
For phones equipped with both WCDMA and GSM control functionality, the
RAT Control setting takes priority over all GSM-specific settings, including the
GSM band and channel lock settings described in sections 13.2.3.5, 13.2.3.3,
and 13.2.3.1.
On the assumption that both types of network are available, this has the
following implications:
•
If RAT Control is set to “WCDMA”, the phone will be locked to WCDMA
indefinitely1; specifying GSM bands or channels to lock on will not by itself
force the phone into GSM mode.
LZT 108 9851 R1B
183
TEMS Investigation 9.0 Data Collection User’s Manual
•
If RAT Control is set to “Normal”, the phone will camp on whatever
network the fixed side prescribes (as it normally does). If and when the
phone switches to GSM, any GSM settings you have made will take
effect, and if this includes locking to a GSM band and/or channel subset,
the phone will remain in GSM mode indefinitely (no longer obeying
contrary orders from the fixed side).
•
In order to force immediate use of GSM, you must set RAT Control to
“GSM”; the phone will then be locked to a GSM network indefinitely, and
any GSM-specific settings you have made will take effect.
Note again that the RAT lock function has an effect in idle mode only.
13.2.2.3. WCDMA Cell Bar Control Tab
On this tab you can modify the phone’s behavior with respect to accessing of
barred, reserved, and other cells:
Normal
No change from normal cell barring behavior.
All Cells Allowed
The phone will access any cell, also barred and
reserved ones.
Only Barred Cells
Allowed, etc.
Which types of cell the phone will access is restricted
in the manner indicated.
13.2.2.4. WCDMA Cell Selection Control Tab
On this tab you can lock the UE to, or bar the UE from, UARFCNs or
scrambling codes in WCDMA, in idle mode as well as connected mode.
1. Except if you put the phone in scanning mode (chapter 8), in which case
it ceases to behave like a phone at all.
184
Chapter 13. Device Properties
Function
Choose “Lock on” to lock on UARFCNs/scrambling
codes.
Choose “Prevent” to bar UARFCNs/scrambling
codes.
“Normal” means no effect on default behavior.
Ignore cell barred
Check this if you want the phone to ignore the
“Barred” flag in the base station (this flag normally
prevents the phone from accessing the cell).
Source
UARFCNs
Lists the UARFCNs you can choose as targets.
Target UARFCNs
Lists the set of UARFCNs to lock on or exclude. Use
the left and right arrow buttons to move channels
between the boxes. Click the double right arrow to
clear the Target channels box.
Up to 32 target UARFCNs can be specified.
However, note that if you list more than one
UARFCN, you cannot also select scrambling codes
as targets.
LZT 108 9851 R1B
185
TEMS Investigation 9.0 Data Collection User’s Manual
Source SCs
Lists the scrambling codes you can choose as
targets.
Target SCs
Lists the scrambling codes to lock on or exclude. Use
the left and right arrow buttons to move channels
between the boxes. Click the double right arrow to
clear the Target channels box.
To be able to specify target SCs, you must first have
selected a single target UARFCN. Up to 32 SCs can
then be listed as targets.
If you have specified multiple target UARFCNs, you
cannot add any target SCs (the Target SCs box is
grayed).
Default
Restore default settings. You must click Apply for this
to take effect.
13.2.2.5. WCDMA RRC Radio Capability Control Tab
For phones supporting HSDPA you can enable or disable the HSDPA
capability.
R99 Only
Only WCDMA R99 capability is enabled.
HSDPA
HSDPA capability is enabled. You can also set what
HSDPA category the phone should report. These
categories are defined in 3GPP TS 25.306 Table
5.1a.
13.2.2.6. Tabs Listing Messages and Mode Reports
For certain Sony Ericsson UEs, a tab named “SEMC Log Mask” or “Extended
reports”, or a number of other tabs, are provided listing messages and mode
reports delivered by the UE. There is normally no reason to change the
default settings.
•
186
Path Searcher must be checked for the Finger Info information elements
(WCDMA) to be valid.
Chapter 13. Device Properties
•
Regarding TPC per cell, see Information Elements and Events, section
6.1.
13.2.3.
GSM Properties
Regarding conflicts with the WCDMA RAT control settings, see section
13.2.2.
13.2.3.1. GSM Band Control Tab
You can restrict the phone’s use of frequency bands. This will of course result
in failed calls if you have forbidden all bands that are currently available in the
area. By default no restrictions are imposed.
13.2.3.2. GSM C/A Tab
Phones capable of C/A measurements on hopping channels can be set to
measure either one channel or two channels on each side of the carrier.
13.2.3.3. GSM Dedicated Mode Tab (and Related Toolbar
Buttons)
When the phone is in dedicated mode, you can manipulate handovers.
Specifically, you can do one of the following:
•
prevent handover to specified channels. The phone will then report no
RxLev for these channels.
•
force handover to a specified channel, or restrict handovers to a chosen
channel set. The phone will then report a very high RxLev for any such
cell, a very low RxLev for the serving cell, and no RxLev for other
neighboring cells.
LZT 108 9851 R1B
187
TEMS Investigation 9.0 Data Collection User’s Manual
Definition of channel sets is carried out exactly as for idle mode. See section
13.2.3.5.
Function
To manipulate handovers, choose “Prevent HO” or
“Target HO” (that is, force handover).
Filter,
Source channels,
Target channels
In the Target channels box, list the channels to which
you want to force or prevent handover.
Multiband
reporting
If you check this box, only the specified number of
channels from the other band will be reported.
Default
Restore default settings for dedicated mode. You
must click Apply or OK for this to take effect.
13.2.3.4. GSM EDGE Capability Control Tab
For EDGE-capable phones you can choose to disable the EDGE capability
(“Off”). This function can be used to force data transfer over GPRS rather
than EDGE.
The Reset button resets this setting to the factory default (that is, “On”).
13.2.3.5. GSM Idle Mode Tab
When the phone is in idle mode, it can be locked to one channel or to a set of
channels. This inhibits all reselections to other channels, regardless of the
signal strength and quality of neighboring cells. The inverted operation is also
possible, namely to prevent reselection to a specified channel set.
188
Chapter 13. Device Properties
You define the set of channels to lock on, or exclude, by selecting them in the
Source channels box and moving them to the Target channels box.
The phone will remain locked to the specified channel set until the Target
channels list is cleared or the phone is power cycled. At most 32 channels
can be in the target set.
Function
Choose “Lock on” to lock on a set of channels.
Choose “Prevent” to exclude a set of channels.
“Normal” means no effect on default behavior.
Filter
Choose which channels should be listed in the
Source channels box. “Neighbors” lists all neighbors
currently reported by the phone. “Cell file” lists all
cells given as neighbors of the current serving cell in
the cell file.
Ignore cell barred
Check this if you want the phone to ignore the
“Barred” flag in the base station (this flag normally
prevents the phone from accessing the cell).
Source channels
Lists the channels (ARFCNs) that you can choose as
targets.
Target channels
Lists the channel set to lock on or exclude. Use the
left and right arrow buttons to move channels
between the boxes. Click the double right arrow to
clear the Target channels box.
Default
Restore default settings for idle mode. You must click
Apply or OK for this to take effect.
LZT 108 9851 R1B
189
TEMS Investigation 9.0 Data Collection User’s Manual
13.2.3.6. GSM Speech Codec Tab
Alternative name: CAS Speech Codec
You can choose which of the available speech codecs should be enabled in
the phone. By default all codecs are enabled.
13.2.3.7. GSM TxPower Control Tab
For each GSM frequency band you can specify a TxPower value which will
override the network allocated TxPower. Regarding the latter, see 3GPP TS
45.005, section 4.1.
13.3.
Properties of Motorola UEs
For all settings on these tabs, you need to click the Send button to transfer
the settings to the UE. Click Close to exit the dialog without transferring any
changes made.
13.3.1.
Logs
It is possible to govern what categories of data will be recorded by a Motorola
UE. This is done from the UE property page. Any changes to the properties
apply until the UE is disabled.
The items listed on the two tabs constitute everything that the UE can record.
When you connect the UE, all items on the Basic Logs tab are by default
checked and will be recorded. The items on the Extended Logs tab are by
default unchecked.
•
To turn off recording of a log, uncheck it.
•
To turn off recording of all logs on a tab, click Clear all.
All logs appear as messages in the Layer 2 Messages, Layer 3 Messages, or
Mode Reports window, and can be inspected there in plain-text decoded
format. See chapter 18.
190
Chapter 13. Device Properties
13.3.1.1. Basic Logs Tab
Below is indicated which information elements (if any) are updated by each of
the logs on the Basic Logs tab. The information elements are from the
“WCDMA” category unless otherwise noted.
Log
Updated IEs
L3 RRC Message
Report
RB Setup UL DPCH SC, UL Interference Serving
L3 Broadcast
Message Report
SIB Id
L3 Paging
Message
–
DL Inner Loop
Power Ctrl
SIR, SIR Target
Random Access
–
RLC Statistics
“RLC” elements
UL Signal Strength
Power Ctrl
UE Tx Power
RAT
–
RRC State
“RRC State” elements
UE Identity
Phone Software Version
DL Transport
Channel
“Trsp Ch” elements
UE Intra-Freq
“AS”, “Det Neigh”, “Mon Neigh”, “SAN”, “Serving”,
and “Str Neigh” elements (active set and neighbors
on the same frequency); UTRA Carrier RSSI
UE Inter-Freq
“Det Neigh”, “Mon Neigh”, “SAN”, and “Str Neigh”
elements (neighbors on other frequencies)
Cell Reselection
Measurement
–
LZT 108 9851 R1B
191
TEMS Investigation 9.0 Data Collection User’s Manual
Log
Updated IEs
GSM Carrier RSSI
“GSM Neigh” elements
GSM Dedicated
Mode
“GSM” category: Mode, Mode (Num), Neighbor
ARFCN, Neighbor BSIC, Neighbor RxLev
GSM Idle Mode
“GSM” category: Mode, Mode (Num), ARFCN
BCCH, BSIC, RxLev Full, RxLev Sub, RxQual Full,
RxQual Sub, Neighbor ARFCN, Neighbor BSIC,
Neighbor RxLev
GSM L3 Message
and Channel
Request
“GSM” category: RxQual Full, RxQual Sub, ARFCN
BCCH, BSIC
GSM System
Information
–
GSM L3 GMM/SM/
SMS Report
–
13.3.1.2. Extended Logs Tab
The logs on the Extended Logs tab do not update information elements.
13.3.2.
Control Functionality
For additional details on control functions, please refer to Motorola’s own
documentation, included on the TEMS Investigation installation CD under TI
9.0 UE SW → Motorola.
192
Chapter 13. Device Properties
13.3.2.1. RAT/Band/Frequency/Cell Lock Tab
RAT Lock
You can lock on various bands and sets of bands.
The list is self-explanatory.
Sector Lock
You can lock on a UARFCN/SC combination in
WCDMA idle as well as connected mode. Check
“Idle” and “DCH” as desired to set the scope of the
sector lock.
UARFCN Lock
You can lock on a UARFCN in WCDMA idle as well
as connected mode. Check “Idle” and “DCH” as
desired to set the scope of the UARFCN lock.
Channel Lock
You can lock on a band and ARFCN in GSM idle as
well as dedicated mode. Check “Idle” and “DCH” as
desired to set the scope of the channel lock.
13.3.2.2. UE Handling Tab
From this tab you can perform some basic UE operations: turn off, restart,
enter PIN.
LZT 108 9851 R1B
193
TEMS Investigation 9.0 Data Collection User’s Manual
13.3.2.3. Cell Barring Tab
On this tab you can set cell barring behavior in GSM and WCDMA mode. The
phone can be configured to ignore cell barring for cells of specified types.
13.3.2.4. Layer 3 Ignore Tab
On this tab you can instruct the phone to ignore specific Layer 3 messages.
To enable this function, select the Layer 3 Ignore option.
To ignore a message, select its category under Protocol Discriminator, then
enter its message ID (as defined in the 3GPP specifications) and click Send.
13.3.2.5. SMS Tab
From this tab you can send an SMS message to a mobile phone.
Mobile no.
The number of the phone that should receive the
SMS.
Message
The SMS message string.
194
Chapter 13. Device Properties
13.4.
Properties of Nokia UEs
13.4.1.
Band/Channel Control Tab
The settings on this tab apply in GSM mode only. They are the same as for
Nokia GSM phones; see section 13.5.1.
13.4.2.
Cell Barring Tab
The settings on this tab apply in GSM mode only. They are the same as for
Nokia GSM phones; see section 13.5.2.
13.4.3.
RAT Lock Tab
Release System
Lock (dual)
The UE will not be locked to a radio access
technology.
GSM
The UE will be locked in GSM mode.
WCDMA
The UE will be locked in WCDMA mode.
RAT Control vs. Technology-specific Settings
If you lock a Nokia UE on a RAT, then try to apply a locking function for a
different RAT, the UE will go into No service mode. For example, this will be
the result if you lock the UE to GSM, then attempt to lock on a WCDMA cell.
However, the technology-specific setting is remembered and will come into
effect after the RAT lock has been released. In the above example, when you
release the GSM RAT lock, the UE will immediately switch to WCDMA and
lock on the WCDMA cell you selected.
13.4.4.
Sector Lock Tab
LZT 108 9851 R1B
195
TEMS Investigation 9.0 Data Collection User’s Manual
The settings on this tab apply in WCDMA mode only.
Enable Sector
Lock
The UE will be locked to the chosen UARFCN and
SC.
Disable Sector
Lock
The UE will not be locked to a UARFCN or SC in idle
mode.
13.5.
Properties of Nokia GSM Phones
13.5.1.
Band/Channel Control Tab
You can lock the phone to a single band and/or a single ARFCN. The channel
lock function works in idle mode only.
13.5.2.
Cell Barring Tab
Cell Barring
Normal
The phone will not camp on barred cells.
Cell Barring
Reversed
The phone will camp only on barred cells.
196
Chapter 13. Device Properties
Cell Barring
Ignored
13.5.3.
The phone will ignore cell barring.
FTD (Field Test Display) Log Mask Tab
This tab governs which categories of data the phone will log. By default all log
banks are checked except nos. 4 and 9, which are not used, and no. 12 (AMR
Data). Of logbanks 10–12, only two can be selected at a time, so to be able to
select no. 12 you must deselect one of the others.
Description of Log Banks
No.
Name
Contents
1
Radio Parameters
GSM and GPRS serving cell information
2
Radio Parameters
Neighbors
GSM neighbor information
3
GPRS Neighbor
Parameters
GPRS neighbor information
4
Not used
LZT 108 9851 R1B
197
TEMS Investigation 9.0 Data Collection User’s Manual
No.
Name
Contents
5
GSM Status
Channel lock status
6
PDP and MAC Data
General TBF and PDP context
information
7
Data Modes
GMM SNDCP information
8
LLC RLC Data
LLC and RLC information
9
Not used
10
C/I Average
C/I average
11
DSP Data
FER information
12
AMR Data
AMR information
13.5.4.
GAN Mode Selection Tab
This tab appears for GAN-capable phones. Here you can set the phone’s
GAN mode. At the outset no option is selected (TEMS Investigation does not
query the phone for its GAN mode setting, because there is no way to do so).
GSM Only
198
The phone always stays in GERAN mode and never
switches to GAN mode.
Chapter 13. Device Properties
GSM Preferred
The phone stays in GERAN mode as long as a
PLMN is available and allowable via GERAN (per
3GPP TS 23.122).
If the phone can no longer access a GERAN, it may
search for GAN coverage and if possible rove in to a
GAN, thus entering GAN mode.
While in GAN mode, if a PLMN becomes available
and allowable again via GERAN, or the phone leaves
GAN coverage, the phone will rove out or hand over
from GAN and switch back to GERAN mode.
GAN Only
The phone always stays in GAN mode and never
switches to GERAN mode.
GAN Preferred
Whenever the phone is in GERAN mode, if GAN
coverage becomes available, then (unless a PLMN
search is in progress) the phone will rove in or hand
over to GAN, which may result in switching to GAN
mode.
If the phone leaves GAN coverage, it will rove out
from GAN or hand over to GERAN (whichever is
applicable), which may result in switching to GERAN
mode.
Reference: UMA Architecture (Stage 2) R1.0.4 (2005-5-2), section 9.1.1.
13.5.5.
Trace Log Mask Tab
This tab shows further log banks (compare section 13.5.3), all of which are by
default selected.
LZT 108 9851 R1B
199
TEMS Investigation 9.0 Data Collection User’s Manual
Description of Log Banks
No.
Name
Contents
1
GSM System
Information
GSM system information
2
Control Blocks
GSM/GPRS Layer 1 sent/received
control blocks
3
GSM Cell Information
Channel Request
Packet Channel Request
EGPRS Packet Channel Request
GSM serving cell information
GSM neighbor information
GSM DSF value
GSM RLT counter value
GSM/GPRS transmit power level
GSM timing advance value
GSM measurement traces – serving
and neighbor
GSM channel configuration information
4
GPRS Parameters
GPRS & EGPRS timeslot configuration
GPRS & EGPRS coding scheme
GPRS & EGPRS data counters
5
13.6.
GPRS GMM, SM &
Context
GPRS context information
GPRS GMM/SM messages
Properties of Qualcomm Chipset Based
Devices
Control functionality for Qualcomm chipset based devices is chiefly limited to
enabling and disabling of logs. Other tabs that appear are described below.
200
Chapter 13. Device Properties
13.6.1.
Data Reduction Tab (CDMA)
For CDMA phones, a dialog tab named Data Reduction appears. The
purpose of these settings is to keep the logfile size down by sifting phone
reports that are sent very frequently and saving only a small fraction of these
reports. Only certain report types are subject to such filtering, but the
selection differs between the filtering modes (see below). One example of a
highly frequent report that will be filtered is the Searcher And Finger report,
which is sent several hundred times each second.
The data reduction settings are saved in the PC registry, not in the TEMS
Investigation workspace. When you click Send, the settings take effect for all
CDMA (cdma2000/EV-DO/cdmaOne) devices that are currently enabled in
TEMS Investigation.
Unfiltered
No data reduction; all phone reports are saved in the
logfile.
Normal
Data is reduced to an extent that should be suitable
for most purposes.
Benchmarking
mode
Data is reduced more harshly than in Normal mode
to enable logging with a larger number of phones
simultaneously.
13.6.2.
NV Item Read/Write Tab (UMTS)
This tab allows you to inspect and modify settings for Qualcomm chipset
based UMTS devices by reading and writing items over the Qualcomm NV
interface.
LZT 108 9851 R1B
201
TEMS Investigation 9.0 Data Collection User’s Manual
The Value input field under Write NV Item is limited to 4 bytes; this is however
sufficient to cover most of the basic NV items.
Specifics on the NV interface are vendor proprietary and must be obtained
from the vendor.
WARNING: It is possible to corrupt the phone’s calibration parameters or
otherwise damage the phone by writing the wrong value to
the wrong address. You are always prompted to confirm an
NV command before it is executed.
Before an NV write, a read is always performed at the same address. All
traffic over the NV interface is logged in internal protocol reports, so if you are
recording a logfile in TEMS Investigation it should be possible to recover the
previous value by studying these reports.
After an NV write the phone is always automatically reset, and consequently it
is disconnected in TEMS Investigation.
13.7.
Properties of GPS Units
You can inspect and change some properties of a GPS unit. What properties
are editable depends on what product you are using.
202
Chapter 14. Events
14.
Events
TEMS Investigation generates events to indicate noteworthy occurrences in
the cellular network. A number of events are predefined; in addition to these,
you can define events of your own.
14.1.
Presentation of Events
Events that occur are listed in the Events window. Regarding this window, see
Information Elements and Events, section 8.3.
Events can also be presented
•
as symbols on the map (see section 23.5.4, page 268)
•
as symbols and vertical lines in line charts (see section 21.4, page 235)
•
as audio signals (see section 14.7, page 208).
14.2.
Predefined and User-defined Events
Definitions of all predefined events are found in Information Elements and
Events, chapter 7.
User-defined events are specified by logical expressions, which trigger the
event when they evaluate to true. These expressions can contain
•
Layer 3 messages
•
other events
•
conditions involving information elements.
14.3.
•
Setting Up a User-defined Event
Open the Event Definition window.
Click Add.
LZT 108 9851 R1B
203
TEMS Investigation 9.0 Data Collection User’s Manual
Name
Enter a name for your user-defined event.
System
The choice in this combo box governs what will be
selectable when you click the Add element button.
Mobile
If you choose a specific external device in this combo
box, the event is triggered only when the event
expression is true for this particular MS. If you
choose “Any”, the event can be triggered by any
external device.
You build up the event expression by using the add buttons on the right. The
structure of the expression is displayed in the box beneath the Name field.
14.3.1.
•
204
Adding a Layer 3 Message to the Event
Expression
Click Add element and choose Layer 3 from the context menu. Choose
the desired message from the dialog that appears.
Chapter 14. Events
14.3.2.
•
Adding an Information Element Criterion to the
Event Expression
Click Add element and choose Information element from the context
menu.
Information
element
Choose an information element.
Argument
If the information element has an argument, specify it
here.
Value: Changed
Choose this to trigger the event whenever the value
of the selected information element changes.
Value: Threshold
Choose this to trigger the event when the selected
information element assumes, exceeds, or drops
below a certain value. Choose a threshold operator
(“=”, “>”, or “<”), and set the threshold value.
14.3.3.
Adding an Event to the Event Expression
•
In the Add User Defined Events dialog, click Add element and choose
Event from the context menu.
•
In the new dialog that appears, choose an event from the combo box.
LZT 108 9851 R1B
205
TEMS Investigation 9.0 Data Collection User’s Manual
14.3.4.
Adding an Operator/Delimiter to the Event
Expression
To build a composite logical expression, you will need logical operators and
possibly delimiters (brackets). Available operators are AND, OR, XOR, and
NOT.
•
In the Add User Defined Events dialog, click Add Operator and select an
operator or delimiter from the context menu.
Note: Events used in the expression for a user-defined event can be
combined with the OR operator only (not with AND, NOT, or
XOR).
Keep adding items to the event expression until it is complete. Then click OK
to exit the Add User Defined Events dialog. The new event is then added to
the list in the Event Definition window.
See section 14.6 below for an example of a logical expression.
Note: If a user-defined event is added or modified after a logfile is
loaded, the logfile must be reloaded for the events to become
visible.
14.4.
Editing User-defined Events
•
Select the event you want to edit in the Event Definition window.
•
Click Edit and make the desired changes.
14.5.
Deleting User-defined Events
•
Select the event you want to delete in the Event Definition window.
•
Click Delete.
14.6.
Example of Event Definition
This example is taken from GSM.
206
Chapter 14. Events
There are many possible causes of poor C/I values. Two common ones are
co-channel and adjacent channel interference. In certain circumstances,
however, the main problem is not interference from other callers, but the fact
that the signal is overwhelmed by assorted random disturbances – i.e. what is
usually called “noise”. This means thermal noise generated within the circuits
of the phone as well as external background noise from a plethora of sources,
including other man-made signals so faint that they merely add up to a quasirandom disturbance.
The following event gives a rough indication that the poor C/I is probably due
to a noise problem: the poor C/I coincides with a very low signal strength.
1. From the Configuration folder in the Navigator, open the Event
Definition window.
2.
Click Add.
3. Name the event “Noise Indication” (or whatever you like).
4. Click Add Element and choose “Information element” from the context
menu.
5. From the Add Information Element combo box, choose “C/I Worst”.
6. Choose “Threshold”, and choose “<” from the combo box.
7. Set Value to 10.
8. Click OK.
9. Click Add Operator and choose “AND”.
10. Click Add Element and choose “Information element”.
11. Under “Information element” choose “RxLev Sub (dBm)”.
12. Choose “Threshold” and choose “<” from the combo box.
13. Set Value to –99.
14. Click OK. The event expression should now look as follows:
C/I Worst < 10
AND
RxLev Sub (dBm) < –99
15. Click OK to finish.
LZT 108 9851 R1B
207
TEMS Investigation 9.0 Data Collection User’s Manual
The event is now added to the event list and can be used in the Map and in
the other presentation windows.
14.7.
Audio Indications for Events
For each event you can specify an audio signal to be played when the event
occurs. This is useful if you are performing a drive test on your own and need
to keep your eyes on the road.
To associate events with audio signals, you use the Audio Indications window
found in the Configuration folder in the Navigator.
14.7.1.
Adding Audio Indications
Click Add in the Audio Indications window.
Mobile
Choose an external device.
Event
Choose an event.
Sound
Enter the path to the WAV file you want to use, or
click Browse and select the file.
Use PC speaker
Check to use the internal speaker of your PC.
Test
Listen to the selected sound file.
208
Chapter 14. Events
•
Click Apply to add the current audio indication and keep the dialog open.
•
Click OK when you are done adding audio indications.
The events that are now associated with sounds are listed in the Audio
Indications window.
14.7.2.
•
Editing Audio Indications
Select the audio indication to be edited.
Click Edit and make the desired changes.
14.7.3.
Activating Audio Indications
Audio indications are by default active. They may however be deactivated
(see section 14.7.4 below). To activate a deactivated audio indication:
•
Select the audio indication.
Click Activate Sound.
14.7.4.
Deactivating Audio Indications
To deactivate an audio indication:
•
Select the audio indication.
Click Deactivate Sound.
14.7.5.
Muting All Audio Indications
To disable all audio indications, independently of their status (active or
deactivated):
LZT 108 9851 R1B
209
TEMS Investigation 9.0 Data Collection User’s Manual
Click Mute All.
From now on, no audio indications will be played until you decide to enable
them again. You might find this attractive when doing post-processing.
To re-enable all audio indications:
Click Undo Mute All.
The status of the audio indications will remain the same as before you clicked
Mute All: active audio indications will start playing again, and deactivated
ones will remain deactivated.
14.7.6.
•
Saving and Loading Audio Indications
Select the audio indication you want to save.
Click Save and enter a file name (extension .svt).
Click Open to load an *.svt file in the Audio Indications window.
14.7.7.
•
Deleting Audio Indications
Select the audio indication to be deleted.
Click Delete.
210
Chapter 15. Presentation: Basics
15.
Presentation: Basics
This chapter covers the fundamentals of data presentation.
15.1.
The Data: Information Elements and Events
The presentation windows are used to present information elements, events,
and messages, either in real time or during logfile replay. Real-time and
logfile data are presented in fundamentally the same way; differences are
noted whenever relevant in the chapters that follow.
For an overview of information element categories, see Information Elements
and Events, chapter 2. Full details on information elements follow in chapters
3, 4, and 5 of that volume.
Regarding predefined events, see Information Elements and Events,
chapter 7.
15.2.
Types of Presentation Window
The following presentation windows are available in TEMS Investigation Data
Collection:
•
status windows: chapter 16, page 214
•
Event Counter windows: chapter 17, page 220
•
message windows: chapter 18, page 222
•
the Video Monitor window: chapter 19, page 227
•
the GPS window: chapter 20, page 230
•
line charts: chapter 21, page 232
•
bar charts: chapter 22, page 240
•
Map windows: chapter 23, page 259.
LZT 108 9851 R1B
211
TEMS Investigation 9.0 Data Collection User’s Manual
15.3.
Window Updating and Synchronization
A fundamental distinction can be made between
•
“snapshot” windows, which show the situation at one instant in time and
are constantly refreshed in drive testing mode (status windows, bar
charts, GPS window, Video Monitor)
and
•
“history” windows, which accumulate information and display the whole
history of the testing session, or statistics on it (maps, line charts,
message windows, Event Counter windows).
All windows are synchronized. When you select a point in time in a history
window, other history windows highlight the same time instant, whereas the
snapshot windows are updated to show the data that was current at this time.
Note: The above applies without qualifications in replay mode. In drivetesting mode, however, things are somewhat different: it is still
possible to inspect previously recorded data, but in many window
types, as soon as a new message arrives from the phone, the
presentation automatically reverts to the present time.
The exactness of the synchronization is limited by the time resolutions of the
various presentations. For example, the line chart plots two points every
second. The map plots a maximum of two new theme markers every second.
Regarding synchronization between message windows and other windows,
see section 18.5.
15.4.
Color Ranges
In many types of presentation windows, it is possible to visualize numeric
information element values by means of a range of colors. These colors are
defined in the Navigator; see section 4.2, page 28, for details. You can always
turn off the color coding and use a fixed color for drawing.
In status windows, custom color ranges for information elements can be
defined, for use in that window only.
Whenever an information element is invalid, or has no color defined for its
current value, it is drawn in black in graphical presentations and left out in
textual presentations.
212
Chapter 15. Presentation: Basics
15.5.
Other Window Properties
The appearance of any presentation window can be changed by altering the
window properties, which are accessed by right-clicking in the window and
choosing Properties from the context menu.
15.6.
Export/Import of Presentation Windows
Status windows, line charts, maps, and message windows can be exported,
that is, saved along with all their current settings in a file separate from the
workspace. You can later import the window into the application again by
opening the file.
15.6.1.
Export
To export a presentation window, proceed as follows:
•
Select the window.
•
From the File menu, choose Export.
•
Type a file name and click Save. The extension is .stm, .lch, .map, or .mw,
depending on the window type.
15.6.2.
Import
To import a saved presentation window, proceed as follows:
•
Focus a presentation window of the same type as the one you want to
import. (Open a new window if necessary, and click it.)
•
From the File menu, choose Import.
•
Select the desired file and click Open.
LZT 108 9851 R1B
213
TEMS Investigation 9.0 Data Collection User’s Manual
16.
Status Windows
This chapter explains the workings of status windows.
16.1.
General
The status windows present information elements in tabular form.
A number of ready-made windows are provided for presenting particular
categories of information; these are listed in Information Elements and
Events, section 8.1. In addition, a blank template is available which you can
use to compose your own status windows.
To set up a status window, use the Setup Wizard (section 16.2). The Setup
Wizard is intended to be run only once. Later on, you can modify the window
using the Properties dialog, which is described in section 16.3.
16.2.
Setting Up Status Window Contents
The contents of a status window are conveniently set up using the Setup
Wizard.
Note: Setting the number of columns and rows in the status window
cannot be done with the Setup Wizard. Also, you cannot enter
text in the status window using this tool. For these purposes you
must use the Properties dialog. See section 16.3, page 217.
•
214
Right-click in the status window and choose Setup Wizard.
Chapter 16. Status Windows
Name
Name the new status window. Note that changing the
name later will create a new status window, and the
contents of the current window will be lost.
Font
Click Browse and select a font.
•
Click Next to proceed to Step 2.
•
To add an information element, click Add.
Mobile
Choose which device to pick the information element
from.
System
Choose an information element category. See
Information Elements and Events, chapter 2.
LZT 108 9851 R1B
215
TEMS Investigation 9.0 Data Collection User’s Manual
Information
element
Choose an information element.
Argument
Enter an argument for the information element (if it
needs one).
•
Select the View tab.
Value
Check to display values alphanumerically.
Left, Center, Right
Choose alignment for the displayed values.
Bar
Check to display numeric values as colored bars.
Constant length
Draw the bar with constant length. This is useful for
information elements that represent states, etc. and
can only assume a limited number of values.
Min/Max indicator
Keep track of the all-time-low and all-time-high
values by means of vertical lines.
•
216
Select the Color tab to customize colors and color ranges.
Chapter 16. Status Windows
Use common
color ranges
Check the box if you want to use the default color
range of the information element. If you want to
define a special color range here, uncheck the box
and specify the range (see section 4.2, page 28 for
details on how to do this).
Click Apply to add more information elements. Click OK when you are done
adding information elements. Then exit the Setup Wizard by clicking Finish.
16.3.
•
Changing Status Window Properties
Right-click in the status window and choose Properties from the context
menu.
The Mode tab governs the layout and appearance of the window:
LZT 108 9851 R1B
217
TEMS Investigation 9.0 Data Collection User’s Manual
Name
Enter a new name if desired.
Header
Check if you want a header in the window. (The
contents of the header are defined on the Cell
Content tab.)
Columns
Set the number of columns.
Rows
Set the number of rows.
Font
Click Browse and select a font.
Mobile
If you choose a device in this box, all the information
elements currently shown in the window will be taken
from that device, regardless of earlier settings. (To
pick individual information elements from a different
device, use the Cell Contents tab. See below.)
•
218
To edit the contents of the status window, select the Cell Contents tab.
Chapter 16. Status Windows
•
Double-click on a row and select an information element from the list.
Then click Edit.
The dialog that appears is identical with the Add dialog in the Setup Wizard
(see section 16.2 above), except that it has an extra field for entering text:
In a status window, you might want to show the same information element for
several devices. To do this, create new columns as needed on the Mode tab,
and modify headers and insert information elements on the Cell Contents tab.
LZT 108 9851 R1B
219
TEMS Investigation 9.0 Data Collection User’s Manual
17.
Event Counter Windows
An Event Counter window in Data Collection keeps track of the number of
times a set of events have occurred. What events to show is userconfigurable.
The Event Counter window has its counterpart in Route Analysis in the Data
Selector window, which is likewise used to display event statistics, though in a
somewhat different format. See the Route Analysis User’s Manual, sections
5.3.1 and 8.2–8.4.
17.1.
Window Tabs
Tabs are provided in this window to allow grouping of events into categories.
In the Event Counter window provided under Presentation → Analysis, a
number of tabs are preconfigured.
•
To add a new tab, right-click in the window and choose New Tab from the
context menu.
•
To rename a tab, right-click it to open its Properties dialog. See section
17.4 and 17.4.1.
•
To remove an existing tab, right-click in the window and choose Remove
Tab from the context menu.
17.2.
Copying Window Contents
You can copy the entire contents of a tab in an Event Counter window to the
Windows clipboard. This way it can be transferred to a spreadsheet
application or other suitable program.
•
Right-click the tab and choose Copy to Clipboard from the context menu.
•
Paste the copied selection into the desired application.
220
Chapter 17. Event Counter Windows
17.3.
Resetting Event Counter Windows
The counters in an Event Counter window can be reset by the user at any
time by right-clicking in the window and choosing Reset Event Counter
Windows. This resets all counters in all open Event Counter windows.
Counters are reset automatically, in both drive testing and replay mode,
•
when a new logfile is opened
•
when a logfile is closed.
In replay mode, a reset is also performed when the logfile is rewound.
17.4.
•
Changing Event Counter Window Contents
and Properties
Right-click in the Event Counter window and choose Properties from the
context menu.
17.4.1.
General Tab
On this tab you choose which devices to show events from. The event
counting in the window is done in a separate column for each selected
device. A “Total” column is also provided which adds up the number of events
from all selected devices.
The General tab also holds the window title, which is user-editable.
17.4.2.
Events Tab
Here you choose which event types to display on the currently active tab (the
tab from which you access the Properties dialog).
•
Using the arrow buttons, move the events you want to display to the
Selected Events list box.
LZT 108 9851 R1B
221
TEMS Investigation 9.0 Data Collection User’s Manual
18.
Message Windows
The message windows are used to list messages and reports received or
transmitted by external devices (Layer 2 and Layer 3 messages, mode
reports, and error reports). They are also used to present events generated
by TEMS Investigation Data Collection.
Preconfigured message windows are listed in Information Elements and
Events, section 8.3.
18.1.
•
Changing Message Window Contents and
Properties
To access the message window Properties dialog, right-click in the
window and choose Properties.
18.1.1.
General Tab
On this tab you choose which devices to show messages from. MS and DC
devices are distinguished.
The tab also holds the window title, which is user-editable.
18.1.2.
Messages Tab
Here you choose which message categories to display in the window. The
ready-made windows are preconfigured in this regard.
If at least one item in a category has been deselected, the checkbox next to
the category is shaded gray.
The item Mode Reports → Sony Ericsson → Legacy Reports contains mode
reports originating from certain older Sony Ericsson GSM phones that are no
longer offered for sale with TEMS Investigation.
222
Chapter 18. Message Windows
18.1.3.
Events Tab
Here you choose which events to display in the message window.
•
Using the arrow buttons, move the events you want to display to the
Selected Events list box.
Any type of event can always be shown, regardless of the nature of the
messages.
Note that if you add a user-defined event (section 14.3), you must select it on
this tab in order for it to display in the message window.
18.1.4.
Columns Tab
Here you decide which columns to include in the message window:
•
Equipment: The device that delivered the message.
•
Mobile System: The wireless technology from which the message
originates.
•
Event & Message Symbols: Event icon or arrow showing message
direction (both types of symbol being placed in the same column).
•
Event Symbols: Event icon.
•
Message Symbols: Arrow showing message direction.
•
Message Name: Name of message or event.
•
Message Info: Message or event information
•
Information Element: Value of a user-selected information element. To
select the element, first move “Information Element” to the Selected
Columns box, then select this item and click Edit. A new dialog now
appears where you select what information element to display.
•
Time: Timestamp of message.
•
Protocol: The protocol to which the message belongs.
18.2.
Plain-text Message Decoding
In all message windows, you can double-click a message to open a new
window detailing the contents of the message. You can copy text from this
window to the Windows clipboard by selecting the text, then right-clicking in
the window and choosing Copy from the context menu.
LZT 108 9851 R1B
223
TEMS Investigation 9.0 Data Collection User’s Manual
Each message window normally reuses a single detail window. For example,
if you double-click one Layer 3 message and then another, the second
message will replace the first in the Layer 3 detail window. To open a
message in a new window, right-click the message and choose New Detail
Window. The new window now becomes the active one. The old window will
remain open, but its contents will not change any further.
18.3.
Presentation of Discarded Messages
Layer 3 messages (from certain Sony Ericsson phones) that have been
discarded according to the settings on the phone property page (see section
13.2.1.3, page 182) are highlighted in red in the Layer 3 Messages window.
Further, an explanatory string is added to the plain-text decoding of such
messages.
18.4.
Message Window Catch-up
If you open a new message window when in replay mode, the new window
will catch up and load all data from the beginning of the logfile.
If you open a new message window when in drive testing mode, the new
window will not load any messages (for performance reasons). However,
when you have disconnected all external devices, you can make the window
catch up by right-clicking it and choosing Reload.
To abort the reload procedure, right-click again and choose Cancel Reload.
18.5.
Message Window Synchronization
When message windows synchronize with each other and with other
presentation windows, one or more rows are selected (colored) in each
message window. Suppose, for example, that you just clicked somewhere in
a line chart. The message windows are then updated according to the
following rules:
•
If one message window row matches the user-selected item better than
any other, that row alone will be selected. If several rows match equally
well (for example, a message and one or several events triggered by that
message), all these rows are selected.
•
If the user-selected item and the message window selection belong to the
same air interface message, the message window selection is colored
blue. If there is no such exact correspondence, the row or rows
224
Chapter 18. Message Windows
immediately preceding the user-selected item in time are selected and
colored gray. (If no such rows exist, nothing is selected in the window.)
18.6.
Freezing a Message Window
You can freeze a message window by clicking an arbitrary message. The
window will then stop updating, and its message flow is halted. The freeze
affects only the message window you clicked in, not any other windows.
This works in both drive testing mode and replay mode.
You can unfreeze the window in any of the following ways:
•
by dragging its scroll bar
•
by right-clicking the scroll bar and choosing “Bottom”
•
by pressing the End key on the keyboard.
In replay mode, if you have frozen a message window, stopped the replay,
and then resume replaying of the logfile, the message window “wakes up”
automatically.
18.7.
Window-specific Features
18.7.1.
IP Analysis Window
The protocol analysis function in the IP Analysis window is turned off by
default. To turn it on, do as follows:
•
From the Navigator, open the General window.
•
In the General window, double-click the item “Data”. A Properties dialog
appears with a tab named “IP Analysis”.
•
In the Packet Capture section, change the setting to On.
•
The Packet size parameter determines how many bytes of each message
will be presented. If you choose a fixed packet size, any further bytes in
the message will be truncated. If you choose “Full packet size”, all
messages are presented in full and the entire header is always decoded.
•
Click OK to exit the dialog.
LZT 108 9851 R1B
225
TEMS Investigation 9.0 Data Collection User’s Manual
18.7.2.
Mode Reports Window
In the General window, under WCDMA, you can adjust the updating
frequency (in the TEMS Investigation application) for List Search reports from
Qualcomm-based terminals.
226
Chapter 19. Video Streaming and the Video Monitor (UMTS)
19.
Video Streaming and the
Video Monitor (UMTS)
TEMS Investigation supports streaming of video recordings through UMTS
phones. The application is equipped with a built-in streaming video client
which has been designed to imitate as closely as possible the corresponding
client software found in phones.
The application supports both on-demand streaming, where a video clip of
known length is downloaded, and various forms of live streaming (such as
tapping into a live stream or repeating playlist delivered by a streaming
server), where the duration of the streaming session is specified by the user.
19.1.
How to Test Video Streaming
To test the video streaming service, you need a phone capable of handling
this service. All UMTS phones sold with TEMS Investigation 9.0 possess this
capability.
The mechanics of setting up and conducting a streaming session are handled
by the Video Streaming command in the Command Sequence tool: see
section 12.11.2.7, page 158.
Video clips suitable for testing are supplied on the installation CD in the
subdirectory Video Clips. A readme file in this directory explains the file name
syntax used and gives reference VSQI values obtained for these video clips
in clean conditions.
If you are using files of your own for testing streaming, the file names should
contain a numeric value followed by “kbps”. This value should indicate the bit
rate of the stream (video + audio), not counting overhead. If multiple numeric
values are given in the file name, the first is used. If the file name does not
contain a numeric value, the VSQI algorithm (see chapter 29, page 305) will
use a bit rate value received from the server, but the VSQI score will then be
less accurate.
LZT 108 9851 R1B
227
TEMS Investigation 9.0 Data Collection User’s Manual
19.2.
The Video Monitor
To display the streamed video clip, you use the Video Monitor:
Only one instance of the Video Monitor can be open, so only one video
stream can be replayed at a time. (On the other hand, it is perfectly possible
to do streaming with several phones simultaneously and monitor information
elements and events for all these sessions in other presentation windows.)
19.2.1.
Properties of the Video Monitor
Right-click in the Video Monitor to access its Properties dialog:
Device
Here you select the device that delivers the video
stream.
Enable audio
Check this box to play the streamed audio through
the PC speakers.
228
Chapter 19. Video Streaming and the Video Monitor (UMTS)
19.3.
Evaluating Video Streaming Performance
Throughput and other generic performance measures are recorded for video
streaming (as for other data services) in the information elements belonging
to the “Data” category: see Information Elements and Events, section 3.5.
This category also contains some elements which are specific to video
streaming:
•
Session Current Packet Loss (%). This is of interest primarily for
streaming, since this is the only supported service for which the received
signal is presented in real time in TEMS Investigation.
•
VSQI Realtime Score and VSQI Intermediate Score. VSQI (Video
Streaming Quality Index) is a quality measure developed by Ericsson
specifically for estimating the viewer-perceived video and audio quality of
a video streaming session. It is described in more detail in chapter 29,
page 305. VSQI is also the subject of a technical paper which includes
general discussions of video streaming as well as video quality
measurement. It is found on the installation CD in the subdirectory
Documents.
One streaming-related event, Streaming State Changed, is provided for
monitoring the doings of the streaming video client. See Information Elements
and Events, section 7.4.
19.4.
Troubleshooting Video Streaming
•
UDP ports for video streaming must be free. See the Getting Started
Manual, section 3.9.
•
Testing of video streaming with TEMS Investigation requires that RTP/
UDP traffic can be run with the phone used as modem. The function
cannot be used if RTP or UDP traffic to and from the Internet is blocked
(intentionally by the operator, or for whatever reason).
•
For close-up scrutiny and troubleshooting of the video streaming service,
you can monitor the message traffic over the RTP, RTSP, and RTCP
protocols in the IP Analysis window. See Information Elements and
Events, section 8.3.3.
LZT 108 9851 R1B
229
TEMS Investigation 9.0 Data Collection User’s Manual
20.
The GPS Window
This window shows information from the GPS unit. Exactly what information
is shown depends on the type of GPS; below is an example:
The fix source is one of the following:
•
2D
•
2D with DGPS (Differential GPS)
•
2D: SPS Mode (Standard Positioning Service)
•
2D: PPS Mode (Precise Positioning Service)
•
3D
•
3D with DGPS
•
3D: SPS Mode
•
3D: PPS Mode
•
DR (Dead Reckoning)
20.1.
Changing GPS Window Properties
The GPS window can be configured to show only the parameters that interest
you:
230
Chapter 20. The GPS Window
Units Tab
Speed
Choose km/h or mph.
Altitude
Choose meters or feet.
View Tab
Basic
Check to show the latitude, longitude, altitude and
speed of the GPS unit, the fix source, and the
number of satellites seen.
Heading
Check to show the direction of travel, graphically and
numerically, in degrees clockwise from north.
Show invalid
positions
Check to also plot samples whose position is labeled
as invalid by the GPS unit. a
a. This option exists to allow presentation of positions incorrectly regarded
by the GPS as invalid.
Time Tab
Offset to GMT
When a GPS unit is connected, the offset to GMT is
automatically entered to synchronize to the current
time zone. It is possible to change this offset if
necessary. Click the Set PC Clock button to set the
PC clock according to GPS time, plus/minus offset (if
any).
Datum Tab
On this tab you can convert GPS data to a different geodetic datum in the
presentation in case your map and your GPS use different datums.
Datum Before
Conversion
The datum used by the GPS. Most GPS units use
WGS 84 (including all those recommended for use
with TEMS Investigation; see the Getting Started
Manual, section 4.1.4). Normally, therefore, this
setting does not have to be changed.
Datum After
Conversion
The datum to convert to (the one used by the map).
First select the correct region, then the datum.
LZT 108 9851 R1B
231
TEMS Investigation 9.0 Data Collection User’s Manual
21.
Line Charts
In line charts you can plot numeric information elements in order to visualize
how their values evolve over time. Line charts can also present events.
Preconfigured line charts are listed in Information Elements and Events,
section 8.5.
21.1.
Organization of the Line Chart Window
Chart pane
Legend pane
Additional
Information
pane
Y-axis pane
The Line Chart is subdivided into the following panes:
•
one or several Chart panes, containing the charts themselves
•
a Y-axis pane for each chart, showing the scales for the plotted
information elements
232
Chapter 21. Line Charts
•
a Legend pane, describing the nature and origin of the information
elements shown, and indicating their values at a single point in time
•
an Additional Information pane, displaying arbitrary information
elements in textual format.
A maximum of four charts can be accommodated, along with their associated
Y-axis panes. The legend can only gloss one chart at a time.
The relative sizes of the panes can be freely adjusted by dragging the interior
frame handles.
21.2.
Contents of the Line Chart Panes
The Chart Pane
The information elements that can be plotted in a line chart are chiefly
measurements of physical quantities. Up to seven elements can be
accommodated in each chart. The plotting can be done either as a curve or in
the form of successive vertical bars.
Events are indicated by thin vertical lines accompanied by a symbol
identifying the event type. The symbols used for predefined events are given
in Information Elements and Events, chapter 7. To see the names of the
events, open an Events window.
The Chart pane is synchronized with the Legend and Additional Information
panes (as well as with all other open presentation windows, as explained in
section 15.3, page 212). Clicking somewhere in a replayed logfile segment in
the chart (after stopping the replay) displays details about the chosen instant
in the two text panes. You can also move backwards and forwards in a
replayed segment with the left and right arrow keys on your keyboard. In the
chart, a thick vertical line indicates the point in time currently selected in the
presentation.
You can freeze the line chart during recording or replay by clicking
the Hold button. Clicking the button again (now labeled Release) makes the
chart catch up with the presentation in the other windows.
Scrolling the chart by means of the scroll bar does not change the time instant
selected, so neither the text panes nor other presentation windows will be
updated. To select a new point in time, just click in the chart.
LZT 108 9851 R1B
233
TEMS Investigation 9.0 Data Collection User’s Manual
The Y-axis Pane
The Y-axis pane associated with a chart shows the scales of the information
elements plotted there. Each scale is drawn in the same color as the
information element, except when several elements share the same scale, in
which case the scale is black. If the pane is too narrow to show all scales at
once, you can scroll between scales using the arrow buttons.
The scales can be changed; see section 21.4.3, page 237 (“Upper visible
limit”, etc.).
The Legend Pane
In the legend full details are provided (for one chart at a time) on the
information elements plotted for the currently selected time instant. At the
extreme left in the legend, the color coding of the chart is explained.
Parameters (SC/BSIC, [U]ARFCN, PN) associated with elements are given in
columns of their own wherever possible.
To focus the legend on a different chart, right-click anywhere in the Line Chart
window and choose the desired “Legend Chart” item from the context menu.
The Additional Information Pane
This is a sort of status window where an arbitrary set of information elements
can be displayed (for example, elements which cannot be plotted). You can
choose different contents in this pane for different charts, as described in
section 21.4 under Additional Information Tab, page 239. However, as long
as contents have only been defined for one single chart, this data will be
shown in the pane regardless of which chart the legend currently refers to.
21.3.
Time Scale
The horizontal axis of the line chart does not have an exact time scale, and so
is not labeled with a unit of time. However, as a rule of thumb, two points are
plotted each second both in idle and dedicated mode.
(GSM:) If the phone spends some time in no service mode, there will be a
gap in the chart to show this, but the length of this gap might not be
equivalent to the period of time with no service.
234
Chapter 21. Line Charts
21.4.
Changing Line Chart Contents and
Properties
To edit the contents of the line chart and their presentation, right-click
anywhere in the Line Chart window and choose Properties.
21.4.1.
•
Adding Charts
To add a new chart in the Line Chart window, click Add Chart.
21.4.2.
Editing General Properties of a Chart
On the General tab of the Line Chart Properties dialog, you can edit the line
chart window name and deselect the horizontal grid lines which by default are
drawn in the background.
21.4.3.
Editing the Contents of a Chart
•
Select the chart you want to edit in the list box.
•
Click Edit Chart.
This dialog appears:
LZT 108 9851 R1B
235
TEMS Investigation 9.0 Data Collection User’s Manual
Information Elements Tab
Here you edit the set of information elements to plot and how to present them.
The information elements that can be plotted are chiefly those that represent
or are derived from measured physical quantities (e.g. signal strength). Flags,
frequency and channel numbers, scrambling code indices, timeslot
indicators, and the like cannot be plotted.
•
First select information element category in the System combo box. See
Information Elements and Events, chapter 2.
•
Using the arrow buttons, move the elements you want to present from the
“Available IEs” to the “Selected IEs” list box. A maximum of seven
elements can be presented. You can use Ctrl and Shift to select multiple
items in the boxes.
The first time you move an information element to “Selected IEs”, it will be
picked from the device the line chart is drawn for (see the title bar; for the Line
Chart template it is MS1). From elements with an argument the value with the
lowest argument is picked. If you move the same element to “Selected IEs”
again, one of two things will happen:
•
if the element has an argument, it is taken from the same device as
before, and the value with the next higher argument is shown;
•
otherwise, the element is taken from the next device.
Naturally, the MS and argument can also be edited directly at any time. This
is done by clicking the Edit IE button. In the ensuing dialog you also
customize the presentation of the information element:
236
Chapter 21. Line Charts
Mobile
The device to pick the information element from.
Note that it is possible to change the device for all
chosen elements at once. See section 21.4.4, page
239.
IE Argument
The argument (if any) of the information element.
Style: Bar
Choose this if you want the element to be plotted as
successive, tightly packed vertical bars.
Style: Line
Choose this if you want the element to be plotted as
a line. You can adjust the line width.
Color: Assigned
to channel
This option is available only for elements made up of
sorted channel lists (e.g. neighbors, scanned
channels). If it is chosen, the application
automatically assigns a color on the basis of what
channel is shown. The point of this is to ensure that
you can easily see when the sort order of the list (e.g.
the neighbor ranking) changes. As far as possible,
one and the same color is used throughout for a
given channel.
Color: Fixed
This option is available for all elements, and consists
simply in your selecting one fixed color yourself.
LZT 108 9851 R1B
237
TEMS Investigation 9.0 Data Collection User’s Manual
Upper visible limit
for IE
Upper limit of the value range shown for this
information element. That is, this setting adjusts the
range in the Y-axis pane. For complex information
elements, the limit is automatically changed for all
other arguments as well.
Lower visible limit
for IE
Lower limit of the value range shown for this
information element. This setting works the same
way as “Upper visible limit...”, above.
Draw threshold
line at
Check this if you want to compare the plotted values
with a threshold line drawn at a specified value.
Change color in
dedicated mode
If you check this box, the plot color turns deeper
when the phone enters dedicated mode, and the
brighter color chosen in the Color box is reserved for
idle mode. (The dedicated mode color is not usercustomizable.)
Events Tab
Here you decide which events should appear in the line chart presentation.
•
Using the arrow buttons, move the event you want to present to the
“Selected events” list box.
The first time you move an element to “Selected events”, it will be picked from
the device the line chart is drawn for (see the title bar). If you move the same
element to “Selected events” again, it is taken from the next device.
Clicking the Edit Event button pops up the following dialog:
Mobile
The device to pick the event from.
Symbol
The image file used to label the vertical line
indicating the event.
238
Chapter 21. Line Charts
Additional Information Tab
Here you choose the information elements to view in the Additional
Information pane. This tab works exactly like the Information Elements tab,
except that here any information element can be selected.
Clicking the Edit IE button in this case naturally only enables you to change
the device and argument, since the additional information is presented only
as text and not graphically.
21.4.4.
Presenting Data from a Different Device
If you want to present the same data as before in a chart but from a different
device, it is impractical to edit the MS field for each information element
separately as described in section 21.4.3. A shortcut is therefore provided for
this operation.
•
Right-click in the Line Chart window. From the context menu, choose
Change MS:
•
For each chart, select the device to pick data from. (The information
elements and events selected in the charts will be unchanged.)
21.4.5.
•
Deleting a Chart
In the Line Chart Properties dialog, select the chart you want to delete
and click the Delete Chart button.
21.5.
Exporting the Line Chart Window
The line chart window can be exported separately to a file with extension .lch.
See section 15.6, page 213.
LZT 108 9851 R1B
239
TEMS Investigation 9.0 Data Collection User’s Manual
22.
Bar Charts
Bar charts are used to view successive snapshots in time of a selected set of
information elements. The bar chart is especially suited to the presentation of
frequency scans, but the chart itself is generic and can present any
measurement data.
The bar chart has a number of presentation modes. One of these is a parallel
coordinates presentation, which is strictly speaking a different means of
visualization but is integrated into the bar chart window.
Preconfigured bar charts are listed in Information Elements and Events,
section 8.6.
240
Chapter 22. Bar Charts
22.1.
Organization of the Bar Chart Window
Chart pane
Chart pane
X-axis pane
Legend pane
Additional
Information
pane
Y-axis pane
The bar chart is subdivided into the following panes:
•
one or several Chart panes, containing the charts themselves
•
a X-axis pane, displaying indices for the bars drawn
•
a Y-axis pane for each chart, showing the scales for the displayed
information elements
•
a Legend pane, describing the nature and origin of the information
elements shown, and indicating their current values
•
an Additional Information pane, displaying arbitrary information
elements in textual format.
A maximum of four charts can be accommodated, along with their associated
Y-axis panes. The legend can only gloss one chart at a time.
The relative sizes of the panes can be freely adjusted by dragging the interior
frame handles.
LZT 108 9851 R1B
241
TEMS Investigation 9.0 Data Collection User’s Manual
22.2.
Contents of the Bar Chart Panes
The Chart Pane
The information elements that can be plotted in a bar chart are chiefly
measurements of physical quantities.
The Chart pane is synchronized with the Legend and Additional Information
panes, as well as with all other open presentation windows, as explained in
section 15.3, page 212.
Clicking a bar displays max and min indicators, which will from then on keep
track of the maximum and minimum values assumed by this parameter since
the bar was clicked. To reset the max and min indicators, just click once more
on the bar.
The X-axis Pane
The X-axis pane provides labels for the data distributed on the x-axis (for one
chart at a time). By default the labels are simply consecutive numbers, but
they can also show the value of an information element or consist of arbitrary
text. See section 22.4.2.
The Y-axis Pane
Along the y-axis of a chart are shown the scales of the information elements
plotted there. Each scale is drawn in the same color as the information
element, except when several elements share the same scale, in which case
the scale is black. If the pane is too narrow to show all scales at once, you
can scroll between scales using the arrow buttons.
The value range visible on the y-axis can be changed; see, for instance,
section 22.4.1.1 (“Visible limit for IE”).
The Legend Pane
In the legend full details are provided (for one chart at a time) on the
information elements displayed in that chart. At the extreme left in the legend,
the color coding of the chart is explained. The (U)ARFCN and SC/BSIC are
left out if they are not directly relevant to an element (e.g. one indicating
transmit power).
To refocus the legend on a different chart, just click in that chart.
242
Chapter 22. Bar Charts
The Additional Information Pane
This is a sort of status window where an arbitrary set of information elements
can be displayed (for example, elements which cannot be drawn in a bar
chart). You can choose different contents in this pane for different charts, as
described in section 22.4.3.
22.3.
Setting Up General Bar Chart Properties
To set up some general properties of the bar chart and its presentation, rightclick anywhere in the bar chart window and choose Properties.
22.3.1.
Adding Charts
To add a new chart in the bar chart window:
•
Click Add.
22.3.2.
Deleting a Chart
To delete a chart:
•
In the Bar Chart Properties dialog, select the chart you want to delete and
click the Delete button.
LZT 108 9851 R1B
243
TEMS Investigation 9.0 Data Collection User’s Manual
22.3.3.
Editing General Properties of a Chart
On the General tab of the Bar Chart Properties dialog, you can edit the bar
chart window name and specify that horizontal grid lines should be drawn in
the background.
22.4.
Setting Up Bar Chart Contents
•
In the Bar Chart Properties dialog, select the chart you want to set up in
the list box.
•
Click Edit.
You will now work through a sequence of three dialogs. In doing so you
specify
1. what data to plot in the chart, and how to present it
2. what interval to show on the x-axis, and how to label it
3. what data to display in the Additional Information pane.
The procedures are gone through in detail in sections 22.4.1–22.4.3.
Examples of bar chart presentations are found in section 22.5.
The first dialog that appears is this:
244
Chapter 22. Bar Charts
22.4.1.
Presentation Mode, Data, Colors
In this step you select the following (full details on subsequent pages):
•
Presentation mode. The bar chart is very flexible in that it can be
configured in a variety of ways. These fundamental presentation modes
are offered:
–
Bar chart: Single IE with multiple components
–
Bar chart: Components from multiple IEs (fixed set)
–
Parallel coordinates presentation/Stacked bar chart
•
Data: One or several information elements, or a set of components of
complex information elements, are chosen. The information elements that
can be displayed are chiefly those that represent or are derived from
measured physical quantities (e.g. signal strength, C/A, SQI, TA). Flags,
(U)ARFCN numbers, timeslot indicators, and the like cannot be displayed.
•
Colors: You can always keep the default color range for the information
elements. Besides, there is one other option: either to define your own
colors for use in the bar chart, or to use predefined, fixed, window-specific
colors. (Which choice is available depends on the presentation mode.)
The default color range is defined in the Navigator and is dependent on
the information element value (see section 4.2, page 28).
LZT 108 9851 R1B
245
TEMS Investigation 9.0 Data Collection User’s Manual
22.4.1.1. Single IE Presentation Mode
In this mode a single information element is displayed. The element must be
one with arguments, i.e. one which consists of several components.
It is possible to dynamically adjust the number of components to show, by
making it dependent on another (suitably chosen) information element: see
section 22.4.2.
•
In the Edit Chart dialog, select “Bar chart: Single IE with multiple
components”.
•
Click “Choose IE” to select an information element:
The
item contained in each element indicates what the visible range of the
element will be in the bar chart, and whether the scale will be flipped with the
lowest value at the top. If you want to change these settings:
•
Double-click the
Visible limit for IE:
Min, Max
246
item (or click the Edit button):
The visible range of the information element. By
default this range is equal to the native range of the
element (as stated in the Range/Unit column in
Information Elements and Events).
Chapter 22. Bar Charts
MS
The device from which to pick the information
element.
Flip scale
Check this if you want to flip the y-axis for this
information element so that the lowest value is at the
top and the highest at the bottom.
•
Make your changes, then click OK.
•
Click OK in the Add Information Element dialog.
•
Back in the Edit Chart dialog, decide what colors should be used in the
chart. You have two options:
•
–
Keep the default color range for the information element. To this end
check the Use common colors box.
–
Define one fixed color to be used throughout in this chart, disregarding
the default color range. To do this, uncheck Use common colors and
select a color in the box next to the information element.
Now click Next to proceed to the next step.
For an example of a Single IE presentation, see section 22.5.
22.4.1.2. Multiple IE Components Presentation Mode
This mode displays an arbitrary fixed set of information element components.
To set up this presentation, proceed as follows:
•
First decide whether you want to use the default color ranges of the
information elements or define a fixed color for each element. To keep the
default colors, check the Use common colors box in the Edit Chart dialog.
Otherwise, uncheck it. You will then be prompted to define colors later on.
•
Select “Bar chart: Multiple IE components (fixed set)”.
•
Click “Choose IEs” to select your data. This dialog appears:
LZT 108 9851 R1B
247
TEMS Investigation 9.0 Data Collection User’s Manual
Here, a varying number of information elements may already be listed,
depending on the type of bar chart concerned (template or predefined, etc.).
For each index you select one piece of data: an information element with no
arguments, or one component of an element having arguments.
If you have checked Use common colors, the Color column will be absent
from this dialog.
•
To specify the data that should be represented by a bar (i.e. an index on
button in the IE column, in the relevant table row.
the x-axis), click the
To add a new bar, click the Add button. A new row will then be inserted at
the bottom of the table once the contents of the bar have been specified.
In either case, the Add Information Element dialog appears:
•
248
Select an information element.
Chapter 22. Bar Charts
•
Double-click the
item (or click the Edit button):
•
Specify range and scale properties, as described for the Single IE
presentation mode (see page 246).
•
If the information element is one with arguments, pick an argument.
•
Click OK to exit the Edit IE dialog.
•
Click OK in the Add Information Element dialog.
•
If you have unchecked Use common colors, you are now prompted to
define a color for this data item. The standard Windows color dialog
appears. Pick a color and click OK.
To the IE for Fixed Layout dialog is now added the data item and color
defined for the selected index. The table will look something like this:
•
To remove items from the bar chart, select the corresponding rows in the
table, and click Remove. You can select all rows with Ctrl + A. The indices
of the removed rows disappear from the table, but when you exit the
dialog all items will be renumbered starting at 1.
•
When you are done specifying the bar chart contents, click OK to return to
the Edit Chart dialog.
•
Click Next to proceed to the next step.
For an example of a Multiple IE Components presentation, see section 22.5.
LZT 108 9851 R1B
249
TEMS Investigation 9.0 Data Collection User’s Manual
22.4.1.3. Parallel Coordinates/Stacked Bar Chart Presentation
Mode
This presentation mode is the most complex one. It has the following
fundamental properties:
•
A set of information elements is shown.
•
Each information element may have arguments, and an arbitrary number
of components of each element may be shown at the same time. The
information elements are distributed on the x-axis, and arguments are
displayed in the y-direction.
•
There are two graphical representations of the above (conceptually quite
distinct): a stacked bar chart and a parallel coordinates presentation.
In the stacked bar chart, one composite bar is drawn for each information
element, all its components being stacked on top of each other:
arg 2
arg 1
arg 0
IEs
Optionally, this arrangement may be reversed (one bar for each argument,
information elements stacked).
The parallel coordinates presentation does not use bars and is thus not a bar
chart in the literal sense. Rather, it plots all components of each information
element on the y-axis, at a fixed x-axis coordinate, and connects with a line
each set of components that have the same argument:
arg 0
arg 1
arg 2
IEs
250
Chapter 22. Bar Charts
The parallel coordinates presentation is selected by default in this mode.
Setting Up Basic Properties of the Presentation
To set up this presentation, proceed as follows:
•
Select “Parallel coordinates (default) / Stacked bar chart”.
If you want a parallel coordinates presentation, make these settings:
Do not uncheck “IEs on x-axis, arguments stacked”; such a presentation is
possible but hardly has any natural interpretation within the TEMS
Investigation framework.
If you want a stacked bar chart instead, check the Stacked bar chart box:
•
Uncheck “IEs on x-axis, arguments stacked” if you want to reverse the
roles of the axes so that arguments, rather than information elements, are
distributed on the x-axis.
Selecting Data
After deciding the basic properties of the presentation:
•
Click “Choose IEs” to select your data. This dialog appears:
Here, a varying number of information elements may already be listed,
depending on the type of bar chart concerned (template or predefined, etc.).
LZT 108 9851 R1B
251
TEMS Investigation 9.0 Data Collection User’s Manual
•
To specify the details of how an information element should be presented,
button. To add a new information element, click
click the corresponding
Add. A new row will then be inserted at the bottom of the table once the
details have been specified.
In either case, the Add Information Element dialog appears.
•
Select an information element.
•
Double-click the
•
Specify range and scale properties, as described for the Single IE
presentation mode (see page 246).
item (or click the Edit button):
Note: The y-axis scales look the same also for stacked bar charts,
despite the fact that the bar segments (except the bottom one)
will be displaced in relation to the scale bar.
•
Click OK to exit the Edit IE dialog.
•
Click OK in the Add Information Element dialog.
252
Chapter 22. Bar Charts
To the “IEs for Par. Coord. ...” dialog is now added the data item defined for
the selected index. For example:
•
To remove information elements from the bar chart, select the
corresponding rows in the table and click Remove. You can select all rows
with Ctrl + A. The indices of the removed rows disappear from the table,
but when you exit the dialog all items will be renumbered starting at 1.
•
When you are done specifying the bar chart contents, click OK to return to
the Edit Chart dialog.
Finally, you need to decide what colors should be used in the chart. You have
two options:
•
Keep the default color ranges for the information elements. To this end
check the Use common colors box.
•
Use fixed colors, one for each argument. The colors are chosen by the
application and cannot be edited. Choose this option by unchecking Use
common colors.
When you are done:
•
Click Next to proceed to the next step.
For an example of a Parallel Coordinates/Stacked Bar Chart presentation,
see section 22.5.
LZT 108 9851 R1B
253
TEMS Investigation 9.0 Data Collection User’s Manual
22.4.2.
Interval and Labeling
In this step you take care of the following:
•
Indicating the interval to show on the x-axis. Note that this is done
independently of the data selected in the preceding step.
•
(Optional) Specifying text labels on the x-axis instead of the default
numeric indices.
Interval
The interval selected here governs what portion of the x-axis will be visible in
the bar chart.
•
Choose Fixed to set an unchanging interval. The default values in the
boxes are dependent on the data selected in the previous step, so that
accepting the defaults will cause all data to be shown.
•
Choose Set by IE to have the interval dynamically governed by an
information element. This element must denote the current number of
something in order to make sense, and only such elements are
selectable. Example: If you want to display scan data, e.g. Scanned
RxLev, it may be a good idea to have the interval governed by Scanned
Channels No Of. Then the number of indices on the axis will always be
254
Chapter 22. Bar Charts
equal to the number of channels currently scanned, and the space
available in the chart will be fully utilized at all times, the bar width being
adapted continuously.
Note: The Set by IE option is disabled for the Multiple IE Components
presentation, since this by itself stipulates a fixed number of xaxis indices.
Labeling
By default the x-axis is labeled simply with numbers, either those given under
Fixed or the arguments of the information element chosen under Set by IE.
Alternatively, you can replace the numbering with text labels.
•
To enable user-defined text labels, check “Text labels on axis...”.
There are two options:
•
Select “Text strings from IE” to pick labels from a text-format information
element. Example: If you want to display data on neighbors, you might
want to label the x-axis with the neighbor cell names, found in the
information element Neighbor Cell Name.
•
Select “User-defined text labels” to specify arbitrary text as labels. Click
the Compose button. A dialog appears where you enter a string for each
index.
22.4.3.
Additional Information
Here you choose the information elements to view in the Additional
Information pane. This dialog works like the Information Elements tab in the
line chart properties (see page 236), but since the additional information is
presented only as text and not graphically,
•
any information element can be selected
•
clicking the Edit IE button only enables you to change the device and
argument.
22.4.4.
Presenting Data from a Different Device
If you want to present the same data as before in a chart but from a different
device, it is impractical to edit the MS field for each information element
LZT 108 9851 R1B
255
TEMS Investigation 9.0 Data Collection User’s Manual
separately as described in section 22.4.1.1, page 246. Therefore, there is a
shortcut for this operation.
•
Right-click in the bar chart window. From the context menu, choose
Change MS:
•
For each chart, select the device to pick data from. (The information
elements selected in the charts will be unchanged.)
22.5.
Examples of Bar Chart Presentations
Here are a couple of examples of how the presentation modes can be used.
Single IE
Single IE presentation: Neighbor RxLev (Sorted).
256
Chapter 22. Bar Charts
Multiple IE Components
Multiple IE Components presentation displaying an assortment of single-value IEs and
selected components of multivalue IEs, and with user-defined text labels added on the
x-axis. Note that only half of the legend is visible in the picture.
LZT 108 9851 R1B
257
TEMS Investigation 9.0 Data Collection User’s Manual
Stacked Bar Chart, Parallel Coordinates
Parallel coordinates presentation (the predefined Radio Parameters Parallel Bar Chart
for WCDMA). Each point on the horizontal axis represents a network parameter, and
the colored line, connecting a set of parameter values, represents a moment in time.
This arrangement allows the user to spot instantaneously any pattern that is out of the
ordinary (that is, any unexpected line shape).
22.6.
Exporting the Bar Chart Window
The bar chart window can be exported separately to a file with extension
.bch. See section 15.6, page 213.
258
Chapter 23. Map Windows
23.
Map Windows
Map windows are used to display a map of your testing area and present your
drive test route graphically on this map. Data on cells, events, and information
elements are shown along the route in symbolic form; numeric values can
also be easily accessed. Like the other presentation windows, Map windows
are fully user-configurable.
Map files used in TEMS Investigation Data Collection must be in MapInfo,
bitmap, or uncompressed TIF format. Note also that to be able to plot
measurements on a map, TEMS Investigation must have access to
positioning data.
A map of the world is provided with the installation.
23.1.
Highlights of This Chapter
This chapter contains a great deal of information, and you might not need all
of it. The following sections, however, are central:
•
First, to be able to use a map file in TEMS Investigation, you must work
through some preliminaries which are described in sections 23.3–23.4.
•
Then you can proceed to set up what data you want to present on the
map. How to do this is explained in section 23.5, page 263. If you have
loaded a cell file and want to view cell information, turn to section 23.5.5,
page 269.
23.2.
Map Concepts
In this section, some central concepts relating to Map windows are defined.
You might want to skim this section the first time around to make yourself
familiar with the concepts. The concepts are explained again as they are
brought up later in the chapter; use this section as a reference.
LZT 108 9851 R1B
259
TEMS Investigation 9.0 Data Collection User’s Manual
Map
A map is a set of geographical features which are treated as a unit. A map
usually consists of several map layers (see Layer) and is presented in a Map
window.
TEMS Investigation supports the following map formats: MapInfo, bitmap,
and TIF (uncompressed only).
Layer
A layer is a set of data from a particular category which is displayed in a Map
window. There are two types of layer: map layers, which make up the map
itself, and presentation layers, which contain information relating to the
cellular network.
A map layer may, for example, consist of all the roads or all the water areas
on the map.
A presentation layer contains one or several themes, all of the same main
type (see Theme below). One presentation layer is predefined for each main
type of theme; a further layer is provided for pinpoint markers. Additional
layers can be defined by the user.
Theme
A theme is a component of a presentation layer, displaying, for example, an
information element or a type of event.
Label
A label is a text string that belongs to a map and can be displayed on it.
GeoSet
A GeoSet (file extension .gst) is a special type of workspace used for map
layers. A GeoSet contains settings regarding layer order, projections, zoom
levels, labels, colors, etc.
23.3.
Constructing a GeoSet from Map Files
A Map window in TEMS Investigation works with a GeoSet instead of an
ordinary workspace. If you have a new map that you want to use in TEMS
Investigation, you should construct a GeoSet file for it to be able to save
changes to the map later on. This file can then be opened in a Map window.
260
Chapter 23. Map Windows
If your map is in MapInfo format, it consists of a number of map layers and a
workspace which ties them together. Each layer is stored in five different files
with the extensions .dat, .id, .ind, .map, and .tab. These files are from now on
collectively referred to as TAB files.
If your map is in bitmap format (extension .bmp), you must generate TAB files
for it. This is done by positioning the map as described in section 23.4. If
possible, avoid using 24-bit bitmap images as maps.
Once you have your TAB files, you can construct a GeoSet.
•
Copy the map’s TAB files to your map directory.
On the Map window toolbar, click the Start GeoSet Manager button.
Note: The GeoSet Manager will ask you to open a GeoSet. Click
Cancel to ignore this.
•
Name your new GeoSet in the edit box of the toolbar.
Click Layer Control.
•
Click Add.
•
Select the TAB files you copied to your map directory and click Open. All
the selected layers are added to the Layer Control.
•
Click OK. The map is now displayed with all its layers.
•
Choose File → Save GeoSet. You are prompted to name the GeoSet.
•
Click Save. This will save your new GeoSet file under the name you
entered in the “GeoSet Name:” edit box. The GeoSet file must be in the
same directory as the TAB files.
•
Choose File → Exit to close the GeoSet Manager.
Click Open Map Files.
•
Select your newly created GeoSet file and click Open.
The map should now be displayed in the Map window. You are ready to start
presenting data: see section 23.5.
LZT 108 9851 R1B
261
TEMS Investigation 9.0 Data Collection User’s Manual
Note: It is possible to load TAB files in a Map window directly, without
constructing a GeoSet, but then any changes made using the
Layer Control will be lost. See section 23.7.2, page 284.
23.4.
Positioning Bitmap and TIF Maps
If you open a map in bitmap or uncompressed TIF format that has not yet
been assigned geographical coordinates and scale information, you must
supply this data yourself.
Click Position Map.
23.4.1.
Specifying the Map Position
In this step you input the coordinates of a point on the map.
•
In the Reference Point section, in the Latitude and Longitude fields, enter
the coordinates (in decimal degrees) of the point you wish to use.
•
Click the Pick button in the Reference Point section.
•
On the map, click the point that has the given coordinates.
262
Chapter 23. Map Windows
23.4.2.
Specifying the Map Scale
In this step you indicate the distance between some two points on the map,
so that the map scale can be calculated.
•
In the Distance section, click the Pick button.
•
On the map, click the first point and keep the mouse button down. When
you move the mouse, a dashed blue line appears. Release the mouse
button at the second point. The coordinates of the chosen points appear
in the “X Y” fields.
•
In the Distance field, enter the actual distance between the two points.
23.4.3.
Setting the Map’s North Direction
What remains is to indicate the north direction of the map.
•
In the Direction section, in the North Offset Angle field, enter the offset
between the map’s x-axis and its direction of north. For example, if the
map is oriented with north pointing up, enter 90°. The offset lies between
–180° and +180°, a positive number indicating a clockwise offset.
•
Click OK.
Your map is now positioned. A file with the same name as the image but with
the extension .tab is created. The *.tab file is the map file you will use from
now on.
23.5.
Presenting Data: Themes
This section describes how to present cellular network data on the map.
In short, in order to present data, you use presentation layers and fill these
with themes. A set of presentation layers is already supplied in the
application. Therefore, to get started with presenting data, you do not need to
worry about handling presentation layers; all your work is to do with themes
and is covered in the present section. However, you can also modify
presentation layers and create new ones. How to do this is described in
section 23.7, page 283.
LZT 108 9851 R1B
263
TEMS Investigation 9.0 Data Collection User’s Manual
23.5.1.
Themes and Theme Types
A theme is basically a bundle of settings describing how to present a set of
data. These are the main types of theme, each presenting a different kind of
data:
•
information element (IE) themes, presenting a set of information elements
(at most three); see section 23.5.3, page 265
•
event themes, presenting an event; see section 23.5.4, page 268
•
cell themes, presenting cell information; see section 23.5.5, page 269.
There are several subtypes of cell theme.
•
the Pinpoint theme, presenting pinpointing information; see section
23.5.6, page 279.
23.5.2.
Presentation Layers
When you create a theme, you always put it in a presentation layer.
Click Add/Edit Themes to view the current presentation layers and the
themes within them. Certain presentation layers are predefined, along
with a number of themes, as is seen in this screenshot (where some
layers have been expanded).
The various types of theme are put in different layers:
•
IE themes in the Coverage, RF Quality, and AMR layers
•
event themes in “Event Layer”
264
Chapter 23. Map Windows
•
cell themes in “Cell Layer”
•
the pinpoint theme in “Pinpoint Layer”.
You can add new presentation layers if desired. How to manipulate layers is
the subject of section 23.7.
23.5.3.
Presenting Information Elements
To present information elements, you create information element themes
(hereafter called IE themes). These govern the appearance of a marker that
is plotted on the map. By varying its color, size, and shape, the marker can
code the values of up to three numeric information elements. For example,
you can have the marker color governed by RxLev and the marker size by
RxQual, and use different symbols when the phone is in idle mode, dedicated
mode, and so on:
More generally, it is appropriate to use the color and size attributes for
information elements with a continuous value range, and to use a suite of
symbols for such things as status parameters having a small set of possible
values.
The colors, sizes, and symbols used in the map are always the default ones
for each information element, as set on the Info Element tab of the Navigator:
see section 4.2, page 28. It is not possible to define these attributes
differently in the map.
To create a new IE theme:
•
In the Theme Settings dialog, select one of the layers (or create a new
layer to put the theme in: see section 23.7).
•
Click Add Theme:
LZT 108 9851 R1B
265
TEMS Investigation 9.0 Data Collection User’s Manual
System
Choose an information element category. See
Information Elements and Events, chapter 2.
Mobile
Choose the device from which to pick the information
element.
Offset (pixels)
This setting decides how far from its true position on
the map the theme marker will be drawn. The offset
direction is at right angles to the direction of travel; a
positive offset is to the right relative to the direction of
travel. Using offsets enables you to display several
routes side by side.
Color
In this section you specify a rule for the theme
marker color:
Size
266
•
Choose Range to have the color governed by an
information element. Select an element, and
select an argument if applicable.
•
Choose Fixed to use a fixed color. This means, of
course, that the color will not carry any
information.
In this section you specify a rule for the theme
marker size, in the same way as for the color. See
above.
Chapter 23. Map Windows
Symbol
In this section you specify a rule for choosing the
shape of the theme marker, in the same way as for
the color. If you choose Fixed, pick a font in the first
combo box, then pick a symbol in the second.
The Fixed options are useful if you want to use an IE theme just for plotting
the route, and not for showing measurement data. Uniform markers, for
instance circles, will then be plotted along the route at the shortest possible
time intervals (about factors influencing this updating rate, see section
23.5.3.1 below). Note that some information elements are not updated this
often.
Once the IE theme has been defined, it appears in the box in the Theme
Settings dialog under the layer it belongs to.
23.5.3.1. Notes on Route Plotting and Updating
The updating frequency for IE themes is governed by a number of factors. A
general rule is that new theme markers are drawn at most twice a second.
Another basic fact to keep in mind is that the position of a theme marker does
not necessarily correspond exactly to a pair of GPS or pinpointing
coordinates.
Here is a summary of the factors that affect theme plotting and updating:
•
Interpolation. Map positions, whether delivered by a GPS or pinpointed,
are constantly interpolated (linearly) to enable plotting at half-second
intervals. However, whether markers are actually plotted at this rate
depends on other circumstances. See below.
•
Arrival of new measurement data. A new theme marker is plotted only if a
message with fresh data has been delivered by the measurement device.
Updates will thus be less frequent in idle mode than in dedicated mode.
Note also that certain information elements are not updated regularly at all
but only on special occasions (for example, when the phone switches to a
different RAB).
•
Loss of positioning data. If GPS data is lost for an extended period of time
(for instance while driving through a tunnel) but GPS coverage is
eventually regained, positions will still be interpolated and plotted
throughout the gap. On the other hand, if no more positioning data is
obtained, interpolation is of course impossible, and no extrapolation of the
route is attempted by TEMS Investigation.
LZT 108 9851 R1B
267
TEMS Investigation 9.0 Data Collection User’s Manual
•
Map zoom. The plotting density on the map is dependent on the current
zoom of the Map window. When you zoom in, more markers are filled in to
show the route in more detail; when you zoom out, markers are drawn
more sparsely. Specifically, a new theme object (whether a symbol or a
line) is drawn next to the latest one if the centers of the two objects will be
more than 5 pixels apart on the screen.
23.5.4.
Presenting Events
To present an event, you create an event theme.
Note: If you create a new event theme for a user-defined event after
loading a logfile, you must reload the logfile to make this event
theme visible.
•
In the Theme Settings dialog, select the layer named Event Layer.
•
Click Add Theme:
Event
268
Choose an event type.
Chapter 23. Map Windows
Mobile
Choose the device from which to pick this type of
event.
Offset (pixels)
Set the offset. It has the same meaning as for
information elements; see section 23.5.3.
For events it is appropriate to use a non-zero offset
(for instance 20 pixels) so that event theme symbols
are not hidden by the IE theme markers plotted on
the route.
Bitmap
Select this to use a bitmap as event symbol. Select a
bitmap and set its size.
Transparent
Check if you want to use a transparent symbol:
•
If Transparent is checked, all white pixels in the
bitmap become transparent, i.e. the underlying
layer shines through.
Note that this requires a bitmap with a white
background; otherwise no transparency is achieved.
•
Font
If Transparent is not checked, the bitmap is
drawn exactly as-is.
Select this to pick an event symbol from a font.
Select the font, then pick a symbol and set its size
and color.
23.5.5.
Presenting Cell Information1
To present cell information, you create cell themes. The themes can be
defined at any time; you do not have to load a cell file first. (In fact, a couple of
cell themes are predefined, as is evident from section 23.5.2.)
Cell information for different technologies can be kept apart in the
presentation, with a separate theme for each. It is also possible to draw cell
information for multiple technologies in the same theme. Furthermore, in the
XML cell file format, individual cells can be tagged with a type. This enables
1. This presentation also applies to Wi-Fi access points defined in an XML
cell file (see the Route Analysis User’s Manual, appendix D.7.7). Where
the presentation differs between cellular technologies, Wi-Fi follows
GSM, with the obvious exception of GSM-specific information such as the
Cell ARFCN theme.
LZT 108 9851 R1B
269
TEMS Investigation 9.0 Data Collection User’s Manual
the creation of cell themes displaying arbitrary groups of cells. See section
23.5.5.1 below.
How to load cell files is described in section 5.3, page 33. It is possible to
have more than one cell file loaded.
The following kinds of cell theme exist:
•
Basic plotting of cell sites (Cell theme): section 23.5.5.1
•
Indication of serving cell and handover (Cell Line theme): section 23.5.5.2
•
Visualization of neighbor relations (Cell Color theme): section 23.5.5.3
•
(GSM:) Indication of cells using the same ARFCN as a given cell (Cell
ARFCN theme): section 23.5.5.4
To create a new cell theme, proceed as follows:
•
In the Theme Settings dialog, select “Cell Layer”.
•
Click Add Theme. The Select Theme Type dialog appears.
•
Choose a cell theme type.
23.5.5.1. The Cell Theme
This theme is concerned with basic plotting of cell sites.
Presentation on Map
Three-sector site
(three cells)
Omni cell
The zoom of the Map window does not affect this theme. All cell sites are
always plotted, regardless of the zoom.
Each cell is tagged with a text label if you turn on the “Cell labels” option (see
below). However, to avoid clutter, text labels have been turned off in all of the
remaining illustrations in section 23.5.5.
270
Chapter 23. Map Windows
Note that certain cells are filled with other colors by other cell themes, which
by default hide the Cell theme; see sections 23.5.5.3 and 23.5.5.4.
Setup Dialog
Cells to plot
This section governs which of the cells defined in the
cell file will be plotted.
System
Choose “ALL” to plot cells from all technologies.
Choose a cellular technology to plot only cells from
that technology. You might want to create one Cell
theme for each technology.
(Regarding cellular technology support in the CEL
and XML cell file formats, see the Route Analysis
User’s Manual, appendices C and D.)
Cell type
Type of cell indicated in cell file. In XML cell files this
is identical with the CELL_TYPE element: see the
Route Analysis User’s Manual, appendix D.7.10. In
CEL files, GSM and WCDMA cells are told apart by
inspection of what type of channel is defined
(ARFCN or UARFCN).
Cell presentation
This section governs how cells are drawn.
LZT 108 9851 R1B
271
TEMS Investigation 9.0 Data Collection User’s Manual
Radius (pixels)
The radius of each cell symbol (circle/sector of circle)
in pixels.
Border color
The color to be used for the border of the cell symbol.
Fill color
The color to be used for the interior of the cell
symbol, provided that the cell is completely
described in the cell file. Uncheck to make the
symbol transparent.
When you select a cell it turns red; see the illustration
in section 23.6. (However, this highlighting ceases to
be visible if a Cell Color or Cell ARFCN theme is also
displayed: see sections 23.5.5.3 and 23.5.5.4).
Incomplete cells
Cell labels
The default color to be used for cells that are
incompletely described in the cell file. If you uncheck
this option, incompletely described cells will not be
marked as such in any way. In either case, the
following plotting rules apply:
•
If the antenna direction is not stated in the cell
file, it is set to zero degrees in the plot (sector
centered on “twelve o’clock”).
•
If the beam width is not stated, it is set to 360º in
the plot (omni cell, full circle).
If you check this option, a text label will be printed
next to each cell. The displayed information, taken
from the cell file, is as follows:
•
GSM cells: Cell name.
•
WCDMA cells: Cell name and SC.
•
CDMA cells: Cell name.
23.5.5.2. The Cell Line Theme
This theme is used to indicate serving cells and positions where handovers
have taken place.
The Cell Line theme has different meanings depending on the data source:
phone or scanner.
Use with Phone Data
For a phone, this theme is used to indicate
272
Chapter 23. Map Windows
•
the serving cell (WCDMA/CDMA idle mode; GSM)
•
active set members (WCDMA connected mode/CDMA traffic mode)
(The user interface uses only the term “serving cell”.)
Additionally, the theme indicates positions where handovers have taken
place. Inter-system handovers are visualized in the same way as intrasystem handovers, provided that cells from both cellular technologies are
visible in the Cell theme (section 23.5.5.1).
Use with WCDMA Scan Data
With WCDMA scan data, the Cell Line theme gives a best server indication.
This points out the cell using the currently strongest scrambling code, as
measured by the scanner. No interaction with the base station is involved
(since the scanner lacks such capabilities); rather, GPS data and the contents
of the information element Sc Best Aggr Ec (dBm) are correlated with the
coordinates in the cell file, and the cell is identified which an UE at the same
position would be most likely to use.
Use with CDMA Scan Data
The Cell Line theme works the same way for CDMA scan data as for
WCDMA scan data (points out strongest pilot in terms of Aggregate Ec). See
above.
Presentation on Map
route
line to current
serving cell
Like IE theme markers (section 23.5.3.1), cell lines are plotted with a variable
density. This density is governed among other things by the zoom of the Map
LZT 108 9851 R1B
273
TEMS Investigation 9.0 Data Collection User’s Manual
window, ensuring that large swaths of the map are not completely covered by
such lines when the Leave trail option is checked.
Setup Dialog
Below, all that is said of serving cells/active set also applies to best server
indications.
System
Governs what IEs are selectable. See Color
governed by IE below.
Mobile
Choose the phone whose serving cells are to be
displayed.
Offset (pixels)
Set the offset for the starting point of the line. It has
the same meaning as for information elements (see
section 23.5.3), i.e. the line is shifted in the same way
as an IE theme marker.
Serving cell
These settings govern the indication of current and
past serving cells/active set members.
274
Chapter 23. Map Windows
Serving cell line
Check this to continually display a line connecting the
current position along the route with the current
serving cell/active set members. The line width is
adjustable.
Fixed color
Select this to have the serving cell line drawn in a
fixed color. Pick a color in the combo box.
Color governed
by IE
Select this to have the color of the connecting line(s)
governed by an information element. Before
choosing the information element (and an argument
if applicable), choose the desired category in the
System combo box.
Leave trail
Check this to leave all serving cell lines on the map.
Serving cell list
changed
These settings refer to indication of handovers. Note
that they are independent of the “Serving cell”
settings.
Line to added cell
At handover, a line is drawn from the position where
the new serving cell or active set member is first
used. The line remains after the UE has moved on.
Available also for best server indications, although no
actual handover is involved.
Line to removed
cell
At handover, a line is drawn from the position where
the old serving cell or active set member is last used.
The line will remain on the map.
Available also for best server indications, although no
actual handover is involved.
23.5.5.3. The Cell Color Theme
This theme is used to visualize the neighbor relations of the current serving
cell/active set members or of an arbitrary user-selected cell (only one cell at a
time). The neighbor relations shown are those indicated in the loaded cell file;
the neighbor presentation is not affected by the phone’s neighbor reporting.
The only phone data fed into this theme is the serving cell data.
By default, therefore, in the realtime presentation as well as during logfile
replay, the cell drawn in green will be the phone’s current serving cell.
However, if you stop the replay and click an arbitrary cell, the theme will be
LZT 108 9851 R1B
275
TEMS Investigation 9.0 Data Collection User’s Manual
displayed with that cell as serving cell instead, independently of the phone’s
interaction with the network.
Presentation on Map
•
GSM example:
yellow color from Cell theme
Cell Color theme (no route).
•
WCDMA example:
active set
Cell Color and Cell Line themes. Active set members are pointed out by solid lines
(black). Neighbors are indicated for all active set members (dashed red lines).
•
The presentation for CDMA is similar to that for WCDMA.
By default the Cell Color theme is drawn on top of the Cell theme (section
23.5.5.1). That is, cells drawn in yellow (or highlighted in red) in the Cell
276
Chapter 23. Map Windows
theme will be overlaid with the differently colored cells of the Cell Color
theme, as in the above figures.
Setup Dialog
System
Not used; the choice does not matter.
Mobile
Choose the phone whose serving cell is to be
displayed.
Colors: Serving
cell
The fill color to use for the serving cell. If you
uncheck this box, the cell is not drawn (and, by
default, the version of it displayed in the underlying
Cell theme will be visible instead).
Colors: Neighbor
cells
The fill color to use for neighbors of the serving cell. If
you uncheck this box, the neighbor cells are not
drawn in this theme.
Colors: Servingto-neighbor lines
GSM: Check this to display dashed lines connecting
the serving cell with each of its neighbors.
WCDMA/CDMA: Check this to display, for each
active set member, dashed lines connecting the
active set member with each of its neighbors.
LZT 108 9851 R1B
277
TEMS Investigation 9.0 Data Collection User’s Manual
23.5.5.4. The Cell ARFCN Theme (GSM)
This theme is used to point out other cells that use a specified BCCH or TCH
of a selected cell. It is intended as an aid in GSM interferer identification, a
function no longer supported in TEMS Investigation. The theme is retained
since replay of old logfiles containing interferer identification data is still
supported.
To display the theme, do as follows:
•
Right-click the cell of interest. A context menu appears, listing the BCCH
and the TCHs that it uses. Choose the ARFCN that you want to search for
among other cells:
By default, matching cells are colored as follows:
•
Cells that use the selected ARFCN as BCCH are colored cyan (light blue).
•
Cells that use the selected ARFCN as TCH are colored blue.
Presentation on Map
selected cell; BCCH
selected in context menu
other cell using
same ARFCN
as TCH
Cell ARFCN theme.
278
other cell using
same ARFCN as
BCCH
Chapter 23. Map Windows
By default the Cell ARFCN theme is drawn on top of the Cell theme but
beneath the Cell Color theme, so you may need to hide the latter or change
the ordering of the themes.
Setup Dialog
System
Not used; the choice does not matter.
Same BCCH
ARFCN
The fill color to use for cells that use the selected
ARFCN as BCCH.
Same TCH
ARFCN
The fill color to use for cells that use the selected
ARFCN as TCH.
23.5.6.
Presenting Pinpointing
The Pinpoint theme presents the markers that you create when using
pinpointing rather than a GPS to position data (section 7.1.4, page 53).
Note: The Pinpoint theme is needed in order for the pinpointing
mechanism itself to work. Therefore, this theme should never be
removed.
The following properties can be edited for the Pinpoint theme:
LZT 108 9851 R1B
279
TEMS Investigation 9.0 Data Collection User’s Manual
Symbol
Type, size, and color of waypoint symbols.
Line
Color and width of lines connecting waypoints.
23.5.7.
Editing Themes
To edit a theme:
•
In the Theme Settings dialog, select the theme you want to edit.
•
Click Edit.
23.5.8.
Visibility of Themes
In the Theme Settings dialog, the checkbox next to each layer and theme
governs whether or not it is visible.
•
To show a theme, check the box.
•
To hide a theme, uncheck the box.
The same also applies to layers (section 23.7).
23.5.9.
Reordering Themes
To change the order in which themes are superimposed within a layer:
•
In the Theme Settings dialog, select the theme you want to move.
•
To move the theme upwards, click Up.
•
To move the theme downwards, click Down.
280
Chapter 23. Map Windows
The ordering is of particular relevance for cell themes (section 23.5.5).
23.5.10. Deleting Themes
To delete a theme:
•
In the Theme Settings dialog, select the theme you want to delete.
•
Click Delete.
23.6.
The Right-hand Pane
23.6.1.
Information on Single Theme Markers (Info Tab)
When you select a single theme marker on the map, the marker is highlighted
in red,1 and the Info tab shows (some of) the data represented by this marker.
IE marker
Event marker
For cells, a selection of cell and channel parameters are shown, along with
the cell’s defined neighbors (the red cell is highlighted):
1. Exception: If a Cell Color theme is active, the selected cell is presented
as a serving cell and is colored green.
LZT 108 9851 R1B
281
TEMS Investigation 9.0 Data Collection User’s Manual
Cell markers
For Wi-Fi access points, the cell parameters are replaced by a set of Wi-Fi
parameters.
There is further interplay between the map and the Info tab. For example, if
you click a neighbor of the cell described in the Cells section of the Info tab,
the neighbor will take over the role of serving cell in the Cell Color theme, so
that its own neighbors are displayed instead.
If a group of theme markers is selected, the Info tab instead shows statistics
on the selected data: see section 23.6.2.
23.6.2.
Theme Statistics (Info and Graph Tabs)
You can view some basic statistics for a set of theme markers selected on the
map. Textual information is then presented on the Info tab, and graphs are
drawn on the Graph tab.
There are two ways to select a set of theme markers:
To select all objects within a rectangular area, use the Area Statistics
Tool. Click and drag in the map pane to mark the rectangle.
To select a segment of a route, use the Selection Tool. Click the marker
where you want the segment to begin. Press and hold Ctrl, then click
the marker that is to be the endpoint of the segment.
(It is not possible to select an arbitrary set of objects using Ctrl + click or
Shift + click.)
When you release the mouse, statistics for the chosen marker set are
computed and shown on the Info tab:
•
282
The Information Elements box holds the information elements contained
in the selected theme markers. Next to the name of an element is shown
Chapter 23. Map Windows
the mean value of the element calculated over the selected markers.
(Averaging of signal strength values takes place in the mW domain.)
Expand the information element to view the full set of statistics: mean,
minimum, maximum, and number of samples.
•
The Events box shows the number of occurrences of every event that has
a theme defined for it (not just those actually found among the selected
theme markers).
•
The Cells box shows all cells that have been used as serving cells at the
positions included in the marker set. For the Area Statistics tool, cells that
are within the rectangle but have never been serving cells are not shown.
On the Graph tab, a histogram is drawn for each information element
contained in the selected theme markers. A green curve indicates the
cumulative distribution.
Statistics can be computed both during recording and during replay. During
replay, the statistics cover only the part of the logfile that has been replayed
and plotted so far, not the entire logfile. On the other hand, it should be noted
that the plotting may be more or less thinned out (see section 23.5.3.1), so
that more data goes into the statistics than actually appears on the map.
23.6.3.
Theme Legend (Legend Tab)
The Legend tab gives an overview of all presentation themes, or selected
ones, displaying full details of theme settings. Use the combo box at the top
to select what to show.
23.7.
Layers
Section 23.5 introduced the concept of presentation layer. This section treats
layers in more detail.
Generally speaking, layers are sets of data which together make up the
contents of a Map window. Besides the presentation layer, there are also map
layers, which make up the map itself and cannot be edited. In both types of
layers, however, it is possible to make a number of settings that do not affect
the contents of the layers, for instance to set the visibility of each layer. These
settings are detailed below.
LZT 108 9851 R1B
283
TEMS Investigation 9.0 Data Collection User’s Manual
23.7.1.
Adding Presentation Layers
Normally there is no need to add new presentation layers, since predefined
layers are provided for the various types of theme. However, if you should
want to define a set of data that you want to manage separately in a
convenient way (for instance turn the visibility on and off), then you should put
that data in a separate presentation layer.
To create a new presentation layer, proceed as follows:
Click Add/Edit Themes.
•
In the dialog that appears, click Add Layer:
Layer name
Name the new presentation layer.
Layer type
Choose a layer type, corresponding to the theme
types listed in section 23.5.1.
23.7.2.
Layer Control
The Layer Control is used to edit various properties of layers.
Note: The Layer Control can be accessed either from a Map window or
from the GeoSet Manager. Changes made from a Map window
affect only that window and cannot be saved. If you want to make
changes that can be saved, use the Layer Control of the GeoSet
Manager (see section 23.10, page 288).
•
To open the Layer Control:
Click the Layer Control button.
284
Chapter 23. Map Windows
Up, Down
Change the order in which layers are superimposed
on the screen. (The top layer is first in the list.) To
move a layer upwards, select it and click Up. To
move a layer downwards, select it and click Down.
Add
Add a layer. Select a TAB file and click Open.
Remove
Remove the selected layer.
Visible
Check to make the selected layer in the list visible.
Note that the visibility of presentation layers can also
be set in the Theme Settings dialog (see section
23.5.8).
Selectable
Not used. Disabled for presentation layers; should be
turned off for map layers.
Automatic Labels
Check to make the labels of the selected layer
visible. For labels to be visible, the layer they belong
to must be visible.
Disabled for presentation layers.
Note that the visibility of labels may be conditioned
by the zoom range. See Labels... below.
Editable
LZT 108 9851 R1B
Not used. Disabled for presentation layers; should be
turned off for map layers.
285
TEMS Investigation 9.0 Data Collection User’s Manual
Display
Set display properties for the selected layer.
Labels
Set label properties for the selected layer.
23.8.
Map Context Menu
When you right-click in the map, a context menu appears with choices as
described below.
23.8.1.
The Scale Bar
This command shows and hides a scale bar showing distance in kilometers
or miles. The unit of distance is governed from the Control Panel in Windows
(e.g. Regional Options → Numbers → Measurement System).
23.8.2.
Previous View
This command returns you to the previous map view. (No further history of
views is maintained, however.)
23.8.3.
View Entire Layer
This commands zooms out to show the whole of the chosen layer. For
example, choose an information element layer to view the whole of your
route.
23.8.4.
Setting the Map Projection
This command allows you to set the map projection. It should be the same as
in the cell file.
23.9.
The Map Window Toolbar
This section gives a description of the Map window toolbar buttons. Some of
these activate functions described earlier in this chapter, but many others
relate to map handling and have not previously been mentioned.
GeoSet Manager: Start the GeoSet Manager which is used for
creating new GeoSet files and for changing the properties of a GeoSet.
See sections 23.3 and 23.10.
286
Chapter 23. Map Windows
Open Map: Open a map.
Position Map: Position a map which is in bitmap or uncompressed TIF
format. See section 23.4.
Layer Control: Manage layers or change displaying or labeling
properties. Changes are only temporary and cannot be saved. See
section 23.7.2. To make changes to the GeoSet, use the GeoSet
Manager’s layer control; see section 23.10.1.
Add/Edit Themes: Add or remove presentation layers, or add, edit or
remove themes. See section 23.5.
Selection Tool: Click a presentation layer object to select it. Doubleclick the object to inspect what information it contains. Press and hold
Ctrl to select a segment of a route (see section 23.6.2).
Area Statistics Tool: Click and drag to view statistics for presentation
layer objects within a rectangle (see section 23.6.2).
Zoom In: Enlarge a portion of the map to view it in more detail.
Zoom Out: View a larger area than the current map view.
Holding down the Ctrl key swaps the Zoom operations.
If you have zoomed in and want to view the entire route again, right-click in
the map, choose View, choose Entire Layer, and specify one of the
presentation layers.
Center Map: Click a spot in the map to center it around this spot.
Pan Tool: Move the map by clicking and dragging.
Ruler: Measure the distance of a route on the map consisting of
straight line segments. Click in the map to indicate a starting point, then
click at each turn. The distance of the last segment and the total
distance are shown on the status bar at the bottom of the Map window.
Double-click at the endpoint.
To change the unit of distance, right-click in the map, choose Map
Properties, and select the Defaults tab.
Pinpoint: Mark waypoints on the map.
LZT 108 9851 R1B
287
TEMS Investigation 9.0 Data Collection User’s Manual
Clear Map: Remove all the information in presentation layers from the
map, except cell site information.
The following buttons can only be used when an object belonging to a theme
has been selected.
First Item: Select the first object of the same type.
Previous Item: Select the previous object of the same type.
Next Item: Select the next object of the same type.
Last Item: Select the last object of the same type.
23.10.
GeoSet Manager
The GeoSet Manager looks and works much like a Map window. However,
while changes made in a Map window cannot be saved, changes made using
the GeoSet Manager can be saved to the GeoSet (*.gst) file associated with
the map.
To start the GeoSet Manager, click the Start GeoSetManager button on
the Map window toolbar.
23.10.1. Layer Control
The Layer Control works the same way as in Map windows. See section
23.7.2.
23.10.2. Projections
It is possible to set which projection to use for a GeoSet. If your GeoSet
contains multiple layers with different projections, make sure you choose the
projection of the layer you usually work with.
•
288
To change the projection, choose Map → Projections.
Chapter 24. The General Window
24.
The General Window
In the General window, found in the Navigator’s Configuration folder, are
collected miscellaneous settings that affect the behavior of the TEMS
Investigation application. These settings are covered elsewhere in this
manual in the appropriate contexts.
LZT 108 9851 R1B
289
TEMS Investigation 9.0 Data Collection User’s Manual
25.
Key Performance Indicators –
KPIs (UMTS)
TEMS Investigation Data Collection offers a set of KPIs (Key Performance
Indicators) for measuring the user-perceived performance of a number of
circuit-switched and packet-switched services.
The present chapter gives an general discussion of KPIs as well as an
overview of how to obtain them with the application. Listings and brief
definitions of the KPIs are found in appendix G, page 347. Full detail on
technical matters is given in separate documents which are found on the
installation CD in the subdirectory Documents.
In the present version of TEMS Investigation, KPIs can be computed for GSM
and WCDMA.
25.1.
Purpose of KPIs
All KPIs have been designed according to ETSI TS 102 250-2 V1.4.1 for
performance measurements, that is, to measure accessibility, retainability,
and integrity.
25.1.1.
Accessibility
Accessibility is the ability of the user to obtain a service within specified
tolerances and under other given conditions. For example, in order for a
service to be accessible in a packet-switched network, the user must be able
to execute a chain of operations:
•
accessing the packet-switched network as such, i.e. performing an attach
and a PDP context activation
•
within an active PDP context, accessing an IP service
•
(for WAP and MMS) activating a WAP session.
290
Chapter 25. Key Performance Indicators – KPIs (UMTS)
25.1.2.
Retainability
Retainability is the ability of the user to keep a service, once it has been
accessed, under given conditions for a requested period of time.
Retainability of a service or session also implies that the user does not have
to perform any manual operations that are not necessary under stable
network conditions, such as (in the packet-switched case) manual reactivation of the PDP context.
25.1.3.
Integrity
Integrity indicates the degree to which a service is maintained without major
disturbances once it has been accessed.
Integrity KPIs show the performance of successful service attempts. Even if a
service was accessed successfully, the user’s perception of the performance
may vary greatly, from very good to unacceptably bad.
25.2.
Obtaining KPIs in TEMS Investigation
25.2.1.
General Procedure
To obtain KPIs, perform the following steps:
1. Write a command sequence containing one or several KPI commands,
enclosed by Start Recording and Stop Recording. See chapter 12, page
137, and particularly section 12.13, page 163.
2. Run the command sequence in order to measure KPIs and record the
measurements in a logfile.
3. Export the logfile as “KPI samples”. The output from the export is one or
several XML files. See section 7.5, page 59. Here you can choose
between two slightly different methods of KPI measurement.1
4. Generate a KPI report, using the output from the logfile export. This
produces an XML-format summary of the KPI measurements,
consisting of statistics and charts. An XML stylesheet is supplied so that
the report can be viewed directly in a web browser. The general layout
of the report is similar to that of the ordinary logfile report in Data
Collection. See section 7.7, page 74.
LZT 108 9851 R1B
291
TEMS Investigation 9.0 Data Collection User’s Manual
25.2.2.
Points to Bear in Mind
A couple of things must be observed when recording KPI data:
•
For services other than voice and video telephony, both the MS and the
DC device need to be connected. Furthermore, for a given phone, it is
essential that both associated devices have the same number (MS1 and
DC1, etc.). When phones are autodetected, the required assignment is
produced automatically. If devices are assigned differently, the KPI
measurements will not be correct.
•
The Swap Logfiles function (section 7.1.2, page 52) must not be used
when recording KPIs. This is because all input to a KPI computation must
be obtainable in a single logfile.
•
To obtain reliable KPI statistics you need to collect sufficient amounts of
data. The mathematical relationships between sample size and statistical
accuracy are given in a separate document, “Statistical Guidelines for
Collecting KPI Data“, found on the installation CD in the subdirectory
Documents.
1. ETSI TS 102 250-2 V1.4.1, section 4.2:
“Currently two main views about the best way to reflect the user's
experience are in place: One preferring the payload throughput
philosophy and the other preferring the transaction throughput
philosophy:
Method A [...] defines trigger points which are as independent as possible
from the service used, therefore representing a more generic view
(payload throughput)
Method B [...] defines trigger points on application layer, therefore
representing a more service oriented view (transaction throughput).”
292
Chapter 26. Speech Quality Index – SQI (UMTS)
26.
Speech Quality Index – SQI
(UMTS)
TEMS products offer the quality measure SQI (Speech Quality Index) for
estimating the downlink speech quality in a GSM or WCDMA cellular network
as perceived by a human listener. SQI has been developed by Ericsson, and
computing SQI requires data collected with Sony Ericsson phones.
This chapter examines the workings of the SQI algorithm. See also the
document “Speech Quality Measurement with SQI” which is included on the
TEMS Investigation installation CD in the subdirectory Documents.
26.1.
Background
SQI is a long-standing feature of TEMS products. However, in this version of
TEMS Investigation, the SQI algorithm has been completely reworked,
although its fundamental function remains similar to that of the old one. The
focus of this paper is to describe the new algorithm (called “SQI-MOS” in the
application; see section 26.3). Reference is made to the previously used
algorithm (the “old SQI”), and attention is drawn to certain important
differences between the algorithms, but no comprehensive point-by-point
comparison is made.
As wideband speech codecs will soon be available in mobile phones and
networks, the SQI-MOS algorithm includes a model for rating wideband
speech.
26.2.
Input to the SQI-MOS Algorithm
SQI-MOS takes the following parameters as input:
•
The frame error rate (FER), i.e. the percentage of frames that are lost on
their way to the receiving party, usually because of bad radio conditions.
Frame errors also occur in connection with handover, and these are
treated like any other frame errors by the SQI-MOS algorithm. It should be
noted that in WCDMA, handover frame errors can usually be avoided
LZT 108 9851 R1B
293
TEMS Investigation 9.0 Data Collection User’s Manual
thanks to the soft handover mechanism. In GSM, on the other hand, every
handover causes a number of frames to be lost.
Handovers are not modeled independently in any way by SQI-MOS.1
More generally, the current algorithm also does not consider the distribution of frame errors over time.
•
The bit error rate (BER). This is available in GSM only; no such quantity is
reported by UEs in WCDMA mode.
•
The speech codec used. The general speech quality level and the highest
attainable quality vary widely between codecs. Moreover, each speech
codec has its own strengths and weaknesses with regard to input
properties and channel conditions. The same basic SQI-MOS model is
used for all supported speech codecs, but the model is tuned separately
for each codec to capture its unique characteristics.
SQI-MOS is implemented for the following codecs:
•
GSM EFR, GSM FR, and GSM HR
•
all GSM AMR-NB and AMR-WB modes up to 12.65 kbit/s:
•
–
for narrowband, 4.75 FR/HR, 5.15 FR/HR, 5.9 FR/HR, 6.7 FR/HR,
7.4 FR/HR, 7.95 FR/HR, 10.2 FR, and 12.2 FR;
–
for wideband, 6.60, 8.85, and 12.65
all WCDMA AMR-NB and AMR-WB modes up to 12.65 kbit/s:
–
for narrowband, 4.75, 5.15, 5.9, 6.7, 7.4, 7.95, 10.2, and 12.2;
–
for wideband, 6.60, 8.85, and 12.65.
26.3.
SQI-MOS Output
The SQI-MOS algorithm produces a new quality estimate at intervals of
approximately 0.5 s. Such a high update rate is possible thanks to the low
computational complexity of the algorithm.
1. In contrast, the old SQI algorithm includes a special “handover penalty”
mechanism lowering the SQI score whenever a handover has occurred.
294
Chapter 26. Speech Quality Index – SQI (UMTS)
The output from the SQI-MOS calculation is a score on the ACR1 MOS scale
widely used in listening tests and familiar to cellular operators. The score is
thus a value ranging from 1 to 5.
One thing that needs pointing out is that narrowband and wideband SQI-MOS
scores are not directly comparable. The same MOS scale and range are used
for both (as is the custom in the field of speech quality assessment); however,
a given MOS score indicates, in absolute terms, a higher quality for wideband
than for narrowband. This is because wideband speech coding models a
wider range of the speech frequency spectrum and is thus inherently superior
to narrowband coding. The highest attainable quality is therefore markedly
better for wideband. It follows from this that when interpreting a figure such as
SQI-MOS = 4.0, it is necessary to consider what speech bandwidth has been
encoded. A further complicating circumstance is that there is no simple
mapping between wideband and narrowband SQI-MOS, for reasons
sketched in section 26.4.1.
The old SQI (still available in the application) is expressed in dBQ. It should
be stressed that SQI-MOS cannot be derived from these dBQ scores; the two
algorithms are distinct (even if similar in general terms), and no exact
mapping exists in this case either.
26.4.
Alignment of SQI-MOS and PESQ
The SQI-MOS algorithm has been designed to correlate its output as closely
as possible with the PESQ measure (Perceptual Evaluation of Speech
Quality).2 In fact, the SQI-MOS models have mostly been trimmed using
PESQ scores, rather than actual listening tests, as benchmarks.3 The
exception is the wideband modes, where adjustments to the models have
been made using the results of external listening tests. Regarding the latter,
see section 26.4.1.
Note carefully that PESQ and SQI-MOS do not have the same scope. PESQ
measures the quality end-to-end, that is, also taking the fixed side into
account, whereas SQI reflects the radio link quality only. This means that
1. ACR stands for Absolute Category Rating: this is the “regular” MOS test
where speech samples are rated without being compared to a reference.
2. See www.pesq.org.
3. This is completely different from the old SQI algorithm, which was trained
using listening tests alone. At the time that work was done, no objective
speech quality measure of the caliber of PESQ was yet commercially
available.
LZT 108 9851 R1B
295
TEMS Investigation 9.0 Data Collection User’s Manual
PESQ and SQI values may differ while both being accurate in their respective
domains.
Also bear in mind that PESQ and SQI-MOS use fundamentally different
approaches to quality measurement:
•
PESQ is a reference-based method which compares the received
degraded speech signal with the same signal in original and undistorted
form.
•
SQI-MOS, on the other hand, is a no-reference method that works with
the received signal alone and extracts radio parameters from it (as
described in section 26.2).
Both methods try to assess to what degree the distortions in the received
signal will be audible to the human ear; but they do it in completely different
ways.
PESQ scores need to be averaged over a range of speakers in order to
eliminate speaker bias, i.e. variation stemming from the characteristics of
individual speakers. Such averaging is not required in the case of SQI-MOS,
since the speaker-contingent variation is already built into the model (it has
been trained with a large number of speakers).
26.4.1.
Notes on PESQ for Wideband
The PESQ algorithm for wideband (8 kHz) speech coding – as opposed to
that for narrowband (4 kHz) – is afflicted with certain recognized
shortcomings. The use of PESQ as a benchmark therefore complicated the
development of SQI-MOS for wideband. Below is a brief discussion of this
topic.
One relevant fact is that, in certain circumstances, wideband PESQ has been
found to produce lower scores than narrowband PESQ, even for clean
speech.1 This difference in output range would not in itself be problematic if
wideband PESQ behaved similarly to narrowband PESQ as a function of
FER; a mapping could then be applied to align the wideband scores to
narrowband.
Unfortunately, things are not that simple. Wideband PESQ is much more
sensitive to speaker bias than is narrowband PESQ (compare the
introduction of section 26.4): at a fixed FER, wideband PESQ scores for
1. This is a phenomenon independent of the circumstances described in
section 26.3.
296
Chapter 26. Speech Quality Index – SQI (UMTS)
different speakers show a spread of more than one point on the MOS scale.
For narrowband, this variability is limited to a few tenths of a MOS point.
The upshot of this is that no straightforward mapping between wideband and
narrowband PESQ can be constructed, and consequently outputs from the
two are not directly comparable. Attempts have been made within ITU to
develop such a mapping, but so far with no satisfactory results. (It is probable
that the task of assessing wideband speech quality requires further
refinement of the mathematical models used.)
For the reasons explained above it was necessary to resort to other reference
material besides PESQ scores in order to avoid biasing the wideband SQIMOS model. The material used was the results from listening tests conducted
during standardization of the AMR speech codec.1 Only clean speech ratings
from these tests were used.
This tuning resulted in an adjustment of the SQI-MOS model that is linear as
a function of FER. The largest correction was applied to the clean-speech
SQI-MOS score (i.e. at zero FER), while the rock-bottom SQI-MOS (the worst
possible score, attained at very high FERs2) was left unchanged.
26.5.
Comparison with Other Radio Parameters
In the past, speech quality in GSM networks was often measured by means
of the RxQual parameter (which is also available in TEMS products). Since
RxQual is merely a mapping of time-averaged bit error rates into a scale from
0 to 7 (see 3GPP TS 45.008, section 8.2.4), it cannot of course provide more
than a rough indication of speech quality.
1. See 3GPP TR 26.975, “Quality in Clean Speech and Error Conditions”,
v7.0.0.
2. FER = 60% was selected as endpoint. Samples with FER > 60% were
excluded from the SQI-MOS modeling, since PESQ (as is well known)
sometimes judges severely disturbed speech in a misleading manner:
certain very bad (almost muted) samples receive high PESQ scores.
LZT 108 9851 R1B
297
TEMS Investigation 9.0 Data Collection User’s Manual
27.
Audio Quality Measurement
(AQM) including PESQ
Audio quality measurement, including PESQ, can be purchased as an option
with TEMS Investigation. It can be performed in GSM, WCDMA, and CDMA
networks.
PESQ, short for Perceptual Evaluation of Speech Quality, is the industry
standard for voice quality measurement. The PESQ algorithm measures endto-end speech quality by comparing one party’s undistorted input signal
(serving as reference) with the degraded version of the same signal received
by the other party. The severity of the degradation as perceived by human
listeners is assessed using highly refined models of the human ear and the
brain’s processing of auditory input.
The PESQ algorithm is defined by the ITU standard P.862. For in-depth
information about PESQ, see also www.pesq.org.
27.1.
Audio Quality Measurement in TEMS
Investigation
In TEMS Investigation, audio quality measurements are made during mobileoriginated voice calls made from a phone to a component known as the Call
Generator1. The actual computation is done in dedicated hardware units
called AQM modules: one connected to the phone and to the PC, handling
the downlink; and one housed in the Call Generator, taking care of the uplink.
These modules contain DSP hardware. The downlink AQM module can
optionally be mounted along with the phone in an equipment case.
1. This name has been taken over from a similar system component used in
TEMS Automatic. In TEMS Investigation, the component currently does
not generate calls but merely receives them.
298
Chapter 27. Audio Quality Measurement (AQM) including PESQ
TEMS Investigation Data
Collection, command
sequence
Downlink AQM
module
Reference audio
Test terminal
Transmitted audio
Received degraded
audio (from Call
Generator)
Downlink AQM
Logfile containing
downlink AQM data
Voice
calls
Reference
audio
Uplink AQM data in
XML files (copying/
download)
Logfile with
uplink AQM data
merged in
TEMS Investigation
Route Analysis,
Converter tool
Call Generator with
uplink AQM module
•
The speech segments to be used as references are loaded into the AQM
modules and into the test phone.
•
The phone calls the Call Generator and plays the reference sentences.
The Call Generator responds by playing the same reference sentences.
•
The received (degraded) signals at either end are forwarded to the
respective AQM modules, where the signals are compared with the
originals, yielding uplink and downlink PESQ scores. The AQM modules
also record a number of further audio quality measurements: echo delay,
echo attenuation, and volume. See Information Elements and Events,
section 4.3.8.
•
The downlink AQM data is written to regular TEMS Investigation logfiles.
The uplink AQM data is stored in XML files.
•
To merge uplink AQM data into the logfiles, the Converter tool is used.
See the Route Analysis User’s Manual, chapter 17.
LZT 108 9851 R1B
299
TEMS Investigation 9.0 Data Collection User’s Manual
27.2.
Obtaining and Presenting AQM Data
Here is an overview of how to record and present audio quality
measurements in practice.
27.2.1.
Prerequisites
You need to possess the following:
•
License for collecting AQM data: see the Getting Started Manual, section
2.3.2.
•
Phone supporting audio quality measurement: one of those listed as
AQM-capable in the Getting Started Manual, section 4.2.
•
One or several downlink AQM modules (either standalone units or DSP
cards mounted in an equipment case). One AQM module is required for
each phone that you want to measure AQM with.
•
Call Generator for calculation of uplink AQM data.
27.2.2.
Practical Considerations
•
An external antenna must be used with the phone during collection of
AQM data. Using the phone’s built-in antenna would interfere with the
DSP in the AQM module. (The above applies regardless of whether your
AQM module is standalone or mounted in an equipment case or
backpack. For drive testing, mounting the antenna on the car roof will
provide sufficient distance and shielding. The TEMS Indoor Backpack has
a metal plate at the top which is intended for mounting of external
antennas.)
•
You can plug a headset into the AQM module during measurement to
listen live to the received audio. However, you must not adjust the volume
using the headset, since that would distort the AQM output. The AQM
algorithms require a fixed preset volume.
27.2.3.
Recording AQM Data
The description below assumes that a single phone is used to make audio
quality measurements. It is possible to perform such measurements with
several phones at once, using a different AQM module with each phone.
300
Chapter 27. Audio Quality Measurement (AQM) including PESQ
•
Compose a command sequence containing a Dial command with Call
Type = “Voice + AQM”, instructing the phone to make a voice call to the
Call Generator (identified by its phone number). See section 12.8, page
145.
–
If you wish to synchronize AQM calls from multiple phones, use the
Synchronize command in the sequence; see sections 12.6, page 143
and 12.14, page 164. Note that all of the calls must be handled in the
same sequence to enable synchronization. To also make all calls
terminate at the same time, simply use the same call duration for all
phones.
–
Use the Start Recording and Stop Recording commands as usual to
have the calls recorded in a logfile.
•
Connect your AQM equipment case (or alternatively your phone and
standalone AQM module) to the PC and point to the requisite driver files
as described in the Getting Started Manual, section 5.5.7.
•
Associate the phone with the AQM module in the Equipment
Configuration dialog: see section 6.8.5.2, page 46. The red LED on the
AQM module should go out.
•
Make sure that the phone’s number is defined in TEMS Investigation and
enter the number manually if necessary: see section 6.8.5.3, page 47.
•
When using the AQM module for the first time after connecting it, you
must wait for the AQM module to start up its DSP and finish some preprocessing. Wait until the reports “Dsp Started Ver. 2” and “Pre
Processing Ready” appear in the Mode Reports window.
•
Run the command sequence and record your logfile or logfiles.
27.3.
Merging Uplink AQM Data into Logfiles
After completing your measurements, use the Converter tool to merge the
uplink AQM data (recorded by the Call Generator) into the logfile, which
already contains the downlink AQM scores. See the Route Analysis User’s
Manual, section 17.2. Note that this task does not require an AQM license.
LZT 108 9851 R1B
301
TEMS Investigation 9.0 Data Collection User’s Manual
27.4.
Presenting AQM Data
27.4.1.
Information Elements
All AQM data is available as information elements, so that they can be
included in any presentation.
Status windows named Speech Quality are provided where all AQM
information elements (as well as some other data) are presented.
When viewing (downlink) AQM data in real time, or when replaying a logfile
where the uplink AQM data has not yet been merged in, you must keep in
mind that this data will lag behind other information elements because of the
processing delay in the DSP. The offset is 5.5 s, or one speech sentence.
Downlink Frequent AQM is not displayed at all prior to merging.
When you merge the uplink AQM data into the logfile, the 5.5 s offset is
removed so that all data is correctly aligned.
See also the Route Analysis User’s Manual, section 17.2.3.
27.4.2.
PESQ Key Performance Indicator (KPI)
A PESQ-based KPI is provided. See appendix G.2.5, page 349.
302
Chapter 28. Video Telephony Quality Index – VTQI
28.
Video Telephony Quality
Index – VTQI
The information element VTQI (Video Telephony Quality Index) estimates the
viewer-perceived video and audio quality achieved during video telephony
calls. The VTQI algorithm has been developed by Ericsson. How it works is
the subject of this chapter.
See also the document “Video Telephony Quality Measurement with VTQI”
which is included on the installation CD in the subdirectory Documents.
28.1.
General Properties of VTQI
Like SQI (chapter 26), VTQI is a no-reference method which judges the
quality of the received signal on its own merits, without knowledge of the
original.
The kind of subjective test which VTQI strives to imitate is one where viewers
are instructed to assess both video and audio and combine their perception
of each into an overall “multimedia quality” score.
The output from the VTQI algorithm is expressed as a value between 1 and 5,
conforming to the MOS (Mean Opinion Score) scale which is frequently used
in subjective quality tests. The unit for VTQI is called “MOS-VTQI”.
VTQI estimates the quality of the video call as perceived by the viewer at a
moment in time. It is updated continuously during the call. There is no overall
assessment of entire calls analogous to static VSQI computed for entire
streaming clips (as described in section 29.4.1).
28.2.
What VTQI Is Based On
The VTQI score is based on the following non-perceptual input:
•
The quality of the encoded (compressed) signal prior to transmission.
This quality is straightforwardly a function of the codecs used and the bit
rate. However, since the radio bearer currently used in UMTS for video
LZT 108 9851 R1B
303
TEMS Investigation 9.0 Data Collection User’s Manual
telephony is always a 64 kbit/s bearer, bit rate variation is in fact not an
issue. This leaves the codecs:
•
–
For the H.263 and MPEG-4 video codecs, the “clean” quality in terms
of VTQI has been computed in advance. In practice, what codec is
used in the video call is deduced from the signaling between server
and client. (In current implementations of VTQI in TEMS Investigation,
the video codec is assumed to be H.263, but a VTQI model for MPEG4 also exists.)
–
The audio codec is assumed always to be AMR-NB operating at 12.2
kbit/s.
BLER (block error rate). This is the most important single cause of poor
quality in video telephony. Focusing on BLER means that VTQI will
faithfully reflect the impact of air interface conditions on QoE.
Bit error rate (BER), on the other hand, is not reported by current WCDMA
user terminals and so is not available for use in the VTQI model.
28.3.
What VTQI Does Not Consider
VTQI does not directly consider the signal presented to the human viewer;
that is, no analysis of perceptual input is performed to detect specific visible
artifacts. The transferred video is not analyzed frame by frame in any way.
Thanks to the monitoring of BLER, however, even slight degradations
impacting video and audio perception will still be noticed by the algorithm and
affect the VTQI score.
28.4.
Update Rate
VTQI is reported as the information element VTQI Realtime Score. This
element is updated regularly – at intervals of length 1–2 s depending on the
phone model – throughout the video call.
Each VTQI score is a time average taken over the last 8 seconds; the first
score is thus obtained 8 s into the video call. This windowing procedure
prevents short block error bursts from impacting the VTQI score in a
disproportionate manner.
304
Chapter 29. Video Streaming Quality Index – VSQI
29.
Video Streaming Quality Index
– VSQI
The information element VSQI (Video Streaming Quality Index) estimates the
viewer-perceived video and audio quality achieved during video streaming
sessions. This chapter takes a look the VSQI algorithm, which has been
developed by Ericsson.
See also the document “Video Streaming Quality Measurement with VSQI”
which is included on the installation CD in the subdirectory Documents.
29.1.
General Properties of VSQI
Like SQI (chapter 26), VSQI is a no-reference method which judges the
quality of the received signal on its own merits, without knowledge of the
original.
The kind of subjective test which VSQI strives to imitate is one where viewers
are instructed to assess both video and audio and combine their perception
of each into an overall “multimedia quality” score.
The output from the VSQI algorithm is expressed as a value between 1 and
5, conforming to the MOS (Mean Opinion Score) scale which is frequently
used in subjective quality tests. The unit for VSQI is called “MOS-VSQI”.
29.2.
What VSQI Is Based On
The VSQI score is based on the following non-perceptual input:
1. The quality of the encoded (compressed) signal prior to transmission.
This quality is straightforwardly a function of the video and audio codecs
used, and their bit rates. The information actually used by the VSQI
algorithm is the video codec type and the total (video + audio) bit rate.
The “clean” quality has been computed in advance for the codecs listed
in section 29.4.1.
LZT 108 9851 R1B
305
TEMS Investigation 9.0 Data Collection User’s Manual
2. The amount of initial delay and the subsequent interruptions during
playback of the video sequence: that is, the time required for initial
buffering and the incidence of rebuffering.
3. The amount of packet loss at the application level (i.e. in the video
streaming client).
29.3.
What VSQI Does Not Consider
VSQI does not directly consider the signal presented to the human viewer;
that is, no analysis of perceptual input is performed to detect specific visible
artifacts. The transferred video is not analyzed frame by frame in any way.
Thanks to the monitoring of packet loss (item no. 2 in section 29.2 above),
however, even slight problems with blockiness, jitter, and so on will still be
noticed by the algorithm and affect the VSQI score.
29.4.
Static and Dynamic VSQI
Two versions of the VSQI algorithm have been devised: one static and one
dynamic version.
Static VSQI is presented in Session End reports concluding streaming
sessions (Data Reports message window). It does not appear as an
information element. Dynamic VSQI, on the other hand, is contained in the
information element VSQI Realtime Score.
29.4.1.
Static VSQI
The static version of VSQI takes an entire streamed video clip as input and
assigns a single quality score to it.
Input parameters to the static version of VSQI are as follows:
•
Video codec used (H.263, H.264, or MPEG4)
•
Total bit rate (video + audio)
•
Duration of initial buffering
•
Number of rebuffering periods
•
Duration of rebuffering periods
•
Amount of packet loss
306
Chapter 29. Video Streaming Quality Index – VSQI
With some degree of simplification, we may describe the calculation of static
VSQI with the following formula:
Here, VSQIclean is the “clean value” obtained for the clip prior to transmission.
This score is determined by the quality of the encoding, which is in turn
dependent on the choice of codecs and bit rate.
The size of the buffering penalty depends on the time taken for initial
buffering, the time spent rebuffering, and the number of rebuffering events.
The size of the packet loss penalty is determined as follows. A running packet
loss average over the last 4 s is computed approximately every second, and
the values thus obtained are weighted and summed to yield an appropriate
overall measure of the packet loss. The latter is then translated into a
deduction from the VSQI score.
The static VSQI algorithm has been fine-tuned for clips of around 30 s and
should therefore in practical use be applied to clips of similar duration. The
video sequences must not be too short because of how the buffering works:
each instance of rebuffering takes several seconds to complete, and
moreover if the clip is short enough it will have been buffered in its entirety
before the replay starts, so that no rebuffering will ever occur. For clips
considerably longer than 30 s, on the other hand, disturbances towards the
end will be more harshly penalized by viewers than those occurring early on,
simply because the late ones are remembered more vividly. Therefore, since
the current VSQI algorithm does not take into account such memory effects, it
would probably perform slightly worse for long clips. (The dynamic version of
VSQI is naturally not affected by this limitation.)
29.4.2.
Dynamic (Realtime) VSQI
The dynamic or realtime version of VSQI estimates the quality of a streaming
video clip as perceived by viewers at a moment in time. It is updated regularly
– at intervals of the order of 1 s – while the video clip is playing. Each VSQI
output value is dependent on the recent history of the streaming session (i.e.
recent packet loss levels and possible recent buffering events).
The design of dynamic VSQI is based on the following:
•
Previous research suggesting approximate times taken for the perceived
quality to drop to MOS-VSQI 1 (during buffering) and to rise to the highest
attainable VSQI (during normal replay)
LZT 108 9851 R1B
307
TEMS Investigation 9.0 Data Collection User’s Manual
•
Modeling of the impact of packet loss on perceived quality
•
Tailoring of mathematical functions for expressing viewer annoyance/
satisfaction as a function of time (in each of the states that are possible
during replay)
•
Codec and bit rate parameters as in the static version
The graph below shows in rough outline the different ways in which dynamic
VSQI can evolve during the replay of a streaming video clip. The best
achievable quality, i.e. the “ceiling” in the graph, is dependent on the codec/bit
rate combination but is also affected by the amount of packet loss. In this
example the packet loss is assumed to be constant so that the influence of
buffering can be clearly discerned.
1. The user tolerates (and might even expect) a certain amount of initial
delay; but the longer the buffering drags on, the more the user loses
patience.
2. Once the replay gets going, the perceived quality picks up again and
soon approaches the highest achievable level.
3. If rebuffering occurs, VSQI deteriorates rapidly. Rebuffering events are
much less tolerated by viewers than initial buffering, especially if
repeated; VSQI captures the latter by making the slope of the curve
steeper for each new rebuffering event.
4. After the replay has recommenced, VSQI recovers reasonably quickly,
but not infrequently from a rock bottom level.
308
Chapter 30. C/I Measurement (GSM)
30.
C/I Measurement (GSM)
This chapter explains in some detail how GSM C/I measurements are made
and why they are useful.
The discussion provided here is centered on the voice service. It should
however be noted that the C/I measure is just as useful in the context of
packet-switched data services. In fact, towards the high end of the C/I range,
speech quality is not further improved, while packet-switched transmissions
very clearly do benefit from every extra dB, particularly if EDGE is used.
30.1.
Why C/I?
The carrier-over-interference ratio is the ratio between the signal strength of
the current serving cell and the signal strength of undesired (interfering)
signal components. The C/I measurement function built into TEMS
Investigation enables the identification of frequencies that are exposed to
particularly high levels of interference, something which comes in useful in
the verification and optimization of frequency plans.
C/I can be measured in dedicated mode.
30.2.
Requirements on a Robust C/I Measure
Downlink quality in a radio network can be monitored using the TEMS
Speech Quality Index, SQI (see chapter 26, page 293). In this way, areas with
inadequate quality can be identified. However, if frequency hopping is used in
the network, it is difficult to pinpoint the frequencies that are affected by the
degradation. To help resolve such ambiguities, TEMS Investigation offers the
possibility of measuring average C/I for each of the frequencies used in a call.
To obtain a correct C/I estimate, one must take into account the possible use
of power control and/or discontinuous transmission (DTX). In the past, rough
C/I measurements have sometimes been carried out by comparing the BCCH
signal power of the serving cell with that of neighboring cells using the same
traffic channels (but different BCCHs). Since such a scheme fails to allow for
power control and DTX on the TCHs, it may produce misleading results. By
LZT 108 9851 R1B
309
TEMS Investigation 9.0 Data Collection User’s Manual
contrast, TEMS Investigation does consider these network functions and is
thus able to indicate the actual C/I experienced by the phone.
30.3.
Details on C/I Measurements
In dedicated mode, average C/I is presented approximately twice a second,
which is equal to the ordinary measurement interval. If frequency hopping is
employed, the average C/I for each frequency is presented.
The measurement range extends from 0 dB to 35 dB. A C/I below 0 dB can
be regarded as highly unlikely; in addition, if the number of hopping
frequencies is low, C/I values below this limit would normally result in a
dropped call. Beyond the upper limit, the performance is not further improved
(at least not with today’s modulation schemes). Hence, the limitation of the
measurement range is not a restriction.1
If downlink DTX is used, the number of bursts transmitted from the base
station to the phone may be lower than the maximum, depending on the
speech activity level on the transmitting side. TEMS Investigation makes
measurements only on the bursts actually sent from the base station and
disregards bursts not transmitted.
30.4.
Accuracy
The number of hopping frequencies determines the number of bursts used for
the C/I measurement on each frequency. For example, if four frequencies are
used, 25 bursts (on average) per frequency are received in each half-second
(to be precise, 480 ms) interval. With more frequencies, there are fewer
bursts for each frequency. This implies that the accuracy of the
measurements is better for small sets of hopping frequencies.
If true C/I is within the range 0 to 15 dB, and four frequencies are used for
transmission, and there are no DTX interruptions, the measurement error is
typically smaller than 1 dB.
30.5.
An Example
To illustrate the use of C/I, data from a test drive is depicted in the figure
below. The test drive lasts 40 seconds. EFR speech coding and cyclic
1. The C/I information elements preserve a wider value range –5 ... 35 dB,
which reflects the performance of older technology.
310
Chapter 30. C/I Measurement (GSM)
20
60
SQI
50
0
0
RxLev
40
5
10
15
20
25
time [s]
30
35
40
5
10
15
20
25
time [s]
30
35
40
RxLev [dB]
SQI [dBQ]
frequency hopping with four frequencies are employed throughout. The upper
part of the graph shows SQI and RxLev, while the lower part shows C/I for
each of the four frequencies:
C/I [dB]
25
20
15
10
5
0
0
As appears from the upper graph, SQI dips sharply towards the end of the
test drive (after 35 s), indicating poor speech quality. On the other hand,
RxLev stays about 50 dB above –110 dBm the whole time. This means that
the dip in quality is not due to low signal power level, that is, the quality
problem is to do with interference rather than coverage. In fact, and
interestingly, RxLev increases during the SQI dip, probably because the
power of the interferer increases.
Now, looking at the C/I graph, one sees that two of the four frequencies (the
thick lines) have a C/I worse than 10 dB during the SQI dip. This explains the
poor speech quality, identifying precisely which channels are disturbed. Such
information can then be utilized in the process of optimizing the frequency
plan for the area.
LZT 108 9851 R1B
311
TEMS Investigation 9.0 Data Collection User’s Manual
31.
Uplink (MTR) Data (GSM)
This chapter explains the concept of uplink data and points out the benefits of
utilizing such data in the network analysis.
31.1.
Uplink Data: MTR Files
In cellular networks using infrastructure from Ericsson, it is possible to record
so-called MTR files. The MTR (Mobile Traffic Recording) function traces the
behavior of an individual phone by recording event data produced in the Base
Station Controller (BSC), as well as measurement data from the BTS and
from the phone itself. The phone-originated data is also a subset of what is
found in the TEMS logfile, although in the MTR file it is not tagged with any
positioning information. The remainder of the MTR file data is referred to as
“uplink data” within the TEMS Investigation framework, and MTR files are
called “uplink files” in this manual outside the present section, unless
characteristics specific to MTR files are dealt with. It should be noted that
MTR files contain no idle mode data, but only data from calls. In general, one
MTR file is generated for each call.
MTR files can be recorded for voice calls only, not when running a data
service.
This manual does not go into the details of obtaining and transferring MTR
files. In the instructions given here it is assumed that you already have the
requisite MTR files stored on your computer.
At present, TEMS Investigation is not capable of reading uplink data from
other manufacturers’ equipment.
31.1.1.
Supported MTR File Versions
All R6.x, R7, R7.1, R8, and R10 versions as well as MTR 2005 in binary
format.
312
Chapter 31. Uplink (MTR) Data (GSM)
31.2.
Utilizing Data from Uplink Files
Uplink files can be replayed as-is in TEMS Investigation. They can however
also be merged with the corresponding TEMS logfiles, producing output in
the form of an augmented logfile which can be replayed in the usual manner.
(See section 31.3 below.) The contents of the uplink file can thus be viewed
concurrently with the downlink data recorded in the TEMS logfile. A further
advantage of merging the files is that geographic positioning can be obtained
for the uplink data.
The uplink data is presented as a separate class of information elements; see
section 31.4.
The benefit of studying uplink data is that it yields a clearer picture of what is
going on in the network and thus permits the network analyst to draw more
informed conclusions. Handovers are a case in point, as is discussed in the
following section.
31.2.1.
Uplink Data on Handovers
Decisions about handovers are made for the phone by the network (normally
in the BSC), and not by the phone itself. The phone contributes in the
decision-making process by reporting the signal strength of neighboring cells,
but the network bases the final handover decision on other information as
well (independent measurements of signal strength, and also estimates of
radio quality and timing advance). Now, the TEMS logfile only contains the
phone’s own “advisory” measurements, whereas the uplink file includes the
final decision arrived at by the BSC (expressed as ranking of neighbors).
Therefore, the uplink data shows more clearly how the phone interacts with
the network.
31.3.
Merging Uplink Files with TEMS Logfiles
Merging and synchronization of the two file types are carried out from the
Export Logfile window. Refer to section 7.8, page 76 for a complete
description of this procedure.
31.4.
Presentation of Uplink Data
The uplink data is available as a separate class of information elements – the
“GSM Uplink” category on the Navigator’s Info Element tab. There are status
LZT 108 9851 R1B
313
TEMS Investigation 9.0 Data Collection User’s Manual
windows, a message window, and a line chart dedicated to presenting this
data. See Information Elements and Events, sections 8.1.3, 8.3.1, and 8.5.2.
A full listing of information elements culled from the MTR file is found in
Information Elements and Events, section 3.6.
Note: For MTR files, the “GSM Uplink” category in fact also includes the
downlink data found in the file, data which duplicates some of the
information in the TEMS logfile (although the values may not be
exactly identical).
314
Chapter 32. GSM Channel Verification
32.
GSM Channel Verification
The GSM Channel Verification tool allows you to check the availability of a set
of GSM traffic channels, typically those used in one cell or a set of cells.
TEMS Investigation lets one or several GSM-capable Sony Ericsson phones1
make calls repeatedly on the chosen channels until all timeslots of interest
have been tested.
Since there is no way for TEMS Investigation to control the timeslot
allocation, traffic channel verification may take a non-trivial amount of time to
complete. To reduce the testing time, you can use several phones.
32.1.
•
The GSM Channel Verification Window
To perform GSM channel verification, open the GSM Channel Verification
window from the Control menu or the Control folder in the Navigator.
In this window, each row corresponds to a particular combination of BCCH
and TCH.
Throughout chapter 32, the following terminology will be used:
•
Test case: One row in the GSM Channel Verification window, i.e. one
BCCH/TCH combination.
1. Sony Ericsson UEs with both GSM and WCDMA capability must be
locked on GSM (see section 13.2.2.2, page 183) to be able to perform
GSM channel verification.
LZT 108 9851 R1B
315
TEMS Investigation 9.0 Data Collection User’s Manual
•
Group, Test case group: All test cases with the same BCCH,
corresponding to one cell. Note that test case groups are not explicitly
separated in the user interface.
•
Test: All rows in the window, or in other words the complete contents of
the *.tch file (see section 32.11, page 324).
32.2.
Adding a Test Case
To add a test case, click Add. The following dialog appears:
MS
The phone that should execute this test case.
BCCH ARFCN
The ARFCN of the BCCH to be tested.
TCH ARFCN
The ARFCN of the TCH to be tested. Note that a
special test case must be prepared to test TCH
timeslots on C0.
Example: If C0 has ARFCN 10, with BCCH in TS 0
and TCHs in TS 2–7, and C1 has ARFCN 20, then
you must prepare two test cases: one with {BCCH =
10, TCH = 10} and one with {BCCH = 10, TCH = 20}.
Band
The frequency band where the channels are located.
Timeslot
Check the timeslots you wish to test.
316
Chapter 32. GSM Channel Verification
You can add multiple test cases without exiting the dialog, by entering the
settings for one test case at a time and clicking Apply after each. The result in
the GSM Channel Verification window will look like this:
Here, timeslots to be tested are represented by digits, while timeslots not
concerned by the test are marked “_”.
32.3.
Editing and Removing Test Cases
To edit a test case, select it in the GSM Channel Verification window
and click the Edit button.
Note that to edit a test case which has been partially executed, you must
reset the test case (section 32.8). That is, you cannot keep any of the old test
results in the window; but you do have the option to create a report on these
results (section 32.10) or save the test case in a special file format (section
32.11).
To remove a test case, select it and click the Delete button.
32.4.
Manual and Automatic Verification
There are two fundamentally different ways of performing channel
verification.
•
Automatic verification: For each timeslot, TEMS Investigation decides
whether the timeslot can be accepted or not. In order for a timeslot to
pass, the call must be set up correctly and maintained for a user-specified
period of time, and in addition a set of user-specified quality requirements
must be satisfied.
•
Manual verification: For each timeslot, you decide yourself whether to
accept or reject the result of the test, by clicking either of two buttons.
How to take this decision is up to the user. You might be content with
LZT 108 9851 R1B
317
TEMS Investigation 9.0 Data Collection User’s Manual
assessing the downlink quality by calling a service such as the speaking
clock, or you might want to “call a friend” in each instance to have the
uplink quality checked as well.
Automatic verification can be made quicker, but is a less reliable indicator of
what a user’s experience of the radio conditions would be like. Manual
verification is more work-intensive and probably more time-consuming, but
also yields an improvement in reliability proportional to the work invested.
You choose how to perform the test in the Properties dialog.
In the GSM Channel Verification window, click the Properties button.
Verification mode
Choose manual or automatic.
Test phone
number
Enter the phone number to call when testing. Valid
characters in the phone number are {*, +, #, 0–9}.
Add MAIO and
HSN...
Check this to have the Mobile Allocation Index Offset
(MAIO) and the Hopping Sequence Number (HSN)
indicated in the test report (section 32.10) for any test
case that fails in automatic verification mode.
•
318
Choose the QoS parameters tab to stipulate conditions for accepting a
timeslot in automatic verification mode.
Chapter 32. GSM Channel Verification
Delay time before
evaluation
The time to wait before evaluating the quality
parameters.
Approve timeslot
if these conditions
are met:
Check the conditions you want to use, and specify
thresholds. The conditions will be evaluated at one
point in time, namely as soon as the delay period has
expired. The checked conditions must all be satisfied
in order for the timeslot to be accepted, i.e. they are
ANDed together.
32.5.
Connecting Phones
Before running the test you must naturally connect the phones assigned to do
the testing.
Note: In manual verification mode only one phone can be used.
LZT 108 9851 R1B
319
TEMS Investigation 9.0 Data Collection User’s Manual
32.6.
Running the Test
32.6.1.
Getting Started
To be able to execute a test you must have done the following:
•
Prepared your test cases according to sections 32.1–32.3.
•
Chosen manual or automatic verification mode, and indicated a phone
number to call: see section 32.4.
•
Connected the phone or phones to be used in the test.
Then, to start running the test currently displayed in the GSM Channel
Verification window:
Click Start.
TEMS Investigation will now start attempting calls on the TCHs specified,
having locked the phone on the corresponding BCCH. The test cases
in the leftmost column.
currently executed are tagged with a blue arrow
While the test is running, handover is disabled, as are all other phone control
functions in TEMS Investigation.
If you have listed several test case groups (see section 32.1), they will be
executed one at a time, in the order they have been entered. Note that there
is no requirement to keep test case groups apart in the GSM Channel
Verification window, although it may of course be practical to do so.
When the testing of a timeslot begins, it is marked with a question mark
in a gray box. In the frequency hopping case, this timeslot is tested for
all channels in the hopping sequence at once, so that multiple gray
boxes appear.
32.6.2.
Manual Verification
If you have chosen manual verification, the application will now wait for you to
either accept or reject this timeslot.
To accept a timeslot, click Accept.
An accepted timeslot will be marked with a green rectangle (with
an for hopping channels). If all timeslots in the test case are now
accepted, the status of the test case will change to Passed.
320
Chapter 32. GSM Channel Verification
To reject a timeslot, click Reject.
A rejected timeslot will be marked with a red rectangle (with an
for hopping channels). The test case will ultimately be put in status
Failed, though not until all timeslots have been either accepted or
rejected.
When you have made a decision, the application proceeds to make a new
call. When a call is made in a previously accepted or rejected timeslot, the
Accept and Reject buttons are disabled, and a new call is made within a few
seconds.
32.6.3.
Automatic Verification
If you have chosen automatic verification, the application will itself accept the
timeslot (if possible), marking it green
; otherwise it will try to make a
new call the next time this timeslot is allocated. Automatic verification never
rejects a timeslot, but keeps attempting calls indefinitely, within certain limits;
see section 32.13, “Error Conditions”.
When a timeslot is allocated which has already been accepted or rejected,
the call is aborted (not affecting the earlier result), and a new call is begun
immediately.
32.6.4.
Example
Here is an example of an ongoing verification session:
The cell described by the first three rows (tagged with blue arrows) is under
test. Manual verification has been chosen. Frequency hopping is used in this
cell (as shown by the symbols), so any timeslot tested will be verified for all
three TCHs at once. At this point, the user has accepted the performance of
LZT 108 9851 R1B
321
TEMS Investigation 9.0 Data Collection User’s Manual
timeslots 3 and 6 (green markers), while rejecting timeslot 7 (red markers).
Timeslot 4 is currently being tested, which is indicated by question marks.
32.7.
Stopping the Test
In order to stop the test currently running:
In the GSM Channel Verification window, click Stop. All test cases
which had status Testing will change to Stopped.
To resume, just click Start again. The test will continue from the point
where it was halted. All test cases that are not finished will be put in
status Testing again.
32.8.
Resetting a Test Case
You can erase the results for a test case by resetting it. If the test is
executing, it must be stopped first. The status value of the test case reverts to
Not tested; when execution is resumed, the test case will be processed from
scratch again.
32.9.
Summary of Test Case Status Values
A test case has one of the following status values:
Status Value
Meaning
Not tested
No work done yet on this test case, or: The test case
has been reset.
Testing
Execution of this test case is ongoing. This is also
indicated in the leftmost column by a blue arrow .
Stopped
Execution of this test case has been begun but the
test is currently stopped.
Passed
All timeslots in the test case have been accepted.
Timeslot(s)
rejected
At least one timeslot in the test case has been
rejected.
322
Chapter 32. GSM Channel Verification
Status Value
Meaning
Call lost
BCCH lost
Invalid TCH
Timeout
MS not connected
Call setup failure
These status values signify errors. See section
32.13, “Error Conditions”. The error condition is also
indicated in the leftmost column by the symbol
.
32.10.
Creating Test Reports
At any stage of execution of a test, an HTML report can be generated
summarizing the results obtained so far. (If the test is executing, it must be
stopped first.) The report indicates
•
the verification mode: manual or automatic
•
the test phone number
•
the QoS parameter settings
•
the test result for each timeslot (where available) as well as the status of
each test case at the time of creating the report
In case of call setup failure, the used MAIO and HSN is indicated for that test
case.
To generate a test report, click the Report button, and select an output
location for the HTML file.
Status values are as in the GSM Channel Verification window; see section
32.9. Timeslots are marked with one of the following:
Timeslot Data
Meaning
OK
Timeslot accepted.
FAIL
Timeslot rejected.
TESTING
Test of timeslot not yet completed.
–
Timeslot not included in test.
LZT 108 9851 R1B
323
TEMS Investigation 9.0 Data Collection User’s Manual
32.11.
Saving and Opening Tests
Channel verification tests can be saved to file at any stage of execution. (The
test must be stopped first.) The file will include full information on the results
obtained so far and on the status of each test case at the time of saving.
To save the complete current contents of the GSM Channel Verification
window, click Save. The test will be saved in a file with extension .tch.
To open a previously saved *.tch file, click Open and select the file.
32.12.
Notes on Performance
It is possible to speed up the verification process by letting several phones
share the work. This will, as a rule, considerably reduce the time taken to
perform the test. You may assign different test cases to different phones, or
assign identical test cases to several phones, or you may do both. If several
phones are set to execute identical test cases, to begin with they will all work
independently. However, as soon as a timeslot is accepted by one phone, it is
marked green for all other identical test cases, and no phone will test it
further.
32.13.
Error Conditions
In certain situations the application judges it impossible to complete the
verification and therefore aborts the test. The test cases affected by the error
in the leftmost column.
executed are tagged with the symbol
The status value of the test case indicates what has gone wrong:
Status Value
Call lost
324
Cause
Two possible causes:
•
Two idle mode reports received while in
dedicated mode (i.e. ongoing call has been lost).
•
One idle mode report received from wrong cell
while in dedicated mode (i.e. lock on BCCH has
broken down).
Chapter 32. GSM Channel Verification
Status Value
BCCH lost
Cause
Two possible causes:
•
No channel report received from correct BCCH
for 20 seconds after previous successful locking
on this BCCH (i.e. lock on BCCH has broken
down).
•
Three idle mode reports from wrong cell or two no
service reports received while trying to lock on
BCCH (i.e. lock on BCCH has failed).
Invalid TCH
Test case attempted 10 times in a row without the
right TCH being allocated, and no timeslots marked
green or red (typically occurs when the chosen TCH
is not used where assumed).
Timeout
Ten consecutive calls made where the call setup
procedure could not be concluded successfully.
MS not connected
Phone not connected at start of measurement.
LZT 108 9851 R1B
325
TEMS Investigation 9.0 Data Collection User’s Manual
33.
Support Contact Information
For support in using TEMS Investigation, please contact Ericsson according
to the directions found at
www.ericsson.com/tems
under the link “Contact TEMS”.
To sign up for the TEMS on-line subscription service, please go to the same
web site and click the link “TEMS Subscription Service”. This free service
includes e-mail notification of TEMS product launches, version upgrades and
patches, as well as on-line TEMS News.
326
Appendix A. Keyboard Shortcuts
Appendix A. Keyboard Shortcuts
A.1.
General Shortcuts
Function
Help
Shortcut
F1
Exit application
Alt + F4
Previous worksheet
F11
Next worksheet
F12
Focus on next window in worksheet
Ctrl + Tab
Generate KPI report
Alt + K
New workspace
Ctrl + N
Open workspace
Ctrl + O
Generate logfile report
Ctrl + R
Save workspace
Ctrl + S
A.2.
Drive Testing Shortcuts
Function
Connect all
Disconnect all
Connect (single device)
Disconnect (single device)
LZT 108 9851 R1B
Shortcut
F2
Ctrl + F2
F3
Ctrl + F3
327
TEMS Investigation 9.0 Data Collection User’s Manual
Function
Shortcut
Swap logfiles
F4
Insert filemark
F5
Start recording
F6
Pause recording
Shift + F6
Resume recording
Alt + F6
Stop recording
Ctrl + F6
Redial last call
F7
End call
Ctrl + F7
Show equipment properties (for device
selected on Equipment Control toolbar)
F8
Start scanning
Ctrl + J
Stop scanning
Ctrl + K
Show scanning properties
Ctrl + L
A.3.
Replay Shortcuts
Function
Shortcut
Open logfile
Shift + F10
Play logfile
F10
Step logfile
Alt + F10
Stop logfile
Ctrl + F10
Find in logfile
328
Ctrl + F
Appendix A. Keyboard Shortcuts
A.4.
Shortcuts for Active Window
Function
Print window
Shortcut
Ctrl + P
Status Window, Line Chart, Bar Chart
Function
Shortcut
Show properties
Shift + P
Show setup wizard (status window only)
Shift + W
Equipment Configuration Window
Function
Shortcut
Add equipment
Shift + A
Delete equipment
Shift + D
Open Properties dialog
Shift + P
Save equipment labels
Shift + S
Command Sequence Window
Function
Shortcut
Edit sequence
Ctrl + E
Start sequence
Ctrl + G
Stop sequence
Ctrl + H
New sequence
Ctrl + N
Open sequence
Ctrl + O
LZT 108 9851 R1B
329
TEMS Investigation 9.0 Data Collection User’s Manual
Function
Save sequence
Show sequence properties
330
Shortcut
Ctrl + S
Alt + Enter
Appendix B. File Types in TEMS Investigation Data Collection
Appendix B. File Types in TEMS
Investigation Data Collection
Extension
File Type
.aex
Setup file for ArcView format logfile export
.bch
Bar chart export file
.cel
Cell file
.chn
Scanning channel group
.eth
Setup file for Ethereal format logfile export
.evt
User-defined event
.fmt
Logfile exported in text format
.lch
Line chart export file
.log
Logfile
.map
Map window export file
.mex
Setup file for MapInfo format logfile export
.mw
Message window export file
.pex
Setup file for Planet format logfile export
.rpt
Setup file for logfile report
.stm
Status window export file
.svt
Audio indication for event
.tdc
TEMS Investigation Data Collection workspace
.tex
Setup file for text format logfile export
LZT 108 9851 R1B
331
TEMS Investigation 9.0 Data Collection User’s Manual
Appendix C. Manual Enabling of
External Equipment
In this appendix are given instructions for manual enabling of a variety of
equipment that is normally autodetected by TEMS Investigation. The
instructions are provided in case the equipment (for whatever reason) is not
recognized by the application.
The procedure of locating ports and modems in the Window Device Manager
generally extends straightforwardly to equipment not covered here.
C.1.
Phones
Regarding Sierra Wireless, see section 6.7.1.2, page 42.
Sony Ericsson UEs
•
For TEMS measurements, choose the virtual COM port number assigned
to the modem “Sony Ericsson [<model name>] USB WMC Modem”.
•
For data service measurements, choose the virtual COM port number
assigned to the modem “Sony Ericsson [<model name>] USB WMC Data
Modem”.
To find out the COM port numbers, right-click these items in the Windows
Device Manager and inspect the Properties dialog.
See this screenshot of the Device Manager:
Data service
measurements
TEMS
measurements
332
Appendix C. Manual Enabling of External Equipment
Motorola UEs
•
For TEMS measurements, choose the virtual COM port number assigned
to the port “Motorola Network Monitor”.
•
For data service measurements, choose the virtual COM port number
assigned to the modem “Motorola USB Modem”. To find out the COM port
number, right-click this item in the Device Manager and inspect the
Properties dialog.
See this screenshot of the Device Manager:
Data service
measurements
TEMS
measurements
Nokia GSM Phones
•
For data service measurements, choose the virtual COM port number
assigned to the modem you selected when configuring Dial-up
Networking, i.e. preferably “Nokia <model no.> (USB) ...”.
•
For TEMS measurements, choose the virtual COM port number assigned
to the other modem, i.e. “Nokia <model no.> (USB) #2”.
To find out the COM port numbers, right-click the modems in the Device
Manager and inspect the Properties dialog.
See this screenshot of the Device Manager:
Nokia modems
LZT 108 9851 R1B
333
TEMS Investigation 9.0 Data Collection User’s Manual
Nokia UEs
•
For data service measurements, choose the virtual COM port number
assigned to the modem you selected when configuring Dial-up
Networking, i.e. preferably the port with the middle number.
•
For TEMS measurements, choose the virtual COM port number assigned
to one of the other “Nokia <model name> (USB)” modems. Tests have
indicated that it is best to choose the port with the highest number.
To find out the COM port numbers, right-click the modems in the Device
Manager and inspect the Properties dialog.
See this screenshot of the Device Manager:
Nokia modems
Qualcomm MSM6275 and MSM6280 Chipset Based UEs
A number of representative examples are given of how to connect these
terminals.
For the Qualcomm TM6275/TM6280 and Samsung ZX-10/ZX-20, do as
follows:
•
For TEMS measurements, choose the virtual COM port number assigned
to the port “Qualcomm Diagnostics Interface ...”.
•
For data service measurements, choose the virtual COM port number
assigned to the modem “Qualcomm USB Modem ...”. To find out the COM
port number, right-click this item in the Device Manager and inspect the
Properties dialog.
See this screenshot of the Device Manager:
334
Appendix C. Manual Enabling of External Equipment
Data service
measurements
TEMS
measurements
For the LG CU320/CU500, do as follows:
•
For TEMS measurements, choose the virtual COM port number assigned
to the port “LGE Mobile USB Serial Port”.
•
For data service measurements, choose the virtual COM port number
assigned to the modem “LGE Mobile USB Modem”. To find out the COM
port number, right-click this item in the Device Manager and inspect the
Properties dialog.
See this screenshot of the Device Manager:
Data service
measurements
TEMS
measurements
For the Option GT Max data card and other GlobeTrotter data cards, do as
follows:
•
For TEMS measurements, choose the virtual COM port number assigned
to the port “GlobeTrotter 3G+ Diagnostics Interface ...”.
•
For data service measurements, choose the virtual COM port number
assigned to the modem “GlobeTrotter 3G+ Modem Interface ...”. To find
out the COM port number, right-click this item in the Device Manager and
inspect the Properties dialog.
LZT 108 9851 R1B
335
TEMS Investigation 9.0 Data Collection User’s Manual
See this screenshot of the Device Manager:
Data service
measurements
TEMS
measurements
C.2.
Scanners
See also section 6.7.1.1, page 41.
PCTel SeeGull LX MM2 Scanners for GSM/WCDMA
These scanners connect via USB.
The scanner splits into two devices in TEMS Investigation: one for GSM and
one for WCDMA scanning. You therefore need to add the scanner twice in
the application.
•
Under Port:
–
For GSM scanning, choose the lower virtual COM port number.
–
For WCDMA scanning, choose the higher virtual COM port number.
See this screenshot of the Device Manager:
GSM scanning
WCDMA scanning
336
Appendix C. Manual Enabling of External Equipment
•
Under Equipment Channel, these choices exist for SeeGull:
–
“SeeGull LX GSM with GPS”: GSM scanning, scanner GPS in use
–
“SeeGull LX GSM”: GSM scanning, scanner GPS not in use
–
“SeeGull LX WCDMA with GPS“: WCDMA scanning, scanner GPS in
use
–
“SeeGull LX WCDMA”: WCDMA scanning, scanner GPS not in use
If you are scanning on both GSM and WCDMA, and you want to use the
scanner GPS, choose the GPS only for one device – otherwise the GPS data
will be written twice to the logfile.
PCTel SeeGull LX MM2 Scanners (CDMA)
These are handled the same way as the GSM/WCDMA models; see above.
Two choices are provided under Equipment Channel:
•
“SeeGull LX CDMA with GPS”: Scanner GPS in use
•
“SeeGull LX CDMA”: Scanner GPS not in use
PCTel SeeGull LX (Non-MM2 Models)
These scanners connect to a serial port.
•
Under Port, choose the port to which the scanner is connected.
•
Under Equipment Channel, make the appropriate choice: see the listing
for the MM2 models above. For example, for a single-band WCDMA
scanner, choose “SeeGull LX WCDMA and GPS” if you wish to use the
internal GPS of the scanner, and choose “SeeGull LX WCDMA” if you
wish to use a separate GPS unit, ignoring the scanner GPS.
C.3.
GPS Units
For all GPS units, only row 1 in the Add Equipment dialog is used. Row 2 is
grayed out.
•
Under Port, choose the correct port.
•
Under Equipment Channel, choose the correct GPS model/GPS protocol.
LZT 108 9851 R1B
337
TEMS Investigation 9.0 Data Collection User’s Manual
Appendix D. Text Export Format for
Logfiles
D.1.
General
The text export format for logfiles uses an ASCII representation with tab
delimited data. The default file extension is .fmt.
D.2.
File Header
The first line in the file contains column headers. Headers marked * are or
can be excluded in the reduced version of the text export file (see section
7.5.2.1, page 63):
•
Time
•
MS
•
Frame Number *
•
Direction
•
Message Type
•
Message ID *
•
Hexadecimal String *
•
Event
•
Event Info *
•
One header for each information element component exported,
composed of: the device designation (or All, if the data is exported for all
devices), the name of the information element, and the argument, if there
is one. Examples:
338
–
(GSM) All-RxLev Full, MS1-Neighbor BSIC [1]
–
(WCDMA) All-RRC State, MS1-AS CPICH Ec/No [1]
–
(CDMA) All-CDMA Rx State, MS1-Neighbor Set PN [2]
Appendix D. Text Export Format for Logfiles
Note that positioning data, too, is exported as ordinary information element
columns.
D.3.
Data
The remainder of the export file contains logfile data. Each line of data
represents one message. The table below describes the format of the data in
each column:
Column Header
Description/Format
Time
Current time: hh:mm:ss:tt, where tt = decimal seconds.
MS
Device designation: MSn or DCn (n is an integer).
Frame Number
Frame number of the TDMA frame. Integer in the
range 0 ... 2715648. (Valid only for GSM messages;
“Not Valid” for WCDMA and CDMA messages.)
Direction
Direction of the message: UL, DL, or Internal.
Message Type
Type of message, e.g.
•
(GSM) Paging Request Type 1, Synch Channel
Information
•
(WCDMA) System Information Block, UE IntraFreq Report
•
(CDMA) EV-DO Power, Pilot Sets, Searcher
General Status
Message ID
Integer denoting message type.
Hexadecimal
String
The message expressed as a string of hexadecimal
digits in groups of two, e.g. F6 96 01 00 ...
Event
Event triggered by the message, if any.
Event Info
Event parameters, if any. Example (WCDMA, Radio
Link Addition): SC added: 1, SHO type: unknown,
Event type: e1a.
Information
element
columns
Value of information element component.
LZT 108 9851 R1B
339
TEMS Investigation 9.0 Data Collection User’s Manual
Appendix E. Notes on Third-party
Logfile Export Formats
Compare section 7.5, page 59 on logfile export.
E.1.
Export to MapInfo
For both Interchange and Tab format, “Version 300” is exported.
Exported files for each logfile (Interchange):
•
*.mif – graphics data in ASCII (e.g. format version, symbol information)
•
*.mid – textual data in ASCII (e.g. MS information, event/message texts)
Exported files for each logfile (Tab):
•
*.tab – table structure in ASCII (e.g. format version, field definitions)
•
*.dat – table date storage in binary format (e.g. message information)
•
*.map – storage of map objects in binary format
•
*.id – links to the *.map file in binary format
E.2.
Export to ArcView
ArcView 3.2 for Windows has been used to verify the export function. The
export file format itself is based on the document “ESRI Shapefile Technical
Description” (ESRI White Paper, July 1998), available on the Web at
www.esri.com/library/whitepapers/pdfs/shapefile.pdf.
Exported files for each logfile:
•
*.shp – main file in binary format, containing header, symbol, and data
related information in records
•
*.shx – binary format index file for the *.shp file
•
*.dbf – dBase table file with message information in attribute records
(events, messages, MS indication, etc.)
340
Appendix E. Notes on Third-party Logfile Export Formats
E.3.
Export to Marconi Planet
The specification adhered to in this case is “Planet DMS Test Mobile Generic
File Format”, with “Version” set to “1.0” by TEMS Investigation.
Exported file for each logfile:
•
*.txt – ASCII format file with data in “header”, “definition”, and “main”
sections (as defined by the above-mentioned specification)
E.4.
Export to Ethereal
Exported file for each logfile:
•
*.eth – Ethereal format file
E.5.
Export to MDM
Normally, one MDM file is exported for each device channel found in the
logfile. For example, if the logfile contains MS1, MS2, and MS3, the export
will produce three files named
<original logfile name>_MSn_<mdm name>
where n = 1, 2, 3, and <mdm name> is given in a format which can be
exemplified by:
m0108371.411
This is interpreted as follows:
m
01
08
37
1.4
11
days
hours
minutes
seconds
(14)
two final digits of
the phone’s MIN
If a device was disconnected during recording of the logfile, the
corresponding MDM file will be closed at that point, and the export will
continue to a new MDM file for that device.
LZT 108 9851 R1B
341
TEMS Investigation 9.0 Data Collection User’s Manual
Appendix F. Logfile Report
This appendix describes the layout and contents of the HTML file created by
the logfile report generator.
The overall structure of the HTML file appears from the following figure. The
contents of each part is described in a separate section below. Statistics on
network parameters, and all scan data content, appear only insofar as the
appropriate categories have been selected in the Report Generator wizard
(see section 7.6, page 69).
Header
Logfile information
Statistics
Worst cell indication
Thresholds
Events
Scan data
Charts
Distribution parameters
Scan data
Logfile report layout.
342
Appendix F. Logfile Report
F.1.
Header
The header shows the date and time when the report was generated, as well
as the user name (“Prepared by”) and report number entered in the
Properties dialog (section 7.6.5, page 73).
F.2.
Logfile Information
Under this heading the following is indicated for each logfile:
•
the logfile name
•
what external devices (apart from a GPS) were used to record the logfile
•
whether a GPS unit was used when recording.
In addition this section contains
•
the total duration of all logfiles
•
the MS designations of the external devices (“MS1”, etc.)
•
(if scanning has been performed) a table listing all scanned channels/
scrambling codes, with links to the scan data graphs for individual
channels/SCs, to the corresponding rows in the scan data statistics table
(“s” links), and to the logfile or logfiles containing the data on each
channel/SC. The purpose of the table is to give a compact overview of the
scan and the channels/SCs covered.
F.3.
Statistics
Worst Cell Indication
This section ranks cells on the basis of how often parameter thresholds have
been crossed 1 and events triggered in each cell. Crossing one threshold
adds one point to the #Thresholds score; crossing both thresholds adds two
points. Each occurrence of an event adds one point. The threshold and event
counts are weighted and combined, giving a single ranking of the cells. The
worst cell is at the top of the list.
1. i.e. for a “greater than” condition, how many times the parameter has
exceeded the threshold; for a “less than” condition, how many times it
has dropped below it.
LZT 108 9851 R1B
343
TEMS Investigation 9.0 Data Collection User’s Manual
Note that the ranking can be based on arbitrary phone information elements
and events.
Thresholds
The following is reported for each information element and threshold chosen:
•
How many times the element has crossed the threshold
•
The average duration of the dips/peaks
•
The cell or cells in which the threshold was crossed
•
The logfile or logfiles in which the threshold was crossed.
Events
The following statistics are reported for each event:
•
Number of occurrences
•
The cell or cells in which the event occurred
•
The logfile or logfiles in which the event occurred.
Scan Data
The following is reported for each channel scanned:
•
Number of measurement samples
•
Mean, median, minimum and maximum code power (averaging in mW
domain)
F.4.
Charts
Network Parameters
Distribution bar charts are drawn for all information elements that are
compared with thresholds. The cumulative relative frequency1 of the
observations is plotted in each chart.
1. The cumulative relative frequency of a value a is the percentage of
observations that are less than or equal to a.
344
Appendix F. Logfile Report
cumulative
relative
frequency
number of observations
The charts are saved in JPEG files; see section F.5.1 below.
If you have defined custom ranges for an element, the distribution chart is
drawn using one bar for each range, and a table is appended listing the
values of the PDF (probability distribution function) and CDF (cumulative
distribution function) for each range.
If no data is available for a particular chart, this is indicated in the HTML file
by a text string (“No <IE name> data available”), and no chart appears.
Scan Data
•
GSM: An RxLev chart is drawn for each channel.
•
WCDMA: An Ec/Io chart is drawn for each scrambling code.
•
CDMA: A PN Scan bar chart is drawn for each RF channel. A Strongest
Scanned PN bar chart is also drawn.
In either case, the scan data charts follow after the network parameter charts.
F.5.
File and Directory Naming
F.5.1.
Files
For each report, a new directory will be created under GeneratedReports and
contain the following files:
•
index.htm: HTML file with header, statistics, and links to JPEG images
LZT 108 9851 R1B
345
TEMS Investigation 9.0 Data Collection User’s Manual
•
One JPEG file for each information element appearing in the threshold
comparisons, files being named according to the format
<IE name>_<argument>.jpg
•
One JPEG file for each scanned channel/scrambling code/pilot, files
being named according to the format
Scan_<channel/SC/pilot no.>[<frequency band>].jpg
•
Some auxiliary graphics files.
F.5.2.
Directory
The directory name has the syntax
<prefix><month_nr><day_nr>_<index><suffix>
where <prefix> and <suffix> are the optional user-specified logfile prefix and
suffix, <month_nr> and <day_nr> indicate the day on which the report was
generated, and <index> is an incrementing counter used to distinguish
between reports generated during the same day.
346
Appendix G. KPI Report (UMTS)
Appendix G. KPI Report (UMTS)
This appendix describes the contents of the KPI report.
KPIs are computed separately for each Location Category label.
See chapter 25, page 290 for a general introduction to KPIs.
Detailed technical definitions of all KPIs are provided in separate documents
which are found on the installation CD in the subdirectory Documents.
G.1.
Report Header
The header shows
•
the report number (“Report number” field in KPI report properties: section
7.7.2, page 76)
•
the date and time when the report was generated
•
who prepared the report (“User name” field in KPI report properties).
G.2.
Overview of KPIs for Circuit-switched
Services
LZT 108 9851 R1B
347
TEMS Investigation 9.0 Data Collection User’s Manual
G.2.1.
Diagram of Circuit-switched KPIs and Timeouts
start of
measurement
cycle
Service Access
timeout
service access (call setup)
call
time
KPI: Service
Non-Accessibility
KPI:
Setup Time
KPI: Call Cut-off
Ratio
KPI: Speech Quality
on Sample Basis
KPI: Speech Quality,
Call Average
KPIs and timeouts for voice and video telephony.
348
Appendix G. KPI Report (UMTS)
G.2.2.
Service Non-Accessibility [%]
Denotes the probability that the end-customer cannot access the service
when requested although the phone indicates having network coverage.
G.2.3.
Setup Time [s]
Denotes the time between sending of complete address information and
receipt of call setup notification.
G.2.4.
Speech Quality on Sample Basis [dBQ]
Denotes the end-to-end speech quality computed sample by sample.
The quality is that judged by the old SQI algorithm; at present no KPI
reflecting the new SQI-MOS score is provided. See chapter 26.
G.2.5.
Speech Quality, Call Average [MOS-PESQ]
Denotes the average speech quality during a call.
The quality is judged using the PESQ algorithm (see chapter 27). The
averaging is done in two steps: first the average PESQ is computed for each
call, and then a new average is taken over all single-call PESQ scores. In
other words, all calls are given equal weight.
G.2.6.
Call Cut-off Ratio [%]
Denotes the probability that a successfully set up call is ended by a cause
other than the intentional termination by either party.
G.3.
Overview of KPIs for Packet-switched Services
KPIs are calculated for all supported data services except SMS.
For FTP, HTTP and e-mail, the set of KPIs is the same. For WAP, only one
step is added. For MMS and streaming, on the other hand, the KPIs are more
divergent.
It is helpful to consider all KPIs, as well as their associated user-configurable
timeouts (section 7.7.1, page 75), within the framework of packet-switched
LZT 108 9851 R1B
349
TEMS Investigation 9.0 Data Collection User’s Manual
sessions. See the diagrams on the following pages depicting such sessions.
Listings of KPIs follow in sections G.3.2–G.3.6.
350
Appendix G. KPI Report (UMTS)
G.3.1.
Diagrams of Packet-switched KPIs and Timeouts
start of
measurement
cycle
KPI: IP Service
Access Failure Ratio
KPI: Attach Failure
Ratio
KPI: Network
Unavailability
PS attach
Timeouts
Service
Access
KPI: PDP Context
Activ. Failure Ratio
PDP
Context
Activation
Attach
PDP ctx act. service access
data transfer
time
KPI:
Attach
Setup
Time
KPI:
PDP
Context
Activation
Time
KPI:
IP Service
Setup
Time
KPI: PDP Context Cut-off Ratio
KPI: Service
Non-Accessibility
KPI:
Setup Time
KPI: Data Transfer
Cut-off Ratio
KPI: Mean Data
Rate
KPIs and timeouts for FTP, HTTP, and e-mail.
LZT 108 9851 R1B
351
TEMS Investigation 9.0 Data Collection User’s Manual
start of
measurement
cycle
PDP
Context
Activation
PS attach
PDP ctx act.
Timeouts
Service
Access
KPI: WAP Activation
Failure Ratio
WAP
Activation
KPI: PDP Context
Activ. Failure Ratio
KPI: Network
Unavailability
KPI: Attach Failure
Ratio
Attach
WAP activ.
service access
data transfer
time
KPI:
Attach
Setup
Time
KPI:
PDP
Context
Activation
Time
KPI: PDP Context Cut-off Ratio
KPI: WAP
Activation
Time
KPI: IP Service
Access Failure Ratio
KPI: Data Transfer
Cut-off Ratio
KPI: IP Service
Setup Time
KPI: Mean Data
Rate
KPI: Service Non-Accessibility
KPI: Setup Time
KPIs and timeouts for WAP.
352
Appendix G. KPI Report (UMTS)
start of
measurement
cycle
KPI: WAP Activation
Failure Ratio
KPI: Attach Failure
Ratio
KPI: Network
Unavailability
PS attach
Timeouts
WAP
Activation
KPI: PDP Context
Activ. Failure Ratio
PDP
Context
Activation
Attach
PDP ctx act. WAP activ.
data transfer
time
KPI:
Attach
Setup
Time
KPI:
PDP
Context
Activation
Time
KPI: PDP Context Cut-off Ratio
KPI:
WAP
Activation
Time
KPIs and timeouts for MMS (diagram 1 of 2).
These KPIs apply equally to both sending and receiving.
LZT 108 9851 R1B
353
354
KPIs: MMS End-to-end Delivery Time (MO/MT)/
End-to-end Failure Ratio
KPIs and timeouts for MMS (diagram 2 of 2).
MT transfer
MMS
Notification
KPIs: MMS Retrieval Time/
Retrieval Failure Ratio (MT)
WAP activation
PDP ctxt activation
Timeouts
receiver notification
MO transfer
MMS
Transfer
MO
KPIs: MMS Notification Time/
Notification Failure Ratio
KPIs: MMS Send Time/
Send Failure Ratio (MO)
WAP activation
PDP ctxt activation
TEMS Investigation 9.0 Data Collection User’s Manual
start of
measurement
cycle
MMS
Transfer
MT
time
Appendix G. KPI Report (UMTS)
start of
measurement
cycle
PDP
Context
Activation
PS attach
Timeouts
Service
Access
KPI: PDP Context
Activ. Failure Ratio
KPI: Network
Unavailability
KPI: Attach Failure
Ratio
Attach
data transfer
reproduction
PDP ctx act. service access
time
KPI:
Attach
Setup
Time
KPI:
PDP
Context
Activation
Time
KPI: PDP Context Cut-off Ratio
KPI: Reproduction Start Failure Ratio
KPI: Reproduction Start Delay
KPI: Service
Non-Accessibility
KPI: Reproduction
Cut-off Ratio
KPI: Service
Access Time
KPI: Streaming
Quality
KPIs and timeouts for streaming.
LZT 108 9851 R1B
355
TEMS Investigation 9.0 Data Collection User’s Manual
G.3.2.
Service Independent KPIs
Network Unavailability [%]
Denotes the probability that no packet-switched network is available in the
cell currently used by the customer.
In GSM, the phone has access to a PS network if it has received System
Information 13. This message is read once per KPI measurement cycle, at
the beginning of the cycle.
In WCDMA, matters are simpler: the phone is always known to have access
to a PS network.
The information element “Mode - System” in TEMS Investigation indicates
whether the phone is connected to a WCDMA or a GSM network.
Attach Failure Ratio [%]
Denotes the probability that a subscriber cannot attach to the GPRS/UMTS
PS network.
Attach Setup Time [s]
Denotes the length of the time period taken to attach to the GPRS/UMTS PS
network.
PDP Context Activation Failure Ratio [%]
Denotes the probability that the PDP context cannot be activated. It is the
ratio of unsuccessful PDP context activation attempts to the total number of
PDP context activation attempts.
PDP Context Activation Time [s]
Denotes the length of the time period taken to activate a PDP context.
PDP Context Cut-off Ratio [%]
Denotes the probability that a PDP context is deactivated without this being
initiated intentionally by the user.
PDP context deactivation not initiated intentionally by the user can be caused
by either SGSN failure or GGSN failure, so the PDP context may be
deactivated either by the SGSN or by the GGSN.
356
Appendix G. KPI Report (UMTS)
Note: The precondition for measuring this parameter is that a PDP
context has been successfully established.
G.3.3.
General Data Service KPIs
The following KPIs are computed for all or many of the data services
supported (as indicated in the above diagrams):
Service Non-Accessibility [%]
Denotes the probability that a subscriber cannot access the service
successfully due to a failure that has occurred either during PDP context
activation or during service access. This means that the data transfer cannot
be started.
Note: This KPI is defined differently for streaming. See section G.3.6.
Setup Time [s]
Denotes the period of time it takes to access a service successfully, from the
moment the dial-up connection is established until the first data packet is
received.
IP Service Access Failure Ratio [%]
Denotes the probability that, after successfully activating a PDP context, a
subscriber cannot access the service, so that the data transfer cannot be
started.
IP Service Setup Time [s]
Denotes the time period needed to establish a TCP/IP connection to the FTP
server, from sending the initial query to a server until the first data packet is
received.
Mean Data Rate [kbit/s]
Denotes the average data rate measured throughout the entire connect time
(application throughput).
LZT 108 9851 R1B
357
TEMS Investigation 9.0 Data Collection User’s Manual
Data Transfer Cut-off Ratio [%]
Denotes the probability that a data transfer cannot be completed when it has
been started successfully.
G.3.4.
WAP KPIs
For WAP, one more step is added to the procedure of setting up the data
connection: activating the WAP session.
WAP Activation Failure Ratio [%]
Denotes the probability that the subscriber cannot activate the WAP session.
WAP Activation Time [ms]
Denotes the length (in ms) of the time period taken to activate the WAP
session.
G.3.5.
MMS KPIs
For MMS, the KPI structure is more complex and multi-tiered than for the
other services; the top-level KPI (MMS End-to-End Delivery Time) spans both
sending, notifying, and receiving.
The MMS session setup involves WAP activation, so the WAP KPIs (see
section G.3.4 above) are computed for MMS also.
The following KPIs are MMS-specific:
MMS Send Failure Ratio (MO) [%]
Denotes the probability that the subscriber cannot send an MMS message
despite having requested to do so by pushing the “send” button.
(The chain of operations is: PDP Context Activation → Service Access →
WAP Activation → MMS Send.)
MMS Retrieval Failure Ratio (MT) [%]
Denotes the probability that the MMS message cannot be downloaded by the
receiving party's phone, although the latter has received an MMS notification.
358
Appendix G. KPI Report (UMTS)
MMS Send Time (MO) [s]
Denotes the length of time (in seconds) elapsing from the moment the sender
pushes the “send” button until the MMS data transfer to the MMSC is
completed.
MMS Retrieval Time (MT) [s]
Denotes the length of time (in seconds) elapsing from the WAP Get Request
until the completion of the MMS download from the MMSC.
MMS Notification Failure Ratio [%]
Denotes the probability that the Multimedia Messaging Service is not able to
deliver a notification of a successfully sent MMS message to the receiving
party's phone.
MMS Notification Time [s]
Denotes the length of time (in seconds) elapsing from the moment the MMS
data transfer to the MMSC is completed until the receiving party receives the
MMS notification.
MMS End-to-End Failure Ratio [%]
Denotes the probability that an MMS cannot be conveyed successfully from
sender to receiver, that is, a failure occurs somewhere along the line after the
sender has pressed the “send” button and before the receiver is able to
download it.
MMS End-to-End Delivery Time (MO/MT) [s]
Denotes the length of time (in seconds) elapsing from the moment the sender
pushes the “send” button until the receiver has completed the MMS download
from the MMSC.
G.3.6.
Streaming KPIs
Streaming-specific KPIs are as follows:
Service Non-Accessibility [%]
Denotes the probability that the first RTP data packet of the stream cannot be
received by the phone when requested by the user. The reception of a packet
LZT 108 9851 R1B
359
TEMS Investigation 9.0 Data Collection User’s Manual
is completed by the appearance of a “buffering” message in the user's
streaming client.
Service Access Time [s]
Denotes the duration of a service access from requesting the stream at the
portal until the reception of the first stream data packet by the phone.
Reproduction Cut-off Ratio [%]
Denotes the probability that a successfully started stream reproduction is
ended by a cause other than the intentional termination by the user.
Possible causes for stream reproduction cut-off include:
•
Radio bearer loss
•
Synchronization errors
•
Streaming server/system failure/errors
•
Protocol errors
•
Streaming player failure/errors
Streaming Quality [MOS-VSQI]
Denotes the quality of the stream reproduction as assessed by the VSQI
algorithm. VSQI takes both audio and video into account.
Reproduction Start Failure Ratio [%]
Denotes the probability of unsuccessful stream reproduction.
Reproduction Start Delay [s]
Denotes the time elapsing from reception of the first stream data packet by
the phone until the phone starts reproducing the stream.
G.4.
Timeouts
The timeout values set in the KPI report properties (section 7.7.1, page 75)
are reproduced in the report:
•
Attach timeout
•
PDP context activation timeout
•
Service access timeouts (service-specific)
360
Appendix G. KPI Report (UMTS)
•
WAP activation timeout
•
MMS timeouts: MMS transfer MO, MMS notification, MMS transfer MT
G.4.1.
Interdependence of KPIs; Dependence of KPIs on
Timeouts
It should be noted that there is a correlation between KPIs measuring failure
ratios and KPIs measuring times. This is because in the computation of the
latter, only successes are taken into account while failures are disregarded.
The frequency of success is in turn dependent on the timeout settings.
For example, the KPIs Service Non-Accessibility and Setup Time are
correlated. Moreover, the lower the corresponding timeouts are set, the lower
the average setup time (i.e. in the cases where the setup was deemed
successful) and the higher the non-accessibility percentage, and vice versa.
G.5.
Logfile Information
This section contains:
•
the logfile or logfiles in which the KPI data was recorded
•
the data services used in each logfile
•
the categories with which the KPI measurements were labeled (Category
parameter in command sequence: section 12.13, page 163).
G.6.
File and Directory Naming
G.6.1.
Files
For each report, a new directory will be created under GeneratedReports and
contain the following files:
•
index.xml: XML file with all textual information and links to JPEG images
•
JPEG files with bar charts for KPIs and PIs denoting times, data rates,
and message sizes.
•
Some auxiliary graphics files.
LZT 108 9851 R1B
361
TEMS Investigation 9.0 Data Collection User’s Manual
G.6.2.
Directory
The directory name has the syntax
<prefix><month_nr><day_nr>_<index><suffix>
where <prefix> and <suffix> are the optional user-specified logfile prefix and
suffix, <month_nr> and <day_nr> indicate the day on which the report was
generated, and <index> is an incrementing counter used to distinguish
between reports generated during the same day.
362
Appendix H. Technical Notes on PCTel Scanners
Appendix H. Technical Notes on
PCTel Scanners
These notes apply to all supported PCTel SeeGull LX and EX scanners.
H.1.
Reference Point for Signal Level
Measurement
The signal level reported by the scanner is that measured at the scanner’s
antenna connector. No adjustment is made in the scanner to compensate for
antenna or cable loss.
H.2.
Antenna Cable Attenuation
The magnetic mount antenna provided with the scanner is a 0 dBd gain
antenna.
The Smarteq cable loss at 2 GHz is specified at 1.86 dB per meter cable
maximum. If the length of the cable is 2.6 m, the maximum loss from the
antenna to the scanner at 2 GHz is 4.84 dB.
The following table shows the attenuation at various frequencies:
Frequency
(MHz)
Attenuation
(dB/m cable)
Total Attenuation of
2.6 m Cable (dB)
900
0.90
2.34
1800
1.33
3.46
1900
1.39
3.61
2000
1.86
4.84
2100
1.47
3.82
LZT 108 9851 R1B
363
TEMS Investigation 9.0 Data Collection User’s Manual
364
Index
Index
A
Access Class Control tab (Sony Ericsson phone properties) 180
Anritsu scanners 92
CPICH scanning with 99
enabling ML8720 model 41
enabling ML8740/8741 models 42
importing files logged by Anritsu ML8720 (i.e. in Anritsu format) 59
plugging in ML8720 model 36
plugging in ML8740/8741 models 36
Answer command (in command sequences) 146
AQM 7, 298
manually entering phone number 47
merging uplink AQM data into logfiles 301
obtaining AQM data in TEMS Investigation 298
practical considerations regarding collection of AQM data 300
prerequisites for collecting AQM data 300
presenting AQM data 302
recording AQM data 300
AQM modules
associating with phones in TEMS Investigation 46
plugging in 37
ArcView 59, 66
arguments of information elements 15
AT commands, giving to phones 147
attach (to packet service) 151
audio indications for events 208
activating 209
adding 208
deactivating 209
deleting 210
editing 209
muting 209
saving and loading 210
Audio Indications window 208, 209
audio quality measurements (AQM) 298
LZT 108 9851 R1B
365
TEMS Investigation 9.0 Data Collection User’s Manual
autodetect function
excluding ports from autodetect procedure 45
for equipment not covered by license 40
restarting 43
scope of 39
B
Band/Channel Control tab (Nokia GSM phone properties) 196
Band/Channel Control tab (Nokia UE properties) 195
bar charts 240
adding charts 243
Additional Information pane 243
Chart pane 242
deleting a chart 243
editing general properties of individual chart panes 244
examples of presentations 256
exporting 258
interval on x-axis 254
labeling of x-axis 254
Legend pane 242
Multiple IE Components presentation mode 247
organization of window 241
parallel coordinates 250
Parallel Coordinates/Stacked Bar Chart presentation mode 250
presentation mode 245
presenting data from a different device 255
selecting additional information 255
selecting colors 245
selecting data to display 245
setting up contents 244
setting up general properties 243
Single IE presentation mode 246
stacked bar chart 250
X-axis pane 242
Y-axis pane 242
Basic Logs tab (Motorola UE properties) 191
basics of Data Collection application 17
BCH scanning
presentation of 108
setting up 96
with Sony Ericsson Z750i 5
BLER Target tab (Sony Ericsson phone properties) 182
366
Index
C
C/I measurements (GSM) 6, 309
Call tab (Sony Ericsson phone properties) 181
CAS Speech Codec tab (Sony Ericsson phone properties) 190
CAS System Capability Control tab (Sony Ericsson phone properties) 183
Cell Barring tab (Motorola UE properties) 194
Cell Barring tab (Nokia GSM phone properties) 196
Cell Barring tab (Nokia UE properties) 195
cell data
loading from TEMS CellPlanner 33
using in presentations 33
cell files
creating in CEL format 33
creating in XML format 32
in CSV format 32
loading 33
cell reselection behavior (Sony Ericsson phones) 188
channel groups (GSM scanning) 91
channel verification (GSM) 315
color attribute (of information element) 212
editing 29
command sequences 137
adding a command 139
application testing commands 147
assigning commands to phones 140
capabilities of phones 137
categories of commands 140
composing 137
data session error messages 169
deleting a command 140
disabling a command 168
editing 140
equipment control commands 147
general commands 143
loops 139, 143
moving a command 140
phonebook entries 151
properties of 166
recording commands 144
running 167
running a single command in 168
running multiple 168
LZT 108 9851 R1B
367
TEMS Investigation 9.0 Data Collection User’s Manual
saving and loading 169
stopping 167
stopping and restarting devices 167
synchronization of phones 164
timeout parameters 142
timeout parameters for session commands 152
tips and tricks 164
voice/video commands 145
Configuration menu 27
connecting external equipment in TEMS Investigation 35
contents of Data Collection User’s Manual 13
control function support in devices, overview of 178
Control menu 27
copying logfiles 57
CPICH Best UARFCN Data window (WCDMA) 104
CPICH Data window (WCDMA) 104
CPICH Scan bar charts (WCDMA) 103
CPICH Scan line charts (WCDMA) 105
CPICH scanning 94
with Sony Ericsson Z750i 5
CW scanning (WCDMA) 112
CW scanning (WiMAX) 136
D
Data Collection application 2
Data Reduction tab (properties dialog for Qualcomm chipset based CDMA devices) 201
data service testing 14, 15, 137, 147
dialup 150
e-mail, receiving 157
e-mail, sending 157
FTP 153
general KPIs for 357
HTTP 155
MMS 160
Ping 156
presentation of 169
SMS 161
video streaming 158
video streaming (UMTS) 227
WAP 162
data session error messages 169
e-mail 173
368
Index
FTP 172
general 170
MMS 175
RAS 171
video streaming 174
WAP 177
definitions of TEMS Investigation concepts 15
detach (from packet service) 151
device properties 178
Dial command (in command sequences) 145
Dial Up command (in command sequences) 150
Dial-up Networking 148
Discard Messages tab (Sony Ericsson phone properties) 182
drive testing mode 20
DRT4301A scanner 133
plugging in 36
E
e-mail
error messages 173
testing 157
equipment cases 14
plugging in 37
Equipment Configuration window 37
EQ item context menu 46
presentation of autodetected devices 39
properties dialog 45
refreshing 43
re-pairing phones with AQM modules 44
saving configuration in Windows registry 43
equipment properties 178
Ethereal 59, 67
Event Counter windows 220
changing contents and properties of 221
copying contents from 220
managing tabs in 220
resetting 221
Event Definition window 203
events 15, 203
audio indications for 208
deleting user-defined 206
editing user-defined 206
example of user-defined event 206
LZT 108 9851 R1B
369
TEMS Investigation 9.0 Data Collection User’s Manual
predefined and user-defined 203
presentation of 203
user-defined, setting up 203
Extended Logs tab (Motorola UE properties) 192
external equipment 13
automatic detection (enabling) of in TEMS Investigation 39
connectable devices 3
connecting in TEMS Investigation 35, 47
disabling in TEMS Investigation 47, 49
disconnecting in TEMS Investigation 48
manual enabling of 332
plugging in 36
F
FAQ (on TEMS website) 14
fast-forwarding logfiles 56
File menu 26
file types in Data Collection 331
filemarks
inserting in logfiles 51
quick filemarks 53
finding items in logfiles 56
fix source for GPS 230
FTD (Field Test Display) tab (Nokia GSM phone properties) 197
FTP error messages 172
fundamentals of TEMS Investigation 2
G
GAN Mode Selection tab (Nokia GSM phone properties) 198
General window 33, 109, 289
GeoSet 260
constructing from map files 260
GeoSet Manager 288
layer control 288
map projections 288
Getting Started Manual, contents of 13
GlobeTrotter PC Cards
enabling manually 335
GPS fix source 230
GPS units
enabling manually 337
plugging in 37
properties of 202
370
Index
GPS window 230
properties of 230
GSM Band Control tab (Sony Ericsson phone properties) 187
GSM C/A tab (Sony Ericsson phone properties) 187
GSM channel verification 315
adding test cases 316
creating test reports 323
editing test cases 317
error conditions 324
manual and automatic 317
notes on performance 324
opening tests 324
removing test cases 317
resetting test cases 322
running the test 320
saving tests 324
status of test cases 322
stopping the test 322
test 316
test case 315
test case group 316
GSM Dedicated Mode tab (Sony Ericsson phone properties) 187
GSM EDGE Capability tab (Sony Ericsson phone properties) 188
GSM Idle Mode tab (Sony Ericsson phone properties) 188
GSM Speech Codec tab (Sony Ericsson phone properties) 190
GSM TxPower Control tab (Sony Ericsson phone properties) 190
H
handover behavior (Sony Ericsson phones) 187
Hang Up command (in command sequences) 150
hardware key 50, 55
Help menu 27
HTTP, testing 155
I
in-building positioning 53
indoor positioning 53
information elements 15, 211
installing TEMS Investigation 17
IP Analysis window
activating the protocol analysis function in 225
IPv6 166
LZT 108 9851 R1B
371
TEMS Investigation 9.0 Data Collection User’s Manual
K
keyboard shortcuts 27, 327
KPI reports 74
contents of 347
timeouts 75
user details 76
KPI samples (exported from logfile) 67
KPIs (Key Performance Indicators) 290
accessibility 290
dependence on timeouts 361
for circuit-switched services 347
for packet-switched services 349
integrity 291
interdependence of 361
obtaining by means of command sequences 163
obtaining in TEMS Investigation (overview) 291
purpose of 290
retainability 291
service-independent 356
timeouts 360
L
labels 260
Layer 3 Ignore tab (Motorola UE properties) 194
layers in Map window 260, 283
LG CU320
enabling manually 335
LG CU500
enabling manually 335
licensing in TEMS Investigation 3
line chart
adding charts 235
Additional Information pane 234
changing contents and properties 235
Chart pane 233
deleting a chart 239
editing contents 235
editing general properties 235
exporting 239
Legend pane 234
organization of window 232
presenting data from a different device 239
selecting additional information 239
372
Index
selecting events 238
selecting information elements 236
time scale 234
Y-axis pane 234
line charts 232
loading logfiles from other sources 58
Lock on PLMN tab (Sony Ericsson phone properties) 182
Logfile menu 26
logfile recording 50
adding user information 53
clearing history buffer 53
default folder 53
inserting filemarks 51
other options 52
Properties dialog 52
quick logging 53
swapping logfiles 52
logfile reports 69
contents 74
event statistics 72
external devices to include 72
layout and contents of 342
saving and loading setups 73
scanned channels 73
thresholding of information elements 70
user details 73
logfiles
copying 57
exporting 59
ArcView settings 66
Ethereal settings 67
executing export orders 68
MapInfo settings 65
MDM settings 67
notes on third-party export formats 340
Planet settings 67
saving and loading setups 68
text export format 338
text file settings 63
fast-forwarding 56
loading from other sources 58
recording 50
LZT 108 9851 R1B
373
TEMS Investigation 9.0 Data Collection User’s Manual
replaying 55
rewinding 55
searching 56
stepping 56
stopping 55
Loop command (in command sequences) 143
M
manual enabling of external devices 40
Map window 260
information on theme markers 281
layers 260, 283
adding presentation layers 284
control of 284
map layer 260
presentation layers 260, 264
Legend tab 283
previous view, returning to 286
right-hand pane 281
scale bar 286
setting projection for 286
statistics 282
toolbar 286
viewing entire layer 286
Map windows 259
MapInfo 59, 65
maps 259, 260
centering 287
constructing a GeoSet from map files 260
GeoSet 260
labels 260
notes on route plotting and updating 267
panning 287
positioning maps in bitmap or TIF format 262
themes 260, 263
zooming 287
Marconi Planet 59, 67
MDM 67
export in MDM format 59
loading MDM files in Data Collection 59
menu bar 19, 26
merging logfiles with uplink data 76
374
Index
message windows 222
catch-up function 224
changing contents and properties of 222
freezing 225
plain-text message decoding 223
presentation of discarded messages 224
synchronization of 224
messages 16
Messages Control tab (Sony Ericsson phone properties) 182
MMS
error messages 175
KPIs for 358
send failure causes 176
testing 160
mode reports 16
Mode Reports window
adjusting updating frequency for Qualcomm reports 226
modules of TEMS Investigation 2
Motorola UEs
enabling manually 333
reading EFEM logfiles from 59
Motorola UEs, properties of 190
Basic Logs tab 191
cell barring 194
control functionality 192
Extended Logs tab 192
GSM channel lock 193
ignoring Layer 3 messages 194
lock to RAT/band/frequency/cell 193
logs 190
RAT lock 193
sector lock 193
SMS 194
UARFCN lock 193
UE handling 193
MTR data 312
MTR files 59, 312
N
Navigator 19
Info Element tab 28
Menu tab 28
Worksheets tab 31
LZT 108 9851 R1B
375
TEMS Investigation 9.0 Data Collection User’s Manual
Navigator pane 28
network search (WCDMA scanning mode) 117
presentation 119
setting up 118
with Sony Ericsson Z750i 6
Nokia GSM phones
enabling manually 333
Nokia GSM phones, properties of
Band/Channel Control tab 196
Cell Barring tab 196
FTD (Field Test Display) Log Mask tab 197
GAN Mode Selection tab 198
Trace Log Mask tab 199
Nokia UEs
enabling manually 334
Nokia UEs, properties of 195
Band/Channel Control tab 195
Cell Barring tab 195
RAT Lock tab 195
Sector Lock tab 195
NV Item Read/Write tab (properties dialog for Qualcomm chipset based UMTS
devices) 201
O
online help 27
Option GT Max PC Card
enabling manually 335
P
package options for TEMS Investigation 3
parallel coordinates 250
PCTel SeeGull scanners 92, 123
antenna cable attenuation 363
built-in GPS 92, 123, 337
CPICH scanning with 97
enabling manually
LX MM2 336
LX models using serial connection 337
GSM scanning with 85
plugging in
EX 36
LX MM2 36
LX models using serial connection 36
376
Index
reference point for signal level measurement 363
PESQ 298
phones 16
plugging in 36
properties of 180
Ping, testing 156
pinpointing 53
presentation on map 279
tips 55
plotting density in Map window 267
preamble scanning (WiMAX) 134
presentation attributes of information elements 29
presentation layers 264
Presentation menu 27
presentation of data 211
presentation windows
export/import of 213
synchronization 212
types of 211
updating 212
Q
Qualcomm chipset based devices
enabling manually in TEMS Investigation
MSM6275 and MSM6280 chipsets 334
Qualcomm chipset based devices, properties of 200
Data Reduction tab (CDMA) 201
NV Item Read/Write tab (UMTS) 201
Qualcomm TM6275
enabling manually 334
Qualcomm TM6280
enabling manually 334
quick filemarks 53
quick guide to user interface 18
quick logging 53
R
RAN Tuning 3
collecting data for 165
RAS error messages 171
RAT Control tab (Sony Ericsson phone properties) 183
RAT Lock tab (Nokia UE properties) 195
RAT/Band/Frequency/Cell Lock tab (Motorola UE properties) 193
LZT 108 9851 R1B
377
TEMS Investigation 9.0 Data Collection User’s Manual
Readme file 14
recommended skills 17
recording logfiles 50
redialing calls 22
Release Note 14
replay mode 20
replaying a logfile 55
progress indication on status bar 57
speed 56
viewing logfile information 57
Report Generator 69
reports on logfiles 69
rewinding logfiles 55
Route Analysis application 3
Route Analysis User’s Manual 13
RSSI scanning (WiMAX) 136
S
Samsung ZX-10
enabling manually 334
Samsung ZX-20
enabling manually 334
Scan Bar Chart (GSM) 90
scanners 16
plugging in 36
Scanning menu 27
scanning, CDMA 123
"PN Scan" bar charts 128
CW Scan Bar Chart 132
CW scanning 129
manual selection of pilots/RF channels 128
methods 123
of pilots 124
performing a scan 124
recording scan data 124
scanning capacity 123
Strongest Scanned PN Bar Chart 129
scanning, GSM 85
BSIC decoding in Frequency Scanning mode 88
C/I scanning 89
CW scanning 89
defining channel groups 91
Frequency Scanning mode 85
378
Index
methods 85
performing a scan 89
presentation 90
recording scan data 90
replaying scan data 91
selecting channels 87
System Information decoding 89
scanning, WCDMA 92
CPICH Best UARFCN Data window 104
CPICH Data status window 104
CPICH pilot pollution 105
CPICH Scan bar charts 103
CPICH Scan line charts 105
CW Scan Bar Chart 114
defining scrambling code or UARFCN groups 120
Finger Info status windows 108
for CW signals 112
manual selection of scrambling codes/UARFCNs 101
methods 92
network search 117
number of active set members 106
of CPICH control channels 94
of P-SCH and S-SCH channels 107
of synchronization channels (SCHs) 94
of timeslots on SCH 110
performing a scan 94
presentation in status windows 120
presenting scrambling codes from multiple UARFCNs together 109
recording scan data 94
replaying scan data 120
scanning capacity 92
SCH Timeslot Scan Bar Chart 111
sorting of scrambling codes in presentations 109
spectrum analysis 115
Spectrum Analysis bar charts 117
Synch Channel Data status window 107
scanning, WiMAX 133
capabilities 133
CW scanning 136
general settings 133
preamble scanning 134
presentation 136
LZT 108 9851 R1B
379
TEMS Investigation 9.0 Data Collection User’s Manual
RSSI scanning 136
SCH scanning 94
SCH Timeslot Scan Bar Chart (WCDMA) 111
searching a logfile 56
Sector Lock tab (Nokia UE properties) 195
Sierra Wireless data cards, manual enabling of 42
size attribute (of information element)
editing 31
skills recommended for Data Collection users 17
SMS tab (Motorola UE properties) 194
SMS, testing 161
Sony Ericsson GSM phones
GSM scanning with 85
Sony Ericsson phones, properties of 180
Access Class Control tab 180
BLER Target tab 182
Call tab 181
CAS Speech Codec tab 190
CAS System Capability Control tab 183
Dedicated Mode tab 187
Discard Messages tab 182
EDGE Capability tab 188
GSM Band Control tab 187
GSM C/A tab 187
GSM TxPower Control tab 190
Idle Mode tab 188
Lock on PLMN tab 182
messages and mode reports 186
Messages Control tab 182
RAT Control tab 183
RAT control vs. GSM settings 183
Speech Codec tab 190
WCDMA Cell Bar Control tab 184
WCDMA Cell Selection Control tab 184
WCDMA RRC Radio Capability Control tab 186
Sony Ericsson UEs
enabling manually 332
Sony Ericsson Z750i 5, 92
control function support in 179
CPICH scanning with 95
GSM scanning with 6
WCDMA scanning with 5
380
Index
sounds for events 208
spectrum analysis 115
speech codecs (of Sony Ericsson phones) 190
Speech Quality Index (SQI) 293
SQI 293
SQI-MOS 6, 293
alignment with PESQ 295
comparison with RxQual (GSM version) 297
input to algorithm 293
output 294
stacked bar chart 250
Start Recording command (in command sequences) 144
starting the Data Collection application 17, 37
statistics 282
status bar 19, 24
status windows 214
changing properties of 217
setting up contents of 214
stepping logfiles (during replay) 56
Stop Recording command (in command sequences) 145
stopping logfile replay 55
support contact information 14, 326
swapping logfiles 52
symbol attribute (of information element)
editing 31
Synch Channel Data window (WCDMA) 107
Synchronize command (in command sequences) 143
T
TEMS on-line subscription service 14
themes 260, 263
Cell ARFCN theme 278
Cell Color theme 275
Cell Line theme 272
Cell theme 270
cell themes 264
constructing
cell themes 269
event themes 268
IE themes 265
deleting 281
editing 280
event themes 264
LZT 108 9851 R1B
381
TEMS Investigation 9.0 Data Collection User’s Manual
information element (IE) themes 264
Pinpoint theme 264, 279
reordering 280
visibility of 280
toolbars 18, 22
Connections toolbar 23
Equipment Control toolbar 22
File and View toolbar 24
Record toolbar 23
Replay toolbar 23
Report toolbar 24
Route Analysis toolbar 24
Trace Log Mask tab (Nokia GSM phone properties) 199
U
UE Handling tab (Motorola UE properties) 193
uplink data 312
accuracy of alignment with logfile 81
limitations of merging algorithm 78
merging algorithm 76
merging with logfiles 76, 78
presentation of 313
usefulness of 313
user interface 20
quick guide to 18
user modes 20
V
Video Monitor 228
properties of 228
video streaming (UMTS) 227, 305
error messages 174
evaluating performance of 229
how to test 227
KPIs for 359
testing 158
troubleshooting 229
WAP-based 7, 158
video telephony 145, 303
View menu 26
VSQI 229, 305
VTQI 303
382
Index
W
Wait command (in command sequences) 143
Wait for Events command (in command sequences) 144
WAP
error messages 177
KPIs for 358
testing 162
WAP 2.0 7
WAP-based video streaming 7, 158
WCDMA Cell Bar Control tab (Sony Ericsson phone properties) 184
WCDMA Cell Selection Control tab (Sony Ericsson phone properties) 184
WCDMA RRC Radio Capability Control tab (Sony Ericsson phone properties)
186
what’s in this manual 13
what’s new in this TEMS Investigation version 4
Wi-Fi access points
presentation on map 269
WiMAX 4
WiMAX scanning 133
Window menu 27
Windows Vista 8, 166
Worksheet menu 27
worksheets 18, 21
workspaces 18, 21
LZT 108 9851 R1B
383
TEMS™ Optimization Solutions — the number one choice
for operators worldwide. For every stage of a wireless
network’s life cycle and supporting all major technologies,
the TEMS portfolio helps operators maximize their Quality
of Service and get the most out of their network investment.
Ericsson’s experience and technological leadership give
network operators the strong partnership they need and a
commitment to quality, accuracy, and success.
TEMS Optimization Solutions — Making Wireless Better.