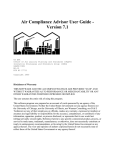
1
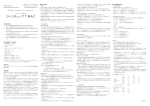
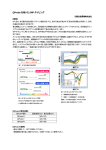
METHOD 30A--DETERMINATION OF TOTAL VAPOR PHASE MERCURY
EMISSIONS FROM STATIONARY SOURCES
(INSTRUMENTAL ANALYZER PROCEDURE)
1.0 Scope and Application
What is Method 30A?
Method 30A is a procedure for measuring total vapor phase mercury (Hg)
emissions from stationary sources using an instrumental analyzer. This method is
particularly appropriate for performing emissions testing and for conducting relative
accuracy test audits (RATAs) of mercury continuous emissions monitoring systems (Hg
CEMS) and sorbent trap monitoring systems at coal-fired combustion sources. Quality
assurance and quality control requirements are included to assure that you, the tester,
collect data of known and acceptable quality for each testing site. This method does not
completely describe all equipment, supplies, and sampling procedures and analytical
procedures you will need but refers to other test methods for some of the details.
Therefore, to obtain reliable results, you should also have a thorough knowledge of these
additional methods which are also found in appendices A-1 and A-3 to this part:
(a)
Method 1—Sample and Velocity Traverses for Stationary Sources.
(b)
Method 4—Determination of Moisture Content in Stack Gases.
1.1 Analytes. What does this method determine? This method is designed to
measure the mass concentration of total vapor phase Hg in flue gas, which represents the
sum of elemental Hg (Hgo) and oxidized forms of Hg (Hg+2), in mass concentration units
of micrograms per cubic meter (µg/m3).
Analyte
CAS No.
Elemental Hg (Hgo)
7439-97-6
Oxidized Hg (Hg+2)
-----
Sensitivity
Typically <2% of Calibration Span
(Same)
1.2 Applicability. When is this method required? Method 30A is offered as a
reference method for emission testing and for RATAs of Hg CEMS and sorbent trap
monitoring systems at coal-fired boilers. Method 30A may also be specified for other
source categories in the future, either by New Source Performance Standards (NSPS),
National Emission Standards for Hazardous Air Pollutants (NESHAP), emissions trading
programs, State Implementation Plans (SIP), or operating permits that require
measurement of Hg concentrations in stationary source emissions to determine
compliance with an applicable emission standard or limit, or to conduct RATAs of Hg
CEMS and sorbent trap monitoring systems.
1.3 Data Quality Objectives (DQO). How good must my collected data be?
Method 30A has been designed to provide data of high and known quality for Hg
emission testing and for relative accuracy testing of Hg monitoring systems including Hg
CEMS and sorbent trap monitoring systems. In these and other applications, the
principle objective is to ensure the accuracy of the data at the actual emission levels
encountered. To meet this objective, calibration standards prepared according to an EPA
traceability protocol must be used and measurement system performance tests are
required.
2.0 Summary of Method
In this method, a sample of the effluent gas is continuously extracted and
2
conveyed to an analyzer capable of measuring the total vapor phase Hg concentration.
Elemental and oxidized mercury (i.e., Hgo and Hg+2) may be measured separately or
simultaneously but, for purposes of this method, total vapor phase Hg is the sum of Hgo
and Hg+2. You must meet the performance requirements of this method (i.e.., system
calibration, interference testing, dynamic spiking, and system integrity/drift checks) to
validate your data. The dynamic spiking requirement is deferred until January 1, 2009.
3.0 Definitions
3.1 Calibration Curve means the relationship between an analyzer’s response to
the injection of a series of calibration gases and the actual concentrations of those gases.
3.2 Calibration Gas means a gas standard containing Hg0 or HgCl2 at a known
concentration that is produced and certified in accordance with an EPA traceability
protocol for certification of Hg calibration standards.
3.2.1 Zero Gas means a calibration gas with a concentration that is below the
level detectable by the measurement system.
3.2.2 Low-Level Gas means a calibration gas with a concentration that is 10 to 30
percent of the calibration span.
3.2.3 Mid-Level Gas means a calibration gas with a concentration that is 40 to 60
percent of the calibration span.
3.2.4 High-Level Gas means a calibration gas whose concentration is equal to the
calibration span.
3.3 Converter means a device that reduces oxidized mercury (Hg+2) to elemental
mercury (Hgo).
3.4 Calibration Span means the upper limit of valid instrument response during
3
sampling. To the extent practicable the measured emissions are to be between 10 and
100 percent of the selected calibration span (i.e., the measured emissions should be
within the calibrated range determined by the Low- and High-Level gas standards). It is
recommended that the calibration span be at least twice the native concentration to
accommodate the dynamic spiking procedure.
3.5 Centroidal Area means the central area that has the same shape as the stack
or duct cross section and is no greater than one percent of the stack or duct total crosssectional area.
3.6 Data Recorder means the equipment that permanently records the
concentrations reported by the analyzer.
3.7 Drift Check means the test to determine the difference between the
measurement system readings obtained in a post-run system integrity check and the prior
pre-run system integrity check at a specific calibration gas concentration level (i.e., zero,
mid-level, or high-level).
3.8 Dynamic Spiking means a procedure in which a known mass or concentration
of vapor phase HgCl2 is injected into the probe sample gas stream at a known flow rate,
in order to assess the effects of the flue gas matrix on the accuracy of the measurement
system.
3.9 Gas Analyzer means the equipment that detects the total vapor phase Hg
being measured and generates an output proportional to its concentration.
3.10 Interference Test means the test to detect analyzer responses to compounds
other than Hg, usually gases present in the measured gas stream, that are not adequately
accounted for in the calibration procedure and may cause measurement bias.
4
3.11 Measurement System means all of the equipment used to determine the Hg
concentration. The measurement system may generally include the following major
subsystems: sample acquisition, Hg+2 to Hg0 converter, sample transport, sample
conditioning, flow control/gas manifold, gas analyzer, and data recorder.
3.12 Native Concentration means the total vapor phase Hg concentration in the
effluent gas stream.
3.13 NIST means the National Institute of Standards and Technology, located in
Gaithersburg, Maryland.
3.14 Response Time means the time it takes for the measurement system, while
operating normally at its target sample flow rate or dilution ratio, to respond to a known
step change in gas concentration (from a low-level to a high-level gas) and to read within
5 percent of the stable high-level gas response.
3.15 Run means a series of gas samples taken successively from the stack or duct.
A test normally consists of a specific number of runs.
3.16 System Calibration Error means the difference between the measured
concentration of a low-, mid-, or high-level Hg0 calibration gas and the certified
concentration of the gas when it is introduced in system calibration mode.
3.17 System Calibration Mode means introducing the calibration gases into the
measurement system at the probe, upstream of all sample conditioning components.
3.18 Test refers to the series of runs required by the applicable regulation.
4.0 Interferences
Interferences will vary among instruments and potential instrument-specific
spectral and matrix interferences must be evaluated through the interference test and the
5
dynamic spiking tests.
5.0 Safety
What safety measures should I consider when using this method?
This method may require you to work with hazardous materials and in hazardous
conditions. You are encouraged to establish safety procedures before using the method.
Among other precautions, you should become familiar with the safety recommendations
in the gas analyzer user’s manual. Occupational Safety and Health Administration
(OSHA) regulations concerning use of compressed gas cylinders and noxious gases may
apply.
6.0 Equipment and Supplies
6.1 What do I need for the measurement system? This method is intended to
be applicable to multiple instrumental technologies. You may use any equipment and
supplies that meet the following specifications.
6.1.1 All wetted sampling system components, including probe components prior
to the point at which the calibration gas is introduced, must be chemically inert to all Hg
species. Materials such as perfluoroalkoxy (PFA) Teflon™, quartz, treated stainless steel
(SS) are examples of such materials. [Note: These materials of construction are required
because components prior to the calibration gas injection point are not included in the
system calibration error, system integrity, and interference tests.]
6.1.2 The interference, system calibration error, system integrity, drift and
dynamic spiking test criteria must all be met by the system used.
6.1.3 The system must be capable of measuring and controlling sample flow rate.
6.1.4 All system components prior to the Hg+2 to Hg0 converter must be
6
maintained at a sample temperature above the acid gas dew point.
6.2
Measurement System Components. Figure 30A-1 in Section 17.0 is an
example schematic of a Method 30A measurement system.
6.2.1 Sample Probe. The probe must be made of the appropriate materials as
noted in Section 6.1.1, heated when necessary (see Section 6.1.4), configured with ports
for introduction of calibration and spiking gases, and of sufficient length to traverse all of
the sample points.
6.2.2 Filter or Other Particulate Removal Device. The filter or other particulate
removal device is considered to be a part of the measurement system, must be made of
appropriate materials as noted in Section 6.1.1, and must be included in all system tests.
6.2.3 Sample Line. The sample line that connects the probe to the converter,
conditioning system and analyzer must be made of appropriate materials as noted in
Section 6.1.1.
6.2.4 Conditioning Equipment. For dry basis measurements, a condenser, dryer
or other suitable device is required to remove moisture continuously from the sample gas.
Any equipment needed to heat the probe, or sample line to avoid condensation prior to
the moisture removal component is also required. For wet basis systems, you must keep
the sample above its dew point either by: (1) heating the sample line and all sample
transport components up to the inlet of the analyzer (and, for hot-wet extractive systems,
also heating the analyzer) or (2) by diluting the sample prior to analysis using a dilution
probe system. The components required to do either of the above are considered to be
conditioning equipment.
6.2.5 Sampling Pump. A pump is needed to push or pull the sample gas through
7
the system at a flow rate sufficient to minimize the response time of the measurement
system. If a mechanical sample pump is used and its surfaces are in contact with the
sample gas prior to detection, the pump must be leak free and must be constructed of a
material that is non-reactive to the gas being sampled (see Section 6.1.1). For dilutiontype measurement systems, an ejector pump (eductor) may be used to create a sufficient
vacuum that sample gas will be drawn through a critical orifice at a constant rate. The
ejector pump may be constructed of any material that is non-reactive to the gas being
sampled.
6.2.6 Calibration Gas System(s). One or more systems may be needed to
introduce calibration gases into the measurement system. A system should be able to
flood the sampling probe sufficiently to prevent entry of gas from the effluent stream.
6.2.7 Dynamic Spiking Port. For the purposes of the dynamic spiking procedure
described in Section 8.2.7, the measurement system must be equipped with a port to
allow introduction of the dynamic spike gas stream with the sample gas stream, at a point
as close as possible to the inlet of the probe so as to ensure adequate mixing. The same
port used for system calibrations and calibration error checks may be used for dynamic
spiking purposes.
6.2.8 Sample Gas Delivery. The sample line may feed directly to a converter, to
a by-pass valve (for speciating systems), or to a sample manifold. All valve and/or
manifold components must be made of material that is non-reactive to the gas sampled
and the calibration gas, and must be configured to safely discharge any excess gas.
6.2.9 Hg Analyzer. An instrument is required that continuously measures the
total vapor phase Hg in the gas stream and meets the applicable specifications in Section
8
13.0.
6.2.10 Data Recorder. A recorder, such as a computerized data acquisition and
handling system (DAHS), digital recorder, strip chart, or data logger, is required for
recording measurement data.
6.3 Moisture Measurement System. If correction of the measured Hg emissions
for moisture is required (see Section 8.5), either Method 4 in appendix A-3 to this part or
other moisture measurement methods approved by the Administrator will be needed to
measure stack gas moisture content.
7.0 Reagents and Standards
7.1 Calibration Gases. What calibration gases do I need? You will need
calibration gases of known concentrations of Hg0 and HgCl2. Special reagents and
equipment may be required to prepare the HgCl2 gas standards (e.g., a NIST-traceable
solution of HgCl2 and a gas generator equipped with mass flow controllers).
The following calibration gas concentrations are required:
7.1.1 High-Level Gas. Equal to the selected calibration span.
7.1.2 Mid-Level Gas. 40 to 60 percent of the calibration span.
7.1.3 Low-Level Gas. 10 to 30 percent of the calibration span.
7.1.4 Zero Gas. No detectable Hg.
7.1.5 Dynamic Spike Gas. The exact concentration of the HgCl2 calibration gas
used to perform the pre-test dynamic spiking procedure described in Section 8.2.7
depends on the native Hg concentration in the stack The spike gas must produce a spiked
sample concentration above the native concentration, as specified in Section 8.2.7.2.2.
7.2 Interference Test. What reagents do I need for the interference test? Use
9
the appropriate test gases listed in Table 30A-3 in Section 17.0 (i.e., the potential
interferents for the source to be tested, as identified by the instrument manufacturer) to
conduct the interference check. These gases need not be of protocol gas quality.
8.0 Sample Collection
Emission Test Procedure
Figure 30A-2 in Section 17.0 presents an overview of the test procedures required
by this method. Since you may choose different options to comply with certain
performance criteria, you must identify the specific options and associated frequencies
you select and document your results in regard to the performance criteria.
8.1 Sample Point Selection. What sampling site and sampling points do I
select?
8.1.1 When this method is used solely for Hg emission testing (e.g., to determine
compliance with an emission standard or limit), use twelve sampling points located
according to Table 1-1 or Table 1-2 of Method 1 in appendix A-1 to this part.
Alternatively, you may conduct a stratification test as described in Section 8.1.3 to
determine the number and location of the sampling points.
8.1.2 When this method is used for relative accuracy testing of a Hg CEMS or
sorbent trap monitoring system, follow the sampling site selection and sampling point
layout procedures for gas monitor RATA testing described in the appropriate
performance specification or applicable regulation (e.g., Performance Specification 2,
section 8.1.3 of appendix B to this part or section 6.5.6 of appendix A to part 75 of this
chapter), with one exception. If you elect to perform stratification testing as part of the
sampling point selection process, perform the testing in accordance with Section 8.1.3 of
10
this method (see also “Summary Table of QA/QC Requirements” in Section 9.0).
8.1.3 Determination of Stratification. If you elect to perform stratification testing
as part of the sampling point selection process and the test results show your effluent gas
stream to be unstratified or minimally stratified, you may be allowed to sample at fewer
points or at different points than would otherwise be required.
8.1.3.1 Test Procedure. To test for stratification, use a probe of appropriate
length to measure the total vapor phase Hg concentration at twelve traverse points located
according to Table 1-1 or Table 1-2 of Method 1 in appendix A-1 to this part.
Alternatively, for a sampling location where stratification is expected (e.g., after a wet
scrubber or at a point where dissimilar gas streams are combined together), if a 12-point
Hg stratification test has been previously performed at that location and the results of the
test showed the location to be minimally stratified or unstratified according to the criteria
in section 8.1.3.2, you may perform an abbreviated 3-point or 6-point Hg stratification
test at the points specified in section 6.5.6.2(a) of appendix A to part 75 of this chapter in
lieu of performing the 12-point test. Sample for a minimum of twice the system response
time (see Section 8.2.6) at each traverse point. Calculate the individual point and mean
Hg concentrations.
8.1.3.2 Acceptance Criteria and Sampling Point Location.
8.1.3.2.1 If the Hg concentration at each traverse point differs from the mean
concentration for all traverse points by no more than: (a) ± 5 percent of the mean
concentration; or (b) ± 0.2 µg/m3 (whichever is less restrictive), the gas stream is
considered to be unstratified and you may collect samples from a single point that most
closely matches the mean.
11
8.1.3.2.2 If the 5 percent or 0.2 µg/m3 criterion in Section 8.1.3.2.1 is not met,
but the Hg concentration at each traverse point differs from the mean concentration for all
traverse points by no more than: (a) ± 10 percent of the mean; or (b) ± 0.5 µg/m3
(whichever is less restrictive), the gas stream is considered to be minimally stratified, and
you may take samples from three points, provided the points are located on the
measurement line exhibiting the highest average Hg concentration during the
stratification test. If the stack diameter (or equivalent diameter, for a rectangular stack or
duct) is greater than 2.4 meters (7.8 ft), locate the three sampling points at 0.4, 1.0, and
2.0 meters from the stack or duct wall. Alternatively, if a RATA required by part 75 of
this chapter is being conducted, you may locate the three points at 4.4, 14.6, and 29.6
percent of the duct diameter, in accordance with Method 1 in appendix A-1 to this part.
For stack or duct diameters of 2.4 meters (7.8 ft) or less, locate the three sampling points
at 16.7, 50.0, and 83.3 percent of the measurement line.
8.1.3.2.3 If the gas stream is found to be stratified because the 10 percent or 0.5
µg/m3 criterion in Section 8.1.3.2.2 is not met, then either locate three sampling points at
16.7, 50.0, and 83.3 percent of the measurement line that exhibited the highest average
Hg concentration during the stratification test, or locate twelve traverse points for the test
in accordance with Table 1-1 or Table 1-2 of Method 1 in appendix A-1 to this part; or, if
a RATA required by part 75 of this chapter is being conducted, locate six Method 1
points along the measurement line that exhibited the highest average Hg concentration.
8.1.3.3 Temporal Variations. Temporal variations in the source Hg concentration
during a stratification test may complicate the determination of stratification. If temporal
variations are a concern, you may use the following procedure to normalize the
12
stratification test data. A second Hg measurement system, i.e., either an installed Hg
CEMS or another Method 30A system, is required to perform this procedure. Position
the sampling probe of the second Hg measurement system at a fixed point in the stack or
duct, at least one meter from the stack or duct wall. Then, each time that the Hg
concentration is measured at one of the stratification test points, make a concurrent
measurement of Hg concentration at the fixed point. Normalize the Hg concentration
measured at each traverse point, by multiplying it by the ratio of CF,avg to CF, where CF is
the corresponding fixed-point Hg concentration measurement, and CF,avg is the average of
all of the fixed-point measurements over the duration of the stratification test. Evaluate
the results of the stratification test according to section 8.1.3.2, using the normalized Hg
concentrations.
8.1.3.4 Stratification Testing Exemption. Stratification testing need not be
performed at a test location where it would otherwise be required to justify using fewer
sample points or different sample points, if the owner or operator documents that the Hg
concentration in the stack gas is expected to be 3 :g/m3 or less at the time of a Hg
monitoring system RATA or an Hg emissions test. To demonstrate that a particular test
location qualifies for the stratification testing exemption, representative Hg emissions
data must be collected just prior to the RATA or emissions test. At least one hour of Hg
concentration data is required for the demonstration. The data used for the demonstration
shall be recorded at process operating conditions that closely approximate the operating
conditions that will exist during the RATA or emissions test. It is recommended that
collection of the demonstration data be integrated with the on-site pretest procedures
required by the reference method being used for the RATA or emissions test (whether
13
this method or another approved Hg reference method is used). Quality-assured data
from an installed Hg monitoring system may also be used for the demonstration. If a
particular test location qualifies for the stratification testing exemption, sampling shall be
performed at three points, as described in section 8.1.3.2.2 of this method. The owner or
operator shall fully document the method used to collect the demonstration data and shall
keep this documentation on file with the data from the associated RATA or Hg emissions
test.
8.1.3.5 Interim Alternative Stratification Test Procedures. In the time period
between the effective date of this method and January 1, 2009, you may follow one of the
following two procedures. Substitute a stratification test for sulfur dioxide (SO2) for the
Hg stratification test described in section 8.1.3.1. If this option is chosen, follow the test
procedures in section 6.5.6.1 of appendix A to part 75 of this chapter. Evaluate the test
results and determine the sampling point locations according to section 6.5.6.3 of
appendix A to part 75 of this chapter. If the sampling location is found to be minimally
stratified or unstratified for SO2, it shall be considered minimally stratified or unstratified
for Hg. Alternatively, you may forgo stratification testing, assume the gas stream is
minimally stratified, and sample at three points as described in section 8.1.3.2.2 of this
method.
8.2 Initial Measurement System Performance Tests. What initial performance
criteria must my system meet before I begin sampling? Before measuring emissions,
perform the following procedures:
(a) Interference Test;
(b) Calibration Gas Verification;
14
(c) Measurement System Preparation;
(d) 3-Point System Calibration Error Test;
(e) System Integrity Check;
(f) Measurement System Response Time Test; and
(g) Dynamic Spiking Test.
8.2.1 Interference Test (Optional). Your measurement system should be free of
known interferences. It is recommended that you conduct this interference test of your
measurement system prior to its initial use in the field to verify that the candidate test
instrument is free from inherent biases or interferences resulting from common
combustion emission constituents. If you have multiple measurement systems with
components of the same make and model numbers, you need only perform this
interference check on one system and you may also rely on an interference test conducted
by the manufacturer on a system having components of the same make and model(s) of
the system that you use. The interference test procedure is found in Section 8.6 of this
method.
8.2.2 Calibration Gas Verification. How must I verify the concentrations of
my calibration gases?
8.2.2.1 Cylinder Gas Standards. When cylinder gas standards are used for Hg0,
obtain a certificate from the gas manufacturer and confirm that the documentation
includes all information required by an EPA traceability protocol (see Section 16).
Confirm that the manufacturer certification is complete and current. Ensure that the
calibration gas certifications have not expired.
8.2.2.2 Other Calibration Standards. All other calibration standards for HgCl2
15
and Hg0, such as gas generators, must meet the requirements of an EPA traceability
protocol (see Section 16), and the certification procedures must be fully documented in
the test report.
8.2.2.3 Calibration Span. Select the calibration span (i.e., high-level gas
concentration) so that the measured source emissions are 10 to 100 percent of the
calibration span. This requirement is waived for applications in which the Hg
concentrations are consistently below 1 µg/m3; however, the calibration span for these
low-concentration applications shall not exceed 5 µg/m3.
8.2.3 Measurement System Preparation. How do I prepare my measurement
system for use? Assemble, prepare, and precondition the measurement system
according to your standard operating procedure. Adjust the system to achieve the correct
sampling rate or dilution ratio (as applicable). Then, conduct a 3-point system calibration
error test using Hg0 as described in Section 8.2.4, an initial system integrity check using
HgCl2 and a zero gas as described in Section 8.2.5, and a pre-test dynamic spiking test as
described in Section 8.2.7.
8.2.4 System Calibration Error Test. Conduct a 3-point system calibration error
test before the first test run. Use Hg0 standards for this test. Introduce the low-, mid-, and
high-level calibration gases in any order, in system calibration mode, unless you desire to
determine the system response time during this test, in which case, inject the gases such
that the high-level injection directly follows the low-level injection. For non-dilution
systems, you may adjust the system to maintain the correct flow rate at the analyzer
during the test, but you may not make adjustments for any other purpose. For dilution
systems, you must operate the measurement system at the appropriate dilution ratio
16
during all system calibration error checks, and you may make only the adjustments
necessary to maintain the proper ratio. After each gas injection, wait until a stable
response has been obtained. Record the analyzer’s final, stable response to each
calibration gas on a form similar to Table 30A-1 in Section 17.0. For each calibration
gas, calculate the system calibration error using Equation 30A-1 in Section 12.2. The
calibration error specification in Section 13.1 must be met for the low-, mid-, and highlevel gases. If the calibration error specification is not met for all three gases, take
corrective action and repeat the test until an acceptable 3-point calibration is achieved.
8.2.5 System Integrity Check. Perform a two-point system integrity check before
the first test run. Use the zero gas and either the mid- or high-level HgCl2 calibration gas
for the check, whichever one best represents the total vapor phase Hg concentration
levels in the stack. Record the data on a form similar to Table 30A-2 in Section 17.0.
The system integrity check specification in Section 13.2 must be met for both the zero
gas and the mid- or high-level gas. If the system integrity specification is not met for
both gases, take corrective action and repeat the test until an acceptable system integrity
check is achieved.
8.2.6 Measurement System Response Time. The measurement system response
time is used to determine the minimum sampling time for each sampling point and is
equal to the time that is required for the measured Hg concentration to increase from the
stable low-level calibration gas response to a value within 5 percent of the stable highlevel calibration gas response during the system calibration error test in Section 8.2.4.
Round off the measured system response time to the nearest minute.
8.2.7 Dynamic Spiking Test. You must perform dynamic spiking prior to the
17
first test run to validate your test data. The purpose of this procedure is to demonstrate
that the site-specific flue gas matrix does not adversely affect the accuracy of the
measurement system. The specifications in Section 13.5 must be met to validate your
data. If these specifications are not met for the pre-test dynamic spiking, you may not
proceed with the test until satisfactory results are obtained. For the time period between
the effective date of this method and January 1, 2009, the dynamic spiking requirement is
waived.
8.2.7.1 How do I perform dynamic spiking? Dynamic spiking is a gas phase
application of the method of standard additions, which involves injecting a known
quantity of Hg into the measurement system upstream of all sample conditioning
components, similar to system calibration mode, except the probe is not flooded and the
resulting sample stream includes both effluent gas and the spike gas. You must follow a
written procedure that details how the spike is added to the system, how the spike dilution
factor (DF) is measured, and how the Hg concentration data are collected and processed.
8.2.7.2 Spiking Procedure Requirements.
8.2.7.2.1 Spiking Gas Requirements. The spike gas must also be a HgCl2
calibration gas certified by an EPA traceability protocol. You must choose
concentrations that can produce the target levels while being injected at a volumetric flow
rate that is ≤ 20 percent of the total volumetric flow rate through the measurement system
(i.e., sample flow rate plus spike gas flow rate).
8.2.7.2.2 Target Spiking Level. The target level for spiking must be 150 to 200
percent of the native Hg concentration; however, if the native Hg concentration is < 1
µg/m3, set the target level to add between 1 and 4 µg/m3 Hg+2 to the native concentration.
18
Use Equation 30A-5 in Section 12.5 to calculate the acceptable range of spike gas
concentrations at the target level. Then select a spike gas concentration in that range.
8.2.7.2.3 Spike Injections. You must inject spikes in such a manner that the
spiking does not alter the total volumetric sample system flow rate and dilution ratio (if
applicable). You must collect at least 3 data points, and the relative standard deviation
(RSD) specification in Section 13.5 must be met. Each data point represents a single
spike injection, and pre- and post-injection measurements of the native Hg concentration
(or diluted native concentration, as applicable) are required for each spike injection.
8.2.7.2.4 Spike Dilution Factor (DF). For each spike injection, DF, the dilution
factor must be determined. DF is the ratio of the total volumetric flow rate of gas through
the measurement system to the spike gas flow rate. This factor must be > 5. The spiking
mass balance calculation is directly dependent on the accuracy of the DF determination.
As a result, high accuracy total volumetric flow rate and spike gas flowrate measurements
are required. These flow rates may be determined by direct or indirect measurement.
Calibrated flow meters, venturies, orifices or tracer gas measurements are examples of
potential flow measurement techniques.
8.2.7.2.5 Concentrations. The measurement system must record total vapor
phase Hg concentrations continuously during the dynamic spiking procedure. It is
possible that dynamic spiking at a level close to 200 percent of the native Hg
concentration may cause the measured Hg concentration to exceed the calibration span
value. Avoid this by choosing a lower spiking level or by recalibration at a higher span.
The measurements shall not exceed 120 percent of the calibration span. The “baseline”
measurements made between spikes may represent the native Hg concentration (if spike
19
gas flow is stopped between injections) or the native Hg concentration diluted by blank or
carrier gas flowing at the same rate as the spike gas (if gas flow cannot be stopped
between injections). Each baseline measurement must include at least 4 readings or 1
minute (whichever is greater) of stable responses. Use Equation 30A-10 or 30A-11 in
Section 12.10 (as applicable) to convert baseline measurements to native concentration.
8.2.7.2.6 Recovery. Calculate spike recoveries using Equation 30A-7 in Section
12.7. Mass recoveries may be calculated from stable responses based on injected mass
flows or from integrated response peaks based on total mass injected. Calculate the mean
and RSD for the three (or more) spike injections and compare to the specifications in
Section 13.5.
8.2.7.2.7 Error Adjustment Option. You may adjust the measurement data
collected during dynamic spiking for the system calibration error using Equation 30A-3
in Section 12. To do this, perform the initial system integrity check prior to the dynamic
spiking test, and perform another system integrity check following the dynamic spiking
test and before the first test run. If you choose this option, you must apply Equation 30A3 to both the spiked sample concentration measurement (Css) and the baseline or native
concentration measurement (Cnative), each substituted in place of Cavg in the equation.
8.2.7.3 Example Spiking Procedure Using a Hot Vapor Calibration Source
Generator.
(a) Introduce the spike gas into the probe using a hot vapor calibration source
generator and a solution of HgCl2 in dilute HCl and HNO3. The calibrator uses a mass
flow controller (accurate within 2 percent) to measure the gas flow, and the solution feed
is measured using a top-loading balance accurate to 0.01g. The challenges of injecting
20
oxidized Hg may make it impractical to stop the flow of gas between spike injections. In
this case, operate the hot vapor calibration source generator continuously during the
spiking procedure, swapping blank solutions for HgCl2 solutions when switching
between spiking and baseline measurements.
(b) If applicable, monitor the measurement system to make sure the total
sampling system flow rate and the sample dilution ratio do not change during this
procedure. Record all data on a data sheet similar to Table 30A-5 in Section 17.0. If the
Hg measurement system design makes it impractical to measure the total volumetric flow
rate through the system, use a spike gas that includes a tracer for measuring the dilution
factor, DF (see Equation 30A-9 in Section 12.9). Allow the measurements to stabilize
between each spike injection, average the pre- and post-injection baseline measurements,
and calculate the native concentration. If this measurement shifts by more than 5 percent
during any injection, it may be necessary to discard that data point and repeat the
injection to achieve the required RSD among the injections. If the spikes persistently
show poor repeatability, or if the recoveries are not within the range specified in Section
13.5, take corrective action.
8.2.8 Run Validation. How do I confirm that each run I conduct is valid ?
8.2.8.1 System Integrity Checks.
(a) Before and after each test run, perform a two-point system integrity check
using the same procedure as the initial system integrity check described in Section 8.2.5.
You may use data from that initial system integrity check as the pre-run data for the first
test run, provided it is the most recent system integrity check done before the first run.
You may also use the results of a successful post-run system integrity check as the pre-
21
run data for the next test run. Do not make any adjustments to the measurement system
during these checks, other than to maintain the target calibration gas flow rate and the
proper dilution ratio.
(b) As a time-saving alternative, you may, at the risk of invalidating multiple test
runs, skip one or more integrity checks during a test day. Provided there have been no
auto-calibrations or other instrument alterations, a single integrity check may suffice as a
post-run check to validate (or invalidate) as many consecutive test runs as can be
completed during a single test day. All subsequent test days must begin with a pre-run
system integrity check subject to the same performance criteria and corrective action
requirements as a post-run system integrity check.
(c) Each system integrity check must meet the criteria for system integrity checks
in Section 13.2. If a post-run system integrity check is failed, all test runs since the last
passed system integrity check are invalid. If a post-run or a pre-run system integrity
check is failed, you must take corrective action and pass another 3-point Hg0 system
calibration error test (Section 8.2.4) followed by another system integrity check before
conducting any additional test runs. Record the results of the pre- and post-run system
integrity checks on a form similar to Table 30A-2 in Section 17.0.
8.2.8.2 Drift Check. Using the data from the successful pre- and post-run system
integrity checks, calculate the zero and upscale drift, using Equation 30A-2 in Section
12.3. Exceeding the Section 13.3 specification does not invalidate the run, but corrective
action must be taken and a new 3-point Hg0 system calibration error test and a system
integrity check must be passed before any more runs are made.
8.3 Dilution-Type Systems—Special Considerations. When a dilution-type
22
measurement system is used, there are three important considerations that must be taken
into account to ensure the quality of the emissions data. First, the critical orifice size and
dilution ratio must be selected properly so that the sample dew point will be below the
sample line and analyzer temperatures. Second, a high-quality, accurate dilution
controller must be used to maintain the correct dilution ratio during sampling. The
dilution controller should be capable of monitoring the dilution air pressure, orifice
upstream pressure, eductor vacuum, and sample flow rates. Third, differences between
the molecular weight of calibration gas mixtures, dilution air, and the stack gas molecular
weight must be considered because these can affect the dilution ratio and introduce
measurement bias.
8.4 Sampling.
(a) Position the probe at the first sampling point. Allow the system to flush and
equilibrate for at least two times the measurement system response time before recording
any data. Then, traverse and record measurements at all required sampling points.
Sample at each traverse point for an equal length of time, maintaining the appropriate
sample flow rate or dilution ratio (as applicable). For all Hg instrumental method
systems, the minimum sampling time at each sampling point must be at least two times
the system response time, but not less than 10 minutes. For concentrating systems, the
minimum sampling time must also include at least 4 concentration measurement cycles.
(b) After recording data for the appropriate period of time at the first traverse
point, you may move the sample probe to the next point and continue recording, omitting
the requirement to allow the system to equilibrate for two times the system response time
before recording data at the subsequent traverse points. You must, however, sample at
23
this and all subsequent traverse points for the required minimum amount of time
specified in this section. If you must remove the probe from the stack for any reason, you
must again allow the sampling system to equilibrate for at least two times the system
response time prior to resuming data recording.
(c) If at any point the measured Hg concentration exceeds the calibration span
value, you must at a minimum identify and report this as a deviation from the method.
Depending on the data quality objectives of the test, this event may require corrective
action before proceeding. If the average Hg concentration for any run exceeds the
calibration span value, the run is invalidated.
8.5 Moisture Correction. If the moisture basis (wet or dry) of the measurements
made with this method is different from the moisture basis of either: (1) the applicable
emission limit; or (2) a Hg CEMS or sorbent trap monitoring system being evaluated for
relative accuracy, you must determine the moisture content of the flue gas and correct the
measured gas concentrations to a dry basis using Method 4 in appendix A-3 of this part or
other appropriate methods, subject to the approval of the Administrator.
8.6 Optional Interference Test Procedure.
(a) Select an appropriate calibration span that reflects the source(s) to be tested
and perform the interference check at 40 percent of the lowest calibration span value
anticipated, e.g., 10 µg/m3. Alternatively, successfully conducting the interference test at
an absolute Hg concentration of 2µg/m3 will demonstrate performance for an equivalent
calibration span of 5 µg/m3, the lowest calibration span allowed for Method 30A testing.
Therefore, performing the interference test at the 2 µg/m3 level will serve to demonstrate
acceptable performance for all calibration spans greater than or equal to 5 µg/m3.
24
(b) Introduce the interference test gases listed in Table 30A-3 in Section 17.0 into
the measurement system separately or as a mixture. The interference test gases HCl and
NO must be introduced as a mixture. The interference test gases must be introduced into
the sampling system at the probe such that the interference gas mixtures pass through all
filters, scrubbers, conditioners, and other components as would be configured for normal
sampling.
(c) The interference test must be performed using HgCl2, and each interference
test gas (or gas mixture) must be evaluated in triplicate. This is accomplished by
measuring the Hg response first with only the HgCl2 gas present and then when adding
the interference test gas(es) while maintaining the HgCl2 concentration of the test stream
constant. It is important that the equipment used to conduct the interference test be of
sufficient quality so as to be capable of blending the HgCl2 and interference gases while
maintaining the Hg concentration constant. Gas blending system or manifolds may be
used.
(d) The duration of each test should be for a sufficient period of time to ensure
the Hg measurement system surfaces are conditioned and a stable output is obtained.
Measure the Hg response of the analyzer to these gases in µg/m3. Record the responses
and determine the overall interference response using Table 30A-4 in Section 17.0 and
the equations presented in Section 12.11. The specification in Section 13.4 must be met.
(e) A copy of these data, including the date completed and a signed certification,
must be included with each test report. The intent of this test is that the interference test
results are intended to be valid for the life of the system. As a result, the Hg
measurement system should be operated and tested in a configuration consistent with the
25
configuration that will be used for field applications. However, if the system used for
field testing is not consistent with the system that was interference-tested, the interference
test must be repeated before it is used for any field applications. Examples of such
conditions include, but are not limited to: major changes in dilution ratio (for dilution
based systems), changes in catalyst materials, changes in filtering device design or
materials, changes in probe design or configuration, and changes in gas conditioning
materials or approaches.
9.0 Quality Control
What quality control measures must I take?
The table which follows is a summary of the mandatory, suggested, and
alternative quality assurance and quality control measures and the associated frequency
and acceptance criteria. All of the QC data, along with the run data, must be documented
and included in the test report.
26
Summary Table of QA/QC Requirements
Status1
Process or
Element
S
Identify Data
User
M
Analyzer
Design
QA/QC Specification
Acceptance Criteria
Regulatory Agency or other primary end user of data
Checking
Frequency
Before designing test
Analyzer range
Sufficiently > than high-level gas to allow determination
of system calibration error
S
Analyzer resolution or
sensitivity
< 2.0 % of full-scale range
S
Interference response
Overall response ≤ 3 % of calibration span
Traceability protocol
Alternatively, overall response ≤ 0.3 µg/m3
Validation of concentration required
M
High-level Hg0 gas
Equal to the calibration span
Each calibration error
test
M
Mid-level Hg0 gas
40 to 60% of calibration span
Each calibration error
test
M
Low-level Hg0 gas
10 to 30% of calibration span
Each calibration error
test
M
High-level HgCl2 gas
Equal to the calibration span
Each system integrity
check (if it better
represents Cnative than
the mid level gas)
M
Mid-level HgCl2 gas
40 to 60% of calibration span
Each system integrity
check (if it better
represents Cnative than
the high level gas)
M
Calibration
Gases
27
Manufacturer design
M
Zero gas
Each system integrity
check
M
Dynamic spike gas
3
(Cnative ≥ 1 µg/m )
M
Dynamic spike gas
3
(Cnative < 1 µg/m )
A high-concentration HgCl2 gas, used to produce a spiked Pre-test;
sample concentration that is 150 to 200% of the native
dynamic spiking not
concentration.
required until 1/1/09
A high-concentration HgCl2 gas, used to produce a spiked Pre-test;
sample concentration that is 1 to 2 µg/m3 above the native dynamic spiking not
concentration.
required until 1/1/09
S
Data Recorder Data resolution
Design
≤ 0.5% of full-scale
Manufacturer design
M
Sample
Extraction
Probe material
Inert to sample constituents (e.g.,PFA Teflon, or quartz if
stack > 500E F)
Each run
M
Sample
Extraction
Probe, filter and sample
line temperature
For dry-basis analyzers, keep sample above the dew point, Each run
by heating prior to moisture removal
For wet-basis analyzers, keep sample above dew point at
all times, by heating or dilution
M
Sample
Extraction
Calibration valve material
Inert to sample constituents (e.g., PFA Teflon or PFA
Teflon coated)
Each test
S
Sample
Extraction
Sample pump material
Inert to sample constituents
Each test
M
Sample
Extraction
Manifold material
Inert to sample constituents
Each test
M
Particulate
Removal
Filter inertness
Pass calibration error check
Each calibration error
check
28
M
CE ≤ 5.0 % of the calibration span for the low-, mid- or
high-level Hg0 calibration gas
Before initial run and
after a failed system
integrity check or
drift test
System
Calibration
Performance
System calibration error
(CE) test
M
System
Calibration
Performance
System integrity check
Error ≤ 5.0 % of the calibration span for the zero and mid- Before initial run,
after each run, at the
or high-level HgCl2 calibration gas
3
Alternative specification: # 0.5 µg/m absolute difference beginning of
subsequent test days,
between system response and reference value
and after a failed
system integrity
check or drift test
M
System
Performance
System response time
Used to determine minimum sampling time per point
M
System
Performance
Drift
< 3.0 % of calibration span for the zero and mid- or high- At least once per test
level gas
day
Alternative specification: # 0.5 µg/m3 absolute difference
between system response and reference value
During initial 3-point
system calibration
error test
Alternative specification: # 0.3 µg/m3 absolute difference
between pre- and post-run system calibration error
percentages
M
System
Performance
Minimum sampling time
The greater of two times the system response time or 10
minutes. Concentrating systems must also include at least
4 cycles
M
System
Performance
Percentage spike recovery Percentage spike recovery, at the target level: 100 ± 10%
and relative standard
Relative standard deviation: ≤ 5 percent
deviation
Alternative specification: absolute difference between
calculated and measured spike values ≤ 0.5 µg/m3
29
Each sampling point
Before initial run;
dynamic spiking not
required until 1/1/09
M
Sample Point
Selection
Number and Location of
Sample Points
Prior to first run
For emission testing applications, use 12 points, located
according to Method 1 in appendix A-1 to this part, unless
the results of a stratification test allow fewer points to be
used
For Part 60 RATAs, follow the procedures in Performance
Specification 2, section 8.1.3, and for Part 75 RATAs,
follow the procedures in section 6.5.6 of appendix A to
Part 75. That is:
•
At any test location, you may use 3 sample points
located at 16.7, 50.0, and 83.3% of a “long”
measurement line passing through the centroidal area;
or
•
At any test location, you may use 6 sample points
along a diameter, located according to Method 1 (Part
75 RATAs, only); or
•
At a location where stratification is not expected and
the measurement line is > 2.4 m (7.8 ft), you may use
3 sample points located along a “short” measurement
line at 0.4, 1.0, and 2.0 m from the stack or duct wall
or, for Part 75 only, sample points may be located at
4.4, 14.6, and 29.6% of the measurement line; or
•
After a wet scrubber or at a point where dissimilar gas
streams are combined, either locate 3 sample points
along the “long” measurement line or locate 6 Method
1 points along a diameter (Part 75, only), unless the
results of a stratification test allow you to use a
“short” 3-point measurement line or to sample at a
single point
30
•
A
Sample Point
Selection
If it can be demonstrated that stack gas concentration
is <3 :g/m3, then the test site is exempted from
stratification testing. Use the 3-point “short”
measurement line if the stack diameter is > 2.4 m (7.8
ft) and the 3-point “long” line for stack diameters ≤
2.4 m (7.8 ft)
Prior to first run
Stratification Test
(see Section 8.1.3)
If the Hg concentration2 at each traverse point during the
stratification test is:
Prior to 1/1/09, you
may (1) forgo
stratification testing
$ Within ± 5% of mean, use 1-point sampling (at the
and use 3 sampling
point closest to the mean); or
points (as per Section
$ Not within ± 5% of mean, but is within ± 10% of
mean, use 3-point sampling. Locate points according 8.1.3.2.2) or (2)
perform a SO2
to Section 8.1.3.2.2 of this method
stratification test (see
Sections 6.5.6.1 and
Alternatively, if the Hg concentration at each point is:
3
• Within ± 0.2 µg/m of mean, use 1-point sampling (at 6.5.6.3 of appendix A
to part 75), in lieu of
the point closest to the mean); or
a Hg stratification
3
• Not within ± 0.2 µg/m of mean, but is within ± 0.5
test. If the test
3
µg/m of mean, use 3-point sampling. Locate points
location is
according to Section 8.1.3.2.2 of this method
unstratified or
minimally stratified
If the Hg concentration is >10% of the mean at any point, for SO2, it can be
then, if the alternative specification is not met or if the
considered
stack diameter is ≤ 2.4 m (7.8 ft):
unstratified or
minimally stratified
• Perform sampling at 12 Method 1 points; or
• Sample at 3 points located at 16.7, 50.0 and 83.3% of for Hg also
the measurement line that exhibited the highest
On and after 1/1/09,
average Hg concentration during stratification test; or only Hg stratification
tests are acceptable
• Sample at 6 Method 1 points along the line that
exhibited the highest average Hg concentration (Part for the purposes of
this method
75 RATAs, only)
31
M
Data
Recording
Frequency
Once per cycle
During run
S
Data
Parameters
Sample concentration and
calibration span
All analyzer readings during each run within calibration
span
Each run
M
Data
Parameters
Sample concentration and
calibration span
All analyzer readings during dynamic spiking tests within Each spike injection
120% of calibration span
M
1
2
Data
Sample concentration and Average Hg concentration for the run ≤ calibration span Each run
Parameters
calibration span
M = Mandatory ; S = Suggested; A = Alternative
These may either be the unadjusted Hg concentrations or concentrations normalized to account for temporal variations.
32
10.0 Calibration and Standardization
What measurement system calibrations are required?
Your analyzer must be calibrated with Hg0 standards. The initial 3-point system
calibration error test described in Section 8.2.4 is required before you start the test. Also,
prior to and following test runs, the two-point system integrity checks described in
Sections 8.2.5 and 8.2.8 are required. On and after January 1, 2009, the pre-test dynamic
spiking procedure described in section 8.2.7 is also required to verify that the accuracy of
the measurement system is suitable and not adversely affected by the flue gas matrix.
11.0 Analytical Procedures
Because sample collection and analysis are performed together (see Section 8),
additional discussion of the analytical procedure is not necessary.
12.0 Calculations and Data Analysis
You must follow the procedures for calculations and data analysis listed in this
section.
12.1 Nomenclature. The terms used in the equations are defined as follows:
Bws
= Moisture content of sample gas as measured by Method 4 in
Appendix A-3 to this part, percent/100.
Cavg
= Average unadjusted Hg concentration for the test run, as indicated by
the data recorder µg/m3.
C baseline = Average Hg concentration measured before and after dynamic spiking
injections, µg/m3.
Cd
= Hg concentration, dry basis, µg/m3.
Cdif
= Absolute value of the difference between the measured Hg
concentrations of the reference HgCl2 calibration gas, with and
without the individual or combined interference gases, µg/m3.
33
Cdif avg = Average of the 3 absolute values of the difference between the
measured Hg concentrations of the reference HgCl2 calibration gas,
with and without the individual or combined interference gases,
µg/m3.
Cgas
= Average Hg concentration in the effluent gas for the test run, adjusted
for system calibration error, µg/m3.
Cint
= Measured Hg concentration of the reference HgCl2 calibration gas
plus the individual or combined interference gases, µg/m3.
Cm
= Average of pre- and post-run system integrity check responses for the
upscale (i.e., mid- or high-level) calibration gas, µg/m3.
Cma
= Actual concentration of the upscale (i.e., mid- or high-level)
calibration gas used for the system integrity checks, µg/m3.
C0
= Average of pre- and post-run system integrity check responses from
the zero gas, µg/m3.
Cnative
= Vapor phase Hg concentration in the source effluent, µg/m3.
Cref
= Measured Hg concentration of the reference HgCl2 calibration gas
alone, in the interference test, µg/m3.
Cs
= Measured concentration of a calibration gas (zero-, low-, mid-, or
high-level), when introduced in system calibration mode, µg/m3.
Cspike
= Actual Hg concentration of the spike gas, µg/m3.
C*spike =
Hg concentration of the spike gas required to achieve a certain target
value for the spiked sample Hg concentration, µg/m3.
Css
= Measured Hg concentration of the spiked sample at the target level,
µg/m3.
C*ss
= Expected Hg concentration of the spiked sample at the target level,
µg/m3.
Ctarget
= Target Hg concentration of the spiked sample, µg/m3.
CTnative = Measured tracer gas concentration present in native effluent gas, ppm.
CTdir
= Tracer gas concentration injected with spike gas, ppm.
34
CTv
= Diluted tracer gas concentration measured in a spiked sample, ppm.
Cv
= Certified Hg0 or HgCl2 concentration of a calibration gas (zero, low,
mid, or high), µg/m3.
Cw
= Hg concentration measured under moist sample conditions, wet basis,
µg/m3.
CS
= Calibration span, µg/m3.
D
= Zero or upscale drift, percent of calibration span.
DF
= Dilution factor of the spike gas, dimensionless.
I
= Interference response, percent of calibration span.
Qprobe
= Total flow rate of the stack gas sample plus the spike gas, liters/min.
Qspike
= Flow rate of the spike gas, liters/min.
Ri
= Individual injection spike recovery, %.
R
= Mean value of spike recoveries at a particular target level, %.
RSD
= Relative standard deviation, %.
SCE
= System calibration error, percent of calibration span.
SCEi
= Pre-run system calibration error during the two-point system integrity
check, percent of calibration span.
SCEf
= Post-run system calibration error during the two-point system
integrity check, percent of calibration span.
12.2 System Calibration Error. Use Equation 30A-1 to calculate the system
calibration error. Equation 30A-1 applies to: 3-point system calibration error tests
performed with Hg0 standards; and pre- and post-run two-point system integrity checks
performed with HgCl2.
SCE =
C s − Cv
x 100
CS
Eq. 30A-1
35
12.3 Drift Assessment. Use Equation 30A-2 to separately calculate the zero and
upscale drift for each test run.
D = SCE f − SCEi
Eq. 30A-2
12.3 Effluent Hg Concentration. For each test run, calculate Cavg, the arithmetic
average of all valid Hg concentration values recorded during the run. Then, adjust the
value of Cavg for system calibration error, using Equation 30A-3.
C gas = (C avg − C 0 )
C ma
Cm − C0
Eq. 30A-3
12.4 Moisture Correction. Use Equation 30A-4a if your measurements need to
be corrected to a dry basis.
Cd =
Cw
1 − Bws
Eq. 30A-4a
Use Equation 30A-4b if your measurements need to be corrected to a wet basis.
C w = C d × (1 − Bws )
Eq. 30A-4b
12.5 Dynamic Spike Gas Concentrations. Use Equation 30A-5 to determine the
spike gas concentration needed to produce a spiked sample with a certain “target” Hg
concentration.
*
C spike
= DF (C t arg et − C native ) + C native
Eq. 30A-5
12.6 Spiked Sample Concentration. Use Equation 30A-6 to determine the
expected or theoretical Hg concentration of a spiked sample.
C * ss = C native +
(C
spike
− C native )
DF
36
Eq. 30A-6
12.7 Spike Recovery. Use Equation 30A-7 to calculate the percentage recovery
of each spike.
R=
DF (C ss − C native ) + C native
× 100%
C spike
Eq. 30A-7
12.8 Relative Standard Deviation. Use Equation 30A-8 to calculate the relative
standard deviation of the individual percentage spike recovery values from the mean.
∑ (R
n
RSD =
100%
R
i =1
i
−R
)
2
n −1
Eq. 30A-8
12.9 Spike Dilution Factor. Use Equation 30A-9 to calculate the spike dilution
factor, using either direct flow measurements or tracer gas measurements.
DF =
Q probe
Qspike
=
CTdir − CTnative
CTv − CTnative
Eq. 30A-9
12.10 Native Concentration. For spiking procedures that inject blank or carrier
gases (at the spiking flow rate, Qspike) between spikes, use Equation 30A-10 to calculate
the native concentration.
C native =
C baseline DF
DF − 1
Eq. 30A-10
For spiking procedures that halt all injections between spikes, the native concentration
equals the average baseline concentration (see Equation 30A-11).
C native = C baseline
Eq. 30A-11
12.11 Overall Interference Response. Use equation 30A-12 to calculate the
overall interference response.
37
I=
∑C
difavg
CS
x 100
Eq. 30A-12
Where, for each interference gas (or mixture):
3
C difavg =
∑C
dif
1
3
Eq. 30A-13
and
Cdif = Cref − C int
Eq. 30A-14
13.0 Method Performance
13.1 System Calibration Error Test. This specification applies to the 3-point
system calibration error tests using Hg0. At each calibration gas level tested (low-, mid-,
or high-level), the calibration error must be within ± 5.0 percent of the calibration span.
Alternatively, the results are acceptable if | Cs - Cv | ≤ 0.5 µg/m3.
13.2 System Integrity Checks. This specification applies to all pre- and post-run
2-point system integrity checks using HgCl2 and zero gas. At each calibration gas level
tested (zero and mid- or high-level), the error must be within ± 5.0 percent of the
calibration span. Alternatively, the results are acceptable if | Cs - Cv | ≤ 0.5 µg/m3.
13.3 Drift. For each run, the low-level and upscale drift must be less than or
equal to 3.0 percent of the calibration span. The drift is also acceptable if the pre- and
post-run system integrity check responses do not differ by more than 0.3 µg/m3
(i.e., | Cs post-run - Cs pre-run | ≤ 0.3 µg/m3).
13.4 Interference Test. Summarize the results following the format contained in
Table 30A-4. For each interference gas (or mixture), calculate the mean difference
between the measurement system responses with and without the interference test
38
gas(es). The overall interference response for the analyzer that was used for the test
(calculated according to Equation 30A-12), must not be greater than 3.0 percent of the
calibration span used for the test (see Section 8.6). The results of the interference test are
also acceptable if the sum of the absolute average differences for all interference gases
(i.e., Σ Cdif avg) does not exceed 0.3 µg/m3.
13.5 Dynamic Spiking Test. For the pre-test dynamic spiking, the mean value of
the percentage spike recovery must be 100 ± 10 percent. In addition, the relative
standard deviation (RSD) of the individual percentage spike recovery values from the
mean must be ≤ 5.0 percent. Alternatively, if the mean percentage recovery is not met,
the results are acceptable if the absolute difference between the theoretical spiked sample
concentration (see Section 12.6) and the actual average value of the spiked sample
concentration is ≤ 0.5 µg/m3.
14.0 Pollution Prevention [Reserved]
15.0 Waste Management [Reserved]
16.0 References
1. EPA Traceability Protocol for Qualification and Certification of Elemental
Mercury Gas Generators, expected publication date December 2008, see
www.epa.gov/ttn/emc.
2. EPA Traceability Protocol for Qualification and Certification of Oxidized
Mercury Gas Generators, expected publication date December 2008, see
www.epa.gov/ttn/emc.
39
3. EPA Traceability Protocol for Assay and Certification of Gaseous Calibration
Standards, expected revision publication date December 2008, see
www.epa.gov/ttn/emc.
17.0 Figures and Tables
40
Figure 30A-1: Example Hg Measurement System
41
Optional Interference Test
(Prior to field use)
Pre-run System Integrity Check (Hg+2)
Corrective
Action
Sampling Point Selection
Calibration Gas Verification
Start
No
Pass?
Yes
Pass?
No
3-pt System Calibration
Error (Hg0)
Yes
Collect Run Data
Corrective
Action
0
3-pt System Calibration Error (Hg )
Corrective
Action
No
Post-run
System Integrity Check
(Hg+2)
Pass?
Fail
Discard
Run
Yes
Pass
Initial System Integrity Check (Hg+2)
Corrective
Action
No
Drift
Evaluation
Pass?
Yes
Yes
Pass?
Dynamic Spiking
(Required 1/1/09)
Corrective
Action
No
Pass?
Yes
Pass
No
No
Optional Post-Spiking
System Integrity
Check (Hg+2)
Yes
Corrective
Action
Figure 30A-2. Testing Flow Chart
42
Was this the
last run?
Test is Complete
Fail
Table 30A-1: 3-Point System Calibration Error Tests
Test Runs Covered: ____________________
Analyzer make & model no._____________
Serial no.____________________________
Calibration span (CS):__________________
System response time: _________________
Facility name: ____________________
Unit(s) tested:_____________________
Test personnel:____________________
Date: ____________________________
Time: ____________________________
Calibration Gas Level
Certified Gas
Concentration
(µg/m3)
A
System
Response
(µg/m3)
B
Low
Mid
High
43
Absolute
Difference
*A-B*
Calibration
Error
(% of
calibration
span)
[*A-B*]*100
CS
Table 30A-2: System Integrity Check and Drift Data
Facility name:
Analyzer make & model: _______________
Unit(s) tested:
Serial number: _______________________
Test personnel:
Run number(s) covered: _______________
Date(s):
Calibration span: _____________________
Calibration
Gas
Level
(zero, mid,
or high)
Certified
Calibration
Gas Value
(µg/m3)
Initial
System
Respons
e
(µg/m3)
Final
System
Respons
e
(µg/m3)
44
Absolute
Difference
(µg/m3)
Drift
(% of
calibration
span)
Table 30A-3: Interference Check Gas Concentrations
Potential
Interferent
Gas 1
Concentration,
tentative - (balance N2)
CO2
15% ± 1% CO2
CO
100 ± 20 ppm
HCl
2
100 ± 20 ppm
2
NO
250 ± 50 ppm
SO2
200 ± 20 ppm
O2
3% ± 1% O2
H2O
10% ± 1% H2O
Nitrogen
Balance
Other
1 Any of these specific gases can be tested at a lower level if the manufacturer has
provided reliable means for limiting or scrubbing that gas to a specified level.
2 HCl and NO must be tested as a mixture.
45
Table 30A-4: Example Interference Test Data Sheet
Date of Test: ____________________________________________
Analyzer Type: __________________________________________
Model No.: _____________________________________________
Serial No.: ______________________________________________
Calibration Span: ________________________________________
Test Organization: _______________________________________
Test Personnel: __________________________________________
Interference
Gas
Hg Concentration
(µg/m3 )
Hg Concentration
(µg/m3 )
w/Interference Gas
Absolute Difference
(µg/m3 )
Sum of Responses
% of Calibration Span
46
Average Absolute
Difference
(µg/m3 )
Table 30A-5: Example Dynamic Spiking Data Sheet
Facility name: ___________________________
Unit(s) tested: ___________________________
Analyzer make & model: __________________
Serial number: ___________________________
Calibration span: ____________________ µg/m3
Qprobe
(lpm)
Qspike
(lpm)
DF
1
Target Level2
C*spike
C*ss
(µg/m3)
(µg/m3)
Date: __________
Time: __________
Test personnel: _______________________
Estimated native Hg concentration: _______ µg/m3
Estimated unspiked sample flow rate: _______ lpm
Estimated spike gas flow rate: _______ lpm
Cnative (µg/m3)
Pre
Post
Avg.
Actual Values
Cspike
Css
3
(µg/m )
(µg/m3)
Avg.
RSD
1
2
DF must be ≥ 5
C*ss/Cnative must be ≥ 1.5 and ≤ 2.0, where Cnative and C*ss are estimated values
47
% Spike
Recovery
48