1
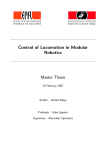
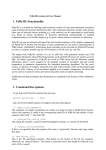
Version 1.1 User Manual Contents
0. Introduction ........................................................................................................................2 1. Theory ................................................................................................................................3 1.1. Docking and Scoring ...................................................................................................3 1.2. Molecular Hydrophobicity Potential (MHP) ..............................................................4 1.3. Stacking and Aromatic Interactions ............................................................................6 1.4. Hydrogen Bonds .........................................................................................................7 1.5. RMSD and TcIFP........................................................................................................8 2. Usage ................................................................................................................................10 2.1. Uploading Molecules ................................................................................................11 2.2. MHP Parameters .......................................................................................................13 2.3. 2D-Hydrophobicity Maps .........................................................................................17 2.4. Scoring the Results of Docking ................................................................................18 2.5. Visualization of Hydrophobic/Hydrophilic Properties in Jmol ................................20 2.6. Saving Data to View MHP in a Molecular Visualization Application .....................21 2.7. Format of Output Files for Visualizing MHP ...........................................................23 2.8. Processing WARNING and ERROR messages ........................................................25 3. Getting Help, Feedback and References ..........................................................................27 4. Cited Literature ................................................................................................................28 1
0. Introduction
PLATINUM (Protein-Ligand ATtractions Investigation NUMerically) web-service is
designed for analysis of hydrophobic/hydrophobic jrganization of biomolecular complexes.
PLATINUM numerically estimates hydrogen bonds, stacking and hydrophobic
intearactions in receptor-ligand complexes. This feature can be used to filter docking poses
generated by jther software.
PLATINUM generates 2D hydrophobicity maps for certain molecular systems - lipid
bilayers and α-helical peptides. This feature (included in version 1.1) facilitates analysis of
hydrophobic/hydrophilic interactions in complex biomolecular systems.
2
1. Theory
1.1. Docking and Scoring
PLATINUM does not perform ligand docking or any geometry optimization – it only uses
given 3D coordinates of biological molecules to calculate and visualize their
hydrophobic/hydrophilic properties.
PLATINUM also calculates hydrophobic/hydrophilic match between two interacting
molecules. These are referred to as receptor and ligand. However all this is relative – user can
supply a lipid bilayer as receptor and a peptide as the ligand or even vice versa.
Hydrophobic/hydrophilic match can be used to filter the results of molecular docking. This
can be particularly useful in certain cases (e.g. docking of nucleotides; Pyrkov et al., 2007)
where hydrophobic interactions play the crucial role in molecular recognition and therefore
deserve more precise analysis. To facilitate the analysis of docking poses multiple ligands can be
uploaded with the same structure of receptor.
3
1.2. Molecular Hydrophobicity Potential (MHP)
Hyrophobic effect plays crucial role in biomolecular recognition and sustaining 3D
structure of complex molecular systems in a living cell (e.g. lipid bilayers, lipid-protein
complexes). The force driving apolar substancies to avoid contacts with polar solvent (water)
results in effective hydrophobic (lipophilic) interaction and has very complex physical nature. To
describe this effect in molecular biology empirical methods are used, which are mostly based on
experimental data on partitioning of organic compounds between polar and apolar environments
(see review for details: Efremov et al., 2007).
A popular approach is to use the formalism of Molecular Hydrophobic Potential (MHP)
a.k.a. Molecular Lipophilic Potential (MLP). Each atom is assigned a hydrophobic (positive) or
hydrophilic (negative) constant derived from experimental data. PLATINUM uses
parameterization on octanol/water partition data from two sources: Ghose et al., 1998 and
Viswanadhan et al., 1989. Then the hydrophobic properties can be calculated on molecular
surfaces or on a 3D grid (Fig. 1.1). Exponential decay is most popular (Fauchere et al., 1988;
Gaillard et al., 1994), however hyperbolic (Audry et al., 1986) or Fermi-like cut-off (Heiden et
al., 1993) functions are also applied in some studies and are implemented in PLATINUM.
Figure 1.1. The concept of Molecular
Hydrophobicity Potential (MHP). Let us
consider for instance Russian vodka. Each atom
in a molecule (ethanol or water) is assigned a
tabulated empirical hydrophobic or hydrophilic
(positive or negative, respectively) constant
based
on
molecular
topology.
Then
hydrophobic/hydrophilic properties of a
molecule can be calculated on its surface and
compared to the properties of neighboring
molecules to estimate the hydrophobic effect.
MHP at point j is a sum of atomic MHP
constants fi decaying with the distance rij.
To estimate the hydrophobic/hydrophilic complementarity of a ligand to the receptor
binding site PLATINUM calculates hydrophobic/hydrophilic properties of both the ligand and its
environment on the ligand molecular surface (the interface). While for ligand it is rather
straightforward to do, some issues arise when its environment is considered.
Metal ions present in the active site of many enzymes lack parameterization for MHP. By
default PLATINUM assignes them a constant of -1.37 corresponding to experimental logP of a
water molecule.
Solvent (except reacting water molecules) is omitted in the docking process leaving an
empty space around the ligand. PLATINUM surrounds the ligand by a rectangular grid of “water
hydrophilic charges” (Fig. 1.2).
4
Figure 1.2. Grid simulating hydrophilic
properties
of
water
which
is
implemented in PLATINUM. Grid nodes
fill the empty space around ligand (dark
molecule) bound in the active site of
receptor (light molecule, represented by
ribbon). The parametes of the grad are:
grid step = 2 Å; grid node hydrophilic
constant = -0.38.
By complementarity of hydrophobic and hydrophilic properties between receptor and
ligands we mean that hydrophobic–hydrophobic and hydrophilic–hydrophilic receptor-ligand
contacts are favorable or complementary and hydrophobic–hydrophilic contacts are
anticomplementary
(unfavorable).
PLATINUM
calculates
hydrophobic/hydrophilic
complementarity based on surface area of favorable and unfavorable contacts which are
attributed to one of the six types (Fig. 1.3):
LL
LH
LH'
HL
HH
HH'
– Lipophilic ligand, Lipophilic receptor;
– Lipophilic ligand, Hydrophilic receptor;
– Lipophilic ligand, Hydrophilic solvent (water);
– Hydrophilic ligand, Lipophilic receptor;
– Hydrophilic ligand, Hydrophilic receptor;
– Hydrophilic ligand, Hydrophilic solvent (water).
Figure 1.3. Types of contacts
between ligand and its environment
on ligand molecular surface. Each
dot type corresponds to different
combination
of
ligand
and
environmental
MHP
(i.e.
hydrophobic/hydrophilic properties).
Character “L” means lipophilic
(brown, oil-colored) and “H” –
hydrophilic (blue, water-colored).
Apostrophe
symbol
designates
exposed ligand surface which is in
contact with hydrophilic solvent.
Hereinafter, each of these codes will be used to designate the corresponding surface area
(for example SLL is the area of ligand molecular surface corresponding to dots of type LL). To
rank the uploaded list of complexes, the user may choose between different criteria (See section
3.3 “Scoring the results of docking”).
5
1.3. Stacking and Aromatic Interactions
Aromatic fragments often form stacking and “T-shaped” contacts, which to our view are
not always paid due attention in many scoring functions. The most popular example is DNA
where parallel stacking between nitrogen bases contributes much to the stability of a
macromolecule. While this type of interactions is not as widespread as e.g. h-bonds or
hydrophobic contacts, the thing may be quite different in case of some specific types of ligands.
Thus, we have shown that stacking plays important role in recognition of ATP (Adenosine
triphosphate) by proteins (Pyrkov et al., 2007).
Figure 1.4. Scheme of geometrical parameters used
to describe a stacking contact between two
aromatic rings. Displacement (d) and height (h) are
calculated for the center of one aromctic ring
relative to another ring’s plane. Angle α is
calculated as the angle between the normal vectors
of both rings.
Currently, PLATINUM implements a simple method to detect a stacking contact between
a ligand and a receptor based on geometrical parameters. Stacking in PLATINUM is estimated
by the following formulas:
where d and h are, respectively, displacement and
height of the center of one aromatic ring relative to
each other, and α is the angle between their planes
(Fig. 1.4);
cos
; sin
1.0;
/
;
/
;
0.0;
1.0;
0.0;
where the particular form of Sα(α) defines whether we
observe parallel (cos2α ≥ 0.5) or “T-shaped” edge-toface (sin2α > 0.5) stacking;
where h1 = 4.0 Å and h0 = 5.0 Å for parallel stacking
and h1 = 5.0 Å and h0 = 6.0 Å for edge-to-face
stacking;
where d1 = 2.0 Å and d0 = 3.0 Å for any type of
stacking arrangement. The parameters of stacking
were derived from the statistical analysis of contacts of
nucleobases with aromatic amino acids in proteins
(Pyrkov et al., 2007).
For each ring of a conjugated aromatic cycle stacking is calculated separately and then
summed (for e.g. naphtalene the value can be greater than 1.0). Flat guanidinium groups (which
can be found in Arg side chain) are treated in the same way as aromatic rings.
6
1.4. Hydrogen Bonds
Hydrogen bond are also identified simply by geometrical criteria according to the
following formulas:
where rAD is the distance between the
hydrogen donor and acceptor and αADH is the
angle betwee acceptor, donor, and the
hydrogen atom (Fig. 1.5);
1.0;
/
where r1 = 3.2 Å and r0 = 3.4 Å;
;
0.0;
1.0;
/
where α1 = 0° and α0 = 20° when donor is
nitrogen and α1 = 20° and α0 = 40° when
donor is oxygen (in this case PLATINUM
also rotates the hydrogen atom seeking for
best geometry); αideal = 0°.
;
0.0;
|
|
Figure 1.5. Scheme of geometrical parameters
used to describe a hydrogen bond.
7
1.5. RMSD and TcIFP
Root-mean-square deviation (RMSD) and Tanimoto coefficient of interaction fingerprints
(TcIFP) are the measures of similarity between two distinct docking poses. Using these criteria,
all docking solutions can be clustered into groups to reduce redundancy or compared to the
correct crystallographic structure when testing the performance of a docking algorithm.
RMSD is the most common way to compare docking poses. RMSD between poses a and b
is calculated over 3D-coordinates of all N heavy atoms of ligand by the following equation:
∑
For two completely similar positions of ligand in 3D-space RMSD = 0. Usually, in
docking applications RMSD 2 Å is considered acceptable, i.e. if docking yields ligand poses
within this cutoff of RMSD from crystallographic (or NMR) structure for most of the reference
receptor-ligand complexes it is likely to produce reliable predictions for others.
IFP represents a more complex notion and has not yet achieved wide use. The basic idea is
that RMSD does not always provide complete information about the similarity of orientation of a
ligand in the binding site. Thus, in some cases even low RMSD may correspond to distinctly
different intermolecular contact pattern and vice versa. One way to treat this problem may be
using some quantitative measure of similarity of contacts with receptor, such as hydrogen bonds,
salt-bridges, etc. And IFP provides such measure.
Figure 1.6. An example of IFP bit string. Inhibitor staurosporin is shown in CyclinDependent Kinase 2 active site (PDB code 1AQ1). Interactions of selected residues are shown as
they are encoded into an IFP bit string.
8
Introduced recently (Deng et al., 2004), IFP represents a conversion of 3D pattern of
contacts between ligand and receptor into 1D bit string. Here, a set of bits, corresponding to
different intermolecular contacts is assigned to each receptor residue in the vicinity of the ligandbinding site (Fig. 1.6; in PLATINUM these bits are different from those in the original
implementation by Deng et al., 2004, see below). When a contact with a particular residue is
observed, e.g. a hydrogen-bond is formed, the corresponding bit is raised. And two bit-strings
coding two docking poses can be compared now indicating whether they are similar or not. To
compare the strings A and B, coding two ligand poses a Tanimoto coefficient is used:
|
|
|
|
Here A B is the number of raised bits common to both poses, and A B is the number of
bits raised for either ligand A or B. Consequntly the value of TcIFP can vary between 0 (different
poses) and 1 (identical poses).
A weak point of the IFP comes from its definition: Criteria to judge whether a contact is
formed or not, are not universal. Thus, although IFP was introduced only some years ago, a
number of different approaches to treat the interaction bits has already been described in
literature. This is because besides such contacts as hydrogen-bond with well-defined geometrical
parameters, there exist stacking or hydrophobic contacts for which different criteria may be
applied. For stacking this problem can be solved to some extent by data extraction from
structural databases (Pyrkov et al., 2007, Meyer et al., 2003). Meanwhile for hydrophobic
interaction this task is quite more challenging since the nature of forces driving this interaction is
still poorly understood. So, in PLATINUM we used our own approach to describe ligand–
receptor contacts. These contacts and the rules defining their formation are listed in Table 1.1
(However later these may undergo improvement and any remarks are welcome).
Table 1.1. Interaction bits in IFP.
Interaction bit
rules
h-bond
1) rDA < 3.4 Å;
2) <ADH < 40° (or in case of –OH group:
<RDA = 105° ± 20°)
h-bond
(to protein main chain)
salt-bridge
Same + receptor is a protein molecule and its
atom is named “O” or “N” in the structure file
rNP < 6Å
metal ligation bond
rAM < 4Å
stacking
(including guanidinium group)
1) d < 3Å;
2) h < 5Å and cos2α > 0.1 (for parallel
stacking);
2’) h < 6Å and sin2α > 0.1 (for T-shaped
stacking)
hydrophobic
At least 2 recptor hydrophobic atoms are
within 7Å to hydrophobic ligand atoms.
9
comments
A – acceptor; D – donor; H –
hydrogen; R – atom next to –OH
group;
N – atom with formal negative
charge;
P – atom with formal positive
charge;
M – metal ion; A – ligated atom,
same as acceptor in h-bond
d – displacement; h-height and α
– angle between two plane
fragments represented by their
centers (see picture in Theory
section)
2. Usage
Briefly, the workflow of PLATINUM is the following:
Step 1. Upload ligands and receptor in separate files (Section 2.1).
Step 2. Set MHP parameters. Optionally mark here one of the ligands as the reference to
compare all the others to this one by RMSD, e.g. ligand pose taken from the X-ray structure.
Then launch PLATINUM calculation (Section 2.2).
Step 3. Two panels appear on the results page. On the Receptor panel user can set
parameters for generation of 2D hydrophobicity maps for certain types of molecules lipid
bilayers and α-helical peptides (Section 2.3). On the Ligand(s) panel user can sort docking
solutions by one of the interaction terms. Download data in a tab-separated text file (Section
2.4).
Step 4. If desired, it is possible to view distribution of hydrophobic properties for selected
“best” solutions either by downloading files with precalculated MHP data (click the floppy-disk
icon ) or in Jmol applet on the PLATINUM web server (click the molecule icon ). (Sections
2.5 – 2.7).
Important! The results of PLATINUM calculations are stored for 30 days and are
accessible via the unique uid code. To get these results press the “Goto results page” caption in
the upper right corner on the PLATINUM main page. A dialog appears where the uid code
should be entered. This code is sent you by e-mail (if it was provided) or you shoud copy and
save the URL when you see the results page for the first time.
10
2.1. Uploading Molecules
PLATINUM supports input in five popular molecular file formats: pdb, mol2, sdf, gro
(used in the GROMACS package for molecular dynamics (Berendsen et al., 1995)), and mae
(used in molecular modeling package Maestro (Schrodinger LLC, 2007)). PLATINUM does not
perform ligand docking or any geometry optimization – it only uses given 3D coordinates of
biological molecules supplied by user.
Any file can be uploaded as either receptor or ligand. Molecules in such files will be
treated in different ways. All calculations (hydrophobic properties, interactions with receptor,
etc.) are performed for ligands. Receptor is only an environment for ligands. If multiple ligands
were uploaded one of them can be selected as the reference ligand – to calculate RMSD and TcIFP (see Theory) with other ligands. However 2D-hydrophobicity maps are generated for
molecules (or molecular systems) uploaded as receptor.
To upload files use the front panel (Fig 2.1). Here, the reference ligand should also be
listed in the ligand section.
Figure 2.1. The upload files menu. Here, the
receptor and the ligand files can be uploaded
to the PLATINUM server. In this example the
first ligand file is extracted from the X-ray
structure 1VFP (complex of Ca-ATPase with
ATP analogue), the others are docking poses.
At the next step, the file 1VFP_atp.pdb will be
marked as the reference structure. All docking
poses will be compared to it by the RMSD
values.
11
Important issues.
Remember that receptor and ligand molecules should be submitted in separate files!
Parameterization of atomic hydrophobicity constants requires that all atoms are protonated!
By default PLATINUM web server uses Adobe Flash Player 9 to upload files (version 10
does not work!). If Adobe Flash Player 9 is not installed on the computer one can use stadard
upload file form (click “simple mode”), which however may be somewhat boring when many
ligands are to be uploaded.
Java applet is required to be installed for on-line visualization of molecular
hydrophobic/hydrophilic properties.
The size of the molecules is limited to 5 Mb which roughly corrsponds to a molecule of
40,000 atoms (in mol2 file) and is obviously suitable for most practical applications
Any ligand file can contain more than one molecule, but this is not recommended. If
docking poses are uploaded in a single file PLATINUM will split the file and rename all the
poses adding numerical index.
Reference ligand can be selected at the next step. You can mark any one of the entries as
reference – not mandatory the first one. Only heavy atoms are used in calculation of RMSD and
IFP. RMSD will be set to -1.0 and IFP to -1.0 if either reference ligand was not marked or
PLATINUM did not manage to identify corresponding atoms in ligands (these are atoms with
identical atom name and residue name and number).
12
2.2. MHP Parameters
PLATINUM was mainly designed to facilitate analysis and visualization of
hydrophobic/hydrophilic properties of biological molecules. Some software packages provide
tools to calculate these properties using the same formalism of MHP. However, there is often
required a tool providing more flexibility of calculation.
PLATINUM provides a possibility to change some of these parameters (Fig. 2.2). Below is
the list of these parameters with discussion of the effect they may exert on the final result.
Figure 2.2. The MHP parameters tab. You can also provide your email address to receive
URL for the results page on the PLATINUM server by mail.
MHP table
New (Ghose, 1998)
Obsolete (Viswanadhan, 1989)
The parameterization of atomic hydrophobic/hydrophilic constants used in PLATINUM
implies a full-atom model – make sure that hydrogen atoms were added prior uploading files.
Two variants of this parameterization exist: The former one (Viswanadhan et al., 1989) and the
upgraded (Ghose et al., 1998). The resulting picture may differ for these two parameterizations:
The major changes in the new table relate more realistic negative (hydrophilic) constants for
some heteroatom types, particularly oxygen. Therefore, it is recommended to use the new
version, although the previous one was also kept in the program (mainly for comparison
purposes). For protein residues there will be little difference, however, for low molecular weight
compounds the difference between these two parameterizations may be prominent.
13
Distance function
exponential [exp(-r/2)]
exponential [exp(-r)]
hyperbolic
Fermi-like
Since MHP is an empirical approach, no “exact” distance-dependent decay function is
known (like it is for electrostatic or van der Waals energy). Several different approaches have
been described in literature. The most popular is the exponential function:
where MHPj is the hydrophobicity potential at point j, N is the number of atoms, r is the distance
between point j and atom i in Å, and α has the dimension of Å-1. Usually α = 1 Å-1 (Fauchere et
al., 1988) or α = ½ Å-1 (Gaillard et al., 1994; default in PLATINUM) are used.
Alternatively, a hyperbolic function was proposed by analogy with the electrostatic
potential energy. It is calculated according to the following formula (Audry et al., 1986):
1
where α = 1 Å-1. The unit was added to r in the denominator to avoid infinite values in the
vicinity of atom. Later, it was shown that this approach works well for small molecules, but for
protein it results in overaveraging of MHP on the surface due to large contribution of inner
atoms and therefore, a more rapidly decaying dependence is needed.
Finally, one can use averaging of atomic hydrophobicity constants in the vicinity of point j
with a cut-off function smoothed as a Fermi-like potential (Heiden et al., 1993):
∑
1
∑
1
where α = 1 Å-1. Here, only atoms that are closer than 4 Å to the point j are effectively
contributing to the MHPj.
MHP offset [-1.5; +1.5]
Empirical atomic hydrophobicity constants may need some correction to produce more
realistic picture of distribution of molecular properties. We found that moderate shift to the more
hydrophobic range improves the distribution of properties for low-molecular-weight compounds,
particularly nucleosides and nucleotides (Fig. 2.3). Meanwhile, such moderate shift does not
influence protein MHP greatly. So, it is recommended to use MHP offset of 0.03 logP units,
which is added to each atomic hydrophobicity constant prior to any MHP calculations. User can
change this value in the range [-1.5; +1.5], which covers the tabulated atomic constants. To
return to initial parameters (as they appear in the parameterization table) the MHP offset should
be set to zero.
14
MHPshift(ligand) [1.0; +1.0]
MHPshift(receptor) [1.0; +1.0]
These parameters are similar to the MHP offset but allow more flexible tuning of MHP
values. While the “MHP offset” adds the same constant to both the ligand and the receptor
atoms, “MHP shifts” provide separate change for these molecules. The difference is that “MHP
shifts” are added not to atoms, but to MHP at surface points (or grid points). However the effect
of “MHP offset” = 0.5 and “MHP shift” = 0.5 is almost the same. Both “MHP shift” values can
be varied in the range [-1.0; +1.0].
Figure 2.3. Correction of tabulated atomic hydrophobicity/hydrophilicity constants may
give more realistic picture. This is illustrated with ATP – a ligand representing a wide class of
nucleobase-containing ligand compounds. Aromatic purine ring usually tends to form
hydrophobic contacts with protein residues and indeed has less hydrophilic MHP values than the
ribose and phosphate moieties. However, a moderate shift of atomic constants to the
hydrophobic range provides a more clear picture (right in comparison with left) providing the
basis for numerical assessment of hydrophobic complementarity. Also the same shift of atomic
constants does not alter the overall picture for protein molecule and is therefore acceptable.
15
Dot density
VeryLow(~1.5 dot/Å2)
Low
(~5 dot/Å2)
Medium (~16 dot/Å2)
High
(~60 dot/Å2)
This parameter does not change much the overall picture. However, higher density makes
the result more robust, although it increases the elapsed time to process molecules. It is
recommended to use Low or Medium density for single calculations and VeryLow or Low
density for analysis of more than ~10 ÷ 100 ligand poses.
Ignore MHP assignment errors
PLATINUM automatically identifies the valencies of atoms and bond orders and based on
these data assigns atomic MHP constants. By default, if it fails to do so for any atom in a ligand
the error message is returned and no further calculations are performed. PLATINUM is more
forgiving to errors in the receptor molecule in assumption that if only a minor portion of atoms
have mistakes (≥ 10) they are likely to reside far from the active site and will not influence the
final result.
However if you are sure that the errors in one or even more atoms of the ligand molecule
may be neglected then mark the “Ignore errors” check-box. This will force the MHP calculations
anyway. This can be done e.g. when a peptidic ligand of ≥ 10 is not properly capped and manual
correction of such mistake may become a needless routine.
After all the parameters are set (and reference ligand selected), press the button:
Then your submission is queued and as soon as PLATINUM finishes, the results page is
displayed (the page will refresh every 30 seconds until PLATINUM finishes). If e-mail was
provided a notification is sent to this address.
16
2.3. 2D-Hydrophobicity Maps
On the Receptor panel user can set parameters for generation of 2D hydrophobicity maps
for certain types of molecules lipid bilayers and α-helical peptides. 2D maps for lipid bilayers
can only be built for .gro file format because the size of the box is required. If the uploaded
structure is not a lipid bilayer or an α-helix maps will be built anyway but it will make no sense.
Hydrophobicity map options:
Color scheme. Same as in Section 3.5: Brown-Cyan, Yellow-Green, Blue-Red.
Layer (only for lipid bilayers). Upper or lower layer of lipids – we assume that the
membrane lies in XY-plane of a rectangular box starting from point (X,Y,Z) = (0,0,0).
Residues range (only for α-helical peptides). The quality of the 2D-cylindrical map is good
only for α-helices close to ideal geometry. If the peptide has unstructured tails it is recommended
to manually select the residues that form the α-helical region. If the α-helix has a kink it is
recommended to build maps for each α-helical region separately.
Ligand projection.
All ligand molecules will be projected onto the surface along the Z-axis for lipid
membranes and along the radius for cylindrical maps of α-helices. Ligands are depicted as a
dotted area.
Shadow – fill ligand molecule is projected (see example in Fig. 2.4).
Cut-off – only parts of ligand closer than cut-off dictance to the membrane are projected.
Figure 2.4. An example of 2Dhydrophobicity
map
of
a
dioleoylphosphatidylserine
(DOPS)
layer. A membrane-active peptide
approaching the membrane (uploaded
as ligand) is projected onto the map in
“shadow” mode (depicted with
crosses).
17
2.4. Scoring the Results of Docking
On the Ligand(s) panel user can sort docking solutions by one of the interaction terms
caculated by PLATINUM for each ligand pose (Fig. 2.5). If a reference ligand was provided
there appear columns with RMSD and IFP (see Theory, Section 1.5).
If “There are warnings” caption appears user can click it to see the list of problems with
atom type assignment.
The “Save this table in tab-delimited format” button is below the table. Clicking here saves
the table in a tab-separated text file on a local disk for further analysis.
User can change MHP parameters and recalculate hydrophobic properties. To do that press
the “Change settings & restart” caption in the upper right corner. Or press the “Start a new task”
caption to start PLATINUM from the very beginning.
Figure 2.5. Interaction terms calculated by PLATINUM for ligand docking poses.
Reference ligand is marked with orange color.
Here is the explanation of the interaction terms:
a) H-bonds (likely to be a fractional number);
b) Lipophilic match surface = SLL [Å2] (see Fig. 2.3);
c) Hydrophilic match surface = SHH [Å2];
d) Sburied = SLL + SLH + SHL + SHH [Å2];
e) Stotal = SLL + SLH + SHL + SHH + SLH’ + SHH’ [Å2];
f) Fraction of lipophilic and hydrophilic match = (SLL + SHH)/Stotal;
g) Fraction of lipophilic match = 2×SLL/( 2×SLL + SLH + SLH' + SHL);
h) Stacking with aromatic rings (see Theory, Section 2.3);
i) Stacking with guanidinium groups;
Clicking on the name of each interaction term will sort the docking poses by its value.
Click on “Ligand name” to restore the initial view. You can sort the list according to one of the
listed terms. If any term is equal to zero for each ligand pose, it will not appear in the table.
18
Generally, Match1 and Match2 terms are recommended for scoring and are of similar
efficiency – the choice between them might depend on the user’s preference and intuition. Other
terms are given as the additional information which may be useful in some cases.
Scoring by hydrophobic complementarity SLL is recommended as default, however the user
is free to inspect other variants. This term has been optimized to use with “goldscore” scoring
function – for rescoring results of docking (Pyrkov et al., 2008), obtained with the program
GOLD (Jones et al., 1995). This number should be simply multiplied by the factor of 0.015 and
added to the corresponding goldscore value. However, this should only be done with the optimal
MHP parameters for rescoring results of GOLD:
dotdensity = Low;
MHPoffset = 0.03;
MHPshift-lig = 0.6;
MHPshift-rec = 0.3;
GOLD docking program was chosen as one of the most efficient and popular tool (Kitchen
et al., 2004). In future, we also plan to optimize scoring criteria for other popular docking
programs.
Note, that the numbers of h-bonds and stacking are fractional. This is because these types
of intermolecular contact are described by weighting functions based on geometrical criteria.
Therefore only perfect geometry receives whole number (equal to 1.0). For detailes on stacking
see Section 2.3. H-bond weighting function is described elswhere (Pyrkov et al., 2008).
19
2.5. Visualization of Hydrophobic/Hydrophilic Properties in Jmol
When the results of docking have been processed and hydrophobic complementarity
calculated, one may wish to select some of them for more thorough study – e.g. seek what part of
ligand may be responsible for non-optimal hydrophobic or hydrophilic contact, or analyze the
overall distribution of ligand hydrophobic properties. For that purpose PLATINUM provides
tools for visualization of hydrophobic/hydrophilic properties and their complementarity between
ligand and receptor molecules.
One such tool is visualization in Jmol applet (http://www.jmol.org) on the PLATINUM
web server. To use it simply click the molecule icon just next to the ligand pose you wish to
view.
This immediately opens a new window where you can see three Jmol views of the same
ligand pose in the receptor binding site. The ligand surface is colored respectively by its own
MHP (left panel), MHP induced by its environment (middle panel), and complementarity of
hydrophobic/hydrophilic properties between them (right panel).
Figure 2.6. Visualization in online Jmol applet. User can choose surface transparency and
MHP color scheme to display the ligand own (left panel) and its receptor (middle panel)
hydrophobic/hydrophilic properties. The right panel maps match (grey) and mismattch (orange)
of the properties of the ligand and its environment.
20
2.6. Saving Data to View MHP in a Molecular Visualization Application
Another way to view the distribution of molecular hydrophobic/hydrophilic properties is to
save precalculated MHP data as files on a local disk. These files may be then loaded into a
molecular visualization application for analysis, e.g. in PyMOL (DeLano, 2002;
http://www.pymol.org). Also doing so you can create a nice picture or illustration of molecular
hydrophobic properties and complementarity. Furthermore such data may be useful to perform
private calculations of hydrophobic interactions without PLATINUM.
To use this option simply click on the floppy-disk icon
just next to the ligand pose you
wish to view. A menu appears where you can choose the format of output data and readjust some
parameters of MHP calculation (Fig. 2.7).
You can save data in a number of different formats depending on which molecular
visualizing application you prefer to use and what possibilities it provides. This section gives a
brief overview of available formats. Detailed discription of output files is given in the Section
2.7 (Format of Output Files for Visualizing MHP).
Figure 2.7. Menu for visualization of molecular hydrophobic/hydrophilic properties.
Most of the MHP parameters are the same as for processing the results of docking (Section
2.2; Fig. 2.2). A new option here is the “Color scheme”. Different color schemes may be used
(Fig. 2.8; “Brown-Cyan” is the default). This parameter defines the colors corresponding to
hydrophobic and hydrophilic parts of molecules and may affect some output data.
Besides ligand MHP one can request calculation of MHP of its environment (receptor and
water). To do that mark the check-box “Calculate MHP distribution from the protein as well”.
Then additional file will be provided.
21
MHP constants. Save a table of atomic MHP constants. PLATINUM provides the
possibility to facilitate assignment of these constants which otherwise would consume much
effort and time to do it manually. Can be used for further private calculations.
Molecular file. Save results either to .mol2 or .pdb format. These files can be later loaded
into a molecular visualizing program e.g. PyMOL and colored according to MHP data written to
their occupancy and B-factor columns (both columns will contain the same numbers). In
addition, there is an option to save either tabulated atomic hydrophobicity constants or surface
MHP projected back onto atomic centers. The latter provides smoothed and more realistic view
of molecular MHP.
Molecular surface. Save data either in the format of InsightII (Molecular Simulations Inc.,
2000) surface or as a .pdb file as a set of “atoms”.
Grid. Save data in the format of either InsightII or MolMol (Koradi et al., 1996). In both
cases additional files (spectrum and scripts) will be provided to facilitate the procedure of
visualizing molecular properties.
Figure 2.8. Color schemes for MHP representation. Three different variants are proposed.
“Brown-Cyan” – brown (oil-colored) hydrophobic and cyan (water-colored) hydrophilic
properties. “Yellow-Green” – another common scheme. “Blue-Red” – blue (carbon/nitrogen
atom) hydrophobic and red (water oxygen atom) hydrophilic properties. Choise of the color
scheme may influence the format of output for InsightII (surface and grid) and MolMol (grid).
22
2.7. Format of Output Files for Visualizing MHP
Below, each option will be described with its parameters in detail. Results for each option
are written to files that should be saved on local disk. Filename conventions are the following.
Let us say that visualization was requested for ligand named ligfilename.mol2 (or
ligfilename.sdf, etc.). Then any file with the results of PLATINUM calculation will start with
this name ligfilename_ with the appropriate suffix and extension.
MHP constants
Assignment of hydrophobic constants to atoms of a molecule is based on sophisticated
molecular topology. For e.g. protein residues these can be easily tabulated, but when ligands are
processed, manual constants assignment becomes a problem that may be much effort- and timeconsuming. PLATINUM makes such assignment in an automatic way. These data may be used
to perform your own calculations of MHP in case there is no appropriate option in PLATINUM.
The output is a text file ligfilename_mhptab.txt. The format of a line in this file is:
Atom
number
ATOM ATOM ATOM ATOM 24 25 26 27 Atom
name
2HH2 N CA C Atom
Sybyl
type
H N.am C.3 C.2 Residue
number
1 2 2 2 Residue
name
ARG TRP TRP TRP mhp= mhp= mhp= mhp= Atom
MHP
type
50 72 8 36 Atom
MHP
constant
‐0.1036 ‐0.5113 ‐0.6805 ‐0.1320 charge= charge= charge= charge= CVFF
electrostatic
charge
0.3278 ‐0.5985 0.0100 0.1668 Molecular file.
This is perhaps the most universal format of output. Both .mol2 and .pdb file formats are
understood by most molecular modeling software and almost always can be used to color the
molecular surface by the value of electric charge (and B-factor for pdb). The parameters of MHP
calculation on surface are the same as for grids and surfaces. Additional option is the selection:
to write down tabulated atomic MHP constants or projection from molecular surface (calculated
inwardly by PLATINUM). The second variant provides smoothed and more realistic view of
molecular MHP and implies calculation of MHP on ligand surface (in the same way as if you
have chosen to save molecular surface in the previous point) and afterwards averaging and
projection back to ligand atoms.
If you use e.g. PyMOL, then type the following command to color the molecule by MHP:
a) cmd.spectrum(‘b’, ‘cyan_white_yellow’, selection=’all’)
or use ‘green_white_yellow’ or ‘red_white_blue’ color schemes instead;
b) for PyMOL versions 1 and higher a color_b.py script can be used:
color_b mode=hist, gradient=user, user_rgb=(0,0.5,1,1,1,1,0.5,0.25,0);
color_b mode=hist, gradient=user, user_rgb=(0,0,1,1,1,1,1,1,0);
color_b mode=hist, gradient=user, user_rgb=(1,0,0,1,1,1,0,0,1).
The output for tabulated atomic MHP constants is saved to files:
ligfilename_mhplig.pdb (or .mol2; file of ligand molecule)
ligfilename_mhprec.pdb (or .mol2; file of receptor(!) molecule – if the option was
requested)
The output for averaged surface MHP is saved to files:
ligfilename_mhplig.pdb (or .mol2; file of ligand molecule with self MHP)
ligfilename_mhprec.pdb (or .mol2; file of ligand molecule with receptor MHP – if the
option was requested)
23
Molecular surface.
These surfaces may be used to visualize molecular MHP in InsightII (special format;
surface dots) or in any other molecular visualizers (surface dots written as list of “atoms” in pdb
file format). The parameters of MHP calculation on surface are the same as for grids.
The output in .pdb file format is saved to files: ligfilename_mhplig.surf.pdb and
ligfilename_mhprec.surf.pdb (if this option was requested). MHP values at surface dots are
written to charge and B-factor columns.
The output for InsightII is saved to files ligfilename_mhplig.surf and
ligfilename_mhprec.surf (if this option was requested). Also file ligfilename_mhplig.pdb is
provided with ligand molecule which should be loaded in InsightII to read the surfaces. The
format of surface file implies that two first lines contain special information. Next lines are of the
following format:
x dot coordinate
y dot coordinate
z dot coordinate
color (R,G,B,255)
MHP value
Grid.
These grids may be used to visualize molecular MHP on any surface in InsightII and
MolMol (http://hugin.ethz.ch/wuthrich/software/molmol/) molecular visualizers. The parameters
of MHP calculation on grid are:
The output for InsightII is saved to files:
ligfilename_mhplig.gdf (formatted grid of ligand MHP)
ligfilename_mhprec.gdf (formatted grid of receptor MHP – if the option was requested)
ligfilename_mhplig.sh (csh script to call unformat_phi utility on Silicon Graphics)
platinum.spect (InsightII color spectrum for MHP)
The output for MolMol is saved to files:
ligfilename_mhplig.pot (formatted grid of ligand MHP)
ligfilename_mhprec.pot (formatted grid of receptor MHP – if the option was requested)
ligfilename_mhplig.mac (MolMol macros)
24
2.8. Processing WARNING and ERROR messages
When calculations finished there can appear WARNING or ERROR messages on the
Results page. WARNING means minor mistakes that can be treated by the program and proceed
calculating. ERROR means an unavoidable mistake, making further calculations senseless and
require user intervention. Below is given the list of WARNINGs and ERRORs:
WARNING: “CONECT” records will be ignored
“CONECT” records in .pdb files are not processed by PLATINUM; bonds in
.pdb and .gro files are defined solely based on distance between atoms; if one
wishes to work with complex or nonstandard compounds – it is better to use
.mol2 or .sdf file formats where bonds are given explicitly;
WARNING: bad file format; omitting string
.pdb and .gro files have fixed lengths for each field (atom name, coordinates,
etc.), if an atom string is too short it cannot be processed and is omitted;,
however this warning will likely lead to unavoidable problems in MHP type
assignment due to loss of atom(s) and finally to the program termination;
inspect the corresponding file manually;
ERROR: bad file format; program terminated
a string corresponding to an atom does not contain enough information about
this atom (some data missing); while in case of .pdb or .gro the atom is simply
omitted, PLATINUM is less forgiving in case of .mol2 and .sdf since these are
more complex molecular formats;
ERROR: bad file format; wrong atom numbering
in .mol2 and .sdf formats bonds are identified by the two numbers of
corresponding atoms, so atom numbering is quite important; if some troubles
with atom numbering were encountered, program will terminate; inspect the
corresponding file manually;
WARNING: atom type column not found; trying to detect atom types automatically
old .pdb file format does not contain the atom element symbol in column 78
(the new format does); this is only a minor mistake, since usually it is
straightforward to identify the element type from the atom name (for .gro
format it is the default procedure); however be aware of difficulties that arise if
atom name starts with characters other than its element type (number is ok):
1H will be identified as Hydrogen;
C8 will be identified as Carbon;
CL8 will be identified as Chlorine;
AC8 (e.g. adenine C8) will be identified as a weird element “A” and omitted;
25
WARNING: unidentified atom type found; trying to detect atom types automatically
if atom type is given other than a sensible element (e.g. Du dummy atoms, Lp
lone pairs, Any any atoms, Het heteroatoms, etc.) which are found in
abundance in .mol2 format, then PLATINUM will try to detect atom type
automatically as it is done for .gro or .pdb; note that if unsuccessful,
PLATINUM will omit this atom; lone pairs are omitted anyway;
WARNING: ignored atom
if the program encounters an atom for which element type cannot be identified
or a pseudo-atom (Lp, Du, etc.) it is omitted;
ERROR: file contains no atoms
file likely to be not of the corresponding molecular format, program will
terminate; inspect the corresponding file manually;
ERROR: cannot open input file
if you have received such message then there are some problems with our webserver, please tell us so that we could fix the problem;
WARNING: ligand file contains metal atom – will be omitted
only receptor structure can contain a metal ion; if metal ion is necessary for
analysis of molecular properties than it should be submitted as part of the
receptor molecular file;
WARNING(platinum): MHP TYPE ASSIGNMENT FAILED IGNORED
ERROR(platinum): MHP TYPE ASSIGNMENT FAILED
PLATINUM automatically identifies the valencies of atoms and bond orders
and based on these data assignes atomic MHP constants; if it fails to do so for
any atom its MHP constant will be set to zero; two ways are possible:
1) if that was a receptor atom, it is unlikely to affect the final result greatly and
may be neglected;
2) however, if MHP type assignment failed for quite a few receptor atoms (≥
10) or for a ligand atom, it is desirable to correct the problem and restart the
calculations;
depending on the number of atoms for which MHP type assignment failed
PLATINUM can choose to proceed or terminate; in the case 2) the user will
have to inspect and correct the mistakes manually before proceeding;
usually this happens when automatic adding of hydrogen atoms left some nonstandard atoms with unfilled valencies; remember that PLATINUM uses fullatom MHP parameterization by Viswanadhan et al., 1989 and Ghose et al.,
1998 and hydrogens are required!
26
3. Getting Help, Feedback and References
This web-service combines all our best results obtained in the efforts to improve the
performance of standard molecular docking packages. It is absolutely free to use for Academia;
commercial users must ask for a licence. We hope that PLATINUM will be useful in molecular
modeling of interactions of ligands with receptors. Please, use the following reference to cite the
software:
Timothy V. Pyrkov, Anton O. Chugunov, Nikolay A. Krylov, Dmitry E. Nolde, Roman G.
Efremov. PLATINUM: a web tool for analysis of hydrophobic/hydrophilic organization of
biomolecular complexes. Bioinformatics 25(9), pp. 1201-1202 (2009).
All questions about PLATINUM can be asked at the net forum or via e-mail to:
[email protected] (Tim Pyrkov, scientific concept & programming)
[email protected] (Anton Chugunov, web-design & programming)
[email protected] (Roman Efremov, head of the lab)
The authors will be grateful for any remarks on conceptual issues or suggestions on
technical improvements of the service.
27
4. Cited Literature
Audry E, Dubost JP, Colleter JC, Dallet P. A new approach to structure-activity relations: The molecular
lipophilicity potential. Eur J Med Chem 21, 71-72, 1986.
Berendsen HJC, van der Spoel D, van Drunen R. GROMACS. Comp. Phys. Comm. 91, 43-56, 1995.
DeLano WL. The PyMOL Molecular Graphics System DeLano Scientific, Palo Alto, CA, USA, 2002.
Deng Z, Chuaqui C, Singh J. Structural interaction fingerprint (SIFt): A novel method for analyzing threedimensional protein-ligand binding interactions. J Med Chem 47, 337-344, 2004.
Efremov RG, Chugunov AO, Pyrkov TV, Priestle JP, Arseniev AS, Jacoby E. Molecular lipophilicity in protein
modeling and drug design. Curr Med Chem 14, 392-415, 2007.
Fauchere JL, Quarendon P, Kaettere L. Estimating and representing hydrophobicity potential. J Mol Graph 6, 203206, 1988.
Gaillard P, Carrupt PA, Testa B, Boudon A. Molecular lipophilicity potential, a tool in 3D-QSAR. Method and
applications. J Comput Aided Mol Des 8, 83-96, 1994.
Ghose AK, Viswanadhan VN, Wendoloski JJ. Prediction of hydrophobic (lipophilic) properties of small organic
molecules using fragmental methods: An analysis of ALOGP and CLOGP methods. J Phys Chem A 102, 37623772, 1998.
Heiden W, Moeckel G, Brickmann J. A new approach to the display of local lipophilicity/hydrophilicity mapped on
molecular surfaces. J Comput Aided Mol Des 7, 503-514, 1993.
Jones G, Willett P, Glen RC. Molecular Recognition of Receptor Sites Using a Genetic Algorithm with a
Description of Desolvation. J Mol Biol 245, 43-53, 1995.
Kitchen DB, Decornez H, Furr JR, Bajorath J. Docking and scoring in virtual screening for drug discovery: Methods
and applications. Nat Rev Drug Discov 3, 935-949, 2004.
Koradi R, Billeter M, Wuthrich K. MOLMOL: a program for display and analysis of macromolecular structures. J.
Mol. Graph. 14, 51-55, 1996.
Meyer EA, Castellano RK, Diederich F. Interactions with aromatic rings in chemical and biological recognition.
Angew Chem Int Ed Engl 42, 1210-1250, 2003.
Moitessier N, Englebienne P, Lee D, Lawandi J, Corbeil CR. Towards the development of universal, fast and highly
accurate docking/scoring methods: A long way to go. Br J Pharmacol 153, S7-S26, 2008.
Molecular Simulations Inc.. InsightII User Guide. MSI, San Diego, CA 2000.
Pyrkov TV, Efremov RG. A fragment-based scoring function to re-rank ATP docking results. Int J Mol Sci 8, 10831094, 2007a.
Pyrkov TV, Kosinsky YA, Arseniev AS, Priestle JP, Jacoby E, Efremov RG. Complementarity of hydrophobic
properties in ATP-protein binding: A new criterion to rank docking solutions. PROTEINS 66, 288-298, 2007.
Pyrkov TV, Priestle JP, Jacoby E, Efremov RG. Ligand-specific scoring functions: Improved ranking of docking
solutions. SAR QSAR Environ Res 19, 91-99, 2008.
Schrodinger LLC, Maestro User Manual, 2007.
Testa B, Carrupt PA, Gaillard P, Billois F, Weber P. Lipophilicity in molecular modeling. Pharm Res 13, 335-343,
1996.
Viswanadhan VN, Ghose AK, Revankar GR, Robins RK. Atomic physicochemical parameters for three dimensional
structure directed quantitative structure-activity relationships. 4. Additional parameters for hydrophobic and
dispersive interactions and their application for an automated superposition of certain naturally occuring nucleoside
antibiotics J Chem Inf Comput Sci 29, 163-172, 1989.
28