1
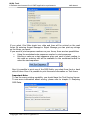
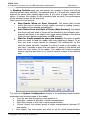
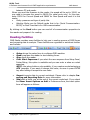
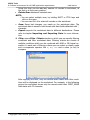
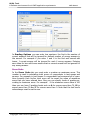
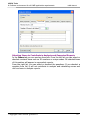
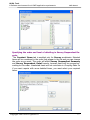
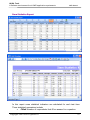
HODA Tools
A Software environment for all OMR application requirements
Copyright 2007-HODA System Co.
USER Manual
1
HODA Tools
A Software environment for all OMR application requirements
Copyright 2007-HODA System Co.
USER Manual
2
HODA Tools
A Software environment for all OMR application requirements
USER Manual
1 INTRODUCTION TO HODA TOOLS PACKAGE
3
HOW
3
IT WORKS?
2 READING OMR FORMS WITH AXIOME MACHINES
4
SPECIFY SYSTEM CONFIGURATION
READING FACILITIES
4
8
3 ANALYZING OMR DATA
12
SPECIFYING ANALYSIS OPTIONS
WORKSHEET TYPE
ITEMS PROPERTIES
TEST KEY AND GRADING OPTION
SCORE SCALE
SELECTING ITEMS TO CONTRIBUTE
PRINT REPORT OPTIONS
ANALYZING TEST DATA
ITEM STATISTICS REPORT
ITEM ANALYSIS REPORT
RESPONDENT ITEM ANALYSIS
RESPONDENT DETAIL REPORT
RESPONDENT SUMMERY REPORT
FREQUENCY DISTRIBUTION REPORT
ANALYZING SURVEY DATA
ITEM STATISTICS REPORT
ITEM ANALYSIS REPORT
SURVEY RESPONDENT DETAIL
SURVEY RESPONDENT SUMMERY
CROSS TABULATION REPORT
SOME NOTES ABOUT PRINTING REPORTS:
12
12
13
13
14
15
16
17
17
18
19
21
21
23
23
24
24
24
24
25
26
29
4 IMPORT AND EXPORT
32
IMPORT
EXPORT
EXAMPLE 1
EXAMPLE 2
EXAMPLE 3
APPENDIX
32
35
35
36
38
41
IN
ANALYSIS
Copyright 2007-HODA System Co.
GENERATED REPORTS
SURVEY RESPONDENT REPORTS
AND
PECIFYING THE ORDER AND LEVEL OF DETAILING IN
3
HODA Tools
A Software environment for all OMR application requirements
1
USER Manual
Introduction to HODA Tools Package
HODA Tools package consists of a set of software modules that satisfy all of your
needs when using OMR devices. Using HODA Tools package you can design and
print OMR forms to distribute between destination populations. Also you can define the layout of the OMR forms for axiome readers and finally read data from
filled forms and analyze the results. HODA Tools package includes:
• FormDesigner (HFD) a tool to design and print OMR forms
• TemplateEditor (HTE) a tool to define the layout of the OMR
forms
•
OMR Studio the main tool of the package to do all OMR jobs
such as reading the OMR forms, manipulating data, analyzing
data and generating reports.
This manual is about the OMR Studio module of the package. For other modules
please refer to the corresponding manuals.
How it works?
There are 4 main steps in HODA Tools, to process OMR forms. The first step is
designing and printing OMR forms. To do this step, you can use FormDesigner
module (HFD). After preparing the printed forms, you can distribute them between the destination populations to fill the forms. In the second step, you
gather the filled forms and prepare them to read with the OMR machine. In this
step using the TemplateEditor module (HTE) you can define the OMR items positions on the forms in a very simple fashion. In the third step, you can create a
blank worksheet using the OMR Studio module, setup the OMR machine and read
the forms. In the fourth step, you can analyze the result and generate different
reports to visualize the result. The following diagram shows the above scenario.
Design and
print OMR
forms, using
HODA ToolsFormDesigner
Prepare forms,
define the
layout of the
forms using
HODA ToolsTemplateEditor
Copyright 2007-HODA System Co.
Create a
worksheet
using HODA
Tools-OMR
Studio and
read forms
Analyze the
data and
generate
reports for
printing or
publishing
4
HODA Tools
A Software environment for all OMR application requirements
2
USER Manual
Reading OMR forms with axiome machines
Specify System Configuration
After creating a template for your OMR forms using HTE module, you are able to
create a worksheet file. Open OMR Studio module and press New button from
the main toolbar or Select File->New Worksheet from menu bar.
In the Create New Worksheet window you must specify worksheet name and
select the template file you have created before using HTE. Also you can optionally enter a sentence as a description for your worksheet.
In special marks group box, you can specify Blank Mark and Double Mark. Default
value for Blank Mark is '*' character and for Double Mark is '?' character. When
the reader encounters a data field with blank value or a data field with more than
one value it will replace them with Blank Mark and Double Mark respectively.
Press Ok to create a new worksheet. OMR Studio will create and open the new
Copyright 2007-HODA System Co.
5
HODA Tools
A Software environment for all OMR application requirements
USER Manual
worksheet.
Before you start the reading process with your OMR device you must set the
reader properties. Press Setup button from worksheet toolbar. The System
Configuration window will appear:
In System tab you can select the model of your OMR device, Threshold and
mark discrimination. Also you can enable and disable each of the heads and
select number of tracks for each head. Also you can select number of barcode
heads and presence of Printer in your device.
If the printer is available for your device, you can program it to print some useful information on read forms. To do this, press on the Setup button. The following form will appear:
Copyright 2007-HODA System Co.
6
HODA Tools
A Software environment for all OMR application requirements
USER Manual
]
If you select Print Date check box, date and time will be printed on the read
forms. By entering Accept Message or Reject Message, you can print any strings
on the forms, you want.
If you want to print sequence numbers on your forms, there are two possibilities:
•
Using the worksheet auto-sequence number to print sequences
•
Entering a value as a start sequence when you want to start reading, in
this case an entering edit will be available on the worksheet toolbar to
enter the start sequence:
Also it is possible to print one of the OMR fields, you select from front or back
side of forms. Even it is possible to print the score information on Test forms.
Important Note:
To use the score printing capability, you should have the Test Scoring license.
To see more information about scoring, please refer to chapter 3- Analyzing
OMR Data.
Copyright 2007-HODA System Co.
7
HODA Tools
A Software environment for all OMR application requirements
USER Manual
In Reading Defaults page you can specify the number of forms that will be
read before each save operation. For example enter 8 in the edit box, means that
data will be saved after reading eight forms. If you enter a larger value for this
option, it reduces the number of disk operations and as result, the performance
of the reading process will be improved.
Other options in this tab are:
•
Stop Reader When an Error Occurred: this means that if some
errors like error in number of clock marks, occurred in reading process,
the reader will be stopped automatically.
•
Auto Detect Front and Back of Forms (Auto-Reverse): this means
that front and back sides of forms will be detected by the software automatically and there is no need to sort them before feeding to the device
[refer to check bubble explanation on HTE manual].
•
Wait for N milli-seconds to start new batches: this option is useful
when you want to feed the reader with many batches of papers. To do
that, you enter a time interval for example 7000 milliseconds. In this
case the reader will wait 7 seconds if no form is ready on the feeder, so
you have 7 seconds to place the next batch of papers in the device and
press the start button of the reader. The reader will continue reading
without stopping and there is no need to launch it again from software
side.
The last tab of System Configuration window is for specifying communication
parameters and working mode of the reader.
Port: the port that the device is connected to it.
•
Data Bits: number of data bits in serial communication.
•
Stop Bits: number of stop bits in serial communication.
•
•
Current Speed: the current speed of serial communication between PC
and reader.
•
New Speed: The new speed you want to set for serial communication
Copyright 2007-HODA System Co.
8
HODA Tools
A Software environment for all OMR application requirements
USER Manual
between PC and reader.
When you send the firmware to the reader, the speed will be set in 19200, so
you need to increase the speed to 38400 (for serial ports only). In this case,
enter 19200 for Current Speed and 38400 for New Speed and send it to the
reader.
Parity: presence and type of parity bits.
•
Working Mode: can be Default mode that is for (Serial Communication•
RS232) or Real-Time that is for USB communication.
By clicking on the Send button you can send all of communication properties to
the reader and prepare it for reading.
Reading Facilities
OMR Studio provides some facilities to help you in reading process of OMR forms
and preparing data to analysis. These facilities are organized in worksheet toolbar
and include:
•
•
•
•
Setup: brings the setup form to configure OMR machine.
Read: programs the reader to start reading forms.
Stop: stops the reader.
Print Start Sequence: if you select the user sequence from Setup Form/
Printer/Setup, this option is available and you can enter a value as a start
sequence.
NOTE: the above buttons only available, if you create a worksheet using a
HTE template. If you want to change this value, be sure to press ENTER
key after editing to accept the new value.
•
Import: imports data to current worksheet. Please refer to chapter Im-
•
Add: adds a blank row at the end of the current worksheet. If you check
porting and Exporting Data for more information.
the Show Insert Options on Add in Preferences form, the insert option
form will appear as follows:
Copyright 2007-HODA System Co.
9
HODA Tools
A Software environment for all OMR application requirements
•
USER Manual
Using this form you can add any number of records to worksheet, at
the end or at the cursor position.
Delete Row: deletes all selected rows.
NOTE:
•
•
•
o You can select multiple rows, by holding SHIFT or CTRL keys and
click on the rows.
o You can use Ctrl+A to select all records on the worksheet
Save: Saves last changes, you made on the worksheet data. The
worksheet data is saved in text format with data fields delimited with ','
character.
Export: exports the worksheet data to different destinations. Please
refer to chapter Importing and Exporting Data for more information.
Filter: opens Filter Criteria window in which you can specify filtering
conditions and filter worksheet data. Filtering criteria are consist of
multiple conditions witch can be combined with AND or OR logical operators. In each part of filtering criteria you can select a column name
and a comparison operator like =, >=, <=…and a value (or list) to
compare.
After applying the filter, only the records witch match with filter conditions will be displayed on the worksheet. For example, in the following
picture the worksheet shows only the records witch their FIRST_NAME
field starts with 'B' character.
Copyright 2007-HODA System Co.
10
HODA Tools
A Software environment for all OMR application requirements
NOTE:
o
•
•
USER Manual
If you apply the filter on worksheet records, reports for Test and
Survey analysis will be generated only for filtered records. This is
a useful capability to do analysis operations only for some special
records.
To cancel the filter and show all records again, press the cancel button, witch is specified in the above picture.
Find: opens Find Data window in which you can specify a field name
and a search value. Also you can perform exact and partial matching
compare. After you press Find button the rows that match to your
searching conditions will be highlighted and you can navigate through
them with Next and Previous buttons. Also you can replace values of
selected columns of highlighted rows. To do this, enter new value on
the Replace With edit box and press Replace or ReplaceAll buttons.
Copyright 2007-HODA System Co.
11
HODA Tools
A Software environment for all OMR application requirements
•
•
USER Manual
Lock: Locks the worksheet and prevents user from modifying data.
Event Log: Shows/Hides the list of events that is logged during execution of the program. The content of this list is appended to a file with
the same name as the worksheet data file and with the extension .ERR
each time a worksheet is closed. This list contains information of all
events occurred during execution of the program such as errors occurred during reading OMR forms and runtime exceptions information.
The time and date of each event is also presented. It is recommended
to show event log while you read OMR forms.
NOTE:
If you want to sort the worksheet data based on one of the columns, just click on
the column title. In this case the worksheet data will be sorted in ascending order.
If you click on the sorted column title again, the worksheet data will be sorted in
descending order. To remove the sort from the sorted column, hold the CTRL key
and press on that column title. The following picture shows a worksheet witch is
sorted based on the LAST_NAME column.
Copyright 2007-HODA System Co.
12
HODA Tools
A Software environment for all OMR application requirements
3
USER Manual
Analyzing OMR data
Specifying Analysis Options
Before starting data Analysis you must specify Analysis options. If your data is
ready to analyze, press Analysis Options button in main toolbar or select
Analysis Options from the Configuration menu. The Analysis Options will
appear and you can specify different analysis options.
Worksheet type
Worksheet Type can be Test or Survey. Test worksheet type is useful
for test questionnaires. In these questionnaires each question may have
several choices and each choice can be Right or Wrong. The score of a
respondent is usually calculated by summation of the number of questions
that is answered correctly.
Survey worksheet type is useful for survey questionnaires that are used to
evaluate some topics in an environment such as evaluation of teachers in
a university by students or doctors and services in a hospital by patients
Copyright 2007-HODA System Co.
13
HODA Tools
A Software environment for all OMR application requirements
USER Manual
and so on.
There are several tabs in Analysis Options form, in this section you can find
more information about them.
Items properties
In Items Properties tab you can specify a caption for each question.
This is useful for survey questionnaires that each question has a special
meaning and you want to see its caption in the worksheet. To do this,
simply type the caption you prefer in front of the question in column caption and then check the Use Captions checkbox. Also you can give to
each question a value that will be used in calculation of scores. If all questions have the same values give the value 1 to all of them and if some
questions have more values give value 2 or more.
Also each Response can have a value and a caption for presenting in reports you will generate. This is useful for survey questionnaires that some
answers can be more valuable from others. If you don't specify any caption for answers default captions will appear in reports. Click
button
at the bottom of Items Properties tab. the Response Sets window will
appear and you can specify Responses properties (captions and values).
Test Key and Grading Option
Test Key tab is enabled only for test worksheets. In test exams you must specify test key which is used in test scoring and calculating respondent scores. You
can enter correct answers in the Test Key tab manually or select the choice
Use Line N as Key. This means that the N''th row of worksheet contains correct answers for all questions. To set a line as a test key, enter the line number
and press Get Key button; In this case the color of the selected line will be
changed to green.
Copyright 2007-HODA System Co.
14
HODA Tools
A Software environment for all OMR application requirements
USER Manual
In Grading Options you can enter tow numbers: the first is the number of
correct answers that will be ignored for defined number of wrong answers in
the second. For example if you enter 1 and 4 in the first and second edit
boxes, 1 correct answer will be ignored for each 4 wrong answers. Entering
zero value for two edit boxes means that no correct answer will be ignored for
any wrong answer.
Score Scale
In the Score Scale tab you must enter a number as maximum score. This
number is used to calculating total scores of respondents in test exams and
surveys. For example in test exams if a respondent had answered all of questions correctly then his/her total score will be equal the value of maximum
score that you have entered here. Also you can specify levels of grading according to maximum score. For example if the maximum score value is 100
then you can have 3 grading levels such as A for scores more than 70, B for
scores more than 50 and C for scores more than 0. Note that the last level's
value always must be set to zero.
Copyright 2007-HODA System Co.
15
HODA Tools
A Software environment for all OMR application requirements
USER Manual
Selecting Items to Contribute in Analysis and Generated Reports
In the Items tab you can see two item lists. From the left list you can select or
deselect constant items such as ID numbers or unique codes. All selected items
of this section will appear in respondent reports.
From the right list, you can select or deselect the questions. If you deselect a
question from list, it will not contribute in analysis and calculating scores and
not be shown in analysis reports.
Copyright 2007-HODA System Co.
16
HODA Tools
A Software environment for all OMR application requirements
USER Manual
Specifying the order and level of detailing in Survey Respondent Reports
The Constant Items tab is enabled only for Survey worksheets. Selected
items will be considered in the order that appear in the list and you can change
the order as you want. This order will affect Survey Respondent Summery
and Survey Respondent Detail reports, because items will be grouped according to this order. Unselected items will not contribute in Grouping Data. So
if you want reports with more detailed items, you must select your required
items.
Copyright 2007-HODA System Co.
17
HODA Tools
A Software environment for all OMR application requirements
USER Manual
Print Report Options
The last tab of Options window is Reports Options in which you can customize printing properties of your reports. For each report you can specify a
title that will appear at top of the report. Also you can choose to print date and
time, page number, worksheet name, printing color and printing font. In Survey Respondent Reports you can choose Tabular View or Card View.
Tabular View is normal view but if you choose Card View each group of
report is printed in a separated page.
Analyzing Test Data
There are six different types of reports that can be generated from test questionnaires. Item Statistics and Item Analysis Reports analyze question
typed items (test items). Respondent Reports calculate some values such as
scores, grades and ranks for each respondent contributed in the exam. In this
section a brief description of each report is presented.
Note: Each report will be showed in a tabular fashion and you can export it to
other file formats like text, excel or word documents (please refer to chapter 6
for more information on export). Also you can preview and print the reports
directly by click on Print button. In the preview form you can print the report
on printer, or save it to another file formats for publishing purposes. You can
save your report in PDF, RTF (Microsoft Word), Excel, Html, Text, Jpeg or
Bitmap formats.
Copyright 2007-HODA System Co.
18
HODA Tools
A Software environment for all OMR application requirements
USER Manual
Item Statistics Report
In this report some statistical indicators are calculated for each test item.
These statistical parameters include:
Filled: Number of respondents that fill an answer for a question.
•
Copyright 2007-HODA System Co.
19
HODA Tools
A Software environment for all OMR application requirements
•
•
•
•
•
•
•
•
•
•
USER Manual
Missed: Number of respondents that don't fill any answer for a
question.
Average: Average of answers filled for a question by all respondents.
Variance: Variance of answers filled for a question by all respondents.
Standard Deviation: Is the square root of variance.
Maximum: Maximum Value of answers respondents have chosen for
a question.
Minimum: Minimum Value of answers respondents have chosen for
a question.
Mean: Mean or median of answers respondents have chosen for a
question.
Range: Difference of maximum and minimum.
Sum of Values: Summation of values of all answers respondents
have chosen for a question.
Sum of Square Roots: Summation of square root of all answers
respondents have chosen for a question.
Item Analysis Report
In this report, total number of each possible choice for a question will be
counted and total count of correct and wrong answers will be calculated. Using
this report, you can assign a difficulty degree for each of questions. Also you
can print this report in chart view. There are four chart type include: Bar, Pie,
Line and Area.
Copyright 2007-HODA System Co.
20
HODA Tools
A Software environment for all OMR application requirements
Copyright 2007-HODA System Co.
USER Manual
21
HODA Tools
A Software environment for all OMR application requirements
USER Manual
Respondent Item Analysis
This report prints a graphical representation of the worksheet comparing the
values that respondents have chosen, with the test key and shows
each correct answer,
answer.
for each wrong answer and
for
for each blank
Respondent Detail Report
Copyright 2007-HODA System Co.
22
HODA Tools
A Software environment for all OMR application requirements
USER Manual
This report calculates number of correct, wrong, blank and double answers for
all respondents in each test field separately. Also total score, grade and rank of
the respondent is calculated for each test field. This report is also available in
Card View format. In card view print, separated workbooks will print for each
respondent.
Copyright 2007-HODA System Co.
23
HODA Tools
A Software environment for all OMR application requirements
USER Manual
Respondent Summery Report
This report calculates number of correct, wrong, blank, double answer for all
respondents totally in all questions of the questionnaire. Also total score, grade
and rank of the respondent is calculated totally in all questions.
Frequency Distribution Report
This report shows the frequency of each grade level in a test exam. For example if you have defined 3 grade levels A, B, C the number of respondents that
get each of these levels are counted.
Copyright 2007-HODA System Co.
24
HODA Tools
A Software environment for all OMR application requirements
USER Manual
Analyzing Survey Data
Item Statistics Report
This Report is same as Test Item Statistics Report.
Item Analysis Report
This Report is same as Test Item Analysis Report.
Survey Respondent Detail
We describe this report by an example. This example shows a survey that its
goal is evaluation of teachers in a university. In this example there is a field
named TeacherID that maintains teacher ID numbers and 10 questions named
Q_1 to Q_10. In this worksheet we connect the TeacherID field to T_Name
and T_Family fields from an existing database. In this case the 2 new fields
T_Name and T_Family, witch are filled by OMR Studio, automatically. You can
see a sample worksheet data in the following picture:
In the TeacherID column you can see 2 different ID numbers: 101 and 102,
each for a different teacher. In Survey Respondent Report for each teacher's
ID number OMR Studio counts each possible answer can be selected for each
question separately. For example as you can see in the next picture for
teacher ID number 101, three students have selected 'Agree++' choice for the
Q_1 question. Also total score, average, variance, standard deviation, grade
Copyright 2007-HODA System Co.
25
HODA Tools
A Software environment for all OMR application requirements
USER Manual
and rank for each question is computed.
Survey Respondent Summery
This report is similar to previous report, but in this report OMR Studio calculates all report items such as count of possible choices and average for each
teacher ID number totally and without respecting to separate questions. For
above example Survey Respondent Summery Report is shown below:
A chart view for Respondent Summery Report can be generated. Press on dif-
Copyright 2007-HODA System Co.
26
HODA Tools
A Software environment for all OMR application requirements
USER Manual
ferent chart buttons and select two fields in Respondent Summery Chart
window appeared.
Then press Draw Chart button. A chart will appear that shows the values of selected fields in a diagram.
Cross tabulation Report
To generate this report you must select binary groups of items by selecting
them from the left list and add them to the right one. After selection the desired pair of questions, press the Create Report button. You can add and
remove items to your list easily, using arrow buttons:
Copyright 2007-HODA System Co.
27
HODA Tools
A Software environment for all OMR application requirements
USER Manual
The following picture shows a sample crosstabulation report. In this example
the caption for 2 questions is entered as How he/she Teaches? and Does he/
she comes on time?. Also for more comprehension, the caption of responses
changed to Disagree, Agree, Agree+ and Agree++. Theses changes are made
using Analysis Options form.
After generating reports, you can print them by pressing Print button and then
print icon in preview window. For example the following picture shows the
preview of the last cross tabulation report:
Copyright 2007-HODA System Co.
28
HODA Tools
A Software environment for all OMR application requirements
Copyright 2007-HODA System Co.
USER Manual
29
HODA Tools
A Software environment for all OMR application requirements
USER Manual
Some notes about printing reports:
•
If you want to print report records sorted based on one of the fields,
before run the report sort the data grid based on your desired column. For example in the following picture the worksheet is sorted
based on the LAST_NAME column; in this case if you print the Respondent Item Analysis report, records will print on the LAST_NAME
order.
Copyright 2007-HODA System Co.
30
HODA Tools
A Software environment for all OMR application requirements
•
•
USER Manual
If the space for some columns is not enough to contain the data, you
can increase the column widths in data grid, before you run the report. In this case the OMR Studio uses from the grid column width to
print the report. For example in the following picture, the width of the
FIRST_NAME column in Respondent Detail Report is increased and in
result the space for this column is increased in printed report.
You can customize the appearance of each report using Report Op-
tions page in Analysis Options form:
Copyright 2007-HODA System Co.
31
HODA Tools
A Software environment for all OMR application requirements
USER Manual
For example in this picture the Item Statistics report printed based on the
customized title, color schema and font.
Copyright 2007-HODA System Co.
32
HODA Tools
A Software environment for all OMR application requirements
4
USER Manual
Import and Export
When you create or open a worksheet, you can import data to it, from other
worksheets or text files. Also it is possible to export worksheet data to other
file formats for archive, print, publish or more processing purposes. In this
chapter a detail description of import and export processes will be discussed.
Import
When a worksheet is opened, click on the Import btton in worksheet toolbar.
The Import wizard will apear. In the first step you must specify the file type,
you want to import. There are two possibilities:
•
Text file: you can import data from two type of text files include:
-CSV files witch fields are separated with a separator like comma, tab and
so on.
-Flat text files witch there is no any spaces between fields, but all fields
have fixed length.
•
HODA Worksheet Data file
Copyright 2007-HODA System Co.
33
HODA Tools
A Software environment for all OMR application requirements
USER Manual
In the next step you must select the file you want to import.
In the next step you should specify the delimiter properties of the file.
For HODA Worksheet file and for CSV files you must select the Delimited option and for flat text files you must select the Fixed Width option. If you select Delimited type, you should select a separator for
field separation.
NOTE: for HODA Worksheet files, always select the Comma as separator.
Copyright 2007-HODA System Co.
34
HODA Tools
A Software environment for all OMR application requirements
USER Manual
If you select the Fixed Width as text file type, you must specify the field positions
by inserting break lines. Just click on the positions you want to separate, to inserting the break lines.
In the final step, the Import Wizard extracts data fields from the file and shows
them. If the field separation is correct, you must specify the two extra options:
•
Append Mode, if you select Append to Existing Data, the extracted data
fields will add at the end of the worksheet. And if you select Overwrite
Existing Data, the old records will remove from the worksheet and only
new records will add to the worksheet.
•
Lookup database to fill missed field values, if there are some lookup
fields in your worksheet template (HTE or Manual) and the imported data
does not contains these extra fields, you can check this option to fill these
missed fields automatically by OMR Studio.
Copyright 2007-HODA System Co.
35
HODA Tools
A Software environment for all OMR application requirements
USER Manual
At the end press on Execute button o start importing process.
Export
It is possible to send worksheet data (also report data) to other file formats like
Excel or database tables for more processing. To export worksheet data, press on
the Export button on the worksheet toolbar and to export report data, generate
the report and press on the Export button in generated report toolbar.
Here there are some sample export scenarios to introduce you the capablities of the
export module.
Example 1: Send worksheet data to Excel
Press on the Export button on the workshhet toolbar. The Export Module will apear.
Select the MS Excel as the export destination. Check the Include columns title and
Open Destination After Export. The wizard will asky you to enter a name for the
generated file. Enter the file name and Press on the Do Export buuton. The export
will start and at the end of process, will open the generated excel file in MS Excel.
Copyright 2007-HODA System Co.
36
HODA Tools
A Software environment for all OMR application requirements
USER Manual
Example 2: Link the FIRST_NAME and LAST_NAME fields together and
export to text file
Open the Export Module. Select CSV Text File as destination.
Copyright 2007-HODA System Co.
37
HODA Tools
A Software environment for all OMR application requirements
USER Manual
Click on the Define Custom Structure button. The Define Export Structure will
appear. Click on the Assign Default Structure button.
Click on the LAST_NAME row and then press on the Delete button. Select the
FIRST_NAME row and Source column. Press on the … button. The Link Definition
form will apear. Select FIRST_NAME from Source Fields and press on Add Field
button. Enter a SPACE as separator in Field Separator and press on Add Separator button. Select the LAST_NAME field and click on Add Field button.
Copyright 2007-HODA System Co.
38
HODA Tools
A Software environment for all OMR application requirements
USER Manual
Click on Ok button to close Link Definition form. Click on Add Structure button.
Click on Ok button. Click on the Do Export button. The export process will start
and at the end, will show the result.
Example 3: Send the Item Statistics report to a Paradox table
Paradox is a standard and poular flat database system. In this example we want to
send the Item Statistics report data to a paradox table. To do this, follow these
steps:
1-Generate the Item Statistics report.
2-Click on the Export button on the generated report form.
3-Select Database Table as destination and click on the … button to select the
databse type and table.
4-Create on Create New Database radio button. Select STANDARD as database
type and enter SampleTest for database name. For the database parameters enter
the path you want to create the databse file; for eample enter 'c:\database'.
Copyright 2007-HODA System Co.
39
HODA Tools
A Software environment for all OMR application requirements
USER Manual
5-Click on the Apply button. Now the database is created and ready to define tables.
6-Click on the New Table button. The New Table Definition form will appear. Enter
the ItemStat for the table name. Click on the Create Template Table button to
create the table. If you want you can change the default table fields. For example
in this scenario, the type for Average, Variance and St_Deviation are changed to
float with 2 decimal precision.
Copyright 2007-HODA System Co.
40
HODA Tools
A Software environment for all OMR application requirements
USER Manual
7-click on the Ok button.
8-Click on the Define Custom Structure button.
9-Click on the Assign Default Structure button. Check that all destination fields
are connected to the source fields.
10-Click on the Add Structure button.
10-Click on the Ok button.
11-Click on the Do Export button.
21-The database table will be generated and displayed.
Copyright 2007-HODA System Co.
41
HODA Tools
A Software environment for all OMR application requirements
USER Manual
Application Shortcuts
Shortcut
Description
Ctrl+N
Create a blank worksheet using a template(HTE file) or define
Ctrl+O
Open an existing worksheet
Ctrl+Insert
Add a blank row at the end of current worksheet
F3
Start the reading process
F5
Stop the reading process
F9
Import data from a text file or an existing worksheet to the current worksheet
Ctrl+Delete
Delete the selected row from current worksheet
Ctrl+L
Lock the worksheet cells and prevent to modify data
Ctrl+F
Find and replace in worksheet cells
Ctrl+S
Save the last changes made on the worksheet
F10
Filter data
F11
Deactivate the filter
F12
Export the worksheet data to other formats
Copyright 2007-HODA System Co.
42
HODA Tools
A Software environment for all OMR application requirements
Copyright 2007-HODA System Co.
USER Manual
43
HODA Tools
A Software environment for all OMR application requirements
Copyright 2007-HODA System Co.
USER Manual
44