1
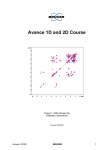
INSTRUCTIONS
JNM-ECA Series
JNM-ECX Series
JNM-ECS Series
(Delta V4.3.6)
TUTORIAL MANUAL
For the proper use of the instrument, be sure to
read this instruction manual. Even after you
read it, please keep the manual on hand so that
you can consult it whenever necessary.
INMECA/ECX-TU-3a
AUG2007-08110235
Printed in Japan
JNM-ECA Series
JNM-ECX Series
JNM-ECS Series
(Delta V4.3.6)
TUTORIAL MANUAL
JNM-ECA Series
JNM-ECX Series
JNM-ECS Series
This manual is designed for new users of the JNM-ECA, JNM-ECX or JNM-ECS
Series FT NMR system who want to perform 1D or 2D NMR measurement. It
explains the basic procedures for operating the system. For details of individual
operations, refer to the on-line “User's Manual".
Please be sure to read this instruction manual carefully,
and fully understand its contents prior to the operation
or maintenance for the proper use of the instrument.
NOTICE
• This instrument generates, uses, and can radiate the energy of radio frequency and, if not installed and used in
accordance with the instruction manual, may cause harmful interference to the environment, especially radio
communications.
• The following actions must be avoided without prior written permission from JEOL Ltd. or its subsidiary company
responsible for the subject (hereinafter referred to as "JEOL"): modifying the instrument; attaching products other than
those supplied by JEOL; repairing the instrument, components and parts that have failed, such as replacing pipes in the
cooling water system, without consulting your JEOL service office; and adjusting the specified parts that only field
service technicians employed or authorized by JEOL are allowed to adjust, such as bolts or regulators which need to be
tightened with appropriate torque. Doing any of the above might result in instrument failure and/or a serious accident. If
any such modification, attachment, replacement or adjustment is made, all the stipulated warranties and preventative
maintenances and/or services contracted by JEOL or its affiliated company or authorized representative will be void.
• Replacement parts for maintenance of the instrument functionality and performance are retained and available for seven
years from the date of installation. Thereafter, some of those parts may be available for a certain period of time, and in
this case, an extra service charge may be applied for servicing with those parts. Please contact your JEOL service office
for details before the period of retention has passed.
• In order to ensure safety in the use of this instrument, the customer is advised to attend to daily maintenance and
inspection. In addition, JEOL strongly recommends that the customer have the instrument thoroughly checked up by
field service technicians employed or authorized by JEOL, on the occasion of replacement of expendable parts, or at the
proper time and interval for preventative maintenance of the instrument. Please note that JEOL will not be held
responsible for any instrument failure and/or serious accident occurred with the instrument inappropriately controlled or
managed for the maintenance.
• After installation or delivery of the instrument, if the instrument is required for the relocation whether it is within the
facility, transportation, resale whether it is involved with the relocation, or disposition, please be sure to contact your
JEOL service office. If the instrument is disassembled, moved or transported without the supervision of the personnel
authorized by JEOL, JEOL will not be held responsible for any loss, damage, accident or problem with the instrument.
Operating the improperly installed instrument might cause accidents such as water leakage, fire, and electric shock.
• The information described in this manual, and the specifications and contents of the software described in this manual
are subject to change without prior notice due to the ongoing improvements made in the instrument.
• Every effort has been made to ensure that the contents of this instruction manual provide all necessary information on
the basic operation of the instrument and are correct. However, if you find any missing information or errors on the
information described in this manual, please advise it to your JEOL service office.
• In no event shall JEOL be liable for any direct, indirect, special, incidental or consequential damages, or any other
damages of any kind, including but not limited to loss of use, loss of profits, or loss of data arising out of or in any way
connected with the use of the information contained in this manual or the software described in this manual. Some
countries do not allow the exclusion or limitation of incidental or consequential damages, so the above may not apply to you.
• This manual and the software described in this manual are copyrighted, all rights reserved by JEOL and/or third-party
licensors. Except as stated herein, none of the materials may be copied, reproduced, distributed, republished, displayed,
posted or transmitted in any form or by any means, including, but not limited to, electronic, mechanical, photocopying,
recording, or otherwise, without the prior written permission of JEOL or the respective copyright owner.
• When this manual or the software described in this manual is furnished under a license agreement, it may only be used
or copied in accordance with the terms of such license agreement.
© Copyright 2002, 2003, 2004,2007 JEOL Ltd.
• In some cases, this instrument, the software, and the instruction manual are controlled under the “Foreign Exchange and
Foreign Trade Control Law” of Japan in compliance with international security export control. If you intend to export
any of these items, please consult JEOL. Procedures are required to obtain the export license from Japan’s government.
TRADEMARK
• Windows is a trademark of Microsoft Corporation.
• All other company and product names are trademarks or registered trademarks of their respective companies.
MANUFACTURER
JEOL Ltd.
1-2, Musashino 3-chome, Akishima, Tokyo 196-8558 Japan
Telephone: 81-42-543-1111 Facsimile: 81-42-546-3353 URL: http://www.jeol.co.jp
Note: For servicing and inquiries, please contact your JEOL service office.
NOTATIONAL CONVENTIONS AND GLOSSARY
■ General notations
— CAUTION — :
?:
F:
Points where great care and attention is required when operating the
device to avoid damage to the device itself.
Additional points to be remembered regarding the operation.
A reference to another section, chapter or manual.
1, 2, 3 :
Numbers indicate a series of operations that achieve a task.
◆:
A diamond indicates a single operation that achieve a task.
File:
The names of menus, commands, or parameters displayed on the
screen are denoted with bold letters.
File–Exit :
A command to be executed from a pulldown menu is denoted by
linking the menu name and the command name with a dash (–).
For example, File–Exit means to execute the Exit command by selecting it from the File menu.
Ctrl
:
Keys on the keyboard are denoted by enclosing their names in a
box.
■ Mouse operation
NMECA/ECX-TU-3
Mouse pointer:
An arrow-shaped mark displayed on the screen, which moves with
the movement of the mouse. It is used to specify a menu item,
command, parameter value, and other items. Its shape changes according to the situation.
Click:
To press and release the left mouse button.
Double-click:
To press and release the left mouse button twice quickly.
Drag:
To hold down the left mouse button while moving the mouse.
To drag an item, you point to an item on the screen and then drag it
using the mouse.
CONTENTS
1.
PREPARATION FOR MEASUREMENT
1.1
1.2
STARTING AND EXITING THE DELTA PROGRAM........................1-1
CONNECTING TO AND DISCONNECTING FROM
A SPECTROMETER .............................................................................1-3
1.3 SAMPLE PREPARATION.....................................................................1-5
1.3.1 Check Prior to Sample Insertion .....................................................1-5
1.3.2 Sample Loading, NMR Lock, and Automatic Resolution
Adjustment ......................................................................................1-8
2.
ONE-BUTTON MEASUREMENT
2.1
2.2
2.3
2.4
3.
GENERAL .............................................................................................2-1
STARTING AND ENDING MEASUREMENT....................................2-3
CANCELING MEASUREMENT..........................................................2-6
PRECAUTIONS.....................................................................................2-7
1D NMR MEASUREMENT
3.1 SETTING 1D NMR MEASUREMENT CONDITIONS.......................3-1
3.1.1 Setting 1H Measurement Conditions ...............................................3-1
3.1.2 Setting 13C Measurement Conditions ..............................................3-4
3.2 STARTING AND ENDING MEASUREMENT....................................3-6
3.3 1D NMR DATA PROCESSING ............................................................3-7
3.3.1 Automatic Baseline Correction .......................................................3-8
3.3.2 Automatic Peak Detection and Automatic Integration ....................3-9
3.3.3 Plotting ............................................................................................3-9
3.3.4 Changing the Display Range.........................................................3-10
4.
2D NMR MEASUREMENT
4.1 SETTING 2D NMR MEASUREMENT CONDITIONS.......................4-1
4.1.1 HH COSY Measurement.................................................................4-1
4.1.2 HETCOR Measurement ..................................................................4-4
4.1.3 Setting the Measurement Range from 1D NMR Data.....................4-6
4.2 STARTING AND ENDING MEASUREMENT..................................4-10
4.3 DATA PROCESSING OF 2D NMR ....................................................4-11
4.3.1 Displaying Data Using 2D Viewer................................................4-12
4.3.2 Setting the Conditions for Displaying Contour Lines ...................4-13
4.3.3 Pasting 1D NMR Data...................................................................4-15
4.3.4 Plotting ..........................................................................................4-16
4.3.5 Changing the Display Ranges .......................................................4-17
5.
QUEUING
5.1
5.2
NMECA/ECX-TU-3
COMMAND FOR STARTING MEASUREMENT...............................5-1
QUEUING..............................................................................................5-2
C-1
CONTENTS
6.
SAVING AND LOADING DATA
6.1 SAVING NMR DATA ............................................................................6-1
6.1.1 Saving the measured data (FID) ......................................................6-1
6.1.2 Saving Processed Data.....................................................................6-3
6.2 LOADING DATA ...................................................................................6-6
INDEX
C-2
NMECA/ECX-TU-3
PREPARATION FOR
MEASUREMENT
Chapter 1 explains the startup and shutdown of the Delta program, sample setup, sample
loading, NMR lock, automatic resolution adjustment, and other operations to be carried
out prior to measurement.
1.1
1.2
1.3
STARTING AND EXITING THE DELTA PROGRAM.................................... 1-1
CONNECTING TO AND DISCONNECTING FROM A SPECTROMETER. 1-3
SAMPLE PREPARATION ................................................................................. 1-5
1.3.1 Check Prior to Sample Insertion................................................................. 1-5
1.3.2 Sample Loading, NMR Lock, and Automatic Resolution Adjustment ...... 1-8
NMECA/ECX-TU-3
1 PREPARATION FOR MEASUREMENT
1.1
STARTING AND EXITING THE DELTA PROGRAM
This section assumes that the data system has started normally, and that the login
operation is complete.
F For
starting the data system and login, refer to the separate manual on the
workstation.
■ Starting the Delta program
u Double-click on the
Delta icon on the screen.
The Delta program starts, and the Delta Console window opens.
Fig. 1.1 Delta Console window
NMECA/ECX-TU-3
1-1
1 PREPARATION FOR MEASUREMENT
■ Ending the Delta program
After measurement or NMR data processing is complete, terminate the Delta program as
follows.
1. Select File—Quit in the Delta Console window.
First, point to File in the menu bar in the Delta Console window, and press and
hold the left mouse button. A pull-down menu appears. Then, while holding down
the left mouse button, move the mouse to highlight Quit in the pull-down menu,
and release the left mouse button there.
Verify Quit.
The Confirm window opens.
Fig. 1.2 Confirm window
2. Click on the OK button.
The Delta program ends.
1-2
NMECA/ECX-TU-3
1 PREPARATION FOR MEASUREMENT
1.2
CONNECTING TO AND DISCONNECTING FROM A
SPECTROMETER
The Delta program can be connected with two or more spectrometers through the
network in the JNM-ECA/ECX series FT NMR instrument. For this reason, before
NMR measurement, it is required to connect the Delta program with the spectrometer
you will use. After NMR measurement, disconnect the NMR spectrometer from the
Delta program. Here, we will explain how to connect and disconnect the Delta program
and the NMR spectrometer.
■ Connecting to the spectrometer
1. Click on the
button in the Delta Console window.
The Spectrometer Control window opens, and a list of the currently available
Fig. 1.3).
spectrometers appear in the list box (
F
The spectrometers which are marked as FREE are available for connection. The
spectrometers which are marked as OWNED are currently being used.
②
①
? The numbers ① and ② are referred to in the following steps.
Fig. 1.3
NMECA/ECX-TU-3
Spectrometer Control window
1-3
1 PREPARATION FOR MEASUREMENT
2. Using the mouse, select the spectrometer you want to connect to by clicking
on its name in the list in the Spectrometer Control window (
1.3).
F ① in Fig.
3. Click on the Connect button (F② in Fig. 1.3).
If the connection is carried out correctly, the message "Connect: …" is displayed
in the Spectrometer Control window, as shown in Fig. 1.4.
Fig. 1.4
Spectrometer Control window after the spectrometer is connected
■ Disconnecting from the spectrometer
u Click on the Unlink button in the Spectrometer Control window.
Fig. 1.5
Spectrometer Control window: Spectrometer is connected
When the spectrometer is disconnected, the Spectrometer Control window returns
to the display shown in Fig. 1.3.
1-4
NMECA/ECX-TU-3
1 PREPARATION FOR MEASUREMENT
1.3
SAMPLE PREPARATION
This section explains how to insert the sample into the SCM.
1.3.1
Check Prior to Sample Insertion
Check to make sure that no other sample is inserted in the SCM as follows.
1. Connect to the spectrometer according to the procedure of Section 1.2.
2. Click on the Sample button in the Spectrometer Control window.
The Sample window opens.
Fig. 1.6 Sample window
3. Verify that the Sample State section in the Sample window indicates that no
sample is loaded.
NMECA/ECX-TU-3
1-5
1 PREPARATION FOR MEASUREMENT
Green bar
Green bar
No sample is loaded.
A sample is loaded.
Fig. 1.7
Sample State
If the display shows that no sample is loaded, proceed to ■ Setting up the sample.
If the display shows that a sample is loaded, remove the sample according to the
procedure ■ Ejecting the sample.
■ Ejecting the sample
l When an auto sample changer is not installed.
If a sample is inserted in the SCM, remove it.
1. Click on the Sample button in the Spectrometer Control window to open
the Sample window.
2. Click on the
button.
The sample in the SCM is ejected. Verify that the Sample State section indicates
that the sample has been ejected.
3. Remove the sample from the insertion port on the SCM.
l When an auto sample changer is installed.
Another sample has been inserted into SCM, take out the sample according to the
following procedure :
1. Open the Sample window.
2. Set the Slot number to 0.
The sample can be ejected from the SCM, and is moved to the neutral position of
the auto sample changer. At the same time, verify that the Sample State indicator
changes to the ejected state.
3. Take the sample out of the slot of the auto sample changer.
1-6
NMECA/ECX-TU-3
1 PREPARATION FOR MEASUREMENT
■ Setting up the sample
WARNING
Be sure to wear protective gloves when handling a sample tube
containing a poisonous sample. If the sample tube breaks, this allows
you to avoid contact with any sample that leaks.
1. Set the sample tube (with the sample in it) in the holder.
Since the resolution varies according to the sample volume (height), it is recommended that you standardize the sample volume. An appropriate sample height is
approximately 4 cm (3.8 to 4.2 cm).
Sample tube
Rotor
Holder
Sample gauge
Make sure that there
is no gap between the
rotor and the holder.
Center of the detection coil
Align the center of the
sample with this position.
Fig. 1.8
Setting up the holder
2. Check to make sure that the air is flowing by holding your hand over the
sample-insertion port of the SCM.
If air is not flowing, never insert the sample tube into the insertion port of the
SCM. Another sample may already have been inserted or there might be a
problem with the air system.
?
3. Put the sample, in the holder, into the sample-insertion port of the SCM and
gently release it.
The sample levitates on the compressed air.
NMECA/ECX-TU-3
1-7
1 PREPARATION FOR MEASUREMENT
1.3.2
Sample Loading, NMR Lock, and Automatic Resolution
Adjustment
Sample loading, NMR lock, and automatic resolution adjustment are performed using the
Sample window.
①-A
①-B
②
③
④
⑤
⑥
? The numbers ① to ⑥ are referred to in the following steps.
Fig. 1.9 Sample window
■ Loading the sample
l When an auto sample changer is not installed.
Insert into the SCM the sample which was set in the sample-insertion port of the SCM.
F
u Click on the
button in the Sample window (
①-A in Fig.1.9).
When the sample load completes, the flask icon becomes full, as shown below.
l When an auto sample changer is installed
1. Set a sample to the slot of the auto sample changer.
1-8
NMECA/ECX-TU-3
1 PREPARATION FOR MEASUREMENT
2. Set the slot numbers place a sample of the auto sample changer into the
F
①-B in Fig.1.9).
Slot of the Sample window (
After carrying a sample to the top of the SCM, insert it into the SCM. When
sample loading is complete, the flask display changes as follows :
■ Spinning the sample
Usually, you measure the sample while spinning it. If you want to measure the sample
without spinning, proceed to ■NMR lock.
F
u Click on the
button(
② in Fig.1.9).
When the sample starts spinning, the toppled top will be upright as shown below.
■ NMR lock
Select the solvent to be used for NMR locking and execute the NMR lock command.
1. Select the solvent to be used for NMR locking from the Solvent list box (F
③ in Fig.1.9).
If the solvent does not appear in the list box, move the slider at the right side of the
box.
2. Click on the
F
button (
④ in Fig.1.9).
When the NMR lock operates, the messages LOCK ON and IDLE are displayed at
the bottom right of the Lock Control section.
F
button.(
⑤ in Fig.1.9).
When the following message window appears, optimization of the Lock Phase will
be performed.
3. Click on the
Optimization started
Optimization finished
■ Automatic resolution adjustment
F
u Specify the axes for automatic resolution adjustment(
⑤ in Fig.1.9).
Select Z1 Z2 from the pulldown menu. When selection is complete, resolution
adjustment for Z1 and Z2 axes starts automatically.
NMECA/ECX-TU-3
1-9
ONE-BUTTON MEASUREMENT
Chapter 2 explains automatic measurement using one-button operation.
2.1
2.2
2.3
2.4
NMECA/ECX-TU-3
GENERAL ................................................................................................. 2-1
STARTING AND ENDING MEASUREMENT........................................ 2-3
CANCELING MEASUREMENT.............................................................. 2-6
PRECAUTIONS......................................................................................... 2-7
2 ONE BUTTON MEASUREMENT
2.1
GENERAL
Automatic measurement which can be performed by simply clicking one button is called
one-button measurement. When one-button measurement is performed, a series of
conditions for sample settings, measurement, processing, and plotting, and their
combinations are called methods. The following methods are displayed in the
Automation window.
Table 2.1 Preset methods and measurements
Method
Measurement
Sequence name
1D 1H normal measurement
single_pulse.ex2
1D 1H normal measurement
single_pulse.ex2
Presaturation
1D homo gated decoupling
(Automatic solvent-elimination
method)
single_pulse.ex2
Carbon
1D 13C normal measurement
single_pulse_dec.ex2
1D 1H normal measurement
single_pulse.ex2
1D 13C normal measurement
single_pulse_dec.ex2
Proton
Proton_and_Carbon
13
Carbon_and_DEPT_135
Carbon_and_APT
1D C normal measurement
single_pulse_dec.ex2
Automatic determination of 13C
atomic group by means of DEPT
dept.ex2
1D 13C normal measurement
single_pulse_dec.ex2
APT
apt.ex2
1D 13C normal measurement
Edited_DEPT
Proton_and_COSY
Proton_and_DQF_COSY
Proton_and_NOESY
13
Automatic determination of C
atomic group by means of DEPT
dept.ex2
1D 1H normal measurement
single_pulse.ex2
1
1
Homonuclear 2D H- H COSY
cosy.ex2
1D 1H normal measurement
single_pulse.ex2
1
dqf_cosy.ex2
1D 1H normal measurement
single_pulse.ex2
1
noesy.ex2
H double quantum filter COSY
H NOE correlation measurement
1
Proton_and_TOCSY
Hetcor
1D H normal measurement
single_pulse.ex2
TOCSY (TOtal Correlation
SpectroscopY)
tocsy.ex2
1D 1H normal measurement
single_pulse.ex2
1D 13C normal measurement
single_pulse_dec.ex2
Heteronuclear 2D 1H-13C COSY
hector.ex2
1
Flock
NMECA/ECX-TU-3
single_pulse_dec.ex2
1D H normal measurement
single_pulse.ex2
1D 13C normal measurement
single_pulse_dec.ex2
Flock
flock.ex2
2-1
2 ONE BUTTON MEASUREMENT
Method
Measurement
Sequence name
1D 1H normal measurement
single_pulse.ex2
1D 13C normal measurement
Combination_1
13
Automatic determination of C
atomic group by means of DEPT
dept.ex2
Homonuclear 2D 1H-1H COSY
cosy.ex2
13
Gradient_COSY
1
Heteronuclear 2D C – H COSY
hector.ex2
1D 1H normal measurement
single_pulse.ex2
Homonuclear 2D 1H-1H COSY
cosy_pfg.ex2
1
Gradient_DQF_COSY
Gradient_TOCSY
Gradient_PS_NOESY
Gradient_HMQC
1D H normal measurement
single_pulse.ex2
1
dqf_cosy_pfg.ex2
1D 1H normal measurement
single_pulse.ex2
TOCSY
tocsy_pfg.ex2
1D 1H normal measurement
single_pulse.ex2
1
noesy_pfgzz_pn.ex2
1D 1H normal measurement
single_pulse.ex2
1D 13C normal measurement
single_pulse_dec.ex2
H double quantum filter COSY
H homonuclear NOE correlation
1
Gradient_HMQC_with_y_proj
Gradient_HMBC
H observation heteronuclear
correlation
hmqc_pfg.ex2
1D 1H normal measurement
single_pulse.ex2
1
H observation heteronuclear
correlation spectroscopy
hmqc_pfg.ex2
1D 1H normal measurement
single_pulse.ex2
13
1D C normal measurement
1
Gradient_HMBC_with_y_proj
Gradient_HMQC_TOCSY
HMQC_TOCSY_with_y_proj
hmbc_pfg.ex2
1D 1H normal measurement
single_pulse.ex2
1
H observation heteronuclear long
range correlation spectroscopy
hmbc_pfg.ex2
1D 1H normal measurement
single_pulse.ex2
1D 13C normal measurement
single_pulse_dec.ex2
HMQC-TOCSY
hmqc_tocsy_pfg.ex2
1D 1H normal measurement
single_pulse.ex2
HMQC-TOCSY
hmqc_tocsy_pfg.ex2
1D H normal measurement
single_pulse.ex2
1D 13C normal measurement
single_pulse_dec.ex2
Homonuclear 2D 1H-1H COSY
cosy_pfg.ex2
1
H observation heteronuclear
correlation spectroscopy
2-2
single_pulse_dec.ex2
H observation heteronuclear long
range correlation spectroscopy
1
Combination_2
single_pulse_dec.ex2
hmqc_pfg.ex2
NMECA/ECX-TU-3
2 ONE BUTTON MEASUREMENT
2.2
STARTING AND ENDING MEASUREMENT
■ Preparation for one-button measurement
l Setting the sample in the SCM
Insert the sample, according to the procedure in Section1.3, “Sample preparation.”
F
l Opening the Automation window
u Click on the Auto button in the Spectrometer Control window.
The Automation window opens.
Fig. 2.1 Automation window
Filename
Usually, the name of the sample is used.
Comment
Enter a comment.
Slot
Sample number of the automatic sample changer
Sample Status
Messages about the present sample status such as LOADED and
EJECT
Temp. Set
Set temperature used during temperature control
Curr. Temp.
Present sample temperature
NMECA/ECX-TU-3
2-3
2 ONE BUTTON MEASUREMENT
Temp. State
Specify whether or not to carry out temperature control using the
temperature controller.
Lock Status
Present status of the NMR lock
Solvent
Select the sample solvent.
Notify
Information is sent to the specified E-mail address when measurement is complete. In order to use this function, it is necessary to perform the basic setting before using mail.
Even when a sample number is changed, Notify E-mail address is
placed on hold.
Hold
■ Starting one-button measurement
u Click on the desired method button.
Measurement starts.
Method buttons
When measurement starts, the Auto Queue window opens as shown in Fig. 2.2.
2-4
NMECA/ECX-TU-3
2 ONE BUTTON MEASUREMENT
Fig. 2.2
Auto Queue window
■ Ending one-button measurement
After one-button measurement ends, remove the sample according to the following
procedure.
1. Using the Auto Queue window, make sure that the one-button measurement
has completed.
If the method name has disappeared from the Auto Queue window, the one-button
measurement is complete.
2. Open the Sample window.
3. Click on
button.
The sample will be ejected from the SCM. Make sure that the Sample State
display changes to the eject condition.
4. Remove the sample from the SCM insertion port.
NMECA/ECX-TU-3
2-5
2 ONE BUTTON MEASUREMENT
2.3
CANCELING MEASUREMENT
To cancel the measurement during one-button measurement, operate as follows.
①
②
? The numbers ① and ② are referred to in the following steps.
1. Click on the Method part of one button measurement that you want to
F
① in above figure ).
chancel in the Auto Queue window (
The method is highlighted.
Be sure to click on a METHOD without clicking on GROUP and
EXPERIMENT.
?
2. Click on the Remove button (F② in above figure ).
F If you click on the Remove button when GROUP and EXPERIMENT are selected
by mistake, cancellation is not performed correctly. Perform the cancellation
operation again after updating the queue by selecting Option, the Refresh Queue in
the menu bar.
2-6
NMECA/ECX-TU-3
2 ONE BUTTON MEASUREMENT
2.4
PRECAUTIONS
l Specifying an NMR lock solvent
The difficulties which occurs most frequently in one-button measurements is an NMR
lock error.
To prevent NMR lock errors, make sure that the solvent name is entered correctly.
l Automatic resolution adjustment
If the volumes of the samples to be measured are greatly different, or solid substances are
present in the sample, the automatic resolution adjustment takes a long time.
Under these conditions, the appropriate resolution may not be achieved.
To prevent these difficulties, prepare the samples with about the same height of 4 cm, and
align the bottom of the sample tube with that of the sample gauge.
l Probe tuning
The probe tuning varies, depending on measurement parameters such as solvent or
temperature. Especially, before performing a measurement such as DEPT that is
sensitive to pulse width or when measuring a small amount of a sample that requires
improvement of the S/N ratio, be sure to tune the probe.
l Measurement conditions
The measurement conditions for general organic-compound samples are used for
one-button measurement. If you want to measure the sample under special conditions,
perform the measurement using individual operations.
l Hard-disk capacity and data filename
Make sure that there is free space to save data before performing one-button
measurement. The results of one-button measurement are saved in a file with a specified
file name to which the method name is added. If the filename already exists, a new file
with the version number one higher will be created.
l Processing condition
In one-button measurement, parameters for data processing are prespecified. If you want
to perform your own specific data processing, perform it later using the data that has
been saved in the file.
l Plotting
In one-button measurement, data will be plotted automatically. Therefore, make sure
that chart paper is set in the printer correctly, and that the printer is online, before starting
one-button measurement.
NMECA/ECX-TU-3
2-7
1D NMR MEASUREMENT
Chapter 3 explains the procedures for the basic 1D NMR measurement in the order of
measurement, data processing, and plotting. It is assumed that the Delta system has been
connected to the spectrometer, and that the sample setup, sample loading, NMR lock,
resolution adjustment and other operations prior to measurement have already been
performed. If you are not ready to start measurement, prepare for measurement
according to Chapter 1, “Preparations for measurement”.
SETTING 1D NMR MEASUREMENT CONDITIONS........................... 3-1
3.1.1
Setting 1H Measurement Conditions ................................................... 3-1
3.1.2
Setting 13C Measurement Conditions .................................................. 3-4
3.2
STARTING AND ENDING MEASUREMENT........................................ 3-6
3.3
1D NMR DATA PROCESSING ................................................................ 3-7
3.3.1
Automatic Baseline Correction ........................................................... 3-8
3.3.2
Automatic Peak Detection and Automatic Integration........................ 3-9
3.3.3
Plotting ................................................................................................ 3-9
3.3.4
Changing the Display Range............................................................. 3-10
3.1
NMECA/ECX-TU-3
3 1D NMR MEASUREMENT
3.1
3.1.1
SETTING 1D NMR MEASUREMENT CONDITIONS
Setting 1H Measurement Conditions
1. Click on the Expmnt button in the Spectrometer Control window.
The Open Experiment window opens.
Fig. 3.1 Open Experiment window
2. Click on the
button in the Open Experiment window.
A list of the Experiment files*1 in the Global directory *2 is displayed.
3. Select the measurement mode single_pulse.ex2 from the Open Experiment window, and click on the Ok button.
The Experiment Tool window (Fig. 3.2) opens. This Experiment Tool window
consists of the four sections Header, Instrument, Acquisition, and Pulse.
*1 The Experiment files contain the measurement modes, standard measurement conditions, and steps for processing
data. The file type is .ex2.
*2 The Global directory is the directory in which the standard files supplied from JEOL are stored. The files in this
directory cannot be changed.
NMECA/ECX-TU-3
3-1
3 1D NMR MEASUREMENT
Fig. 3.2
Experiment Tool window
4. Set the necessary parameters.
The following parameters are usually used.
For information about the other parameters, refer to the separate volume,
“USER’S MANUAL, MEASUREMENT”.
Parameters can be displayed by double-clicking on Header, Instrument,
Acquisition or Pulse.
F
?
sample_id
Name to identify sample
comment
Comment on measurement data
auto_gain
If you want the instrument to adjust the receiver gain
automatically, click on the button to mark it with a check
mark. The results that were acquired using the automatic
gain will be displayed on the Master Console window
and the Spectrometer Control window.
solvent
Solvent used for NMR lock. If the NMR lock was
already used on the Sample window or another window,
the solvent used has already been set.
recvr_gain
Receiver gain, if automatic gain is not selected.
x_points
Number of data points to measure in each scan
scans
Number of scans to accumulate
5. Make sure that other necessary parameters are set appropriately.
? Parameters
can be displayed by double-clicking on Header, Instrument,
Acquisition or Pulse.
x_domain
3-2
Observation nucleus: Proton
NMECA/ECX-TU-3
3 1D NMR MEASUREMENT
NMECA/ECX-TU-3
x_offset
Observation center frequency: 5 ppm
x_sweep
Observation range: 15 ppm
total_time
Approximate time necessary for measurement
x_pulse
Pulse width to be used for measurement
relaxation_delay
Pulse delay time
3-3
3 1D NMR MEASUREMENT
3.1.2
Setting 13C Measurement Conditions
1. Click on the Expmnt button in the Spectrometer Control window.
The Open Experiment window opens.
2. Click on the
button in the Open Experiment window.
A list of the Experiment files in the Global directory is displayed.
3. Select the measurement mode single_pulse_dec.ex2 from the Open
Experiment window, and click on the Ok button.
The Experiment Tool window opens.
Fig. 3.3
Experiment Tool window
4. Set the necessary parameters.
The following parameters are usually used.
For information about the other parameters, refer to the separate volume,
“USER’S MANUAL , MEASUREMENT”.
Parameters can be displayed by double-clicking on Header, Instrument,
Acquisition or Pulse.
F
?
3-4
sample_id
Name to identify sample
comment
Comment on measurement data
auto_gain
If you want the instrument to adjust the receiver gain
automatically, click on the button to mark it with a check
mark.
NMECA/ECX-TU-3
3 1D NMR MEASUREMENT
solvent
Solvent used for NMR lock. If the NMR lock was
already used on the Sample window or another window,
the used solvent has been set.
recvr_gain
Receiver gain, if automatic gain is not selected.
irr_noise
Noise source for irradiation. Normally, WALTZ is used.
x_points
Number of data points to measure in each scan
scans
Number of scans to accumulate
irr_domain
Irradiation nucleus: Proton
irr_offset
Irradiation position.
5. Make sure that other necessary parameters are set appropriately.
? Parameters
can be displayed by double-clicking on Header, Instrument,
Acquisition or Pulse.
NMECA/ECX-TU-3
x_domain
Observation nucleus: Carbon13
x_offset
Observation center frequency: 100 ppm.
x_sweep
Observation range: 250 ppm
total_time
Approximate time necessary for measurement
x_pulse
Pulse width to be used for measurement
relaxation_delay
Pulse delay time.
3-5
3 1D NMR MEASUREMENT
3.2
STARTING AND ENDING MEASUREMENT
This section explains how to start and end 1D NMR measurement and how to confirm
the measurement status.
■ Starting measurement and displaying the status
u Click on the Submit button in the Experiment Tool window.
The measurement is entered into the spectrometer-control computer’s queue. The
spectrometer executes measurement on a first-in, first-out basis.
Commands for starting measurements can be issued repeatedly, even if another
measurement is being performed. After one measurement finishes, the next measurement will be started under the stored measurement conditions.
This mark indicates
that measurement
is being executed.
Current measurement that is being
executed
Next measurement
that is waiting to be
executed
This mark indicates
that next measurement is waiting to
be executed.
■ Ending measurement
When the measurement finishes, the data processing window opens.
To stop the measurement during operation, refer to Chapter 5, “Queuing”.
F
3-6
NMECA/ECX-TU-3
3 1D NMR MEASUREMENT
3.3
1D NMR DATA PROCESSING
After measurement is complete, data is automatically forwarded from the spectrometer,
and the following processing is automatically executed.
• Correction of the DC components of FID (Free Induction Decay)
• Multiplication by window functions
• FFT (Fast Fourier Transformation)
• Automatic phase correction
This section explains data processing following phase correction.
When measurement is completed, the following 1D Processor window opens.
Fig. 3.4 1D Processor window
NMECA/ECX-TU-3
3-7
3 1D NMR MEASUREMENT
3.3.1
Automatic Baseline Correction
1. Click on the
button in the 1D Processor window.
An item, Base Correct, is added to the process list.
2. Click on the Process button.
The spectrum with the baseline corrected is displayed in the lower spectral display
area.
process list
3-8
NMECA/ECX-TU-3
3 1D NMR MEASUREMENT
3.3.2
Automatic Peak Detection and Automatic Integration
button in the 1D Processor window.
u Click on the
Automatic peak detection and automatic integration are carried out, and the results
are displayed in the lower spectral display area in the 1D Processor window.
3.3.3
Plotting
The standard method of plotting is as follows.
u Click on the
button in the 1D Processor window.
The processed spectrum in the lower display area is plotted on paper.
NMECA/ECX-TU-3
3-9
3 1D NMR MEASUREMENT
3.3.4
Changing the Display Range
■ Usage of Cursor Tool bar
The Cursor Tool bar is used to expand or reduce spectra. The Cursor Tool bar is
available in each display area.
This section explains basic usage of the Cursor Tool bar.
l To display the Cursor Tool bar
u Move the mouse pointer to the spectral display area in which you want to
display the Cursor Tool bar.
The Cursor Tool bar is displayed at the upper right in the spectral display area.
Tab button
Operation buttons Key command Mode button
used in the
button
selected mode
Fig. 3.5
Normal display of Cursor Tool bar
l To minimize the Cursor Tool bar
u Click on the tab button.
The Cursor Tool bar changes from the normal display shown in Fig 3.5 to the
minimized display shown in Fig 3.6.
Fig. 3.6 Minimized Cursor Tool bar
l To return the minimized Cursor Tool bar to the normal display
u Click on the tab button.
The minimized Cursor Tool bar returns to the normal display shown in Fig 3.5.
3-10
NMECA/ECX-TU-3
3 1D NMR MEASUREMENT
l To switch the Cursor Tool mode
1. Move the mouse pointer to the mode button at the right end of the Cursor
Tool bar; then press and hold the left mouse button.
The following thirteen modes are displayed under the mode button.
Zoom
Select
To expand, reduce, or move spectra.
To select data or a geometry.
Region
To display a selected region in another geometry.
Cursor
To correct the baseline, or to display the difference between two
points
Reference
To set a chemical shift reference axis marker.
Peak
To execute a peak pick.
Pick
To set the slice position of 2D data or read peak positions.
Integral
To perform integration.
Annotation To display an annotation in the geometry.
PIP
To display a selected part of the geometry within the present
geometry.
Phase
To adjust the phase.
Molecule
To display a structural formula and molecular formula in the
geometry.
Measure
Measure distance between peaks
chapter explains only the Zoom mode. For more information about the
F This
other modes, refer to the separate volume, “USER'S MANUAL, DATA
PROCESSING”.
2. Move the mouse pointer with the left mouse button still pressed to the mode
you want to select, and release the mouse button.
The Cursor Tool bar changes to the buttons for the selected mode.
l To select a button
u Click on the button you want.
The button you clicked on changes to appear selected or pressed. The explanation
of the selected button is also displayed at the bottom right of the spectral display
area.
the middle mouse button on the mode button with displays a list of the
F Clicking
buttons which can be used in the currently selected mode and an explanation of
these buttons. You can select the button you want to use from the list.
NMECA/ECX-TU-3
3-11
3 1D NMR MEASUREMENT
■ Expanding and resetting spectra in the 1D Processor window
l To expand a spectrum vertically
1. Select the Zoom mode from the Cursor Tool bar or press the F1 key on
the keyboard.
The Cursor Tool mode becomes Zoom, and the mouse pointer on the spectral screen
changes to
.
2. Move the mouse pointer to the position that will become the upper end of the
expanded Y-axis.
3. Drag the left mouse button to the position that will become the lower end of
the expanded Y-axis.
4. Release the left mouse button.
The spectrum is expanded vertically.
l To expand a spectrum horizontally
1. Select the Zoom mode from the Cursor Tool bar or press the F1 key on the
keyboard.
The Cursor Tool mode becomes Zoom.
2. Move the mouse pointer to the position that will become the left end of the
expanded X-axis.
3. Drag the left mouse button to the position that will become the right end of
the expanded X-axis.
4. Release the left mouse button.
The spectrum is expanded horizontally.
3-12
NMECA/ECX-TU-3
3 1D NMR MEASUREMENT
l To adjust the display to the intensity of the highest peak displayed
u Press the End key on the keyboard.
The highest peak in the spectral region displayed at present is expanded or reduced
to fit within the screen.
l To return the spectrum display to its previous conditions
u Press the Backspace key on the keyboard to return to the previous
conditions.
You can return to the previous conditions up to 16 times.
? When you press the
Backspace key, both vertical and horizontal expansions
return to their previous values.
You cannot selectively return only the vertical or horizontal size to its previous
value.
l To return the spectrum display to its initial conditions
u Press the Home key on the keyboard.
All horizontal and vertical expansions return to their initial values.
NMECA/ECX-TU-3
3-13
2D NMR MEASUREMENT
Chapter 4 explains the procedures for the basic 2D NMR measurement in the order of
measurement, data processing, and plotting. It is assumed that the Delta system has been
connected to the spectrometer, and that the sample setup, sample loading, NMR lock,
resolution adjustment and other preparations for measurement have already been
performed. If you are not ready to start measurement, carry out the procedures in
Chapter 1, “Preparation for measurement”.
SETTING 2D NMR MEASUREMENT CONDITIONS........................... 4-1
4.1.1
HH COSY Measurement..................................................................... 4-1
4.1.2
HETCOR Measurement ...................................................................... 4-4
4.1.3
Setting the Measurement Range from 1D NMR Data ........................ 4-6
4.2
STARTING AND ENDING MEASUREMENT...................................... 4-10
4.3
DATA PROCESSING OF 2D NMR ........................................................ 4-11
4.3.1
Displaying Data Using 2D Viewer.................................................... 4-12
4.3.2
Setting the Conditions for Displaying Contour Lines ....................... 4-13
4.3.3
Pasting 1D NMR Data....................................................................... 4-15
4.3.4
Plotting .............................................................................................. 4-16
4.3.5
Changing the Display Ranges ........................................................... 4-17
4.1
NMECA/ECX-TU-3
4 2D NMR MEASUREMENT
4.1
SETTING 2D NMR MEASUREMENT CONDITIONS
This section explains how to set the conditions for measuring 1H–1H homonuclear 2D
NMR (HH COSY) and 13C detection heteronuclear 2D NMR (HETCOR).
4.1.1
HH COSY Measurement
1. Click on the Expmnt button in the Spectrometer Control window.
The Open Experiment window opens.
Fig. 4.1 Open Experiment window
2. Select the measurement mode cosy.ex2 from the list displayed in the Open
Experiment window, and click on the Ok button.
The Experiment Tool window opens.
NMECA/ECX-TU-3
4-1
4 2D NMR MEASUREMENT
Fig. 4.2
Experiment Tool window
3. Set the necessary parameters.
The parameters which are usually used are explained below.
For information about other parameters, refer to the separate
MEASUREMENT user’s manual.
Parameters can be displayed by double-clicking on Header, Instrument,
Acquisition or Pulse.
F
?
sample_id
Name to identify sample
comment
Comments on measurement data
auto_gain
Normally, do not check this box for 2D measurement.
solvent
Solvent used for an NMR lock
recvr_gain
Set the gain which was used for normal 1H measurement.
x_points
Number of data points on the f2 axis
scans
Number of scans to accumulate
y_points
Number of data points on the f1 axis
pulse_angle_1
Flip angle. 90 [deg] in Cosy.
pulse_angle_2
Flip angle. 90 [deg] or 45 [deg] in Cosy.
relaxation_delay
Pulse delay time
4. Verify the necessary parameters.
? Parameters
can be displayed by double-clicking on Header, Instrument,
Acquisition or Pulse.
4-2
x_domain
Observation nucleus: Proton
x_offset
Observation center frequency (ppm)
NMECA/ECX-TU-3
4 2D NMR MEASUREMENT
x_sweep
Observation range (ppm)
total_time
Approximate time necessary for measurement
x_90_width
90° pulse width
pulse_1
pulse_2
First pulse width to be used for measurement
Second Pulse width to be used for measurement
? x_offset and x_sweep can be set from 1D NMR data which has already been
processed. For the procedure, refer to Section 4.1.3, “Setting the measurement
range from 1D NMR data.”
NMECA/ECX-TU-3
4-3
4 2D NMR MEASUREMENT
4.1.2
HETCOR Measurement
1. Click on the Expmnt button in the Spectrometer Control window.
The Open Experiment window opens.
2. Select the measurement mode htcor.ex2 from the list displayed in the Open
Experiment window, and click on the Ok button.
The Experiment Tool window opens.
Fig. 4.3
Experiment Tool window
3. Set the necessary parameters.
The parameters which are usually used are explained below.
For information about other parameters, refer to the separate
MEASUREMENT user’s manual.
Parameters can be displayed by double-clicking on Header, Instrument,
Acquisition or Pulse.
F
?
4-4
sample_id
Name to identify sample
comment
Comments on measurement data
auto_gain
Normally, do not check this box for 2D measurement.
solvent
Solvent used for NMR lock
recvr_gain
Set the gain which was used for 13C 1D measurement.
x_points
Number of data points on the f2 axis
scans
Number of scans to accumulate
y_points
Number of data points on the f1 axis
j_constant
J value
NMECA/ECX-TU-3
4 2D NMR MEASUREMENT
relaxation_delay
Pulse delay time
4. Verify the necessary parameters.
? Parameters
can be displayed by double-clicking on Header, Instrument,
Acquisition or Pulse.
x_domain
Observation nucleus: Carbon
x_offset
Observation center frequency (ppm)
x_sweep
Observation range (ppm)
y_domain
Irradiation nucleus: Proton
y_offset
Irradiation center frequency (ppm)
y_sweep
Irradiation range (ppm)
total_time
Approximate time necessary for measurement
x_pulse
13
y_pulse
1
C pulse width to be used for measurement
H pulse width to be used for measurement
? x_offset, x_sweep, y_offset, and y_sweep can be set from 1D NMR data which
has already been processed. For the procedure, refer to Section 4.1.3, “Setting
the measurement range from 1D NMR data.”
NMECA/ECX-TU-3
4-5
4 2D NMR MEASUREMENT
4.1.3
Setting the Measurement Range from 1D NMR Data
To measure 1H-1H homonuclear 2D NMR, 1H 1D NMR data is necessary. To measure 1H
detection heteronuclear 2D NMR or 13C detection heteronuclear 2D NMR, 1H 1D data
and 13C 1D data are necessary. If 1D data is already loaded in the 1D Processor window,
proceed to ■ Setting the measurement range from 1D NMR data. If these 1D NMR
data are not yet displayed in the 1D Processor window, load data in the 1D Processor
window from the file as follows.
■ Loading 1D data
1. Click on the
button in the Delta Console window.
The Open Data for Processing window opens.
Fig. 4.4 Open Data for Processing window
2. Using the mouse, select the 1D NMR data from the data file list in the Open
Data for Processing window.
3. After you select the file from the Open Data for Processing window, click on
the Ok button.
The data is loaded, and the 1D Processor window opens.
4-6
NMECA/ECX-TU-3
4 2D NMR MEASUREMENT
Fig. 4.5 1D Processor window
4. If the loaded 1D NMR data is FID, perform data processing such as FFT,
phase correction, and reference setting, referring to Section 3.3 1D NMR
data processing.
If data processing has already been executed, proceed to the next step.
■ Setting the measurement range from 1D NMR data (HH COSY)
1. Expand the processed 1D NMR data to the range to be used for 2D NMR
measurement.
button in the Experiment Tool window.
2. Click on the
3. Click on the View X button.
The mouse pointer changes to
NMECA/ECX-TU-3
.
4-7
4 2D NMR MEASUREMENT
4. Move the mouse pointer to the position of the processed 1D data, and click
the left mouse button.
x_offset and x_sweep are set to the offset and range values of the area where the 1D
NMR data is displayed.
■ Setting the measurement range from 1D NMR data (HETCOR)
1. Expand the processed 1D NMR data to the range to be used for 2D NMR
measurement.
button in the Experiment Tool window.
2. Click on the
3. Click on the View X button.
The mouse pointer changes to
.
4. Move the mouse pointer to the position of the processed 1D data (13C 1D
NMR data, for example), and click the left mouse button.
4-8
NMECA/ECX-TU-3
4 2D NMR MEASUREMENT
x_offset and x_sweep are set to the offset and range values of the area where the 1D
NMR data is displayed.
5. Click on the View Y button as well.
The mouse pointer changes to the shape of a finger.
6. Move the mouse pointer to the position of the 1D data (1H 1D data, for
example), and click the left mouse button.
y_offset and y_sweep are set to the offset and range values of the area where the 1D
NMR data is displayed.
NMECA/ECX-TU-3
4-9
4 2D NMR MEASUREMENT
4.2
STARTING AND ENDING MEASUREMENT
■ Starting measurement and displaying the present status
u Click on the Submit button in the Experiment Tool window.
The measurement is entered into the spectrometer-control computer’s queue. The
spectrometer executes measurement on a first-in, first-out basis.
The command for starting measurement can be issued repeatedly, even if another
measurement is being performed. After one measurement finishes, the next measurement will be started under the stored measurement conditions.
This mark indicates
that measurement
is being executed.
Current measurement that is being
executed
Next measurement
that is waiting to be
executed
This mark indicates
that next measurement is waiting to
be executed.
■ Ending measurement
When the measurement finishes, the nD processor window opens.
To stop the measurement during operation, refer to Chapter 5, “Queuing.”
F
4-10
NMECA/ECX-TU-3
4 2D NMR MEASUREMENT
4.3
DATA PROCESSING OF 2D NMR
This section explains data processing immediately after completion of NMR
measurement.
When measurement is complete, Data will be sent from the spectrometer to the
processing computer, and the nD Processor window will open.
Data will be processed according to the process list in the pulse sequence.
Fig. 4.6 nD Processor window
If you change the processing conditions, click on the
button to display the process
button again after changing the process list, processing will
list. If you click on the
be executed again according to the changed contents.
Fig. 4.7 nD Processor window (Process list display screen)
NMECA/ECX-TU-3
4-11
4 2D NMR MEASUREMENT
4.3.1
Displaying Data Using 2D Viewer
u Click on the
button in the nD Processor window.
A new 2D Viewer opens, and projection data other than 2D data are displayed.
Projection data
display area
2D data
display area
Fig. 4.8
4-12
2D Viewer window
NMECA/ECX-TU-3
4 2D NMR MEASUREMENT
4.3.2
Setting the Conditions for Displaying Contour Lines
The 2D Viewer window is used to set the levels of the contour lines.
The Level Tool window is used to change the levels of the contour lines.
1. Click the right mouse button to display the pop-up menu, and select Level
Tool.
The Level Tool window opens.
Contour-line level button
Top slider
Preset button
Bias slider
Threshold level
Noise level
Bottom slider
Apply button
Base level
Fig. 4.9
Preset button
Level Tool window
Allows you to set the number of contour lines by
selecting the 2, 4, 6, 8, 12, or 24 preset button.
Contour-line level button The level of contour can be set manually by clicking on
its button to highlight it.
NMECA/ECX-TU-3
Top slider
Determines the maximum intensity of the contour lines.
Bottom slider
Determines the minimum intensity of the contour lines.
4-13
4 2D NMR MEASUREMENT
Bias slider
Determines the signal intensity between the ones
specified by the top slider and the bottom slider. Moving
the bias slider changes the slope of the middle curve
shown in Fig. 4.8. Moving it upward results in drawing
more contour lines at the lower level of the signal
intensities.
Noise level
Automatically set after data processing is completed.
Threshold level
Automatically set after data processing is completed, and
used for peak picking in 2D processing.
Base level
Zero level of the signal intensity. Set it to the lowest
level in the Level tool window.
Apply button
Clicking on this button redraws the contour lines at the
set levels.
2. Adjust the levels of the contour lines in the Level Tool window.
Set the minimum intensity based on the noise level. Set the number and intensity of
the contour lines to be drawn between the minimum intensity and the maximum
intensity in the Level Tool window.
Noise level
? Usually, few or no contour lines are set to levels below the noise level.
Setting
the contour level below the noise level displays the contour lines of noise, and
needs a large amount of memory in the system, slowing down the processing of
the program.
a.
b.
c.
d.
e.
4-14
Set the levels according to the following procedure:
Click on the bottom contour-line level button.
Determine the bottom level of the contour lines using the bottom slider.
Determine the top level of the contour lines using the top slider.
Select the number of contour lines you want to display from the preset
buttons.
Click on the Apply button.
NMECA/ECX-TU-3
4 2D NMR MEASUREMENT
4.3.3
Pasting 1D NMR Data
This section explains how to paste 1D NMR data onto the slice or projection data display
area in the 2D Viewer window.
It is assumed that 1D NMR data on which data processing such as FFT was already
performed is stored on the hard disk or is displayed in the 1D Processor window.
■ When 1D NMR data is stored on the hard disk
1. Click on the
button.
2. To paste 1D data onto the X axis:
a. Select Display — High-Res — Load X Projection.
The Open Data for Processing window opens.
b. Select a file.
ID NMR data is pasted in the projection display area of the X axis.
3. To paste 1D data onto the Y axis:
a. Select Display — High-Res — Load Y Projection.
b. Select a file.
1D NMR data is pasted onto the projection display area of the Y axis.
NMECA/ECX-TU-3
4-15
4 2D NMR MEASUREMENT
■ When 1D NMR data is displayed on the 1D Processor window
1. Click on the
button.
2. To paste 1D data onto the X axis.
a. Select Display — High-Res — Load X Projection.
The mouse pointer changes to
.
b. Move the mouse pointer onto the displayed 1D NMR data and click on it.
The 1D NMR data is pasted onto the slice or projection display area of the X-axis.
3. To paste 1D data onto the Y axis.
a. Select Display — High-Res — Load Y Projection.
The mouse pointer will be changed to a finger shape.
b. Move the mouse button on the displayed 1D data and click.
1D NMR data is pasted onto the projection display area of the Y axis.
4.3.4
Plotting
This section explains how to perform the standard plotting.
For the details about the settings, refer to the separate volume, Processing User’s Guide.
u Click on the
button in the 2D Viewer window.
The default plotting is performed.
4-16
NMECA/ECX-TU-3
4 2D NMR MEASUREMENT
4.3.5
Changing the Display Ranges
The Cursor Tool bar is used to expand and reduce spectra.
For how to display the Cursor Tool, refer to Section 3.3.4. For the details of the
Cursor Tool, refer to the separate volume, Processing User’s Guide.
F
■ To expand a spectrum vertically and horizontally at the same time
1. Select the Zoom mode from the Cursor Tool or press the F1 key on the
keyboard.
The Cursor Tool mode becomes Zoom.
2. Move the mouse pointer to the position that will become the lower left corner
of expansion in the display area.
3. Press and hold down the left mouse button, and move the mouse pointer to
the position that will become the upper left corner of expansion in the display
area.
4. Release the left mouse button.
The spectrum is expanded vertically and horizontally at the same time.
■ To return the spectrum display to its previous conditions
u Press the Backspace key on the keyboard to return the display to its
previous conditions.
You can do this up to 16 times.
NMECA/ECX-TU-3
4-17
4 2D NMR MEASUREMENT
? When
you do this, both vertical and horizontal expansions return to their
previous values.
You cannot selectively return only the vertical or horizontal size to its previous
value.
■ To return the spectrum display to its initial conditions
u Press the Home key on the keyboard.
The horizontal and vertical scales return to their initial values.
4-18
NMECA/ECX-TU-3
QUEUING
This chapter explains how to start measurement and how to control queues.
5.1
5.2
NMECA/ECX-TU-3
COMMAND FOR STARTING MEASUREMENT................................... 5-1
QUEUING.................................................................................................. 5-2
5 QUEUING
5.1
COMMAND FOR STARTING MEASUREMENT
■ Starting measurement and displaying the present status
Clicking on the Submit button in the Experiment Tool window enters the measurement
into the spectrometer-control computer’s queue, and the spectrometer executes
measurement on a first-in, first-out basis.
The command for starting measurement can be issued repeatedly, even if another
measurement is being performed. After one measurement finishes, the next measurement will be started under the stored measurement conditions.
This mark indicates
that measurement
is being executed.
Current measurement that is being
executed
Next measurement
that is waiting to be
executed
This mark indicates
that next measurement is waiting to
be executed.
Fig. 5.1 Displaying the status of the queue
NMECA/ECX-TU-3
5-1
5 QUEUING
5.2
QUEUING
■ Deleting measurement
You can delete measurements in the queue using the following procedures.
l How to delete specified experiment
1. Click on the measurement to delete from the Spectrometer Control window.
The specified measurement is highlighted.
2. Click on the
button in the Spectrometer Control window.
A window appears to verify deletion.
Fig. 5.2 The window that verifies the queue to delete.
3. To delete the queue, click on the OK button.
l How to delete all experiment from the pending queue.
1. Select Queue — Delete in the Spectrometer Control window.
A window appears to verify deletion.
Fig. 5.3 The window that verifies the queue to delete.
2. To delete the entire queue, click on the OK button.
5-2
NMECA/ECX-TU-3
5 QUEUING
■ Viewing information about the jobs in the queue
You can view the details of a job in the measurement queue as follows.
1. Double-click on the job whose information you want to view in the Spectrometer Control window.
The Job Info window opens.
Fig. 5.4 Job Info window
2. Display the parameter you want to make sure of, using the arrow ▲▼
buttons.
3. To finish viewing, click on the Close button.
The Job Info window is closed.
NMECA/ECX-TU-3
5-3
SAVING AND LOADING DATA
Chapter 6 explains how to save NMR data, and how to load data from a file.
SAVING NMR DATA ................................................................................ 6-1
6.1.1
Saving the measured data (FID).......................................................... 6-1
6.1.2
Saving Processed Data ........................................................................ 6-3
6.2
LOADING DATA....................................................................................... 6-6
6.1
NMECA/ECX-TU-3
6 SAVING AND LOADING DATA
6.1
6.1.1
SAVING NMR DATA
Saving the measured data (FID)
The measured data (FID) is saved automatically. A file name for the saved data is
specified as in the following procedure.
■ Specifying a file name for saved data before measurement
1. Specify the file name to the data you want to save in the filename of the
Experiment Tool window.
File name
Fig. 6.1
Experiment Tool window
2. When specifying the directory to save, click on filename or on the Browse
button.
The Save Collect Data to … window opens.
File name
entry box
Fig. 6.2
NMECA/ECX-TU-3
Save Collect Data to… window
6-1
6 SAVING AND LOADING DATA
3. After moving to the directory to save, enter the file name to save it in the
Name entry box, and click on the OK button.
When creating a new directory, after specifying a directory name in the Path
button. Create the directory and move it. After that,
input box, click on the
enter the filename to save it into the filename entry box.
?
4. Start measurement.
When measurement is complete, the data is saved with the specified name.
■ Specifying a saving file name after measurement
When you did not specify a filename before measurement, the measured data is saved
with a filename specified in the Experiment Tool window. Change this saved filename
using the following procedure.
1. Select File—Change Working File from the 1D Processor or nD Processor
window.
The Rename Data File to... window opens.
Filename
entry box
Fig. 6.3 Rename Data File to... window
2. Type any filename in the filename entry box.
? When creating a new directory, after specifying a directory name in the Path
input box, click on the
button. Create the directory and move it. After that,
enter the filename to save it into the filename entry box.
3. Click on the Ok button.
The filename of the measurement data (FID) changes to the specified filename.
If that filename exists, the version number is incremented by one.
6-2
NMECA/ECX-TU-3
6 SAVING AND LOADING DATA
6.1.2
Saving Processed Data
■ To save 1D processed data in the 1D Processor window under the same
filename
u Click on the
button in the 1D Processor window.
The 1D processed data is saved. Then, the version number increases automatically under
the same filename.
■ To save 1D processed data in the1D Processor window under a new
filename
1. Select File — Save As from the menu bar.
The Save Data File window opens.
Filename
entry box
Fig. 6.4
Save Data File window
2. Type any filename in the filename entry box.
? When creating a new directory, after specifying a directory name in the Path
input box, click on the
button. Create the directory and move it. After that,
enter the filename to save it into the filename entry box.
3. Click on the Ok button.
The 1D processed data is saved under the specified filename.
NMECA/ECX-TU-3
6-3
6 SAVING AND LOADING DATA
■ To save 2D processed data in the 2D Viewer window under the same
filename
u Click on the
button.
The 2D processed data is saved. Then, the version number increases automatically
under the same filename.
■ To save 2D processed data in the 2D Viewer window under a new filename
1. Select File — Save As from the menu bar.
The Save Data File window opens.
Filename
entry box
Fig. 6.5
6-4
Save Data File window
NMECA/ECX-TU-3
6 SAVING AND LOADING DATA
2. Type any filename in the filename entry box.
? When creating a new directory, after specifying a directory name in the Path
input box, click on the
button. Create the directory and move it. After that,
enter the filename to save it into the filename entry box.
3. Click on the Ok button.
The 2D processed data is saved under the specified filename.
NMECA/ECX-TU-3
6-5
6 SAVING AND LOADING DATA
6.2
LOADING DATA
1. Click on the
button in the Delta Console window.
The Open Data for Processing window opens.
Data version
display box
List box
Data information
display box
Fig. 6.6 Open Data for Processing window
2. Click on the name of the data file you want to load in the list box.
3. Click on the Ok button.
The most recent version of data is displayed in the 1D Processor window or nD
Processor window.
The following information on the most recent version of data is displayed in the
data information display box.
?
Time domain/frequency domain (unit)
[s]:
Time domain data (FID data)
[Hz], [PPM]: Frequency domain data (Fourier-transformed data)
1D/2D/nD
Number of data points
Row of data
R: Ranged
S: Sparsed
Revision_time
Comment
Sample ID
Creation_time
If you want to display earlier data, select the version number, referring to information in the data information display box, and click on the Ok button.
6-6
NMECA/ECX-TU-3
6 SAVING AND LOADING DATA
■ Version number
In the Delta program, a version number is appended to each data filename. Before data
is processed, a new file is automatically created under the same filename with a different
version than that of the original data. The original data is not processed, preventing
corruption of the original FID data. If you save data under the existing filename, the data
is given a version number one higher. Copied data is sometimes deleted after it is
processed. Therefore, some of the version numbers in the file list are usually omitted.
■ Directory
You can specify two directories in the Open Data for 1D Processor window using the
buttons. One is a local directory. The other is a global directory. Normally, the user
uses the local directory.
l Local directory
button displays a list of the files in the local directory in the middle
Clicking on the
of the Open Data for 1D Processor window.
The local directory is specified in DATA in the .delta_configure file.
?
l Global directory
button displays a list of the files in the global directory in the
Clicking on the
middle of the Open Data for 1D Processor window. Because the global directory
cannot be used for writing, it is not used to store data.
The global directory is specified in GLOBAL in the .delta_configure file.
?
NMECA/ECX-TU-3
6-7
INDEX
1
13
C measurement conditions .............. 3-4
1D NMR data processing .................. 3-7
1D Processor window ............... 3-7, 4-7
1
H measurement conditions ............... 3-1
A
Annotation .................................... 3-11
Apply button .................................. 4-14
auto_gain ................... 3-2, 3-4, 4-2, 4-4
Automatic baseline correction ........... 3-8
Automatic integration ....................... 3-9
Automatic peak detection .................. 3-9
Automatic resolution adjustment 1-9, 2-7
Automation window ........................ 2-3
Auto Queue window ........................ 2-5
B
Base level....................................... 4-14
Bias slider ...................................... 4-14
Bottom slider.................................. 4-13
C
Canceling measurement .................... 2-6
Changing the display range ............. 3-10
Changing the display ranges............ 4-17
comment..................... 3-2, 3-4, 4-2, 4-4
Comment......................................... 2-3
Connecting to the spectrometer ......... 1-3
Contour-line level button ................ 4-13
Curr. Temp...................................... 2-3
Cursor ........................................... 3-11
Cursor tool bar ............................... 3-10
Cursor tool mode ............................ 3-11
D
Data filename ................................... 2-7
Deleting measurement....................... 5-2
Delta Console window ..................... 1-1
Directory .......................................... 6-7
Disconnecting from the spectrometer. 1-4
displaying the present status.............. 5-1
NMECA/ECX-TU-3
E
Ejecting the sample .......................... 1-6
Ending 2D NMR measurement ........4-10
Ending measurement ........................ 3-6
Ending one-button measurement ....... 2-5
Ending the Delta program................. 1-2
Expanding and resetting spectra
in the 1D Processor window ........3-12
Experiment files ............................... 3-1
Experiment Tool window .........3-2, 3-4,
4-2, 4-4
F
Filename ......................................... 2-3
G
Global directory .........................3-1, 6-7
H
Hard-disk capacity ........................... 2-7
HETCOR measurement .................... 4-4
HH COSY measurement ................... 4-1
Highest peak ...................................3-13
Hold ................................................ 2-4
I
Integral ..........................................3-11
irr_domain...................................... 3-5
irr_noise ......................................... 3-5
irr_offset......................................... 3-5
J
j_constant ....................................... 4-4
Job Info window ............................. 5-3
L
Loading 1D data............................... 4-6
Loading data .................................... 6-6
Loading the sample .......................... 1-8
Local directory................................. 6-7
Lock Status ..................................... 2-4
I-1
INDEX
M
Measure......................................... 3-11
Measurement conditions ................... 2-7
Methods ........................................... 2-1
Molecule ........................................ 3-11
N
NMR lock......................................... 1-9
Noise level ..................................... 4-14
Notify .............................................. 2-4
O
One-button measurement................... 2-1
Open Data for Processing window . 4-6,
6-6
Open Experiment window ............... 3-1
P
Pasting 1D NMR data ..................... 4-15
Peak............................................... 3-11
Phase ............................................. 3-11
Pick ............................................... 3-11
PIP ................................................ 3-11
Plotting ............................ 2-7, 3-9, 4-16
Preparation for one-button
measurement ................................. 2-3
Preset button................................... 4-13
Probe tuning ..................................... 2-7
Processing condition ......................... 2-7
pulse_1 ............................................ 4-3
pulse_2 ............................................ 4-3
pulse_angle_1 .................................. 4-2
pulse_angle_2 .................................. 4-2
Q
Queuing............................................ 5-2
R
recvr_gain .................. 3-2, 3-5, 4-2, 4-4
Reference ...................................... 3-11
Region ........................................... 3-11
relaxation_delay......... 3-3, 3-5, 4-2, 4-5
Rename Data File to... window ........ 6-2
Return ................................... 3-13, 4-18
S
sample_id ................... 3-2, 3-4, 4-2, 4-4
I-2
Sample state..................................... 1-6
Sample Status ................................. 2-3
Sample window ............................... 1-5
Save Data File window .................... 6-3
Saving Processed Data...................... 6-3
scans ...........................3-2, 3-5, 4-2, 4-4
Select .............................................3-11
Setting the conditions for
displaying contour lines ...............4-13
Setting the measurement range
from 1D NMR data (HETCOR) ..... 4-8
Setting the measurement range
from 1D NMR data (HH COSY).... 4-7
Setting up the sample ....................... 1-7
Slot.................................................. 2-3
solvent.........................3-2, 3-5, 4-2, 4-4
Solvent ............................................ 2-4
Specifying an NMR lock solvent....... 2-7
Spectrometer Control window ........ 1-4
Spinning the sample ......................... 1-9
Starting 2D NMR measurement .......4-10
Starting measurement ................ 3-6, 5-1
Starting one-button measurement ...... 2-4
Starting the Delta program................ 1-1
T
Temp. Set ........................................ 2-3
Temp. State ..................................... 2-4
Threshold level ...............................4-14
To expand a spectrum horizontally ...3-12
To expand a spectrum vertically .......3-12
To expand a spectrum vertically
and horizontally at the same time .4-17
Top slider ........................................4-13
total_time....................3-3, 3-5, 4-3, 4-5
V
Version number ................................ 6-7
Viewing information about the
jobs in the queue ........................... 5-3
X
x_90_width ..................................... 4-3
x_domain ....................3-2, 3-5, 4-2, 4-5
x_offset .......................3-3, 3-5, 4-2, 4-5
x_points ......................3-2, 3-5, 4-2, 4-4
x_pulse .............................. 3-3, 3-5, 4-5
x_sweep.......................3-3, 3-5, 4-3, 4-5
NMECA/ECX-TU-3
INDEX
Y
y_domain......................................... 4-5
y_offset............................................ 4-5
y_points.................................... 4-2, 4-4
NMECA/ECX-TU-3
y_pulse............................................ 4-5
y_sweep........................................... 4-5
Z
Zoom..............................................3-11
I-3