1
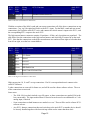
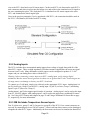
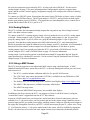
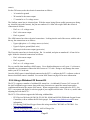
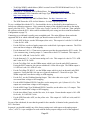
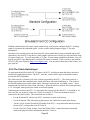
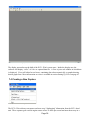
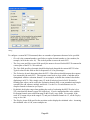
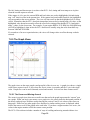
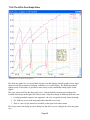
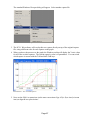
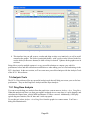
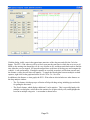
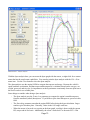
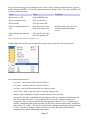
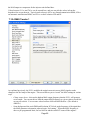
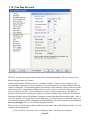
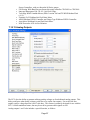
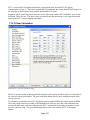
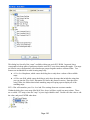
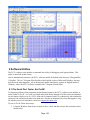
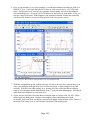
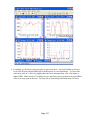
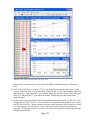
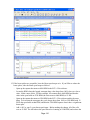
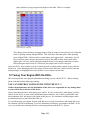
Illustration 64 - The drag race analysis view
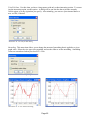
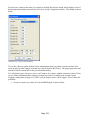
With the dialog visible, enter in the approximate start time of the drag race and click the Calculate
button. The ECU+ Win software will try to find a spot past the start time in which the car was over 60
MPH (so the starting time doesn't have to be very accurate at all), and then search backwards to find the
time when the car was stopped. It'll treat the stopped time as the start of the drag race and compute the
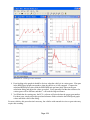
vehicle's ¼ mile performance. If multiple captures are overlaid, an analysis will be done on each and
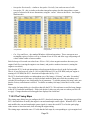
the distance vs time plot will show all captures. To toggle the Results pane between multiple overlaid
captures, right-click on the graph and select Switch Cursor To->Next Plot.
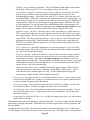
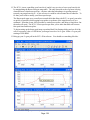
In addition to the distance vs time graph, the ECU+ Win software also includes two other features on
the drag analysis window:
•
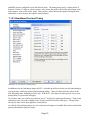
The Tips button, which pops up a collection of help with drag racing, including tips and tricks
for getting the best times.
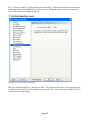
•
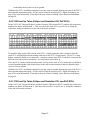
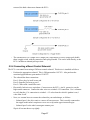
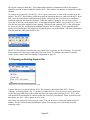
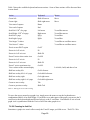
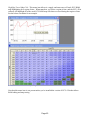
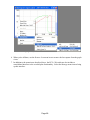
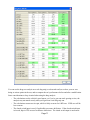
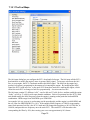
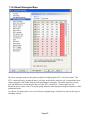
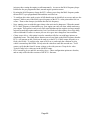
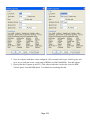
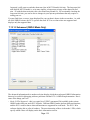
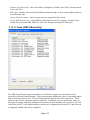
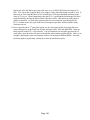
The Details button, which displays additional ¼ mile statistics. This is especially handy with
multiple overlaid plots, as this shows the statistics for all plots side-by-side, and highlights the
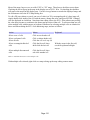
best run in multiple categories. A screenshot is shown below.
Page 70