1
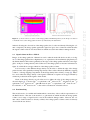
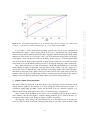
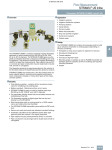
Open Research Online
The Open University’s repository of research publications
and other research outputs
Modelling charge storage in Euclid CCD structures
Journal Article
How to cite:
Clarke, A. S.; Hall, D. J.; Holland, A. and Burt, D. (2012).
structures. Journal of Instrumentation, 7(C0105)
Modelling charge storage in Euclid CCD
For guidance on citations see FAQs.
c 2012 IOP Publishing Ltd and SISSA
Version: Version of Record
Link(s) to article on publisher’s website:
http://dx.doi.org/doi:10.1088/1748-0221/7/01/C01058
http://iopscience.iop.org/1748-0221/7/01/C01058/
Copyright and Moral Rights for the articles on this site are retained by the individual authors and/or other copyright owners. For more information on Open Research Online’s data policy on reuse of materials please consult
the policies page.
oro.open.ac.uk
Home
Search
Collections
Journals
About
Contact us
My IOPscience
Modelling charge storage in Euclid CCD structures
This content has been downloaded from IOPscience. Please scroll down to see the full text.
2012 JINST 7 C01058
(http://iopscience.iop.org/1748-0221/7/01/C01058)
View the table of contents for this issue, or go to the journal homepage for more
Download details:
IP Address: 137.108.145.39
This content was downloaded on 15/11/2013 at 15:31
Please note that terms and conditions apply.
P UBLISHED BY IOP P UBLISHING FOR SISSA
R ECEIVED: October 26, 2011
ACCEPTED: December 19, 2011
P UBLISHED: January 13, 2012
T HE 9th I NTERNATIONAL C ONFERENCE
12–16 S EPTEMBER 2011,
A BERYSTWYTH , U.K.
ON
P OSITION S ENSITIVE D ETECTORS ,
A.S. Clarke,a,1 D.J. Hall,b A. Hollanda and D. Burtb
a e2v
centre for electronic imaging,
PSSRI, The Open University, England
b e2v Technologies Plc,
Chelmsford, England
E-mail: [email protected]
A BSTRACT: The primary aim of ESA’s proposed Euclid mission is to observe the distribution of
galaxies and galaxy clusters, enabling the mapping of the dark architecture of the universe [1]. This
requires a high performance detector, designed to endure a harsh radiation environment.
The e2v CCD204 image sensor was redesigned for use on the Euclid mission [2]. The resulting e2v CCD273 has a narrower serial register electrode and transfer channel compared to its
predecessor, causing a reduction in the size of charge packets stored, thus reducing the number of
traps encountered by the signal electrons during charge transfer and improving the serial Charge
Transfer Efficiency (CTE) under irradiation [3].
The proposed Euclid CCD has been modelled using the Silvaco TCAD software [4], to test
preliminary calculations for the Full Well Capacity (FWC) and the channel potential of the device
and provide indications of the volume occupied by varying signals. These results are essential for
the realisation of the mission objectives and for radiation damage studies, with the aim of producing
empirically derived formulae to approximate signal-volume characteristics in the devices. These
formulae will be used in the radiation damage (charge trapping) models.
The Silvaco simulations have been tested against real devices to compare the experimental
measurements to those predicted in the models. Using these results, the implications of this study
on the Euclid mission can be investigated in more detail.
K EYWORDS : Detector modelling and simulations II (electric fields, charge transport, multiplication and induction, pulse formation, electron emission, etc); Solid state detectors
1 Corresponding
author.
c 2012 IOP Publishing Ltd and SISSA
doi:10.1088/1748-0221/7/01/C01058
2012 JINST 7 C01058
Modelling charge storage in Euclid CCD structures
Contents
Introduction
1
2
Radiation damage
2.1 Emission
2.2 Capture probability
2.3 Signal-volume in Silvaco Models
2.4 Benchmarking
2.5 Signal-volume theory
2
2
2
3
3
4
3
Signal-volume characterisation.
5
4
Implications for charge transfer
6
5
Comparison of the CCD273 vs. CCD204
7
6
Conclusion
8
1
Introduction
The aim of the Euclid mission is to create detailed wide field images of the universe in order to calculate the weak lensing effect that dark energy masses will have on the light from distant galaxies.
This will allow the mass of the intervening dark energy to be calculated without knowledge of its
composition, to produce a dark energy map of the universe [5, 8].
The detector used on the proposed mission will be formed from an array of CCD273s [2].
These devices were designed and are currently being manufactured by e2v (U.K.). The detector was specifically designed for Euclid, based on an older device, but with changes designed to
improve CTE under irradiation. The design changes were necessary due to the harsh operating
environment (the estimated end-of-life 10 MeV proton fluence is around 6 × 10⁹ protons cm−2 in
the worst case, where the satellite orbit is at L2) and to provide the high accuracy required for a
good weak lensing survey.
Radiation damage causes electron traps to form in solid state imaging devices. If the traps are
located in the buried channel, these traps can capture electrons from passing charge packets during
transfer. Traps with fast emission times may release the captured charge into an adjacent packet,
distorting (or “smearing”) the image PSF [6].
It is necessary to reduce the effects of radiation damage on the images captured such that
distortion due to weak lensing can be separated from distortion caused by radiation damage. The
aim of this work is to aid the calibration of the radiation damage models and also to aid in the
post processing of images to remove the effects of radiation damage. The radiation damage models
–1–
2012 JINST 7 C01058
1
2
Radiation damage
Charge is read out of CCDs by transferring the charge stored in each pixel in parallel along the
transfer channels until it reaches the register, and then transferred along the register in series until
it reaches the readout node, where it is output from the device. These charge packets can undergo
thousands of transfers until they reach the output node, depending on the size of the CCD and their
starting location in it, so it is essential that the CTE is optimized to preserve image fidelity.
High energy particles incident on the detector cause displacement damage in the silicon lattice,
where Si atoms in the path of the particle are pushed away from their lattice position leaving behind
a vacancy. These vacancies are unstable and are able to migrate through the device until they
become stable. Phosphorous atoms are able to stabilise these vacancies, but the combination of Si
vacancy and P atom creates an electron trap known as a PV centre [7].
Phosphorus is the element used predominantly to dope the buried channel in n channel devices;
as such PV centres are likely to be located randomly throughout the buried channel. Traps located
in the buried channel will be able to trap charge from passing charge packets, thus reducing CTE.
2.1
Emission
Traps with emission times much larger than the readout speed, may release trapped charge after the
image has been read out of the device, thus reducing the signal levels. Traps with shorter emission
times, comparable to the transfer time from pixel to pixel, may release trapped charge from one
charge packet into the next, distorting the PSF of a point source such as an astronomical object.
This effect is critical in the Euclid mission where the weak lensing survey depends on the accurate
measurement of distortion of galaxy shapes and positions [1].
2.2
Capture probability
The radiation damage models calculate the probability of capture using Shockley-Read-Hall theory [9]. The only traps affecting charge transfer are those in the vicinity of the charge packet, making the signal-volume models essential for a more realistic radiation damage model. The signalvolume plots are produced using the Silvaco models of the detector device structures with charge
–2–
2012 JINST 7 C01058
require knowledge of electron distributions in the device structure such that the probability of
trapping can be calculated more accurately.
This study details the electron distributions obtained from three-dimensional models of the Euclid device structures to calculate charge packet volume, produced using the commercially available
Silvaco ATLAS software [4]. The aim is to enable the calibration of the radiation damage models through empirically derived formulae which approximate charge packet volume, based on the
observations of the charge packet in the device simulations.
The device models are benchmarked using measurable parameters against values measured in
test devices to ensure consistency. However, charge packet volume cannot be directly measured in
the test devices and so it has to be inferred from CTE characterisation results. The change in CTE
performance between the two devices (CCD273 and CCD204) is related to the volume occupied
by charge packets and will indicate the general accuracy of the signal-volume models.
induced, allowing the observation of the charge packet size, location and density. Plotting the volume occupied by the charge packet against the signal size gives rise to functions which describe
the signal-volume relation. It is these functions which are used in the radiation damage models.
2.3
Signal-volume in Silvaco Models
Images of the charge packet in 2 dimensions can be taken from the 3D device models, as in figure 1a. The charge packets have a high density core, equivalent to the maximum doping density for
the buried channel. This reduces gradually at the edges of the charge packet until it becomes negligible. A 1D plot of charge density can be taken across the charge packet to measure its dimensions,
figure 1b, which allows an approximation of the charge packet volume.
It is necessary to take different charge density cut off values to define the edge of the charge
packet because of the gradually reducing edge density. These values effectively define the ‘trapping
volumes’, as charge trapping is dependent on the charge density in the vicinity of a trap [9]. Therefore, areas where the charge density of the signal is sufficient for capture can be approximated by
a function produced from the signal-volume model.
Each of the charge density cut off values used to define the edge of the charge packet are
shown in figure 1b, 1 electron µm−3 is equivalent to 1012 electrons cm−3 , 10 electrons µm−3 is
equivalent to 1013 electrons cm−3 and 100 electrons µm−3 is equivalent to 1014 electrons cm−3 .
For reference, ≈ 1010 electrons cm−3 is the carrier concentration of intrinsic silicon.
2.4
Benchmarking
The models need to be verified and benchmarked to ensure they offer a realistic representation of
the Euclid device. The aim of the models is to gain functions which describe the charge packet
volume over a range of signal levels for use in the radiation damage studies. However, the volume values obtained cannot be directly verified, since charge packet volumes cannot be directly
observed in the test devices.
–3–
2012 JINST 7 C01058
Figure 1. a) shows a 2D cross section of the charge packet in the Euclid pixel, b) is the 1D plot of electron
concentration across the charge packet shown in a), indicated by the dashed line.
Table 1. Comparison of model values against preliminary test results.
FWC (electrons)
Φch0 (Voltage)
Silvaco Model
CCD273 Pixel
180k - 240k
6.9
Experimental Results
CCD273 Pixel
212k
7.1
2.5
Signal-volume theory
Current trapping models make assumptions about charge packet volume to model the charge transfer in CCDs. The various models can be described by the interaction volume function given in an
ESA technical note written by A. Short [11], shown in equation (2.1) and graphically in figure 2.
VC
=
Vg
Ne
FWC
β
(2.1)
Where VC is the volume of the charge packet, Vg is the volume of the charge packet at full well
capacity, Ne is the signal size, FWC is the signal size at full well capacity and β is simply a fitting
parameter which describes how the charge packet changes with signal size.
One of three assumptions about the charge packet might be made [10]:
• A charge packet will always fill the volume available to it, only increasing its charge density
when charge is added (density driven model, β = 0).
• Charge density will remain constant and only the volume which the charge packet occupies
will increase as charge is added (volume driven model, β = 1).
• Alternatively, somewhere in between the two extremes, where both charge density and charge
packet volume change as charge is added (0 < β < 1).
This final assumption is currently thought to be the most physically realistic overall, but there
may be some deviation from the trend at small signal levels.
–4–
2012 JINST 7 C01058
Other measureable parameters such as channel potential (Φch0 ) and Full Well Capacity (FWC)
are taken to give a good indication of the model’s general accuracy. Verifying the signal-volume
model is more difficult but can be done through CTE characterisation, where a change in CTE
performance between the CCD273 and the CCD204 can be compared against the change in charge
packet volume in the models of the two devices. However, this only offers an indirect indication of the model accuracy and is dependent on several assumptions for trap interaction. Further
verification will come from the effectiveness of the radiation damage models to which this work
contributes [9].
The FWC is a soft parameter because its value can vary depending on the limits set, due to the
fringing fields and measurement method, so a value range is given. The experimental results are
obtained from the first batch of manufactured devices shown in table 1.
The values in the table show a rough agreement between the Silvaco models and the first test
devices. Benchmarking work is ongoing.
It is possible to observe and measure the charge packets in the Silvaco device simulations in
three dimensions, figure 1. These charge packets do not have a well defined edge, but gradually
reduce in charge density until the density becomes negligible. When measuring the charge packet
dimensions in the models it is necessary to take a cut off such that the charge packet can be measured and the volume calculated for each cut off density. In this way plots of volume against signal
size can be produced, figure 3. Measurements of charge packet volume are used to derive an empirical formula for use in the radiation damage models to describe the changing volume with signal.
The volume calculations are static measurements, but Shockley-Read-Hall theory shows that
the probability of capture is dependent on charge density in the vicinity of the trap, capture cross
section (this varies for different traps) and dwell time of the charge packet under each CCD phase.
The functions derived from the signal-volume plots can be related to the capture time constant, depending on the trap species and the charge density, to calculate capture probability in the radiation
damage models for different dwell times which relate to the CCD clocking schemes [9].
3
Signal-volume characterisation.
The signal-volume plot produced, as shown in figure 3, gives the image area pixel (left) and readout
register element (right) for the CCD273. It is worth noting that the theoretical plot in figure 2 is
normalised against FWC and FWC volume, but the FWC of the two structures in figure 3 are
different, hence the adjacent figures are plotted over a different range of signal sizes.
These signal-volume distributions are shown over a logarithmic scale but the plots follow a
curve similar to that shown in figure 1, when the fitting parameter (β ) lies between 0 and 1 (i.e.
both charge density and volume change as charge is added to the packet).
The trapping volume diverges at small signal levels across the different cut off densities because the electrons which make up the charge packet disperse across the volume available in the
–5–
2012 JINST 7 C01058
Figure 2. Plot of the signal-volume function [11], showing the density driven model (β = 0), volume driven
model (β = 1) and the more realistic assumption (0 < β < 1), normalised against FWC.
device, reducing the overall charge density and making the low density volumes bigger. At larger
signals, close to the FWC, the difference in trapping volumes across the cut off values becomes
much less pronounced, as the charge packet becomes more densely populated across the whole
available volume.
With very small signals (less than 100 electrons), the volume measurement for the cut off
density defined as 100 electrons µm−3 (1014 electrons cm−3 ) becomes less reliable due to the low
signal level. The same error can be seen on the 10 electrons µm−3 plot when the signal level drops
below 10 electrons. The values of the lower density cut off measurements are most reliable at these
low signal levels.
At small signal the gradient of the signal-volume plot appears to flatten, before the small
signal errors mentioned previously begin to appear. This changing gradient is not included in the
simple volume function of equation (2.1), but might be expected according to some signal-volume
models [10].
The generally linear trend of the plots in figure 3 at larger signals, gives rise to simple functions
which can describe the increasing charge packet volume in relation to the signal size; this enables
the charge trapping models to be as realistic as possible. However, the reducing gradient at small
signals, as evident for 1 electron µm−3 , diverges from that predicted in theory so an extra variable
is necessary in the signal-volume function.
4
Implications for charge transfer
The functions derived from the signal-volume plots are in the form:
Volume = γSβ + α
(4.1)
Where S is the signal size, β is the fitting parameter as already described, α describes the changing
gradient at small signal and γ is a scaling factor which depends on the cut off density [9].
Using the different cut off densities to define the edges of the charge packet allows the separation of trap time constants according to SRH theory [9] and enables trapping volumes to be defined,
where outside this volume the charge density is not high enough to trap electrons in the transfer
–6–
2012 JINST 7 C01058
Figure 3. The signal-volume plots for a) the pixel and b) the readout register structures of the CCD273 in
logarithmic scale.
period. Deriving the functions allows the charge trapping to be modelled as closely as possible to
the physical system.
5
Comparison of the CCD273 vs. CCD204
The CCD273 is redesigned from the older CCD204 to improve operation under irradiation, which
is achieved by reducing the width of the transfer channel in the serial readout register from 50 µm
to 20 µm.
It is assumed that this 2.5 times reduction in channel width will improve serial CTE under
irradiation by roughly the same factor, by reducing the volume in which the charge packets stored.
After simulating the charge packet volume in both device structures and extracting the fitting parameters it is possible to plot a comparison of the volume occupied by the same charge packet
across the two structures.
The difference in volume occupied in each device is shown in figure 4. The lower density
cut off values are plotted to offer a more realistic impression of the volume difference between
charge packets in the two devices as the high density area in the middle of the charge packet is not
representative of the overall charge packet size.
The plot shows that the difference in the charge packet volume at small signals (Ne < 1000)
is approximately 2.5 times larger in the CCD204, as expected. However as signal levels increase
the difference in volume occupied between the devices reduces to a factor of around 1.5 at high
signal levels. This will reduce the expected improvements of CTE at high signals and offers a
way in which the devices can be tested to confirm the suitability of the models, by measuring the
improvement in CTE between the devices over a signal range.
–7–
2012 JINST 7 C01058
Figure 4. Ratio of the volumes occupied by varying charge packet sizes in the CCD204 readout register
when compared to the CCD273 read out register.
6
Conclusion
Acknowledgments
With thanks to the staff at The Open University and at e2v Technologies who have helped and
contributed to this work.
References
[1] ESA, Euclid Science Requirements, DEM-SA-Dc-0001 1 0 Euclid SciRD 2008, (2008).
[2] S. Bowring, e2v technologies plc. CCD273 Design Report, EUCV-E2V-RP-002, (2010).
[3] J. Pickel et al., Radiation Effects on Photonic Imagers- A Historical Perspective, IEEE Trans. Nucl.
Sci. 50 (2003) 12.
[4] Silvaco Inc., ATLAS User’s Manual (2010).
[5] R. Laureijs, Euclid Science Requirements, DEM-SA-Dc-00001, (2008).
[6] S.B. Howell, Handbook of CCD Astronomy, Cambridge University Press (2006), pp. 94–95.
[7] J.R. Srour et. al, Review of Displacement Damage Effects in Silicon Devices, IEEE Trans. Nucl. Sci.
50 (2003) 653.
[8] A. Refregier et. al, Summary of DUNE Mission Concept, Proc. SPIE 7010 (2008) 701018.
[9] D.J. Hall, Euclid Monte Carlo Charge Transfer Model, Open Euclid TR 09.01, (2010).
[10] D.J. Hall, Comparison and Applicability to the Euclid Mission of the ESA CDM and the OU Monte
Carlo modelling of CCD Radiation Damage, OPEN EUCLID TR-20-V1, (2011).
[11] A. Short, A Charge Distortion Model for Euclid, EUCLID TN ESA AS 003 0, (2010).
–8–
2012 JINST 7 C01058
The aim of these device models is to produce simple functions to approximate the interaction (trapping) volumes of charge packets in the CCD273 pixel and register structures. These functions will
be used to help develop more realistic radiation damage models. The radiation damage models
reproduce the effects which radiation damage has on images, with the aim of eventually post processing captured images to remove the effects of radiation damage. This information can only be
approximated from device models as charge packets cannot be observed in test devices.
Device parameters such as FWC and the channel potential (Φch0 ) closely match those measured in the first production batch of the CCD273, verifying the general accuracy of the model and
giving confidence in the signal-volume models which cannot be directly confirmed. These generally follow the trend expected for increasing charge packet volume described by the interaction
volume function [9]. However, the signal-volume plots deviate from the expected trend at smaller
signals creating the need for an extra variable in the function.
At high signal levels (Ne > 1 × 10⁴ electrons), the difference in trapping volumes observed
between the CCD273 and the CCD204 is significantly lower than the expected 2.5 times factor.
This will limit the expected improvement in CTE in this signal range. However, at small signals
the volume difference between charge packets in the two devices is approximately 2.5 times larger
in the CCD204. This should allow the expected 2.5 times improvement in CTE performance in
this signal range, where it is needed to meet the Euclid mission objectives. These findings will be
verified during future CTE characterisation of the devices.


![the file [< 1 MB]](http://vs1.manualzilla.com/store/data/005663565_1-91d1e4bcdfd7b45b626a6b88ab809728-150x150.png)