1
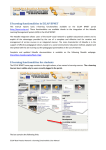
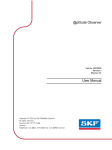
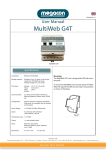
SKF @ptitude Analyst
Powerful software for enterprise-wide communications
SKF @ptitude Analyst is a core platform in a family of
reliability software applications that work together as
SKF @ptitude Monitoring Suite.
SKF @ptitude Analyst is a
comprehensive software solution with
powerful diagnostic and analytical
capabilities. @ptitude Analyst provides
fast, efficient and reliable storage,
analysis and retrieval of complex
machine information and makes the
information accessible throughout your
organization.
• One software program to manage
machinery condition data from
portable and on-line devices
• One installation with limitless
expansion capabilities
Enterprise
resource
planning
Computerized
Maintenance
Management
System
SKF @ptitude
decision support
On-line
surveillance/
protection
Periodic
vibration/
process data
SKF @ptitude
monitoring suite
• Easy to learn and use for novice or
experienced users
• Interconnectivity with other software
programs and systems
• Easy personalization for individual
users
When you select @ptitude Analyst, you
are immediately equipped to integrate
and analyze data from the full range of
SKF data collection devices. This enterprisewide software platform allows operations,
maintenance and reliability staff to view
the integrated data and communicates
the information to each department in a
customized format to meet individual user
needs. @ptitude Analyst can incorporate
data from other sources such as OPC
and OSIsoft® PI System™; and seamlessly
interface to your SAP®, Computerized
Maintenance Management System (CMMS),
SKF @ptitude
Analyst
SKF @ptitude
Observer
SKF @ptitude
Inspector
Enterprise Resource Planning (ERP) or other
information management systems.
@ptitude Analyst’s integrated platform
forms the hub to share information, foster
teamwork, and facilitate consistent and
reliable decision-making across functional
departments. The addition of @ptitude
Decision Support automates reliability
maintenance decision-making by identifying
probable faults with an asset or process, then
prescribing appropriate action.
SKF @ptitude Analyst – Powerful software for enterprise-wide communications
www.skf.com/cm
2
Diagnosis and analysis
Managing the condition of your assets is
easy with @ptitude Analyst
• Flexible setup gives you complete control
• Alarm viewing options let you quickly focus on priorities
• Built-in tools streamline data management
Machine data customized for your
unique needs
From the way you set up databases, routes and analysis
parameters, to the customized format for reporting, you
are in control of powerful analysis tools. You can collect
information based on location, machine type, frequency, or
other selections. @ptitude Analyst allows you to determine
the appropriate limits for alarm conditions and how alarms
are categorized to ensure you receive consistent, reliable
data in the format that suits you best.
Automated features simplify configuring
and fine-tuning alarms
Since similar machines often use the same alarms, the
Alarm Database provides user-defined alarms that can be
applied to create alarm settings for multiple measurement
points.
An Alarm Wizard assists in creating Statistical Alarms to set
alarms for your most important machinery with minimal
research and effort. @ptitude Analyst considers historical
data and natural variation in vibration levels of machinery
and generates a reliable set of alarm criterion tailored to the
specific machine.
@ptitude Analyst’s variable speed alarming features
accommodate normal fluctuations in machine speed and
function. Alarm limits are automatically reset as speed
changes, preventing false alarms.
Robust capabilities that are easy to use
SKF @ptitude Analyst makes analysis easier by combining
powerful data mining technology, analytical displays and
user-friendly graphics.
• Preference options let @ptitude Analyst work the way you
work
• Single views, trends and overlays expand your analysis
capabilities
• Easy to read plots provide detailed information
Detailed information - efficiently
organized
Screen displays such as data plot layout, color, size and
position can be personalized and automatically updated. A
customizable toolbar facilitates quick access to the program
features you use most frequently.
Right click on your data plot to modify settings and machine
information. When you scroll across a data plot, data values
are displayed in the plot window.
SKF @ptitude Analyst – Powerful software for enterprise-wide communications
www.skf.com/cm
3
Enhanced alarm view saves
valuable time
Alarm view
Alarm View window displays all points
that require immediate attention to help
you quickly identify and prioritize followup activities. The Alarm Details window
offers a comprehensive list of the specific
points in alarm and the level and type of
alarm, all in one convenient view.
Auto Linking makes it easy to view
individual alarms because the data plots
and alarm details change automatically
as you select specific points, saving time
and simplifying the analysis process.
Versatile viewing options
for multi-parameter
analysis
For fast and easy comparison of two or
more readings across multiple points,
@ptitude Analyst allows you to select
a measurement and drag and drop it
into the plot, providing convenience and
saving time.
The SKF @ptitude Analyst frequency
analysis feature helps to identify specific
bearing and gearbox frequency sets for
rapid detection and correction of bearing
and machine problems.
Trend, spectrum and other plots can be displayed for each machine in alarm for further
analysis.
Multi-pane plots
@ptitude Analyst’s on-line data view
automatically refreshes to display
the latest information, point status
and alarm details. Live views provide
immediate update of displayed data
while the Event Log documents specific
occurrences over time. The System
Information view provides one-stop
navigation between different views
such as Event Log, On-line Data view,
individual routes and workspaces.
@ptitude Analyst’s database
management tools allow you to closely
track machine problems to recreate
events for predictive maintenance and to
perform root cause failure analysis.
@ptitude Analyst allows you to view multiple data plots in a single window. View Trend/
Spectrum, Trend/Spectrum/Time, and more to make the most reliable and accurate decisions on
machinery.
SKF @ptitude Analyst – Powerful software for enterprise-wide communications
www.skf.com/cm
4
Access and security
Controlling access while effectively
communicating information
@ptitude Analyst permits access on a customized basis, yet
allows the effective exchange of detailed information across
functional departments.
• Definable security protects your valuable data
Advanced security system protects data
Four standard security levels are provided within @ptitude
Analyst and an unlimited number of custom user security
levels can be created. Each level represents access rights
that can be limited and controlled to prevent unauthorized
use of the system and limit the possibility of inadvertent
damage to your valuable program database.
• Easy and flexible reporting options
• Automated functions minimize human error
Personalized access rights allow the software administrator to protect against errors and enable traceability.
SKF @ptitude Analyst – Powerful software for enterprise-wide communications
www.skf.com/cm
5
Customized reports
Extensive report customization features let the user
control the specific kinds of machine information to be
communicated throughout the organization. You can
customize the templates or design an entirely new report
including data plots, supplemental information and digital
images.
Reports are generated in HTML format, giving you the
flexibility to view on-screen, print, attach to an e-mail or
post the report to your company intranet – automatically.
Other features allow you to maintain a history of reports,
pre-configure report content and format to share with
selected users.
Automatically schedule reports to save
time
The Scheduler Wizard enables a user to automatically
schedule a specific action, such as generating a report
upon completion of a data collection upload, archiving
measurement data at a specified time or other event-based
actions. This capability helps to eliminate human error and
allows the user to focus on other more pressing issues.
Using @ptitude Analyst throughout your organization allows
collaboration and communication without losing control of
your data.
Predefined report templates make it easy to generate common reports such as last measurement, exception, overdue/non-compliant, history, route
statistics, and others.
SKF @ptitude Analyst – Powerful software for enterprise-wide communications
www.skf.com/cm
6
SKF @ptitude Analyst features and capabilities
ALARMS
• Alarm window
– Quickly find and identify all points in alarm within
the hierarchy, group, route, workspace, or machine
• Alarm details
– Provides a summary of type of alarm and status
• User defined alarm levels
– Public alarms that can be shared with other users
– Private alarms that can only be used by specific
users
– Unlimited number of alarms can be configured
• Four overall alarm levels per measurement point
– Danger high, alert high, alert low, danger low
– Enhanced event log capabilities (Multilog)
– Out of window, in window, level alarms supported
• Alarm types
– Overall forecast
– Overall percent change
– Unlimited spectral band (overall and peak)
– Spectral envelope
– Phase angle
– Overall
– Inspection
– MARLIN condition detector
– Variable speed alarms
– Crash alarm (Multilog TMU only)
– BOV alarming
– Statistical alarm calculation
COMMUNICATION
• Automatic report generation based on a specified time,
data upload via scheduler wizard
• Data transfer with SKF MARLIN and Microlog (CMVA,
CMXA and GX series) systems, Multilog (DMx, TMU,
CMU, LMU, WMU)
• Download by Hierarchy, Route, or Workspace
• Microsoft ActiveSynch®
– Serial, USB, Ethernet and others
• OPC client interface available
DATA DISPLAY
• Orbit
– Syncronized cursoring
– Smax locator
– Flash blank
– Filtering
– Vector compensation
– Waveform compensation
– True sensor angle compensation
– Tacho offset compensation
• Shaft centerline
• Overall trend displays
• MARLIN condition detector
• Temperature
• Digital images
• Spectrum displays (waterfall, palogram)
• Single point, multiple point displays
• Phase displays (polar vector, magnitude/phase)
• Triaxial point
• Time waveform displays
– Single point, multiple points
• Multi-channel display
• Combination graphs
– Orbit/time
– Trend/spectrum
– Trend/spectrum/time waveform
– Trend/speed
– Trend/speed/spectrum
– Trend/speed/spectrum/time
– Trend/speed/time
– Waterfall/extracted trend/spectrum
– Waterfall/extracted band trend
– Trend/time waveform
– Spectrum/band trend
– Live views (Multilog)
– Live bars (Multilog)
• Graph overlays
• Spectrum
– Single, harmonic, sideband, peak, band cursors
– On screen defect frequency
– Running speed
– Spectral band alarm
– Spectral envelope alarm
– Overall alarms
• Display tools
– Display information area
– On-screen text annotation
– Percent of full scale setting
– Auto scaling
– Cursor micro-manipulation
– Autolinking of displays and active hierarchy
– Linear or log X or Y scaling
– Grid
– Orders, frequency scaling
– Amplitude threshold %
– Waterfall slant angle setting
– Date range setting
– User selectable color settings
– Waterfall spacing (time/date based or event)
– Spectrum data post processing (integration/
differentiation)
– Baseline spectrum storage
DATABASE
• Built on Oracle® database management system
• Microsoft SQL Server 2005 compatible
• ODBC, SQL, and TCP/IP protocol compliant database
opens the database content
• Fully networkable in a Local Area Network (LAN),
Wide Area Network (WAN), and Thin-client (Terminal)
environments
• Unlimited number of:
– hierarchies
– collection points
– measurements
• Database supports
– XML data importing and exporting
– Binary importing and exporting
• Point configuration management to quickly and easily
make system-wide changes
GENERAL
• Multiple languages available
• Windows®-based functionality
– True multi-processing operating environment
allowing simultaneous background and foreground
processing
– Complete right click functionality (drop down
menus)
– Drag and drop
– Cut/Copy/Paste
– Complete integration of third party applications
• User preferences allow customization
• Context sensitive help
• Complete user manual on installation CD-ROM
• Product Support Plans (PSP) available
MEASUREMENTS
The following measurements can be entered manually or
automatically
• Acceleration
• Amps
• Conditional points (MARLIN)
• Displacement
• English or metric units
• Enveloped acceleration
• Flow (GPM, LPM)
• High Frequency Detection (HFD) and Digital High
Frequency Detection (DHFD)
• Inspection points (user definable)
• Multi-channel
• Operating hours
• Operating time (elapsed and cumulative)
• Pressure (PSI and bars)
• RPM
• SEE (Spectral Emitted Energy)
• SKF acceleration enveloping (gE)
• Speed
• Temperature (°C and °F)
• Triax
• User-specific units
• Velocity
• Volts (AC or DC)
• Derived Point – user definable mathematical formula
to calculate a derived value from data collected on
multiple points.
REPORTS
• Preserved reports – enables you to maintain a history
of reports.
• Shared reports – allows you to share and preconfigure
reports for selected users.
• Send reports to screen, HTML file, printer
• HTML file can be posted to internet, intranet, e-mailed
• HTML files can be opened and modified further
using Microsoft® Office products, i.e. Word®, Excel®,
PowerPoint®
• Customizable report content
• Data plots, supplemental information, and digital
images can be included in reports
• Report types
– Last measurement
– Exception
– Overdue/non-compliant
– Pending overdue/non-compliant
– Collection status
– Route history
– Route statistics
– Set statistics
– Upload statistics
– History
– Inspection
– Work notification
– Blank (user defined)
– Compliance
• Report templates allow quick and easy report
configuration for use and reuse
SECURITY
• Fully configurable user rights that allow you to read,
view and have full access
• Unlimited access levels
• Allows assignment of access rights to user groups
• Hierarchy access – an enhanced security feature that
authorizes viewing and manipulation of hierarchies.
TEMPLATES AND WIZARDS
• Statistical alarm wizards use historical data to help
refine overall alarms
• Hierarchy template wizard allows for rapid hierarchy
creation and machine templates for reuse
• Report template allows for the custom configuration of
reports and report templates for reuse
• Scheduler wizard helps configure and preset recurring
activities such as report generation, data archival and
task reminders
SKF @ptitude Analyst – Powerful software for enterprise-wide communications
www.skf.com/cm
7
Hardware requirements
STAND ALONE CONFIGURATION
• Running SKF @ptitude Analyst
• Running Oracle® or Microsoft SQL
database management system
• Storing data
Operating system
Minimum Requirements
Recommended Requirements
Windows 2000 with Service Pack 3+ OR Windows XP Professional with Service Pack 2
Processor (* Note 1)
Pentium IV, 1.6 GHz
Pentium IV, 2.1 GHz Core 2 Duo or better
RAM
1.0 GB
2.0 GB or more
Disk space available for stand alone computer
(* Note 2)
1.2 GB
1.2 GB or more
CD/DVD drive
One (1) required
One (1) required
Video display
1024 x 768
Oracle®/Microsoft SQL
Network configuration –
SERVER
• Running Oracle® or Microsoft SQL
database management system
• Storing data
Operating system
1280 x 1024 or larger
Version 9i, 10g/SQL Server 2005
Network configuration for up to 35 Clients and one database.
Installations of 50 Clients or greater will require an on-site assessment by our
Field Service Engineers
Minimum Requirements
Recommended Requirements
Windows 2003 Server, Windows 2000 Server with Service Pack 3
Processor (* Note 1)
Pentium IV, 2.0 GHz
Pentium IV, 3.2 GHz Core 2 Duo
RAM
2.0 GB
4.0 GB or more
Quantity of hard drives (* Note 3)
3
5
Disk space available (* Note 3)
1.2 GB
Oracle®/Microsoft SQL
Network configuration –
NETWORK CLIENT
• Running SKF @ptitude Analyst
• Running database client software
1.2 GB or more
Version 9i, 10g/SQL Server 2005
Network configuration for up to 35 Clients and one database.
Installations of 50 Clients or greater will require an on-site assessment by our
Field Service Engineers
Minimum Requirements
Operating system
Recommended Requirements
Windows 2000 with Service Pack 3+ OR Windows XP Professional with Service Pack 2
Processor (* Note 1)
Pentium IV, 1.6 GHz
Pentium IV, 2.4 GHz Core 2 Duo
RAM
1.0 GB
2.0 GB or more
Disk space available for each network client
(* Note 2)
200 MB
500 MB or more
CD/DVD drive
One (1) required
One (1) required
Video display
1024 x 768
1280 x 1024 or larger
Oracle /Microsoft SQL
®
Version 9i, 10g/SQL Server 2005
NOTE 1: These requirements apply to SKF @ptitude Analyst complete with database management system. Other applications running simultaneously may degrade performance.
NOTE 2: These requirements ONLY apply to SKF @ptitude Analyst complete with database management system. Additional storage disk space is required for data.
NOTE 3: The major benefits of spreading Oracle across three or more hard disks at the server is the improved speed, and improved recoverability of a previously archived database.
The recommended five disk configuration provides the optimal protection for backup, recovery, indexing, and speed. Disk/file configuration should ONLY be handled by a SKF
Field Service Technician certified on SKF @ptitude Analyst. If using RAID, the combination of RAID 0 and RAID 1 is recommended over RAID 5.
NOTICE: If running other versions of Oracle, Microsoft SQL Server, or other database management system are expected to run in the same PC environment, please
contact your local SKF Representative to inquire about compatibility.
SKF @ptitude
Analyst –
Powerful
software for
enterprise-wide
communications
Ordering information
Product Support Plans (PSP)
• SKF @ptitude Analyst software for Microlog,
MARLIN, TMU, DMx, CMU, LMU, MIM and
WMU [CMSW 7400]
A range of Product Support Plans are
available to protect your investment. Contact
your local SKF Reliability Systems Sales
Representative for additional information.
• SKF @ptitude Analyst for Microlog Analyzer
[CMSW 7300]
The SKF @ptitude Analyst is available in
Single and Multi Client configurations.
Please contact your local SKF Reliability
Systems representative for Multi Client model
information.
SKF Reliability Systems
5271 Viewridge Court • San Diego, California 92123 USA
Telephone: +1 858-496-3400 • FAX: +1 858-496-3531
Web Site: www.skf.com/cm
The contents of this publication are the copyright of the publisher and may not be reproduced (even extracts) unless
permission is granted. Every care has been taken to ensure the accuracy of the information contained in this publication
but no liability can be accepted for any loss or damage whether direct, indirect or consequential arising out of the use of the
information contained herein. SKF reserves the right to alter any part of this publication without prior notice.
SKF Patents include: #US05854553, #US05845230, #US06489884, #US05679900, #US04768380, #US06199422,
#US05992237, #US06202491, #US06513386, #US06275781, #US06633822, #US06006164,
#US2003_0178515A1, #US6,789,025, #US6,789,360, US 5,633,811 and US 5,870,699, #WO_03_048714A1
•
•
•
•
•
SKF, @ptitude, MARLIN, Multilog and Microlog are registered trademarks of the SKF Group.
Oracle is a registered trademark of Oracle Corporation.
Microsoft, Windows, PowerPoint, Word and Excel are registered trademarks of Microsoft Corporation.
OSIsoft is a registered trademark and PI System is a trademark of OSIsoft, Inc.
All other trademarks are the property of their respective owners.
CM2362 (5-07) • Copyright © 2007 by SKF Condition Monitoring, Inc. ALL RIGHTS RESERVED.
Installation and training
Installation and training available through
your local SKF Supplier or Representative.