1
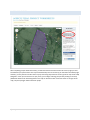
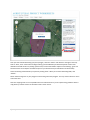
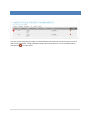
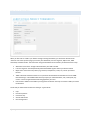
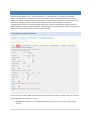
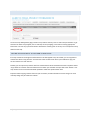
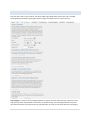
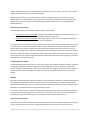
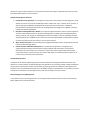
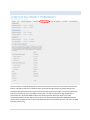
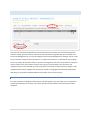
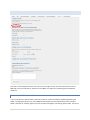
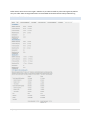
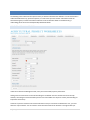
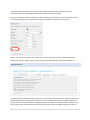
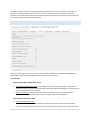
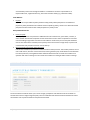
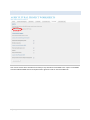
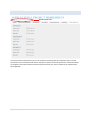
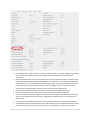
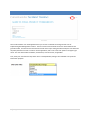
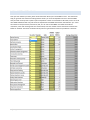
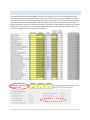
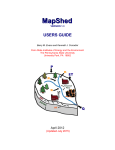
Chesapeake Bay Nutrient Trading Tool User Manual 6/4/2014 TABLE OF CONTENTS Logging In .......................................................................................................................................................................1 Adding a New Project ....................................................................................................................................................2 Project Details ...........................................................................................................................................................3 Mapping your farm ...................................................................................................................................................4 Managing Fields .............................................................................................................................................................6 Define your field type ................................................................................................................................................7 Crop, Permanent Pasture or Continuous Hay Fields .....................................................................................................9 Field and Soil Characteristics .....................................................................................................................................9 Current Crop Management .....................................................................................................................................11 Copying Rotation Data to or from Other Fields ......................................................................................................11 Entering Crop Details...............................................................................................................................................12 Current BMPs ..........................................................................................................................................................16 Current Nutrient Load .............................................................................................................................................19 NTT results summary ..........................................................................................................................................20 Troubleshooting an NTT Error ............................................................................................................................20 Future Crop Management .......................................................................................................................................21 Copying future crop rotation data from or to another field ...............................................................................21 Future BMPs ............................................................................................................................................................22 Enhanced Buffers and Wetlands .........................................................................................................................22 Future Nutrient Load ...............................................................................................................................................23 Animal Confinement ....................................................................................................................................................25 Confined Area Management ...................................................................................................................................25 Requirements ..........................................................................................................................................................26 Current BMPs ..........................................................................................................................................................27 Current Nutrient Load .............................................................................................................................................29 Future BMPs ............................................................................................................................................................30 Future Nutrient Load ...............................................................................................................................................31 Farm Summary ............................................................................................................................................................32 Navigating to the Farm Summary Page ...................................................................................................................32 Summary Page Details .............................................................................................................................................32 Baseline requirements .................................................................................................................................................35 Appendix A: Baseline Values and Model Adjustment Factors .....................................................................................38 Cost Tool ......................................................................................................................................................................40 Part 1. Cost to Meet Baseline ..................................................................................................................................41 Part 2. Cost to Generate Credits .............................................................................................................................42 Cost Results .............................................................................................................................................................43 LOGGING IN Go to the Chesapeake Bay Trading website at http://cbntt.org/ and “Log In” To log in, enter your user name and password in the appropriate fields. If you do not have a username and password, click on “Sign up” and complete the required information. We will send you a confirmation email soon after you create an account. 1|P a g e ADDING A NEW PROJECT Once you sign in, you will see your account dashboard. Here you will be able to add a new project or edit an existing project. Click on “Add new project” to create a new project. Or click on a saved project to modify or complete a saved project. The status bar beside each field allows you to view the progress made towards completing the field details. To make it easier to manage your projects you have the option of sorting projects by project name or date. Projects can be sorted in ascending or descending order. Click on the Project Name or Created On header to sort. For each of your saved projects you have options to: Copy your project. This action creates a duplicate of your saved project which you can modify as desired. Email issue. This action sends an email to customer support. You will be prompted to describe your issue. Customer support should contact you within follow-up information. 2|P a g e Delete project. This action will delete your project from your list of saved projects. PROJECT DETAILS When you create a new project, you will be directed to the project details page. Here you will be asked to enter basic information about your project. The “*” fields are required. The addresses provided should be the physical addresses of the parcel. In the “Farm notes” box, enter information such as details about the farm or the proposed project. The “Location description” box can be used to provide any further description of the location if needed. Please specify if your project site includes pastured animals or not by clicking on either “yes” of “no” under the Animals section of the form. If you select yes, you will be asked to specify the total animal units and type of animal. Once you are done, click on submit. 3|P a g e MAPPING YOUR FARM After completing project details information, you will be directed to the Edit Location tab. On this page you must first delineate your parcel of land. The map will automatically zoom to the county you selected on the Details page. However, you may choose to further zoom in by Zip code using drop down lists to the right of the map under “Map Navigation”. Once you are zoomed in to your parcel, you can begin outlining your parcel by clicking on the map. (Additional directions for delineating fields on the map can be found under “Farm Field Tools” to the right of the map.) The parcel polygon will be outlined in purple. 4|P a g e Once you have finished delineating your parcel polygon, select the “Fields” radio button to the right of the map. Click on “New”, enter a field name and begin drawing your field WITHIN your delineated parcel of land. Field delineations should contain any existing riparian and/or conservation buffers adjacent to the field (e.g. grass and forested areas that are adjacent and down slope from your field and thus provide filtration for field runoff). Continue outlining all fields within your parcel by clicking “New”. When you are done delineating fields, click “Submit”. Please avoid crossing lines on your polygons or intersecting with other polygons. This may result in failure to return critical soils data. Note: The mapping tools are not compatible with some older browsers. If you are experiencing problems with the map please try another browser or download a more recent version. 5|P a g e MANAGING FIELDS Once you are done delineating your fields, you will be directed to the Fields tab. This tab will contain a list of all fields you have delineated. To begin adding field details, click on the field name. You can also delete fields by clicking on the 6|P a g e icon under actions. DEFINE YOUR FIELD TYPE When you first click on a field in your field list to begin entering field details, you will first be directed to the “General” tab. At the top of this page you will see your Watershed, Land river segment, Major basin, TMDL watershed, and Field number. This information was generated based on the location you delineated on the map. Watershed: name of the 12-digit watershed where your field is located. Land river segment: the Chesapeake Bay Watershed Model segment where your field is located. Major basin: name of the major basin (e.g. Potomac, Susquehanna, James, etc.) where your field is located. TMDL watershed: Indicates whether or not your field is located within the boundaries of a local TMDL. Note that being in a local TMDL watershed may impact your trade boundaries, and, in Maryland, may result in a more stringent baseline load being applied to your farm. Field number: defaults to the field ID you assigned to the field on the map. You have the ability to rename the field here. On this tab you will be asked to select the field type. Types include: Crop Permanent pasture Continuous hay Animal confinement Non-managed land 7|P a g e If this field is classified as non-managed land, no load will be calculated. The only additional information you will be asked to provide is field area. For all other field types you will be asked to supply additional information so that we may estimate the nutrient and sediment loads. You are required to indicate whether or not your field is adjacent to a stream or waterbody. If “yes” then you will also be asked for the length of field that is adjacent to the waterbody. The Notes field allows you to provide additional notes about the field if necessary. Click “Save and Continue” when you have completed the required fields. 8|P a g e CROP, PERMANENT PASTURE OR CONTINUOUS HAY FIELDS Fields that are described as “crop,” “permanent pasture,” or “continuous hay,” are calculated using USDA’s Nutrient Tracking Tool (NTT). The Nutrient Tracking Tool requires soil data, and information about the way you manage your rotation. You will be asked to input this data and results will be retrieved “on the fly” from NTT. NTT estimates the nitrogen, phosphorus and sediment load for your farm given the weather, soil and crop management information that you have provided. After the NTT results are estimated the reductions from the additional BMPs not modelled by NTT are applied. The following sections describe the data needed to estimate the load on your crop, permanent pasture and/or continuous hay field. FIELD AND SOIL CHARACTERISTICS On the “Soil” tab you will be asked to provide some general characteristics about your field as well as to review up to 3 soil types that were returned by the map. Field Area: The map returns an estimated value for field acreage. You can select this acreage or enter your own. 9|P a g e Tillage Type: (crop only) Please select the tillage type which best describes your operation (high till or low till/no till). Tile drainage depth: if you have tile drainage, please indicate depth of drain. Leave blank if you do not have tile drainage on this field. Irrigation: Please select the type of irrigation you have in place on the field, or select “none” if you do not have irrigation. Irrigation efficiency: If you have irrigation in place, you will be prompted to tell us the irrigation efficiency. For your convenience we have provided typical values for the various irrigation types. N concentration (ppm): if you have irrigation in place and you use fertigation, please indicate the concentration of nitrogen in your irrigation water. This option is not available for ditch irrigation. If you do not use fertigation, please leave blank. Soil Test Laboratory: Soil test laboratories are based on your state-approved laboratories. Please select the laboratory that you use for soil testing. The default soil P extractant and units will appear. Soil P test value: Please indicate the soil P test value for your field using the units indicated. Soil information: The Soils tab displays up to three soils for your field that were returned by the map. These soils are returned from the Soils Survey database. We display the three most prominent soils for your field. Click “show details” to view soil details like sand/silt/clay content, organic matter, slope, etc. These fields can be edited if necessary. Note: If there were no soils data returned for your field you will be prompted to select the dominant soil texture for your field and slope for your field. Please Check Your Soils! In rare cases the soils returned by the Soils Survey database may have inaccurate data. It is always best to review your soils data and delete or revise soils data that does not make sense. NTT and the underlying APEX model are very sensitive to soils. Bad soil data can cause the model to fail. Click “show details” to view soil details. 10 | P a g e CURRENT CROP MANAGEMENT The Current Crop Management page provides a crop rotation summary. Click on “Add a Crop to Rotation” to get started. If the field is strip cropped, click on “Add strip for strip cropping” and continue entering appropriate information. For each strip you will be asked to describe the rotation grown in the strip. You must provide a strip width for each strip. COPYING ROTATION DATA TO OR FROM OTHER FIELDS If the crop rotation and management information for this field applies to any other fields, you can copy data to another field. Select “Copy data into” and then then select the field name where you would like to copy your current rotation into. Click “Submit.” Similarly you can import crop rotation data from another field for which these data have been completed. Select “Copy data from” and then select the field name from which you would like to import data. Click “Submit.” Your crop rotation for the current field should be updated to reflect the copied rotation data. Important: When copying rotations from one year to another, the date information will not change. You must manually change the year within the rotation. 11 | P a g e ENTERING CROP DETAILS Once you select “add a crop to rotation” you will be asked to give details about the way the crop is managed including planting, fertilization, grazing (for pasture), tillage, harvest/kill and cover crops (crop only). Crop Category: For Pasture, the crop category defaults to “pasture” and user selects the type of pasture from the crop type drop down. No plant dates are necessary. For Permanent Hay, the crop category defaults to Hay and user selects the type of hay crop from the crop type drop down. For Crop, the user must select the crop category 12 | P a g e and the crop type. Plant dates and plant methods are required for Crop and Continuous Hay. Seeding rate is optional. If the user does not provide a seeding rate, NTT will use a default seeding rate for the crop type selected. Note: If you irrigate your field and as a result have a higher seeding rate, it is important that you indicate your higher seeding rate so that the higher crop yield and nutrient uptake rates can be reflected. Commercial Fertilizer Applications: Indicate the rate and timing of commercial fertilizer applications. You may add multiple fertilizer applications. Please indicate whether fertilizer is incorporated. If yes, you must provide the date of incorporation and the depth of incorporation. Manure Fertilizer Applications: Indicate the rate and timing of manure fertilizer applications and biosolids applications. For each manure type we ask for the N and P (or P2O5) concentration. We provide typical values if these are not known. For Dairy manure, please indicate whether Dairy Precision Feeding is in place. Dairy precision feeding alters the ratios of organic and inorganic P and will result in a difference in load. For Poultry manure and Swine manure, please indicate if phytase treatment is in place. For Poultry manure, we also ask whether alum has been used to treat the manure. In both cases, the nutrient content of the manure should reflect the impacts of these treatments and the NTT results will not vary. We capture these for informational purposes only. If manure is incorporated, please indicate the date of incorporation and the depth of incorporation. If this is a pasture operation please note that any direct manure deposits from grazing animals is captured in the Grazing section. The Manure Fertilizer Application section should only be used if you spread additional manure on the pasture. 13 | P a g e Typical Manure Values: Grazing: If your field type is “permanent pasture” you will be asked to describe your grazing operations. Please indicate the type of animals, number of animal units, beginning and ending dates of grazing, and average hours grazed per day. You may add multiple grazing operations. Other Tillage Operations: Please indicate any additional tillage operations on your field (not including planting, fertilizer or harvest operations which are already described in other sections). For each additional tillage operation please supply a date. Harvest/End of Season Operations: Please indicate harvest operations and crop kill-down operations here. Options include: 14 | P a g e Harvest Only: This may be used for perennial crops that are harvest multiple times per year and/or over multiple years without being re-planted each year. You may continue to add as many harvest operations as needed. Harvest and terminate crop: For Annual crops like corn, you would likely select “harvest and terminate crop” to indicate that crop is killed down or terminated after the harvest operation. Terminate crop only: select this option if a crop is terminated or killed down without being harvested. If there are no harvest operations in place then NTT will not calculate a yield. Once either “harvest and terminate crop” or “terminate crop only” are selected, no other harvest operations may be added. For any crop type you can select “harvest as silage” and NTT will assume that crop is being harvested as silage with yield being displayed as tons. Non-Commodity Cover Crop: If a cover crop is planted after the current crop, please indicate this in the Cover Crop section. You will be asked to select the cover crop type, planting method and plant date. It is assumed that the cover crop is killed down prior to the planting of the next crop in your rotation. Important: If you do not select either “harvest and terminate crop” or “terminate crop” for the current crop, then the cover crop will be ignored. Commodity Cover Crop If you are planting a commercial cover crop, then you should add this crop as you would any other crop as you will need to describe any commercial or manure fertilizer applications for this crop. When you are finished click “save and continue” to return to the crop rotation dashboard. Click “add a crop to rotation” to add additional crops to the rotation, or click “Add strip for strip cropping” to add strip for strip cropping. If you are finished adding crops click on “save and continue.” You will be directed to the Current BMPs tab. 15 | P a g e CURRENT BMPS The Current BMPs page is where you will describe the existing best management practices on the field. Also, keep in mind that many BMPs are implied in your crop management scenario. For example, no-till, conservation-till, cover crops, and nutrient management will all be reflected in crop management and are thus not available as options on the Current BMPs tab. BMPs available on the Current BMPs tab are described in more detail below: Streambank Fencing: If your field type is Permanent Pasture and you indicated that your field is adjacent to a stream or waterbody, you will see this BMP option. Click “yes” if fencing or exclusion is in place. You must indicate the distance between the fence/exclusion area and the stream, and the type of vegetation between the fence and the stream. Reductions are calculated as the land use conversion for the area defined by the length of the field adjacent to the waterbody 16 | P a g e and the width of the fenced area. If the width of the fenced area is 35 feet or greater, your area is also credited with the upland area reductions associated with a buffer. If you indicate that fencing is not in place, then we calculate a degraded riparian area load for your field by calculating the area of the degraded corridor (equal to the length of the field adjacent to the waterbody and a width of 35 feet) and converting it to the Trampled Riparian Pasture (TRP) land use in the Chesapeake Bay Watershed Model. Riparian/Conservation Buffer: Under this BMP, please indicate whether you have a forest or grass buffer. Riparian/Conservation Forest Buffer: They are linear wooded areas with well-developed root systems, an organic surface layer, and understory vegetation adjacent to open water. Riparian/ Conservation Grass Buffer: Linear strips of grass or other non-woody vegetation maintained between the edge of fields and streams, rivers or tidal waters If you have a forest or grass buffer in place, you must provide information about the average width and the linear feet of the buffer. The recommended buffer width for riparian forest buffers is 100 feet, with 35 feet minimum width required. If the width of a buffer is less than 35 feet (Non-standard), credit will be given for a land use conversion; if the buffer is 35 to 100 feet, credit will be given for a forest/ grass riparian or conservation buffer; if the buffer if wider than 100 feet, no additional credit for upland acres will be given but there will be extra credit for a land use conversion. If the nitrogen load reduction calculated for alternative watering facility is greater than that for buffers, it will be used instead. Fertilizer Application Setback: The Chesapeake Bay states either require or recommend using a certain setback standard for fertilizer application. For example in Maryland, no fertilizer applications are permitted within 15 feet of waterways. This setback is reduced to 10 feet if a drop spreader, rotary spreader with deflector or targeted spray liquid is used to apply the fertilizer. Fertilizer setback is credited as a landuse conversion to “hay without nutrients” for the area of the setback. Wetland: Agricultural wetland restoration activities re-establish the natural hydraulic condition in a field that existed prior to the installation of subsurface or surface drainage. Project may include restoration, creation and enhancement acreage. Restored wetlands may be any wetland classification including forested, scrub-shrub or emergent marsh. Reductions are calculated as land use change and efficiency values. If you have a wetland in place or planned on field, please provide information about the area of the wetland and the upland area treated by wetland in acres. Reductions are calculated as the land use conversion for the area defined by the length of the field adjacent to the waterbody and the width of the fenced area. Other Land Use Conversions: Intensively used agricultural land can be converted into grass or forest cover. Upland tree plantings, for example, convert crop or pasture land into forest. Hedgerow plantings or grassed swales are examples of land use 17 | P a g e conversions to grass. Please indicate any non-riparian land conversion in place or planned on this field. You must enter information about the acres converted. Other Best Management Practices: 1. Decision/Precision Agriculture is a management system that is information and technology based, is site 2. 3. 4. specific and uses one or more of the following sources of data: soils, crops, nutrients, pests, moisture, or yield for optimum profitability, sustainability, and protection of the environment. In Maryland, precision/decision agriculture requires the use of GPS guidance technology (such as lightbar, autosteer, variable rate fertilizer application). Phosphorus Sorbing Materials in Ditches are in-channel engineered systems that can capture significant amounts of dissolved phosphorus in agricultural drainage water by passing them through phosphorussorbing materials, such as gypsum, drinking water treatment residuals, or acid mine drainage residuals. The proposed practice is applied on a per acre basis, and can be implemented and reported for cropland on both lo-till and hi-till uses that receive or do not receive manure. Water Control Structures involve installing and managing boarded gate systems in agricultural land that contains surface drainage ditches. Soil Conservation and Water Quality Plans are a combination of agronomic, management and engineered practices that protect and improve soil productivity and water quality, and to prevent deterioration of natural resources on all or part of a farm. Plans may be prepared by staff working in conservation districts, natural resource conservation field offices or a certified private consultant. In all cases the plan must meet technical standards. Streambank Restoration: A collection of site-specific engineering techniques used to stabilize an eroding streambank and channel. The objective is to prevent further streambank damage and cropland loss by correcting unstable eroding streambanks using a variety of techniques to improve water quality by reducing nutrients and sediment entering the stream. These are areas not associated with animal entry. This BMP is treated as a load reduction in the model, so nutrient and sediment contribution from the adjacent land is less than land adjacent to other streams Planned Changes to Crop Management If any aspects of your crop management are not yet implemented and were entered in order to meet baseline, please explain them in the box provided. 18 | P a g e CURRENT NUTRIENT LOAD The Current Nutrient Load tab will display the current load summary for your field. You will also see the baseline load for your field summarized. The baseline load is the estimated target load for your field according to the Chesapeake Bay Watershed Model using the Watershed Implementation Plan targets. The current and baseline loads are summarized in terms of the edge of stream (EOS). The EOS load reflects the edge of field load as estimated by NTT, adjusted for BMP reductions and model adjustment factor that adjusts and creates comparability between the NTT edge-of-field results and the Chesapeake Bay Watershed Model EOS baseline values]. Please see Appendix A for a list of model adjustment factors and baseline values by state, basin, and field type (crop, pasture, hay) 19 | P a g e NTT RESULTS SUMMARY Below the current load summary you will see the raw data returned from NTT. The results returned from the model do not include adjustments for BMP reductions (for those BMPs described on the “current BMPs” tab) or the application of the model adjustment factor. NTT provides a summary of the estimated N, P and sediment losses as well as an estimate of flow and yield for each of the crops in your rotation. The value for carbon is for comparison purposes only. The carbon estimate only includes activities described in the crop management section and does not include any carbon benefits from activities described in the “current BMPs” page. Thus carbon benefits from landuse conversion and buffer planting are not reflected in this value. TROUBLESHOOTING AN NTT ERROR In some cases you the Current Load tab may indicate that NTT could not retrieve results. Likely this is the result of input errors in the crop management tab, missing data, or bad soils data. If you get this error please check the following: 1) Make sure that the dates for your crop management make sense. For instance, make sure that harvest and/or kill operations are after planting operations. 2) Make sure that rotation years do not overlap, unless overlap is intentional. If you have copied certain crops from one year to another within your rotation you will need to manually change the year for all management operations for that crop to reflect the appropriate year. 3) Make sure all required information was completed on the “Soils” tab. If you did not click “Save and Continue” but rather clicked on the tabs to navigate through to crop rotation, you may have been able to proceed without entering required information. 4) Make sure the soils returned by the map have appropriate data. In some cases the soils returned by the map will have bad data. For instance, the sand/silt/clay percentages may not add up to 100%, or the bulk density and organic carbon numbers may be unreasonable. If this is the case you may either revise the soil data or delete the soil altogether. Once you delete the soil, you will be asked to provide information about your soil texture (sandy clay loam, silty clay loam, silt loam, sand, etc.) and the soil slope. Once the current load has been successfully calculated on your field you may choose to either enter data for remaining fields or to describe future load on your current field. To return to the list of fields for your farm click “fields” in the bread crumb links at top of page. To continue to the future crop management for your current field click “save and continue” at bottom of page. 20 | P a g e FUTURE CROP MANAGEMENT Once you have successfully completed the current load scenario for your field you can start describing future activities. Clicking “Save and Continue” from the Current Load Summary page will allow you to navigate to the Future Crop Management tab. You may also navigate to Current Crop Management by clicking on the tab. In this tab, you can either “Import current crop rotations” or “Add a crop to rotation” or “Add strip for strip cropping”. If your crop rotation for the future scenario is similar or unchanged from the current crop rotation it is fastest to use the “import current crop rotations” feature. Then copy your current rotations into your future crop management tab. You may then edit any of the crops within your rotation to reflect any future changes in crop management (for instance, adding a cover crop to your rotation or changing the rate of fertilizer applications). Alternately you may build a completely different crop rotation for your future scenario. COPYING FUTURE CROP ROTATION DATA FROM OR TO ANOTHER FIELD If the crop rotation and management information for this field applies to any other fields, you can copy data to another field. Similarly you can import crop rotation data from another field for which these data have been completed. 21 | P a g e FUTURE BMPS Once you are done adding information in the future crop management tab, you will be directed to the Future BMPs tab. Here you will be able to “Import all current BMPs” and add more if needed to generate additional reductions. ENHANCED BUFFERS AND WETLANDS If you currently have a riparian buffer or wetland, but wish to enhance this BMP by lengthening/widening the buffer or enlarging the wetland, your Future BMP tab should reflect the total estimated size of the enhanced buffer or wetland. For example, suppose you wish to widen and lengthen your existing riparian buffer. The current 22 | P a g e buffer width is 30 feet and current length is 1000 feet. If you widen the buffer by 5 feet and lengthen by 500 feet then your buffer width and length described in the Future BMP tab should be 35 feet wide by 1500 feet long. FUTURE NUTRIENT LOAD 23 | P a g e The Future Nutrient Load tab summarizes the expected load reductions for the field as a result of planned changes in crop management and/or BMPs. The baseline, current, future and reduced load are summarized in terms of edge of stream (EOS). The EOS load reflects the edge of field load as adjusted by an EOS factor that estimates the nutrient losses that occur as nutrients move over land and into the waterbody. The NTT summary now includes both the current and the future NTT model results. Please note that if you did not make any changes to the crop management between the current and future scenarios then the NTT results will be identical. Reductions from BMPs described on the current and future BMP tabs are applied ex-post to the NTT results. 24 | P a g e ANIMAL CONFINEMENT The following sections describe the inputs necessary to describe a field that was defined as “animal confinement.” Unlike fields defined as crop, permanent pasture, or continuous hay where nutrient and sediment loads are estimated using NTT, nutrient and sediment loads for animal confinement fields are calculated using a methodology which mimics the Chesapeake Bay Watershed Model. CONFINED AREA MANAGEMENT Under the Confined Area Management tab, enter your livestock and/or poultry information. Loafing Lot Area: Please enter the area of the loafing lot. The default acres are the field acres from the map. However, the loafing lot area should reflect just the area of the field that is subject to erosion (thus excluding all impervious surface area). Livestock: If you have livestock in the animal confinement area you must enter the details here. First, you must select the “Input method”. You can choose to enter total information for all livestock or average number per 25 | P a g e animal. For livestock operations, the average per type method asks for the type and quantity of animal, confinement details, average weight and the amount of excreted nitrogen and P2O5. If your input method is Totals per type, then you will be asked to give information on the type of animal, amount of manure produced per year, and pounds of nitrogen and phosphorus excreted per ton of manure. Poultry: If it is a poultry operation, select “Add Poultry” and enter the type of animal, number of birds/flock, number of flocks/year, number of days in growing cycle, and pounds of nitrogen and P2O5 excreted per ton. REQUIREMENTS In order to generate credits from animal confinement, the farm must meet the state-level requirements for animal confinement operations. In Maryland, landowners must have an implemented nutrient management plan and a soil and water conservation plan before being eligible to generate credits. For confined livestock, operations must have a properly sized and maintained manure storage and runoff system to be eligible to generate credits. For 26 | P a g e Pennsylvania, Virginia, Delaware and West Virginia the requirements have yet to be specified. If your field is in Maryland, check all three boxed if they are true to continue. If these boxes are not checked for your field in Maryland, it is assumed that the animal confinement area does not meet baseline requirements and thus farm will not be able to meet baseline (e.g. trading eligibility). CURRENT BMPS Under the Current BMPs tab, you can select your current BMPs. The BMPs are divided into livestock BMPs and Poultry BMPs. You will only see the BMPs that are applicable to your operation. Livestock BMPs Livestock Animal Waste Management system: 1. 2. Animal waste management system: Practices designed for proper handling, storage, and utilization of wastes generated from confined animal operations. Reduced storage and handling loss is conserved in the manure and available for land application. Mortality composting: A physical structure and process for disposing of any type of dead animals. Composted material land applied using nutrient management plan recommendations. Livestock Ammonia Reduction BMPs 1. Plastic permeable lagoon cover: Permeable plastic covers over liquid storage are composed of nonwoven fabric, thermally bonded, continuous polypropylene filaments. Covers create a physical barrier to prevent mass transfer of volatile 27 | P a g e 2. 3. chemical compounds from the liquid by covering manure storage facilities to decrease wind velocity (decrease surface area), and reduce radiation onto the manure storage surface (lower temperature). Phytase: Phytase is an enzyme added to poultry-feed that helps poultry absorb phosphorus. The addition of phytase to poultry feed allows more efficient nutrient uptake by poultry, which in turn allows decreased phosphorus levels in feed and less overall phosphorus in poultry waste. Dairy precision feeding: Dairy Precision Feeding reduces the quantity of phosphorus and nitrogen fed to livestock by formulating diets within 110% of Nutritional Research Council recommended level in order to minimize the excretion of nutrients without negatively affecting milk production. Livestock Runoff Reduction BMPs 1. Barnyard runoff control: Includes the installation of practices to control runoff from barnyard areas. This includes practices such as roof runoff control, diversion of clean water from entering the barnyard, runoff collection and infiltration from barnyards areas, and vegetated swales. Different efficiencies exist if controls are installed on an operation with manure storage or if the controls are installed on a loafing lot without manure storage. Note: If you are in Maryland you will also have the option of selecting “Constructed Wetland” and “Water Control Structure” under this category of BMPs. Poultry BMPs Poultry Waste Management system: 1. 2. Animal waste management system: Practices designed for proper handling, storage, and utilization of wastes generated from confined animal operations. Reduced storage and handling loss is conserved in the manure and available for land application. Mortality composting: A physical structure and process for disposing of any type of dead animals. Composted material land applied using nutrient management plan recommendations. Poultry Ammonia Reduction BMPs: 1. Poultry litter treatment: Surface application of alum, an acidifier, to poultry litter to acidify poultry litter and maintain ammonia in the non-volatile ionized form (ammonium). 2. Biofilters: Poultry housing ventilation systems that pass air through a biofilter media that incorporates a layer of organic material, typically a mixture of compost and wood chips or shreds that supports a microbial population and reduces ammonia emissions by oxidizing volatile organic compounds into carbon dioxide, water, and inorganic salts. The biofilter must have sufficient detention time and fans that can 28 | P a g e accommodate pressure loss through the biofilter. It should also have either a permeable or an impermeable cover, vegetative filter trip, and a litter treatment facility (e.g. aluminum sulfate). Feed Additives: 1. Phytase: Phytase is an enzyme added to poultry-feed that helps poultry absorb phosphorus. The addition of phytase to poultry feed allows more efficient nutrient uptake by poultry, which in turn allows decreased phosphorus levels in feed and less overall phosphorus in poultry waste Barnyard Runoff Controls: 1. 2. Heavy use pads: A heavy use protection area provides a stabilized surface of crushed stone, oyster shells, concrete, or other suitable material that will protect the soil surface from erosion. Heave use protection is used for manure handling in high traffic areas that are vulnerable to runoff. Heavy use concrete pads should be used in areas where litter is handled, such as poultry houses and manure storage sheds, to prevent soil contamination and provide a means for ease of clean up. Barnyard runoff control/clean water diversions: Includes the installation of practices to control runoff from barnyard areas. This includes practices such as roof runoff control, diversion of clean water from entering the barnyard, runoff collection and infiltration from barnyards areas, and vegetated swales. Different efficiencies exist if controls are installed on an operation with manure storage or if the controls are installed on a loafing lot without manure storage. CURRENT NUTRIENT LOAD The Current Nutrient Load tab shows your current nitrogen, phosphorus and sediment loads. These loads are summarized in terms of edge of segment (EOS). There is no baseline load shown because the baseline for animal confinement areas is practice-based and not performance-based. 29 | P a g e FUTURE BMPS Once current load has been calculated for the field you may describe the future BMPs. Click “Import current BMPs” and select additional BMPs that can be implemented to generate credits on the Future BMPs tab. 30 | P a g e FUTURE NUTRIENT LOAD Breadcrumb links The Future Nutrient Load tab shows your current and future loads along with your reductions data. For animal confinement there is no baseline load value for comparison. Baseline for animal confinement is determined based on compliance with animal confinement baseline requirements for your state as outlined in the “Requirements” tab, if applicable. 31 | P a g e FARM SUMMARY The farm summary page is a summary of all the farm and field information that has been entered by the user. This page will show the total farm load and indicate whether the farm has met baseline requirements and can generate credits. NAVIGATING TO THE FARM SUMMARY PAGE If you are currently in the field-level tab navigation, you can navigate to the farm level “Summary” page by clicking on your farm/project name in the breadcrumb links at top of each page. SUMMARY PAGE DETAILS The farm summary gives a summary includes farm details including: Details: This section displays the farm/project level details entered in the details page. In addition, it displays the (8-digit) watershed name, watershed segment ID, and local TMDL information if applicable. Totals: This section summarizes various attributes of your operation including: Farm Area (from map): the total number of acres outlined by your parcel polygon Farm Area (sum of fields): the sum of acres from all fields Animal Headquarters: number of fields defined as “animal confinement” Nonmanaged Land: number of fields defined as “nonmanaged land” Number of Fields: number of fields defined as crop, permanent pasture, or continuous hay Percent complete: The percentage of farm that has been completed using the tool. If all fields are 100% complete (meaning that current and future scenarios have been completed), then farm will be 100% complete. Buffered Area: number of acres converted forest or grass buffers current scenario Wetland Area: number of acres converted to wetland in current scenario. Streambank Fencing Area: number of acres in streambank fencing for current scenario. This area is defined by the length of the fence multiplied by the distance between the fence and the streambank. Converted Area: the sum of all acres converted to nonproductive uses in the current scenario. This is the sum of buffered acres, wetland acres, streambank acres, and other landuse conversion acres. Load Summary Data: The summary page displays the farm-level summary for nitrogen, phosphorus and sediment loads. For each parameter the summary page displays the following: 32 | P a g e Farm Meets Baseline: Indicates whether your farm meets the baseline (or trading eligibility) requirements for the respective parameter. Please see the Baseline section for information on how baseline is determined. Baseline load fields (EOS): this is the total baseline load for all crop/pasture/hay fields. The baseline value is defined by the Chesapeake Bay Watershed Model for each state-basin and is based on the Watershed Implementation Plan. To meet baseline in Maryland, West Virginia, Pennsylvania and Delaware this value must be less than or equal to the current load in order to be eligible to trade. In Virginia this value is informational as trading eligibility is based on a series of practice-based requirements. Current Load Fields (EOS): This value is the total current load for all crop/pasture/hay fields. Future Load Fields (EOS): This value is the total future load for all crop/pasture/hay fields. Current Load Animal Headquarters (EOS): This value is the current load for all animal confinement fields. This value is distinguished from the load from crop/pasture/hay fields because it is not compared to a baseline value. Future Load Animal Headquarters (EOS): This value is the future load for all animal confinement fields. Total Reductions (EOS): This value represents the total reductions the farm is expected to achieve through the future scenario as compared to the current scenario. Total reductions is equal to the sum of the 33 | P a g e current load for fields and the current load for animal confinement less the sum of the future load for fields and the future load for animal confinement. Eligible reductions: Eligible reductions are the total reductions from your farm that are eligible to generate credits. If your farm does not meet baseline for the given parameter, the value will be 0. If your farm does meet baseline for that parameter then the value should be equal to the total reductions. Credits: Credits is equal to the total eligible reductions attenuated to the Chesapeake Bay using the Chesapeake Bay Watershed Model delivery factors. Exceptions may occur in cases where a project is in a local TMDL. In Maryland, projects in local TMDL watersheds generate credits based on local EOS values and are not attenuated to the Chesapeake Bay. 34 | P a g e BASELINE REQUIREMENTS In order to determine whether or not you meet baseline requirements, you will have to evaluate all fields in your farm. Your farm must meet the baseline load requirement in aggregate in order to qualify to generate credits. You may see an alert at the top of this page informing you that your field has failed an important baseline determination test. If any of your fields fail one of these “tests” then your farm will not meet baseline and you will not be eligible to generate credits. The section below describes the baseline requirements for each state. Maryland baseline requirements: If your project is in Maryland then you must meet a series of regulatory baseline requirements based on the current Nutrient Management Regulations. For crop, pasture and hay fields these include: 1. 2. 3. 4. 5. If your field is next to a stream and you apply commercial or manure fertilizer then you must have either a buffer or a fertilizer setback. If you apply manure fertilizer it must be incorporated. (Note, because there are circumstances where manure is not incorporated, failure of this “test” does not automatically exclude you from meeting baseline). If you have a pasture that is next to a stream it must have fencing/exclusion. You must have a soil management plan. You must have a nutrient management plan. (Note, nutrient management should be reflected in your nutrient application rate and timing. There are no explicit checks to ensure that this is in place, but will be required for site validation if a user wishes to generate credits). For Animal Confinement Areas, the following three practices must be met: 1. 2. 3. Landowners must have an implemented nutrient management plan A soil and water conservation plan For confined livestock, operations must have a properly sized and maintained manure storage and runoff system to be eligible to generate credits. In addition to these regulatory baseline requirements (which must be met on each field as applicable), the sum of the current load for crop pasture and hay fields must be less than or equal to the sum of the baseline load for all acres for the respective parameter (nitrogen, phosphorus, sediment). A farm may meet the numeric trading baseline for one or more parameters. Virginia Baseline Requirements: Virginia revised trading regulations are currently under review. The requirements detailed below are considered draft. To meet the trading baseline for crop, pasture and hay land, the owner must: Hold a valid Resource Management Plan (RMP) ; or Have the following in place: o 35 | P a g e Soil conservation. Soil conservation practices for the management area shall be implemented and maintained to achieve a maximum soil loss rate not to exceed "T" and to address gross erosion when it is present as gullies or other severely eroding conditions. o o o o Nutrient management. Implementation and maintenance of the nutrient management practices required by the nutrient management plan which has been written by a certified nutrient management planner pursuant to the Nutrient Management Training and Certification Regulations, 4VAC5-15. Riparian buffer. A woodland or grass riparian buffer shall be installed and maintained around all water bodies with perennial flow within or bordering the management area. The riparian buffer shall be a minimum width of 35 feet. Cover crop. For croplands, cover crops shall be planted to meet the standard planting date and other specifications in accordance with DCR Specifications for NO. SL-8B contained in the VACS BMP Manual. This requirement applies to all croplands where summer annual crops are grown and the summer annual crop received greater than a total of 50 pounds per acre of nitrogen application from any nutrient source; however, if the cropland is planted to winter cereal crops for harvest in the spring, then cover crops do not need to be planted on these croplands during that production year. Livestock water body exclusion. For pastures or when livestock are present within the management area, livestock exclusion fencing shall be placed around perennial streams, rivers, lakes, ponds or other water body having perennial flow. This exclusionary fencing shall be constructed in accordance with DCR Specifications for NO. WP-2 contained in the VACS BMP Manual in order to restrict livestock access to the water body and livestock. Livestock shall be provided with an alternative watering source. The livestock exclusion fencing shall be placed at least 35 feet from the edge of the water body having perennial flow and this exclusion zone shall contain a riparian buffer. For animal feeding operations, the owner must: Have a valid VPDES or VPA permit in compliance with regulations; or For those operations not requiring a VPDES or VPA permit, the following practices are required to meet baseline: o Implementation and maintenance of the nutrient management practices required by the nutrient management plan which has been written by a certified nutrient management planner pursuant to the Nutrient Management Training and Certification Regulations, 4VAC5-15. o For animal feeding operations, excluding poultry operations, a storage facility designed and operated to prevent point source discharges of pollutants to state waters except in the case of a storm event greater than a 25-year/24-hour storm and to provide adequate waste storage capacity to accommodate periods when the ground is frozen or saturated, periods when land application of nutrients should not occur due to limited or nonexistent crop nutrient uptake, and periods when physical limitations prohibit the land application of waste shall be implemented and maintained. o For confined poultry operations, storage of poultry waste according to the nutrient management plan and in a manner that prevents contact with surface water and groundwater. Poultry waste that is stockpiled outside of the growing house for more than 14 days shall be kept in a facility or at a location that provides adequate storage. Adequate storage management practices shall meet the following minimum requirements: 1. The poultry waste shall be covered to protect it from precipitation and wind. 2. Stormwater shall not run onto or under the area where the poultry waste is stored. The ground surface of the poultry waste storage area shall have a minimum of two feet separation distance to the seasonal high water table. If poultry waste is stored in an area where the seasonal high groundwater table lies within two feet of the ground surface, the storage area shall be underlain by a low-permeability, hard-surfaced barrier such as concrete or asphalt. 3. For poultry waste that is not stored inside or under a roofed structure, the storage site must be at least 100 feet from any surface water, intermittent drainage, wells, sinkholes, rock outcrops, and springs. 36 | P a g e Pennsylvania Baseline Requirements: Pennsylvania trading baseline requirements are currently under review. As a placeholder we assume that the sum of the current load for all crop/pasture/hay fields must be less than or equal to the sum of the baseline loads for all crop/pasture/hay fields. Delaware Baseline Requirements: Delaware does not currently have a nonpoint source trading program which includes the agricultural sector. As a placeholder we assume that the sum of the current load for all crop/pasture/hay fields must be less than or equal to the sum of the baseline loads for all crop/pasture/hay fields. West Virginia Baseline Requirements: West Virginia currently has an ad-hoc water quality trading program where baseline requirements have yet to be clarified. As a placeholder we assume that the sum of the current load for all crop/pasture/hay fields must be less than or equal to the sum of the baseline loads for all crop/pasture/hay fields. New York Baseline Requirements: New York does not currently have a water quality trading program. 37 | P a g e APPENDIX A: BASELINE VALUES AND MODEL ADJUSTMENT FACTORS Table 1. Shows the baseline values for nitrogen, phosphorus and sediment as derived from the Chesapeake Bay Watershed model. Values vary by state, major basin, and field type (crop, pasture, hay). ST Basin Crop N (lbs) P (lbs) DE Eastern Shore 14.2 1 MD Potomac 24.8 MD Patuxent MD Eastern Shore MD Continuous Hay N (lbs) P (lbs) S (lbs) N (lbs) P (lbs) S (lbs) 58.3 2.4 0.2 31.5 5 0.5 7.3 1.70 1644.8 24.8 1.70 707.7 24.8 1.70 454.8 10.2 1.30 1043.4 10.2 1.30 460.6 10.2 1.30 251.1 11.0 0.90 185.7 11.0 0.90 91.7 11 0.90 34.3 Western Shore 15.8 1.00 844.7 15.8 1.00 466.6 15.80 1.00 188.4 MD Susquehanna 17.5 0.90 1475.5 17.5 0.90 675.4 17.5 0.90 150.1 NY Susquehanna 33.5 2.20 638.4 4.1 0.66 170.2 4.9 0.51 65.7 PA Potomac 51.7 2.28 1462.5 9.7 1.55 540.4 18.8 1.50 223.0 PA Eastern Shore 21.3 0.73 1457.7 5.1 0.30 601.7 5.6 0.41 85.8 PA Western Shore 23.2 1.30 1625.8 4.6 0.52 709.8 9.5 0.64 59.6 PA Susquehanna 45.1 1.45 1413.6 7.5 0.71 477.4 13.8 0.81 227.0 VA Potomac 49.5 3.52 1188.6 15.5 2.00 670.6 18 0.97 602.1 VA James 13.6 1.93 511.4 6.1 2.86 378.4 5.5 0.89 1193.3 VA Eastern Shore 11.8 0.27 89.1 1.2 0.23 52.2 2 0.23 56.1 VA Rappahannock 17.9 1.90 465.5 11.9 1.80 439.3 11.2 1.01 326.7 VA York 13.0 1.41 344.3 5.6 1.39 297.7 5.4 0.52 244.6 WV Potomac 57.7 3.05 460.2 13.4 1.29 175.7 16.6 1.37 844.1 WV James 41.2 4.12 3041.1 6.3 1.01 795.9 5.1 1.11 3668.2 38 | P a g e S (lbs) Permanent Pasture Table 2. Shows the model adjustment factors derived through a calibration process between NTT/APEX and the CBWM. These factors are applied to the NTT value for each field in order to adjust between the NTT/APEX edge of field value and the CBWM Edge of Stream value. The adjustment factors compensates for differences in models as well as scales. ST Basin Crop Continuous Hay Permanent Pasture N P S N P S N P S DE Eastern Shore 0.87 1.41 0.05 1.50 1.33 0.43 0.67 0.80 1.00 MD Potomac 1.35 1.09 0.24 1.93 2.14 0.78 1.11 2.23 1.00 MD Patuxent 0.50 0.61 0.17 1.13 1.51 0.86 0.43 0.90 1.00 MD Eastern Shore 0.66 0.87 0.06 1.07 1.02 0.93 0.73 1.17 1.00 MD Western Shore 0.61 0.40 0.10 1.13 0.83 0.45 0.46 0.69 1.00 MD Susquehanna 0.85 0.43 0.18 1.45 1.05 0.83 0.69 0.73 1.00 NY Susquehanna 0.81 0.76 0.38 0.40 0.77 0.09 0.50 1.46 1.00 PA Potomac 1.84 1.26 0.21 1.29 1.96 0.38 2.24 3.07 1.00 PA Eastern Shore 0.72 0.29 0.21 0.72 0.64 0.46 0.27 0.33 1.00 PA Western Shore 0.82 0.56 0.24 0.72 0.96 0.43 0.71 1.12 1.00 PA Susquehanna 1.48 0.68 0.24 0.88 0.88 0.22 2.08 1.88 1.00 VA Potomac 1.68 2.05 0.26 2.27 3.55 0.96 1.93 1.81 1.00 VA James 0.55 1.04 0.08 1.01 2.42 0.63 0.51 1.35 1.00 VA Eastern Shore 0.88 2.65 0.11 1.44 3.46 1.86 1.11 1.08 1.00 VA Rappahannock 0.84 1.21 0.09 2.74 3.51 1.87 1.20 1.85 1.00 VA York 0.68 1.02 0.08 1.61 2.08 1.84 0.72 1.24 1.00 WV Potomac 1.64 1.52 0.07 1.37 1.53 0.10 1.24 1.32 1.00 WV James 1.11 1.86 0.38 0.65 2.83 0.44 0.50 1.46 1.00 39 | P a g e COST TOOL Farm Profit Calculator is an Excel application that you can use to calculate the average annual costs of implementing Best Management Practices. The tool can be used to estimate the cost to meet baseline and to generate credits, in which case the tool will also estimate the cost per credit generated to help the user determine the profit potential of a trade. In order to use this application, click on the “Cost Tool” option in the upper right corner. The cost data includes installation, maintenance, and rental costs, as applicable. First, select your state from the drop down menu. A Chesapeake Bay average is also available as an option for information purposes. 40 | P a g e PART 1. COST TO MEET BASELINE Once you have selected your state, please enter information about your current BMPs in Part 1. This section will help you generate costs related to meeting baseline. Select ‘yes’ from the dropdown list next to all of the BMPs that you either currently have in place or plan to implement in order to meet baseline. Otherwise, select ‘no’ for all other BMPs. Additional data entry cells must be completed for each BMP that has been selected with “yes.” Enter the number of acres/structures/animal units/ feet, etc. for each of these BMPs. For buffers and wetland restoration, rather than entering total acres to be treated, enter the number of acres that will be converted into buffers or wetlands. Then enter the lifetime of the practice. Typical lifetime values are provided as a reference. 41 | P a g e PART 2. COST TO GENERATE CREDITS Enter information about your planned BMPs in this section by selecting ‘yes’ or ‘no’ from the dropdown list and entering the number of units and lifetime of the practice as you did Part 1. Don’t repeat any BMP that are listed in Part 1. Again, for buffers and wetland restoration, rather than entering total acres to be treated, enter the number of acres that will be converted into buffers or wetlands. Typical lifetime values are provided to use as a reference. After completing this section, enter the number of nitrogen, phosphorus, and/or sediment credits that the nutrient trading tool has estimated your farm will produce based on the future scenario. You can find this information on the nutrient trading tool’s summary page, as shown below. 42 | P a g e COST RESULTS After you complete part 1 and 2, the results section will generate the average annual costs and costs on a per credit basis. The cost data includes installation, maintenance, and rental costs, as applicable. Cost-share assistance that might have been used to implement BMPs to meet baseline is not reflected in this cost information. The average cost per credit generated uses the total average annual cost to install the practice which may reduce nitrogen, phosphorus, and/or sediment. 43 | P a g e