1
dot User’s Manual, December 22, 2009
23
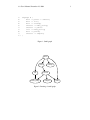
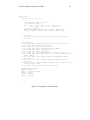
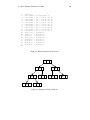
digraph G {
subgraph cluster0 {
node [style=filled,color=white];
style=filled;
process #1
color=lightgrey;
a0 -> a1 -> a2 -> a3;
a0
label = "process #1";
}
subgraph cluster1 {
node [style=filled];
b0 -> b1 -> b2 -> b3;
label = "process #2";
color=blue
}
start -> a0;
start -> b0;
a1 -> b3;
b2 -> a3;
a3 -> a0;
a3 -> end;
b3 -> end;
start
process #2
b0
a1
b1
a2
b2
a3
b3
end
start [shape=Mdiamond];
end [shape=Msquare];
}
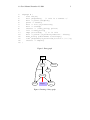
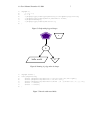
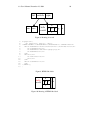
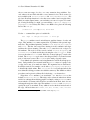
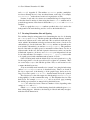
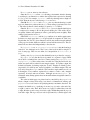
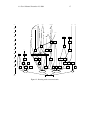
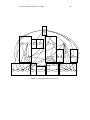
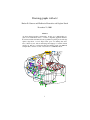
Figure 19: Process diagram with clusters