1
DL850/DL850V
ScopeCorder
Features Guide
IM DL850-01EN
2nd Edition
Thank you for purchasing the DL850 ScopeCorder or DL850V ScopeCorder Vehicle Edition
(hereinafter, “DL850/DL850V” will refer to both of these products). This manual contains useful
information about the features of the DL850/DL850V. To ensure correct use, please read this
manual thoroughly before beginning operation.
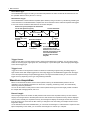
Keep this manual in a safe place for quick reference in the event a question arises. The following
four manuals, including this one, are provided as manuals for the DL850/DL850V. Read them along
with this manual.
Manual Title
DL850/DL850V ScopeCorder
Features Guide
Manual No.
IM DL850-01EN
DL850/DL850V ScopeCorder
User’s Manual
IM DL850-02EN
DL850/DL850V ScopeCorder
Getting Started Guide
IM DL850-03EN
DL850/DL850V ScopeCorder
Communication Interface
User’s Manual
IM DL850-17EN
Description
This manual. The supplied CD contains the PDF file
of this manual. This manual explains all the DL850/
DL850V features other than the communication
interface features.
The supplied CD contains the PDF file of this manual.
The manual explains how to operate the DL850/
DL850V.
The manual explains the handling precautions and
basic operations of the DL850/DL850V and provides
an overview of its features.
The supplied CD contains the PDF file of this
manual.The manual explains the DL850/DL850V
communication interface features and instructions on
how to use them.
Notes
• The contents of this manual are subject to change without prior notice as a result of continuing
improvements to the instrument’s performance and functions. The figures given in this manual
may differ from the actual screen.
• Every effort has been made in the preparation of this manual to ensure the accuracy of its
contents. However, should you have any questions or find any errors, please contact your
nearest YOKOGAWA dealer.
• Copying or reproducing all or any part of the contents of this manual without the permission of
Yokogawa Meters & Instruments Corporation is strictly prohibited.
• The TCP/IP software of this product and the documents concerning it have been developed/
created by YOKOGAWA based on the BSD Networking Software, Release 1 that has been
licensed from the Regents of the University of California.
Trademarks
• Microsoft, Internet Explorer, MS-DOS, Windows, Windows NT, and Windows XP are either
registered trademarks or trademarks of Microsoft Corporation in the United States and/or other
countries.
• Adobe, Acrobat, and PostScript are trademarks of Adobe Systems Incorporated.
• GIGAZoom ENGINE is a registered trademark of YOKOGAWA Electric Corporation.
• In this manual, the TM and ® symbols do not accompany their respective trademark or registered
trademark names.
• Other company and product names are trademarks or registered trademarks of their respective
companies.
Revisions
• 1st Edition: June 2010
• 2nd Edition: September 2010
2nd Edition: September 2010(YK)
All Rights Reserved, Copyright © 2010 Yokogawa Meters & Instruments Corporation
IM DL850-01EN
i
Contents
ii
1
Main Features
2
Vertical Axis
3
Horizontal Axis
4
Triggering
Vertical Axis................................................................................................................................... 1-1
Horizontal Axis (Time Axis) ........................................................................................................... 1-2
Trigger ......................................................................................................................................... 1-3
Waveform Acquisition ................................................................................................................... 1-4
Waveform Display ......................................................................................................................... 1-6
Waveform Computation and Analysis ........................................................................................... 1-6
Notes about Using the 16-CH Voltage Input Module .................................................................... 1-8
Input Settings ................................................................................................................................ 2-1
Voltage Measurement ................................................................................................................... 2-2
Vertical Scale (SCALE knob) ........................................................................................................ 2-3
Waveform Vertical Position (Vertical POSITION knob) ................................................................. 2-5
Input Coupling (Coupling) ............................................................................................................. 2-6
Probe Attenuation and Current-to-Voltage Conversion Ratio (Probe) .......................................... 2-7
Bandwidth (Bandwidth) ................................................................................................................. 2-8
Zoom Method (V Scale) ................................................................................................................ 2-9
Offset (Offset) ..............................................................................................................................2-11
Inverted Waveform Display (Invert) ............................................................................................ 2-12
Linear Scaling (Linear Scale) ...................................................................................................... 2-13
RMS Measurement ..................................................................................................................... 2-15
Voltage Measurement (For the 16-CH Voltage Input Module) .................................................... 2-16
Temperature Measurement ......................................................................................................... 2-19
Strain Measurement.................................................................................................................... 2-21
About Shunt Calibration (Only on the 701271(STRAIN_DSUB))................................................ 2-24
Acceleration Measurement ......................................................................................................... 2-26
Frequency Measurement ............................................................................................................ 2-28
FV Setting (F/V Setup) - frequency measurement ...................................................................... 2-28
Input Setup (Input Setup) - frequency measurement .................................................................. 2-33
Logic Measurement .................................................................................................................... 2-36
CAN Bus Signal Monitoring (Applies to the DL850V) ................................................................. 2-38
Displaying the Menu for Configuring All Channels (ALL CH) ...................................................... 2-43
Time Axis Setting (TIME/DIV) ....................................................................................................... 3-1
Trigger Mode (MODE) .................................................................................................................. 4-1
Trigger Types (Type) ..................................................................................................................... 4-2
Signal Type and Trigger Type Combinations ................................................................................ 4-2
Basic Trigger Settings ................................................................................................................... 4-2
Simple Trigger (Simple) ................................................................................................................ 4-3
Trigger Source (Source) ............................................................................................................... 4-3
Trigger Level (Level) ..................................................................................................................... 4-4
Trigger Slope (Slope) .................................................................................................................... 4-4
Trigger Hysteresis (Hysteresis) ..................................................................................................... 4-5
Trigger Hold-Off (Hold Off) ............................................................................................................ 4-5
Trigger Position (Position) ............................................................................................................. 4-6
IM DL850-01EN
Contents
Trigger Delay (Delay) .................................................................................................................... 4-7
A -> B(N) Trigger (Enhanced) ....................................................................................................... 4-8
A Delay B Trigger (Enhanced) ...................................................................................................... 4-9
Edge On A Trigger (Enhanced) ................................................................................................... 4-10
OR Trigger (Enhanced) ................................................................................................................4-11
AND Trigger (Enhanced)............................................................................................................. 4-12
Period Trigger (Enhanced) .......................................................................................................... 4-13
Pulse Width Trigger (Enhanced) ................................................................................................. 4-14
Wave Window Trigger (Enhanced) ............................................................................................. 4-15
5
Waveform Acquisition
6
Display
7
Displaying X-Y Waveforms
8
Zooming in on Waveforms
IM DL850-01EN
Record Length (Record Length) ................................................................................................... 5-1
Acquisition Mode (Acquisition Mode) ............................................................................................ 5-2
Hard Disk Recording (HD RecordCondition; optional) .................................................................. 5-4
Time Base (Time Base) ................................................................................................................ 5-5
Dual Capture (DUAL CAPTURE) .................................................................................................. 5-7
Captured-Waveform Display Number (Select Number) ................................................................ 5-8
Waveform Acquisition (START/STOP) ........................................................................................ 5-10
Window Types (DISPLAY) ............................................................................................................ 6-1
Display Format (Format) ............................................................................................................... 6-2
Extra Window (Extra Window) ...................................................................................................... 6-2
Grid (Graticule) ............................................................................................................................. 6-2
Turning the Scale Value Display On and Off (Scale Value) .......................................................... 6-3
Waveform Arrangement, Color, and Display Gr. (Trace Setup) .................................................... 6-3
Trace Label Display (Trace Label) ................................................................................................ 6-3
Level Indicator............................................................................................................................... 6-4
Interpolation Method (Dot Connect) .............................................................................................. 6-4
Setting the Number of Data Points to Use for Waveform Display (Decimation) ........................... 6-5
Accumulation (Accumulate) .......................................................................................................... 6-5
Manual Event (Manual Event)....................................................................................................... 6-6
Switching the Menu Area Display ................................................................................................. 6-6
Turning the X-Y Window Display On and Off (Display)................................................................. 7-1
Eight Pairs of X-Y Waveforms (Setup) .......................................................................................... 7-1
Start Point and End Point (Start Point and End Point) .................................................................. 7-1
Pen Marker (Pen Marker) ............................................................................................................. 7-1
Clearing Waveforms at Acquisition Start (Trace clear on Start) .................................................... 7-2
Display Ratio of the Main Window (Main Ratio)............................................................................ 7-2
Window Layout (Window Layout) ................................................................................................. 7-2
Combine Display (Combine Display) ............................................................................................ 7-2
Interpolation Method (Dot Connect) .............................................................................................. 7-2
Setting the Number of Data Points to Use for Waveform Display (Decimation) ........................... 7-2
Zoom Window Display (Display) ................................................................................................... 8-1
Zoom Source Window (Zoom2 Source)........................................................................................ 8-1
Zoom Factor (MAG knob) ............................................................................................................. 8-2
Position (Zoom POSITION knob, Zoom1 Position, Zoom2 Position)............................................ 8-2
Display Ratio of the Main Window (Main Ratio)............................................................................ 8-2
Window Layout (Window Layout) ................................................................................................. 8-2
iii
Contents
Display Format (Format Zoom1 and Format Zoom2) ................................................................... 8-3
Moving the Zoom Position to the Latest Position (Move Zoom1 to Front and
Move Zoom2 to Front) .................................................................................................................. 8-3
Auto Scroll (Auto Scroll) ................................................................................................................ 8-3
Waveforms That Are Zoomed (Allocation) .................................................................................... 8-3
iv
9
Cursor Measurement
10
Automated Measurement of Waveform Parameters
11
Computation
12
FFT
Window Selection (Select Window) .............................................................................................. 9-1
T-Y Waveforms ............................................................................................................................. 9-1
Horizontal Cursors (Horizontal) - T-Y waveforms ......................................................................... 9-1
Vertical Cursors (Vertical) - T-Y waveforms .................................................................................. 9-2
Horizontal and Vertical Cursors (H & V) - T-Y waveforms ............................................................ 9-4
Marker Cursors (Marker) - T-Y waveforms ................................................................................... 9-4
Angle Cursors (Degree) - T-Y waveforms ..................................................................................... 9-6
X-Y Waveforms ............................................................................................................................. 9-7
FFT Waveforms ............................................................................................................................ 9-9
Notes about Cursor Measurement ...............................................................................................9-11
Mode Settings (Mode)................................................................................................................. 10-1
Automated Measurement of Waveform Parameters (ON) .......................................................... 10-1
Measurement Items (Measure Setup) ........................................................................................ 10-1
Setting the Delay (Delay Setup).................................................................................................. 10-4
Measurement Time Period (Time Range1/Time Range2) .......................................................... 10-5
1-Cycle Mode (1-Cycle Mode) .................................................................................................... 10-6
Notes about Automated Measurement of Waveform Parameters .............................................. 10-6
Normal Statistical Processing (Statistics) ................................................................................... 10-7
Cyclic Statistical Processing (Cycle Statistics) ........................................................................... 10-8
Statistical Processing of History Waveforms (History Statistics) .............................................. 10-10
Notes about Statistical Processing ............................................................................................10-11
Turning Computation On and Off (Mode).....................................................................................11-1
Computation Waveform Selection (Select Math Trace) ...............................................................11-1
Computation Settings (Math Setup) .............................................................................................11-1
Scaling Mode (Scaling Mode) ......................................................................................................11-4
Upper and Lower Limits (Upper/Lower) .......................................................................................11-4
Start Point and End Point (Start Point and End Point) .................................................................11-4
User-Defined Computation (Optional)..........................................................................................11-4
Expression (Expression) - user-defined .......................................................................................11-4
Averaging Settings (Average Setup) - user-defined ....................................................................11-7
FFT Settings (FFT Setup) - user-defined .....................................................................................11-9
Filter Settings (Filter Setup) - user-defined ..................................................................................11-9
Constant Settings (Constant Setup) - user-defined ...................................................................11-10
Notes about Computation ..........................................................................................................11-10
Turning the FFT On and Off (Display)......................................................................................... 12-1
Analysis Source Waveform (Source) .......................................................................................... 12-1
Start Point and Number of FFT Points (Start Point and FFT Points) .......................................... 12-1
Window Function (Window) ........................................................................................................ 12-2
Vertical Scale (Vert. Scale Mode) ............................................................................................... 12-2
Center/Scale (Center/Sensitive) ................................................................................................. 12-2
IM DL850-01EN
Contents
Display Ratio of the Main Window (Main Ratio).......................................................................... 12-3
Window Layout (Window Layout) ............................................................................................... 12-3
Horizontal Scale (Horiz. Axis) ..................................................................................................... 12-3
FFT Analysis on Models with User-Defined Computation (Option)............................................. 12-3
Notes about FFT Computation.................................................................................................... 12-5
13
GO/NO-GO Determination
14
Action-On-Trigger
15
Searching Waveforms
16
Displaying and Searching History Waveforms
17
Printing and Saving Screen Captures
18
Saving and Loading Data
19
Ethernet Communication (Network)
IM DL850-01EN
Mode (Mode)............................................................................................................................... 13-1
Waveform Zone (Wave Zone) ..................................................................................................... 13-1
Waveform Parameters (Parameter) ............................................................................................ 13-4
Notes about GO/NO-GO Determination ..................................................................................... 13-5
Mode (Mode)............................................................................................................................... 14-1
Action (Action Setup) .................................................................................................................. 14-1
Notes about Action-on-Trigger .................................................................................................... 14-2
Search Type (Type)..................................................................................................................... 15-1
Edge Search (Edge) ................................................................................................................... 15-2
Event Search (Event) .................................................................................................................. 15-4
Logic Pattern Search (Logic Pattern) .......................................................................................... 15-4
Time Search (Time) .................................................................................................................... 15-5
Notes about Searching Waveforms ............................................................................................ 15-5
Display Mode (Display Mode) ..................................................................................................... 16-2
Highlighting (Selected Record) ................................................................................................... 16-2
Display Range (Start and End Record)....................................................................................... 16-3
List of History Waveforms (List) .................................................................................................. 16-3
History Waveform Search Mode (Search Mode) ........................................................................ 16-4
Search Condition Settings for Zone Searching (Search Setup) ................................................. 16-4
Search Condition Settings for Waveform Parameter Searching (Search Setup)........................ 16-5
Search Execution (Execute Search) ........................................................................................... 16-5
Notes about Using the History Feature ....................................................................................... 16-5
Destination Type (Print To) .......................................................................................................... 17-1
Printing from the Built-In Printer (BuiltIn; option)......................................................................... 17-1
Printing from a Network Printer (Network) .................................................................................. 17-1
Saving Screen Captures to Files (File) ....................................................................................... 17-2
Printing or Saving a Screen Capture (PRINT) ............................................................................ 17-2
Storage Media You Can Save and Load From ........................................................................... 18-1
Saving Data (Save) ..................................................................................................................... 18-2
Loading Data (Load) ................................................................................................................... 18-7
File Operations (Utility) ............................................................................................................... 18-8
TCP/IP (TCP/IP) ......................................................................................................................... 19-2
FTP Server (FTP/Web Server) ................................................................................................... 19-3
Web Server (FTP/Web Server) ................................................................................................... 19-4
Mail (Mail) ................................................................................................................................... 19-5
v
Contents
Network Printer (Net Print) .......................................................................................................... 19-6
Network Drive (Net Drive) ........................................................................................................... 19-6
SNTP (SNTP) ............................................................................................................................. 19-7
20
Other Features
Auto Setup (Auto Setup) ............................................................................................................. 20-1
Initializing Settings (Initialize) ...................................................................................................... 20-1
Storing and Recalling Setup Data (Setup Data Store and Recall) .............................................. 20-2
Calibration (CAL) ........................................................................................................................ 20-2
Snapshot (SNAP SHOT)............................................................................................................. 20-2
Clear Trace (CLEAR TRACE) ..................................................................................................... 20-2
Remote Control (Remote Ctrl) .................................................................................................... 20-3
System Configuration (System Configuration) ............................................................................ 20-5
Environment Settings (Preference) ............................................................................................. 20-8
Self-Test (Selftest)....................................................................................................................... 20-9
Overview (Overview)................................................................................................................. 20-10
Key Lock (KEY PROTECT) ...................................................................................................... 20-10
NUM LOCK ............................................................................................................................... 20-10
Appendix
Appendix 1
Appendix 2
Appendix 3
Appendix 4
Appendix 5
Appendix 6
Appendix 7
How to Calculate the Area of a Waveform ......................................................... App-1
User-Defined Computation (Optional) ................................................................ App-3
FFT Function - user-defined ............................................................................... App-7
Fundamental Equations for Defining Strain ..................................................... App-12
Shunt Calibration of the Strain Module ............................................................ App-13
Shunt Calibration Procedure ............................................................................ App-14
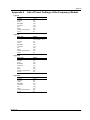
Measurement Principle of the Frequency Module............................................ App-19
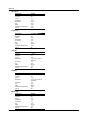
List of Preset Settings of the Frequency Module ............................................. App-23
TCP and UDP Port Numbers ........................................................................... App-26
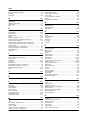
Index
vi
IM DL850-01EN
1
Main Features
Vertical Axis
This section explains how to configure the signal input settings and the amplitude-direction display settings. The
items that can be set vary depending on the installed modules. The channel menu that corresponds to the key
you pressed (CH1 to CH16) appears. You can set the various vertical axis settings for each channel. Press ALL
CH to display a screen in which you can configure the settings of all channels while viewing the settings in a list.
DL850/DL850V Measurement Items
When the DL850/DL850V is equipped with the modules listed below, it can measure voltage, temperature, strain,
acceleration, frequency, logic, CAN bus signals, and so on.
Voltage
701250 (HS10M12), 701251 (HS1M16), 701255 (NONISO_10M12), 701260 (HV (with RMS)), 720210
(HS100M12), 701261 (UNIVERSAL), 701262 (UNIVERSAL (AAF)), 701265 (TEMP/HPV), 701275 (ACCL/VOLT)
Voltage (For the 16-CH Voltage Input Module)
720220 (16CH VOLT)
Temperature
701261 (UNIVERSAL), 701262 (UNIVERSAL (AAF)), 701265 (TEMP/HPV)
Strain
701270 (STRAIN_NDIS), 701271 (STRAIN_DSUB)
Acceleration
701275 (ACCL/VOLT)
Frequency
701280 (FREQ)
Logic
720230 (LOGIC)
CAN Bus Signal Monitoring
720240(CAN MONITOR)
This module can only be used with the DL850V.
Vertical Scale
The vertical scale is used to adjust the displayed waveform amplitude so that you can easily view signals. You
can set the vertical scale to determine the value per grid square (1 div) displayed on the screen and to set the
measurement range.
Use the SCALE knob to set the vertical scale for each channel.
Vertical Position
Because the DL850/DL850V can display many waveforms, the waveforms may overlap and be difficult to view. If
this happens, you can adjust the vertical display position to make waveforms easier to view (vertical position).
Use the POSITION knob to set the vertical position for each channel.
Input Coupling
You can change the input coupling setting to match the signal that you are measuring. By changing the setting,
you can choose how the vertical-axis (voltage-axis) control circuit is coupled to the input signal. The following
types of input coupling are available: DC, AC, GND, TC, DC-RMS, AC-RMS, ACCEL, and OFF.* Set the
appropriate input coupling for each input module.
* You can only select OFF for sub channels on the 16-CH Voltage Input Module. Sub channels set to OFF are
not measured.
IM DL850-01EN
1-1
1 Main Features
Vertical Zoom
You can zoom the waveform vertically. You can zoom the waveform by setting the vertical magnification or by
setting upper and lower display limits.
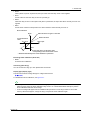
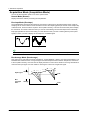
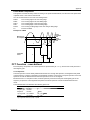
Linear Scaling
Linear scaling is a function that converts measured values into physical values and reads them directly. There
two types of linear scaling:
AX+B
Using scaling coefficient A and offset B, the DL850/DL850V scales values according to the equation below.
Y= AX + B (where X is the measured value and Y is the physical value)
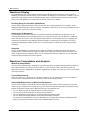
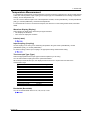
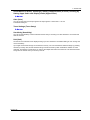
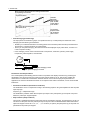
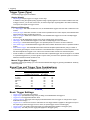
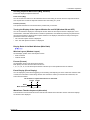
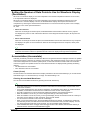
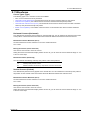
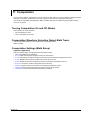
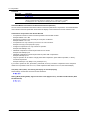
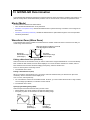
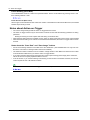
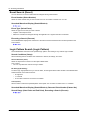
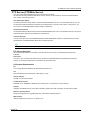
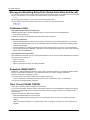
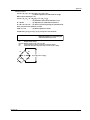
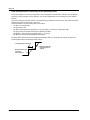
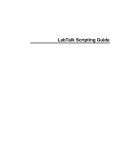
P1-P2
The DL850/DL850V determines the scale conversion equation (y = ax + b) using four values that you specify:
two measured values (P1:X, P2:X) and the value that each one should be converted to (P1:Y, P2:Y).
The DL850/DL850V scales values using the scale conversion equation that it determines.
Physical values (scaled values)
y = ax + b
P2
P2:Y
P1
P1:Y
P1:X
P2:X
Measured values
Measurement range
Horizontal Axis (Time Axis)
Time Axis Setting
Normally, under the initial settings, the time axis scale is set as a length of time per grid division (1 div). The
selectable range is 100 ns/div to 3 days/div.*As you adjust the value, the unit changes between seconds,
minutes, hours, and days automatically. Because the horizontal display range is 10 div, the amount of time on
the waveform that is displayed is equal to the time axis setting × 10.
* When the 720210 (HS100M12) module is installed, the scale range starts at 100 ns/div; when it is not
installed, the scale range starts at 1 μs/div.
Internal and External Clocks (Time base selection)
Under the initial settings, the DL850/DL850V samples the measured signal using the internal clock signal
produced by its internal time-base circuit.
You can also use an external clock signal to control sampling. Apply the external clock signal to the externalclock input terminal. This external clock input is useful for synchronizing to the clock signal of the waveform that
is being measured.
Relationship between the Time Axis Setting, Record Length, and Sample Rate
If you change the time axis setting, the sample rate and the acquisition-memory record length also change. For
details, see appendix 1 in the Getting Started Guide, IM DL850-03EN.
Sample Rate
If you change the time axis setting, the sample rate also changes. The sample rate is the number of samplesper-second (S/s). When the sample rate is low compared to the frequency of the input signal, the high-frequency
components of the waveform are misread as low-frequency components. To prevent the high-frequency
components from being misread, sample the signal at the highest sample rate possible, or set the waveform
acquisition mode to Envelope.
1-2
IM DL850-01EN
1 Main Features
Roll Mode Display
When the trigger mode is set to Auto, Auto Level, Single, or On Start and the time axis setting is greater than
or equal to 100 ms/div, instead of updating waveforms through triggering (update mode), the DL850/DL850V
displays the waveforms in roll mode. In roll mode, waveforms scroll from right to left as new data is captured and
the oldest values are deleted from the screen.
Trigger
A trigger is a cue used to display the waveform on the screen. A trigger occurs when the specified trigger
condition is met, and a waveform is displayed on the screen.
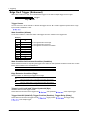
Trigger Modes
The trigger mode determines the conditions for updating the displayed waveforms. There are six trigger modes:
Auto, Auto Level, Normal, Single, N Single, and On Start. The trigger mode setting applies to all trigger types.
Trigger Types
Triggers can be broadly divided into “simple triggers” and “enhanced triggers.”
Simple Triggers
Input Signal Trigger
The DL850/DL850V triggers when the trigger source passes through the specified trigger level in the specified
way (rising edge, falling edge, or rising or falling edge).
Time Trigger
The DL850/DL850V triggers at the specified date and time and at specified intervals afterwards.
External Signal Trigger
The DL850/DL850V triggers when the signal applied to the TRIG IN terminal passes through the specified trigger
level in the specified way (rising or falling edge).
Power Line Signal Trigger
The DL850/DL850V triggers on the rising edge of the power supply signal that it is receiving. This trigger enables
you to observe waveforms in synchronization with the power supply frequency.
Enhanced Triggers
A -> B(N) Trigger
After state condition A is met, the DL850/DL850V triggers when state condition B is met N times.
A Delay B Trigger
After state condition A is met and the specified amount of time elapses, the DL850/DL850V triggers when state
condition B is first met.
Edge On A Trigger (Enhanced)
While state condition A is met, the DL850/DL850V triggers on the OR of multiple trigger source edges.
OR Trigger
The DL850/DL850V triggers on the OR of multiple trigger source edges.
AND Trigger
The DL850/DL850V triggers on the AND of multiple trigger source conditions. The DL850/DL850V triggers when
all the specified conditions are met at a single point.
Period Trigger
The DL850/DL850V triggers on a specified period of occurrence of state condition B. The DL850/DL850V
triggers when state condition B occurs again.
IM DL850-01EN
1-3
1 Main Features
Pulse Width Trigger
The DL850/DL850V triggers according to the relationship between the state condition B achievement time and
the specified reference times (Time or T1 and T2).
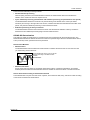
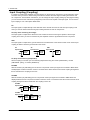
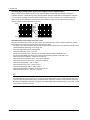
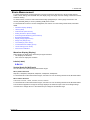
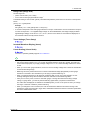
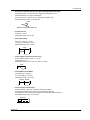
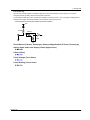
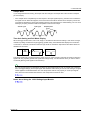
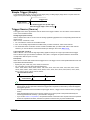
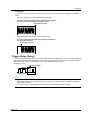
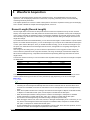
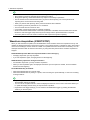
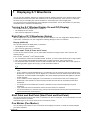
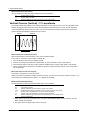
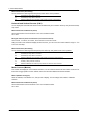
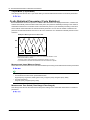
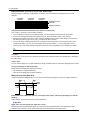
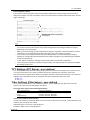
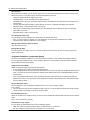
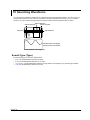
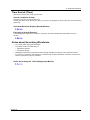
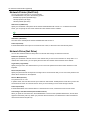
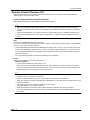
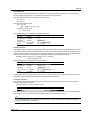
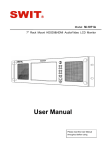
Wave Window Trigger
The DL850/DL850V creates real-time templates (Wave Window) using a number of cycles directly preceding the
current waveforms. The DL850/DL850V compares the current waveforms to the real-time templates and triggers
if one of the current waveforms falls outside of its real-time template.
Reference cycles (example: the waveforms
for the four previous cycles)
Current waveform
Measured waveform
Average of 1, 2, or
4 cycles
Trigger
Real-time template
Tolerance
Average waveform
+ tolerance
The DL850/DL850V
compares the current
waveform to the real-time
template and triggers if the
current waveform falls
outside of the real-time
template.
Trigger Source
Trigger source refers to the signal that is used to check the specified trigger conditions. You can set the trigger
source to an analog signal, logic signal, time, external signal, or power line signal. Select the appropriate trigger
source for the trigger type.
Trigger Level
Trigger level refers to the signal level used as a reference for detecting a signal’s rising and falling edges or
high and low states. With simple triggers such as the edge trigger, the DL850/DL850V triggers when the trigger
source level passes through the specified trigger level. The range and resolutions that you can use to set the
trigger level vary depending on the type of signal being measured.
Waveform Acquisition
Based on the data that has been stored in the acquisition memory, the DL850/DL850V performs various
operations, such as displaying waveforms on the screen, computing, measuring cursors, and automatically
measuring waveform parameters.
You can set the number of data points to store in the acquisition memory (the record length), enable or disable
the sample data averaging feature, and so on.
Record Length
Record length refers to the number of data points that are stored to the acquisition memory for each channel.
Display record length refers to the data points from the data stored in the acquisition memory that are displayed
on the screen. Normally, the acquisition-memory record length and display record length are the same, but the
time axis setting may cause them to differ. When you change the time axis setting, the sample rate and record
length also change.
On the standard model of the DL850/DL850V, you can set the record length to a value between 1 kpoint and 250
Mpoint. Depending on the model, you can set the record length to a value of up to 2 Gpoint.
1-4
IM DL850-01EN
1 Main Features
Acquisition Mode
Specify how the DL850/DL850V processes the sampled data, stores it in the acquisition memory, and uses it to
display waveforms. There are four acquisition modes: Normal, Envelope, Averaging, and BoxAverage.
Hard Disk Recording
When measurement starts, you can record data to an external hard disk that supports eSATA (external Serial
ATA; /HD0 option) or to an internal hard disk (/HD1 option).* The recorded data is saved to files automatically.
You can load the saved data using the DL850/DL850V and convert it to a format that you can analyze on a PC
(ASCII or floating point).
* Models with the /HD0 option are equipped with eSATA connectors. You need to purchase a hard disk that
supports eSATA separately.
History
When waveforms are being measured, the waveform data stored in the acquisition memory as a result of
a trigger occurrence is displayed as a waveform on the DL850/DL850V screen and can be viewed. When
waveform acquisition is being triggered in succession and an abnormal waveform appears, it is impossible to
stop acquisition before a new waveform appears on the screen. Normally, it would be impossible to view the
abnormal waveform. However, with the history feature, you can view the past waveform data (history waveforms)
stored in the acquisition memory when waveform acquisition is stopped. You can select specific history
waveforms and display them.
You can also search through the history waveforms for waveforms that meet specified conditions.
• Zone Search
The DL850/DL850V searches for history waveforms that passed (or did not pass) through a specified search
zone.
• Waveform Parameter Search
The DL850/DL850V searches for waveforms whose measured waveform parameter values meet (or do not
meet) specified conditions.
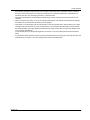
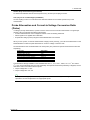
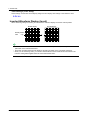
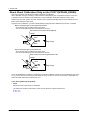
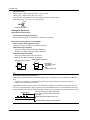
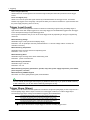
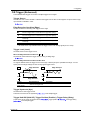
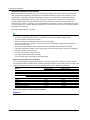
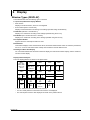
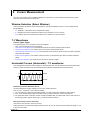
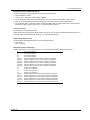
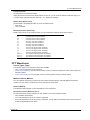
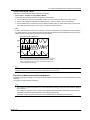
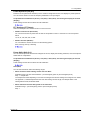
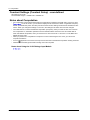
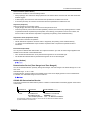
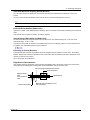
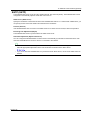
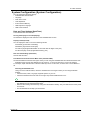
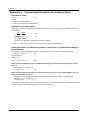
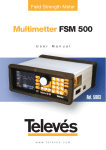
Dual Capturing
You can use dual capturing to simultaneously record a trend at a low sampling speed in roll mode and at a high
sampling rate. This is useful for capturing fast phenomenon while observing a trend over a long period of time.
Main waveforms
(low-speed sampling)
Roll mode display
Sample rate:
100 kS/s or less
IM DL850-01EN
Captured waveforms
(high-speed sampling)
Update mode display
Sample rate:
Faster than that of the
main waveform
1-5
1 Main Features
Waveform Display
The DL850/DL850V has a main window for displaying normal time-domain waveforms, zoom windows for
displaying zoomed time-axis waveforms, and X-Y windows for displaying X-Y waveforms. In addition, you can
split screens and change the sizes of waveform display areas so that waveforms and measured values are
easier to see and display an FFT window that shows the results of FFT analysis.
Zooming along the Time Axis (GIGAZoom)
You can magnify displayed waveforms along the time axis. The zoomed waveforms of two locations can be
displayed simultaneously (the dual zoom feature). This feature is useful when you set a long acquisition time and
want to observe a portion of the waveform closely.
Displaying X-Y Waveforms
You can observe the correlation between two waveform signal levels by displaying one signal level on the
X-axis (horizontal axis) and a second signal level on the Y-axis (vertical axis). You can display X-Y waveforms
at the same time as normal T-Y (time and signal level) waveforms. You can display up to four overlapping X-Y
waveforms in both Window1 and Window2. Because multiple X-Y waveforms can be displayed, it is easy to
compare the relationships between phases. You can use this feature to evaluate DC motors using Lissajous
waveforms.
Snapshot
You can continue displaying a waveform on the screen as a snapshot waveform after the screen has been
updated and the waveform has been cleared in update mode or after the waveform has left the screen in roll
mode. Snapshot waveforms appear in white. You can compare them with new waveforms. You can also save
and print snapshot waveforms as screen captures.
Waveform Computation and Analysis
Waveform Computation
You can perform basic arithmetic, binarization, FFT (power spectrum), and phase shifting (display the waveform
with its phase shifted). On models with the /G2 option, you can use a rich variety of functions (square root,
trigonometric functions, differentiation, integration, digital filtering, six types of FFT functions, and so on) to define
up to eight equations.
Cursor Measurement
There are cursors for T-Y (time-axis), X-Y, and FFT waveforms. You can position a cursor over a waveform to
view the various measured values at the intersection of the cursor and the waveform.
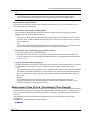
Automated Measurement of Waveform Parameters
You can use this feature to automatically measure waveform levels, maximum values, frequencies, and other
values. For up to 100 Mpoint of waveform data, you can measure 29 waveform parameters (including the delay
between channels) that relate to the voltage axis, time axis, and waveform area.
• You can display a total of 32 measured values for all the waveforms.
• You can save a total of 64000 items of data for all the waveforms.
• You can also perform computations on measured waveform parameter values.
• You can display the following statistics for the specified waveform parameter.
The maximum value (Maximum), minimum value (Minimum), average value (Average), standard deviation
(SDev), and number of measured values used to calculate statistics (Count)
1-6
IM DL850-01EN
1 Main Features
There are three statistical processing methods:
• Normal statistical processing
While acquiring waveforms, the DL850/DL850V measures the measurement items and calculates the
statistics of the waveforms that it has acquired so far.
• Cyclic statistical processing (measurement and statistical processing are performed for each period)
The DL850/DL850V divides the waveform into periods starting at the left side of the screen (the oldest
waveform) and moving to the right side of the screen, measures the selected measurement items within each
period, and performs statistical processing on the measurement items.
• Statistical processing of history waveforms
The DL850/DL850V measures the measurement items and calculates the statistics of history waveforms.
Measurement and statistical processing begin with the oldest waveform.
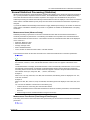
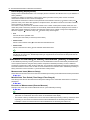
GO/NO-GO Determination
This feature is useful for signal testing on production lines and for tracking down abnormal phenomena. The
DL850/DL850V determines whether the waveform enters the specified range. When the DL850/DL850V returns
a GO (or NO-GO) result, specified actions are performed.
Determination Methods
• Waveform Zone
The DL850/DL850V returns GO/NO-GO results based on whether waveforms leave or enter the zone that
you create using a base waveform.
The DL850/DL850V returns a GO or NO-GO
judgment according to the determination
condition.
Specified zone
Determination
area
• Waveform Parameter
Set the upper and lower limits for automated measurement values of waveform parameters. The DL850/
DL850V performs GO/NO-GO determination based on whether the values are within or outside of the limits.
Actions Performed according to Determination Results
The DL850/DL850V can print and save screen captures, save waveform data, beep, and send e-mails according
to the results of GO/NO-GO determination.
IM DL850-01EN
1-7
1 Main Features
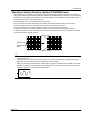
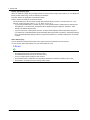
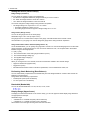
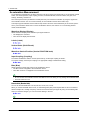
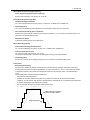
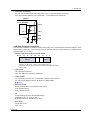
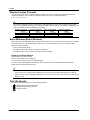
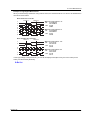
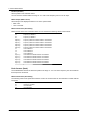
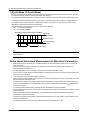
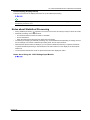
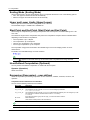
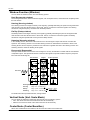
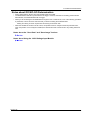
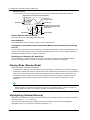
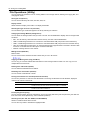
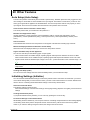
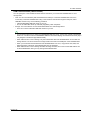
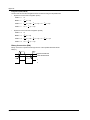
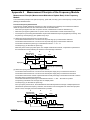
Notes about Using the 16-CH Voltage Input Module
While normal voltage input modules have two main channels for analog input, the 16-CH Voltage Input Module
has 16 sub channels for analog input. The 16-CH Voltage Input Module samples the measured sub channels in
order.
Main channel sample rate: 200 kS/s
When the number of measured sub channels is 16
(all the sub channels are measured)
Sub channel sample rate: 10 kS/s
5 μs
Main channel
sample clock
Sub_Ch1
Sub_Ch2
Timing of sub
channel
sampling
Sub_Ch3
•
•
•
Sub_Ch16
100 μs
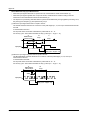
When the number of measured sub channels is 2
(sub channels 1 and 16 are measured)
Sub channel sample rate: 100 kS/s
5 μs
Main channel
sample clock
Sub_Ch1
Sub_Ch2
Timing of sub
channel
sampling
Sub_Ch3
•
•
•
Sub_Ch16
10 μs 10 μs
• The 16-CH Voltage Input Module only uses the odd main channels of the slot that it is inserted into. It cannot
use the slot’s even main channels.
• If you do not want to measure an individual sub channel, turn its input coupling off. Sub channels whose input
coupling has been turned off are not scanned.
• The maximum sample rate of the 16-CH Voltage Input Module is 200 kS/s (when only one sub channel is
measured). The maximum sample rate per sub channel varies depending on the main channel sample rate
and the number of measured sub channels. For information about sample rates, see appendix 1 in the Getting
Started Guide, IM DL850-03EN.
• The sample rate that is displayed on the screen is the sample rate of the main channel.
• The record length of each sub channel varies depending on the set record length and the number of
measured sub channels.
Record length of each sub channel ≤ set record length/number of measured sub channels
• The timing of waveform acquisition is different for each sub channel, but all the sub channels are stored in the
acquisition memory as if they had been sampled at the same timing. This means that the sampling times of
the acquired waveform data are different from the sampling times of the actual applied waveforms.
• Because the waveform data stored in the acquisition memory is used to display waveforms on the screen, the
data of all sub channels is displayed as if though it were sampled at the same timing.
1-8
IM DL850-01EN
1 Main Features
• The following operations are performed on the waveform data stored in the acquisition memory: waveform
zooming, cursor measurement, the automated measurement of waveform parameters, computation, FFT,
waveform searches, and the loading and saving of waveform data.
• GO/NO-GO determination and the display and searching of history waveforms are not performed on sub
channels.
• When you execute auto setup on the 16-CH Voltage Input Module, sub channel on/off settings and settings
that relate to the horizontal axis (TIME/DIV) are not changed.
• Wire all the L input terminals for all the sub channels on the same module to the same potential. The L input
terminals of the sub channels are common. Because the L input terminals are electrically connected inside
the DL850/DL850V, connecting different potentials to them could result in short circuiting and damage to the
16-CH Voltage Input Module.
For information about the terminal arrangement, see section 3.13 in the Getting Started Guide, IM DL85003EN.
• For information about attaching and removing the terminal block and connecting and removing wires from the
terminal block, see section 3.13 in the Getting Started Guide, IM DL850-03EN.
IM DL850-01EN
1-9
2
Vertical Axis
This section explains how to configure the signal input settings and the amplitude-direction display settings. The
items that can be set vary depending on the installed modules.
Input Settings
CH1 to CH16
The channel menu that corresponds to the key you pressed appears. You can set the various vertical axis
settings for each channel.
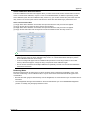
ALL CH
You can configure the settings of all channels while viewing the settings in a list. You can also copy the various
vertical axis settings of one channel to another channel. There are some items that cannot be configured from
the ALL CH list.
DL850/DL850V Measurement Items
When the DL850/DL850V is equipped with the modules listed below, it can measure voltage, temperature, strain,
acceleration, frequency, logic, CAN bus signals, and so on.
• Voltage measurement
701250 (HS10M12), 701251 (HS1M16), 701255 (NONISO_10M12), 701260 (HV (with RMS)), 720210
(HS100M12), 701261 (UNIVERSAL), 701262 (UNIVERSAL (AAF)), 701265 (TEMP/HPV), 701275 (ACCL/
VOLT)
• Voltage measurement (for the 16-CH Voltage Input Module)
720220 (16CH VOLT)
• Temperature measurement
701261 (UNIVERSAL), 701262 (UNIVERSAL (AAF)), 701265 (TEMP/HPV)
• Strain measurement
701270 (STRAIN_NDIS), 701271 (STRAIN_DSUB)
• Acceleration measurement
701275 (ACCL/VOLT)
• Frequency measurement
701280 (FREQ)
• Logic measurement
720230 (LOGIC)
• CAN Bus Signal Monitoring
720240(CAN MONITOR)
This module can only be used with the DL850V.
You can use auto setup to automatically configure the appropriate settings (such as vertical axis, horizontal
axis, and trigger settings) for the input signal. This feature is useful when you are not sure what type of signal
will be applied to the DL850/DL850V. The auto setup feature will not work properly on some input signals.
Also, there are some modules with which the auto setup feature cannot be used.
IM DL850-01EN
2-1
2 Vertical Axis
Voltage Measurement
For voltage measurement, the items that have to be set for each input signal (CH1 to CH16) include vertical
scales, the vertical positions, input coupling, probe attenuation, the bandwidth limit, the zoom method, the offset,
waveform inversion, trace settings, and linear scaling.
You can measure voltage by connecting probes, measurement leads, etc. to one of the following voltage
measurement modules: 701250 (HS10M12), 701251 (HS1M16), 701255 (NONISO_10M12), 701260 (HV (with
RMS)), 720210 (HS100M12), 701261 (UNIVERSAL), 701262 (UNIVERSAL (AAF)), 701265 (TEMP/HPV),
701275 (ACCL/VOLT).
For the probe connection method, see section 3.5 in the Getting Started Guide, IM DL850-03EN. For the
measurement lead connection method, see section 3.7.
•
•
•
•
•
•
•
•
•
•
•
•
•
•
•
Waveform Display (Display)
Labels (Label)
Vertical Scale (SCALE knob)
Waveform Vertical Position (Vertical POSITION knob)
Input Coupling (Coupling)
Probe Attenuation and Current-to-Voltage Conversion Ratio (Probe)
Bandwidth (Bandwidth)
Zoom Method (V Scale)
Zooming by Setting a Magnification (V Zoom)
Zooming by Setting Upper and Lower Display Limits (Upper/Lower)
Offset (Offset)
Trace Settings (Trace Setup)
Inverted Waveform Display (Invert)
Linear Scaling (Linear Scale)
RMS Measurement
Waveform Display (Display)
Select whether to display each channel’s input signal waveform.
• ON: Displays the waveform
• OFF: Does not display the waveform
Labels (Label)
You can specify a name of up to eight characters in length for each channel.
You can set whether to display labels using the DISPLAY menu.
• The waveform display on/off setting changes to the waveform acquisition on/off setting in cases such as
during hard disk recording and when an increase in the record length places a limitation on the number of
channels that can be used.
• The specified display label is used in labels, scale values, the numeric display, and cursor-measurement
values.
• Depending on the display and zoom formats, label names may not appear when the waveform display is
narrow.
2-2
IM DL850-01EN
2 Vertical Axis
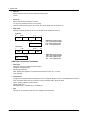
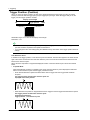
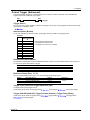
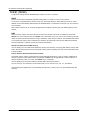
Vertical Scale (SCALE knob)
Voltage Scale Setting
The vertical scale is used to adjust the displayed waveform amplitude so that you can easily view signals. Set
the vertical scale by voltage per grid square (V/div) or current per grid square (A/div) on the screen.
Use the SCALE knob to set the vertical scale for each channel and sub channel.
The same SCALE knob is used to adjust the scale of each channel and sub channel.
To change the vertical scale of a channel, press the key from CH1 to CH16 that corresponds to the channel.
To change the vertical scale of a sub channel, press an odd channel key from CH1 to CH15, and then press the
soft key that corresponds to the sub channel.
The vertical scale changes when you switch to an input attenuator with a different attenuation. You can change
the scale in steps like this: 1 V/div -> 2 V/div -> 5 V/div.
Example
Vertical position mark
Ground level mark
1 div = 1.000 V
If 1.000 V/div is changed to 0.500 V/div
1 div = 0.500 V
• While waveform acquisition is stopped, turning the SCALE knob will not change the displayed waveform.
The changed V/div value will be applied the next time that waveform acquisition is started.
• While waveform acquisition is stopped, turning the SCALE knob will not change the cursor-measurement
values or the automated measurement values of waveform parameters, they will continue to be based on
the V/div value at the time of measurement.
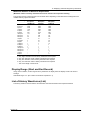
Selectable range of V/div
The selectable range varies as shown below depending on the input module.
Input Module
701250 (HS10M12)
701251 (HS1M16)
701255 (NONISO_10M12)
701260 (HV (with RMS))
701261 (UNIVERSAL)
701262 (UNIVERSAL (AAF))
701265 (TEMP/HPV)
701275 (ACCL/VOLT)
720210 (HS100M12)
720220 (16CH VOLT)
Selectable Range
5 mV/div to 20 V/div
1 mV/div to 20 V/div
5 mV/div to 20 V/div
20 mV/div to 200 V/div
5 mV/div to 20 V/div
5 mV/div to 20 V/div
0.1 mV/div to 10 V/div
5 mV/div to 10 V/div
10 mV/div to 20 V/div
200 mV/div to 2 V/div
These values are for when the probe attenuation is 1:1. Multiply the values by 10 when the attenuation is
10:1, by 100 when the attenuation is 100:1, and by 1000 when the attenuation is 1000:1.
IM DL850-01EN
2-3
2 Vertical Axis
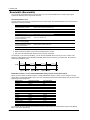
Measurement and Display Ranges
The measurement range of the DL850/DL850V is ±10 div, with 0 V in the center (the absolute width, or span, is
20 div). The default display-range setting is ±5 div (the span is 10 div). Using the features listed below, you can
move and scale the displayed waveform so that parts of it that were outside of the display range are displayed.
• Vertical position adjustment
• Offset voltage setting
• Vertical zoom
+10 div
+5 div
Measurement
range
20 div
0V
–5 div
Display
range
10 div
–10 div
2400 levels
• How to Measure the Voltage with High Accuracy
To measure the voltage with high accuracy, increase the vertical scale so that the input signal is measured
with the largest possible amplitude. To display multiple waveforms so that they do not overlap without
dividing the screen, you have to set the vertical scale to a low value. This prevents you from taking
advantage of the A/D converter’s resolution. However, if you divide the screen and arrange the waveforms
in the divided screens, they will not overlap, and you can raise their vertical scales.
• Measurement Resolution
The measurement resolution varies depending on the module. For example, the 701250 (HS10M12),
701255 (NONISO_10M12), and 720210 (HS100M12) use 12-bit A/D converters and sample the input
signal at a resolution of 150 levels per div. The 701251 (HS1M16), 701260 (HV (with RMS)), 701261
(UNIVERSAL), 701262 (UNIVERSAL (AAF)), 701265 (TEMP/HPV), 701275 (ACCL/VOLT), and 720220
(16CH VOLT) use 16-bit A/D converters and sample the input signal at a resolution of 2400 levels per div.
2-4
IM DL850-01EN
2 Vertical Axis
Waveform Vertical Position (Vertical POSITION knob)
The DL850/DL850V can display the waveforms of the main analog-input channels, the waveforms of the sub
analog-input channels, and computed waveforms. Because the DL850/DL850V can display so many waveforms,
the waveforms may overlap and be difficult to view. If this happens, you can adjust the vertical display position to
make waveforms easier to view (vertical position).
The vertical position can be moved within the range of ±5 div.
When you change the vertical scale (V/div), the location of the vertical position mark does not change.
Use the POSITION knob to set the vertical position for each channel and sub channel.
The same POSITION knob is used to adjust the position of each channel and sub channel.
To change the position of a channel, press the key from CH1 to CH16 that corresponds to the channel.
To change the position of a sub channel, press an odd channel key from CH1 to CH15, and then press the soft
key that corresponds to the sub channel.
Position: 3 div
Position: 0 div
Vertical position
mark
Position: –3 div
• You cannot use the vertical POSITION knob to move the vertical position of a temperature, strain, or
computed waveform.
• When the menu for configuring all channels (ALL CH) or all sub channels (ALL Sub Channels Setup) is
displayed, you can use the job shuttle to change the vertical positions.
• When you change the vertical position, offset voltage, or upper or lower limit (when Variable is set to ON),
data that is outside of the measurement range is handled as overflow data. As shown in the figure below,
waveforms appear cut off when there is overflow data.
IM DL850-01EN
2-5
2 Vertical Axis
Input Coupling (Coupling)
It is easier to measure the amplitude of an AC signal if you remove its DC component. On the other hand, there
are times when you want to measure the ground level or observe the entire signal, including both the DC and
AC components. In these kinds of situations, you can change the input coupling setting. By changing the setting,
you can choose how the vertical-axis (voltage-axis) control circuit is coupled to the input signal. You can set the
input coupling to one of the options listed below.
DC
The input signal is coupled directly to the attenuator of the vertical control circuit. Set the input coupling to DC
when you want to measure the entire signal, including both the DC and AC components.
AC (Only when measuring AC voltage)
The input signal is coupled to the attenuator of the vertical control circuit through a capacitor. Set the input
coupling to AC when you want to measure only the amplitude of the AC signal without the DC component.
GND
The input signal is coupled to the ground rather than to the attenuator of the vertical control circuit. Set the input
coupling to GND to check the ground level on the screen.
DC
AC
GND
Input terminal Vertical
control
circuit
1 MΩ
Input terminal Vertical
control
circuit
1 MΩ
Input terminal
Vertical
control
circuit
TC (Only when measuring temperature)
Set the coupling to TC when you are measuring temperature using the 701261 (UNIVERSAL), 701262
(UNIVERSAL (AAF)), or 701265 (TEMP/HPV).
DC-RMS
With the 701260 (HV (with RMS)), the DC and AC components of the input signal are converted to RMS values
and displayed. An RMS conversion circuit is connected to the same vertical-control-circuit coupling arrangement
that is used when the coupling is set to DC.
AC-RMS
With the 701260 (HV (with RMS)), the AC components of the input signal are converted to RMS values and
displayed without the DC component. An RMS conversion circuit is connected to the same vertical-control-circuit
coupling arrangement that is used when the coupling is set to AC.
DC-RMS
Input terminal Vertical
control
circuit
1 MΩ
RMS
conversion
circuit
AD
AC-RMS
Input terminal Vertical
control
circuit
1 MΩ
2-6
RMS
conversion
circuit
AD
IM DL850-01EN
2 Vertical Axis
ACCEL (Only when measuring acceleration)
To measure acceleration with the 701275 (ACCL/VOLT), set the input coupling to ACCEL.
OFF (only for the 16-CH Voltage Input Module)
Set the coupling to OFF to not include the sub channels selected on the 720220 (16CH VOLT) in the
measurement.
Probe Attenuation and Current-to-Voltage Conversion Ratio
(Probe)
In voltage (current) measurement, a probe is used to connect the circuit under measurement to a signal input
terminal. Using a probe has the following advantages.
• Prevents the disturbance of the voltage and current of the circuit being measured.
• Allows signals to be applied with no distortion.
• Expands the voltage (current) range that the DL850/DL850V can measure.
When you use a probe, to read the measurement voltage (current) correctly, you must set the attenuation on the
DL850/DL850V to match the probe attenuation or current-to-voltage conversion ratio.
Set the attenuation ratio as indicated below for each probe. (The probes are optional accessories that are sold
separately.)
Probe Type
Isolated probe (700929)
Isolated probe (701947)
Current probe (701933)
Current probes (701930, 701931)
Differential probe (700924)
10:1 passive probe (701940)
Attenuation
10:1
100:1
10 A:1 V
100 A:1 V
1000:1, 100:1
10:1
The attenuation settings available on the DL850/DL850V are 1:1, 10:1, 100:1, 1000:1, 10 A:1 V1, and 100 A:1
V2. If you use a probe other than one of the separately sold optional accessories provided by Yokogawa, set the
attenuation ratio in accordance with that probe.
1 Output voltage rate: 0.1 V/A
2 Output voltage rate: 0.01 V/A
Use a probe that is appropriate for the input capacitance of the module that you are using it with. The
capacitance cannot be adjusted for an inappropriate probe.
IM DL850-01EN
2-7
2 Vertical Axis
Bandwidth (Bandwidth)
You can specify a bandwidth limit for each module. You can use bandwidth limits to observe input signal
waveforms with their noise components removed.
Normal Bandwidth Limits
You can remove high-frequency components from the input signal. The bandwidth limits vary as shown below
depending on the input module.
Input Module
701250 (HS10M12)
701255 (NONISO_10M12)
701251 (HS1M16)
701260 (HV (with RMS))
720210 (HS100M12)
720220 (16CH VOLT)
701261 (UNIVERSAL)1
701262 (UNIVERSAL (AAF))1
701265 (TEMP/HPV)
701270 (STRAIN_NDIS)
701271 (STRAIN_DSUB)
701261 (UNIVERSAL)2
701262 (UNIVERSAL (AAF))
701275 (ACCL/VOLT)
701280 (FREQ)3
Bandwidth Limit
500 Hz, 5 kHz, 50 kHz, 500 kHz, Full
400 Hz, 4 kHz, 40 kHz, Full
100 Hz, 1 kHz, 10 kHz, Full
10 kHz, 20 kHz, 40 kHz, 80 kHz, 160 kHz, 640 kHz, 1.28 MHz, 2 MHz, Full
500 Hz, Full
2 Hz, 8 Hz, 30 Hz, Full
10 Hz, 100 Hz, 1 kHz, Full
40 Hz, 400 Hz, 4 kHz, Auto, Full
100 Hz, 1 kHz, 10 kHz, 100 kHz, Full
1 When measuring temperature.
2 When measuring voltage. Auto cannot be selected on the 701261.
3 Full cannot be selected when Preset is set to AC100V or AC200V.
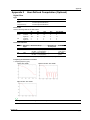
For example, on the 701251 (HS1M16), you can set the bandwidth limit to 400 Hz, 4 kHz, or 40 kHz. The
frequency characteristics for the different bandwidth limits are shown below. If you select Full, the module’s
maximum bandwidth is used.
–3 dB
Approx. 400 Hz
Approx. 4 kHz
Approx. 40 kHz
FULL
Bandwidth Limitation on the 701262 (UNIVERSAL (AAF)) and the 701275 (ACCL/VOLT)
When you are measuring voltage using the 701262 (UNIVERSAL (AAF)) or when you are using the 701275
(ACCL/VOLT) and the bandwidth is set to Auto, the anti-aliasing and low-pass filter settings vary as shown below
depending on the sample rate.
Sample Rate
200 kS/s or greater
100 kS/s
50 kS/s
20 kS/s
10 kS/s
5 kS/s
2 kS/s
1 kS/s
500 S/s
200 S/s
100 S/s
50 S/s
5 S/s to 20 S/s
2 S/s or less
Ext sample
Anti-Aliasing Filter
40 kHz
40 kHz
20 kHz
8 kHz
4 kHz
2 kHz
800 Hz
400 Hz
200 Hz
80 Hz
40 Hz
20 Hz
20 Hz
20 Hz
40 kHz
Low-Pass Filter
OFF
OFF
OFF
OFF
4 kHz
4 kHz
4 kHz
400 Hz
400 Hz
400 Hz
40 Hz
40 Hz
40 Hz
40 Hz
OFF
For example, when the sample rate is between 100 kS/s and 50 kS/s, the cutoff frequency of the anti-aliasing
filter is 40% of the sample rate.
2-8
IM DL850-01EN
2 Vertical Axis
Zoom Method (V Scale)
You can choose the method for zooming the waveform vertically.
• DIV: The waveform is zoomed by a set magnification.
• SPAN: The waveform is zoomed to fit within specified upper and lower display limits.
Zooming by Setting a Magnification (V Zoom)
When V Scale is set to DIV, you can set the vertical magnification and enlarge or reduce the waveform along the
vertical axis. This method is useful when you want to change the vertical scale of the waveform after it has been
displayed.
Zoom Factor (V Zoom)
The magnifications that you can choose from are listed below.
x0.1, x0.111, x0.125, x0.143, x0.167, x0.2, x0.25, x0.33, x0.4, x0.5, x0.556, x0.625, x0.667, x0.714, x0.8, x0.833,
x1, x1.11, x1.25, x1.33, x1.43, x1.67, x2, x2.22, x2.5, x3.33, x4, x5, x6.67, x8, x10, x12.5, x16.7, x20, x25, x40,
x50, x100
The range of zoom magnifications that you can choose varies under special circumstances as described below.
When using the 701260 (HV (with RMS))
50 V/div: x0.25 to x100
100 V/div: x0.5 to x100
200 V/div: x1 to x100
When measuring acceleration using the 701275 (ACCL/VOLT)
x0.5 to x50
When using the 701280 (FREQ)
x0.33 to x100
When using the 720230 (LOGIC)
x0.1 to x3.33
Zoom Position
Zooming is centered on the vertical position.
Vertical position mark
Ground level mark
1 div = 1 V
When V Zoom is set to ×2
1 div = 0.5 V
IM DL850-01EN
2-9
2 Vertical Axis
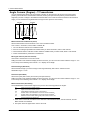
Zooming by Setting Upper and Lower Display Limits (Upper/Lower)
When V Scale is set to SPAN, you can set the upper and lower vertical limits and enlarge or reduce the
waveform along the vertical axis. By setting the appropriate upper and lower limits for the displayed waveform,
you can zoom in vertically on the area of the waveform that you want to observe. You can also increase the
display range to view parts of the waveform that were outside the range. Zooming the waveform does not
change its A/D conversion resolution or accuracy.
+10 V
+6 V
Zoom
+4 V
–10 V
+2 V
Selectable Range of the Upper and Lower Limits
The upper and lower limits can be set within ±(100 × the specified V/div value) or ±2000 V, whichever is lower.
Set the limits so that the upper limit is greater than the lower limit.
• The range of the upper and lower limits for the 701270 (STRAIN_NDIS) and 701271 (STRAIN_DSUB) varies
as indicated below depending on the range unit.
When the range unit is μSTR: ±30000 μSTR
When the range unit is mV/V: ±15 mV/V
• For the 701275 (ACCL/VOLT), the range of the upper and lower limits is ±2000000 units.
• For the 701280 (FREQ), the range of the upper and lower limits is (offset) ± (Value/div × 30).
When measuring frequencies: −1500 kHz to 1700 kHz
When measuring revolutions in rpm: −300 krpm to 350 krpm
When measuring revolutions in rps: −5000 rps to 7000 rps
When measuring periods: −150 s to 200 s
When measuring duty ratios: −500% to 700%
When measuring pulse widths: −150 s to 200 s
When measuring pulse integration: −2.5E+22 to 2.5E+22
When measuring velocity: −2.5E+22 to 2.5E+22
The displayed V/div will not change if you turn the SCALE knob after you set the upper and lower limits, but
the measurable range will change. If you change the measurable range so that it is narrower than the range
of the set upper and lower limits, when you start waveform acquisition, the parts of the waveform that do not
fit within the measurable range may not appear. The measurable range is approximately ±10 div (with 0 in the
center) when V Scale is set to DIV.
2-10
IM DL850-01EN
2 Vertical Axis
Offset (Offset)
By adding an offset, you can move the waveform to a vertical position that is easier to see. For example, when
measuring a signal with a fixed voltage component, you can use the offset to cancel out the fixed voltage and
measure the signal changes at a higher voltage sensitivity.
You can set the offset for each channel.
The offset is useful when you are measuring voltage or using the frequency module to measure frequency or
some other value.
Voltage sensitivity: 1.000 V/div
Vertical position: 0.00 div
Offset voltage:
0.000 V
1.000 V/div
1.00 div
–2.000 V
0.500 V/div
1.00 div
–2.000 V
Vertical
position
mark
Ground
level
mark
Selectable Range of the Offset
When measuring voltage: ±5 div
For the frequency module, the range varies depending on what is being measured.
• When measuring frequency: ±(Value/div) × 1000 or 200 kHz
• When measuring revolutions in rpm: ±(Value/div) × 1000 or 50 krpm
• When measuring revolutions in rps: ±(Value/div) × 1000 or 1000 rps
• When measuring periods: ±(Value/div) × 1000 or 50 s
• When measuring duty ratios: ±(Value/div) × 1000 or 100%
• When measuring pulse widths: ±(Value/div) × 1000 or 50 s
• When measuring pulse integration: ±(Value/div) × 1000 or 1.0000E+22
• When measuring velocity: ±(Value/div) × 1000 or 1.0000E+22
Notes about Setting the Offset
• When you are measuring voltage, changes to the offset are applied when acquisition is stopped. When you
are measuring the frequency or some other value using the frequency module, changes to the offset are not
applied when acquisition is stopped. The changed offset will be applied to the next measurement.
• When you are measuring voltage, if you change the probe attenuation, the offset voltage is determined using
the new attenuation ratio.
• When you are measuring voltage, the offset will not change even if you change the voltage scale. However,
if the offset goes outside the selectable range, the offset is set to the maximum or minimum value for the
current voltage scale. If you set the vertical scale back to its original value without changing the offset, the
offset returns to its original value.
• The offset does not affect cursor-measurement values, automated measurement values of waveform
parameters, or computed values.
• You can change the position of the waveform relative to the vertical position (change the focus of the
vertical zoom) by changing the offset.
IM DL850-01EN
2-11
2 Vertical Axis
Trace Settings (Trace Setup)
These settings are the same as the display assignment and display color settings in the DISPLAY menu.
Inverted Waveform Display (Invert)
When measuring voltage and strain, you can invert the waveform display around the vertical position.
Normal display
Inverted display
Vertical position
mark
• Cursor measurements, automated measurements of waveform parameters, and computations are
performed on the inverted waveforms.
• Even when inverted waveforms are displayed, triggering is based on the uninverted waveforms.
• When you are measuring strain, you cannot invert waveforms whose measurement has finished. The
inversion setting will be applied when the next measurement starts.
2-12
IM DL850-01EN
2 Vertical Axis
Linear Scaling (Linear Scale)
Linear scaling is a function that converts measured values into physical values and reads them directly.
When you measure voltage (current), strain, or frequency (revolutions, periods, duty ratios, power supply
frequencies, pulse widths, pulse integration, velocities), you can choose from one of two linear scaling methods:
AX + B or P1-P2.
Linear Scaling Modes (Scaling Mode)
• OFF
Linear scaling is not performed.
• AX + B
Using specified scaling coefficient A and offset B, the DL850/DL850V performs the following computation to
scale cursor-measurement values and automated measurement values of waveform parameters. You can
specify the unit of the linearly scaled results.
Y = AX + B
X: Value before scaling
Y: Value after scaling
Selectable range for A and B: −9.9999E+30 to +9.9999E+30
Initial value of A: +25.000E+00
Initial value of B: −25.000E+00
• P1-P2
You can specify two measured values (P1:X, P2:X) and specify a scale value (P1:Y, P2:Y) for each. The
scale-conversion equation (y = ax + b) is determined by these four values.
• Measured value (P1:X, P2:X) range: Same as the measurement range
• Scale value (P1:Y, P2:Y) range: −9.9999E+30 to +9.9999E+30
• Initial scale values
P1:X +0.0000E+00, P1:Y +0.0000E+00
P2:X +5.0000E+00, P2:Y +100.0000E+00
Get Value (Get Value)
Sets P1:X and P2:X to the current values (the values displayed by the level indicator), regardless of
whether waveform acquisition is in progress or stopped.
Scale values
y = ax + b
P2
P2:Y
P1:Y
P1
P1:X
P2:X
Measured values
Measurement range
Unit String (Unit String)
You can set the unit using up to four alphanumeric characters.
IM DL850-01EN
2-13
2 Vertical Axis
Display Type (Display Type)
When you measure voltage using a voltage module or measure strain using a strain module, you can display the
linearly scaled results using one of the following two methods.
Exponent: Values are displayed in exponential notation.
Floating: Values are displayed as decimal numbers.
For Decimal Number, set the number of digits after the decimal point to Auto or a number from 0 to 3. For
SubUnit, set the unit prefix to Auto, p, n, μ, m, None, k, M, G, or T.
• If you set Decimal Number to a number from 0 to 3, the specified number of digits after the decimal point
are displayed. If you select Auto, all numbers will be displayed using five digits (for example: 1.0000,
250.00). The default setting is Auto.
• If you set SubUnit to a setting other than Auto, numbers will be displayed with the specified unit prefix. If
you select Auto, the DL850/DL850V will automatically select appropriate unit prefixes. The default setting is
Auto. The DL850/DL850V displays values in exponential notation if it is unable to display them as decimal
numbers.
Scale Value Display
You can display the linearly scaled values of the upper and lower vertical limits of each channel.
You can turn the scale value display on and off in the DISPLAY menu.
• Linear scaling cannot be performed for measurements of temperature or acceleration.
• The following waveforms cannot be linearly scaled.
Accumulated waveforms (except for the most recent)
• You can configure linear scaling for each channel.
• The specified scaling coefficient A and offset B are retained even after linear scaling is set to OFF.
• Computations are performed on the linearly scaled values.
2-14
IM DL850-01EN
2 Vertical Axis
RMS Measurement
When the selected channel belongs to the 701260 (HV (with RMS)), you can observe the RMS values of the
input signal.
AC-RMS
Use this setting when you only want to observe the RMS values of the input signal without the DC component.
Example
When you measure the RMS values of a 2 Vpeak sine wave, an approximately 1.4 VDC signal appears, as
shown in the figure on the right.
2 Vpeak
Approx. 1.4 V
RMS values are calculated using the following equation.
1
T
T
0
u(t)2 dt
u(t): Input signal, T: One cycle of the input signal
Given u(t) = Vmsinωt (where Vm is the peak value and ω is the angular velocity of 2πf, with f being the
frequency of the sine wave signal), the RMS value Vrms is:
Vrms =
Average of u(t)2 over one cycle
1
2π
=
2π
2
(Vmsinwt) dwt =
0
Vm
2
As shown in the example above, if Vm is 2 V, the RMS value Vrms is approximately 1.4 V.
DC-RMS
Use this setting when you want to observe the RMS values of the entire signal, including both the DC and AC
components.
Example
When you measure the RMS values of a 2 Vpeak sine wave with a 1 VDC component superimposed on it, an
approximately 1.7 VDC signal appears, as shown in the figure on the right.
2 Vpeak + 1 Vdc
Approx. 1.7 V
Given DC component Vdc and AC component u(t) = Vmsinωt, the RMS value Vrms (+ DC) of a sine wave
signal with a DC component superimposed on it is:
Vrms(+DC) =
1
2π
2π
2
(Vmsinwt + Vdc) dwt
0
=
Vm
2
2
+ (Vdc)
2
As shown in the example above, if Vdc is 1 V and Vm is 2 V, the RMS value Vrms (+DC) is approximately 1.7 V.
In RMS measurement mode, when a signal with an AC component below 40 Hz is acquired, because of the
characteristics of the RMS circuit, a ripple component is displayed, and the RMS values are not displayed
properly. DC signals are measured properly.
IM DL850-01EN
2-15
2 Vertical Axis
Voltage Measurement (For the 16-CH Voltage Input Module)
When you measure voltages using the 16-CH Voltage Input Module, the items that you have to set for each
input signal (sub channel 1 to sub channel 16) include vertical scales, the vertical positions, input coupling, the
bandwidth limit, the zoom method, the offset, waveform inversion, trace settings, and linear scaling.
You can connect wiring to the input terminals of the 720220 16-CH Voltage Input Module (16CH VOLT) to
measure voltages on 16 channels.
For information about how to connect the wiring, see section 3.13 in the Getting Started Guide, IM DL850-03EN.
Waveform Display (Display)
You can select whether to display each module’s input signal waveforms. You can turn the display of each main
channel (CH1, CH3, CH5, and CH7) on and off.
• ON: Displays the waveform
• OFF: Does not display the waveform
• The 16-CH Voltage Input Module only uses the odd main channels of the slot that it is inserted into. It
cannot use the slot’s even main channels.
• On the 16-CH Voltage Input Module, turning the display of a waveform on or off turns the displays of all of
the module’s sub channels on or off. To turn off the display of individual sub channels, turn off their input
coupling.
Setting All Sub Channels (All SubChannels Setup)
You can configure the settings of all sub channels while viewing the settings in a list. You can also copy the
various vertical axis settings of one sub channel to another sub channel. There are some items that cannot be
configured from the All Sub Channels Setup list.
Sub Channels 1 to 16 (Sub Channel 1 to 16)
The sub channel menu that corresponds to the key you pressed appears. You can set the various vertical axis
settings for each sub channel.
Labels (Label)
Vertical Scale (SCALE knob)
Waveform Vertical Position (Vertical POSITION knob)
Input Coupling (Coupling)
You can set the input coupling to DC, GND, or OFF. Sub channels whose coupling is set to OFF are not
measured or displayed.
Bandwidth (Bandwidth)
You can set the bandwidth limit to 500 Hz, or Full.
2-16
IM DL850-01EN
2 Vertical Axis
Zoom Method (V Scale), Zooming by Setting a Magnification (V Zoom), Zooming by
Setting Upper and Lower Display Limits (Upper/Lower)
Offset (Offset)
Trace Settings (Trace Setup)
Inverted Waveform Display (Invert), Linear Scaling (Linear Scale)
IM DL850-01EN
2-17
2 Vertical Axis
Setting All Sub Channels (All SubChannels Setup)
Input Settings (Setup)
You can configure the settings of all sub channels while viewing the settings in a list. The settings that you can
view and configure are listed below.
Display color, label (Label), coupling (Coupling), vertical scale (V Scale), bandwidth limit (Band Width), zoom
method (DIV/SPAN), offset (Offset), position (Position), magnification for zooming (V Zoom), display range
limits for zooming (Upper/Lower)
Linear Scaling (Linear Scale)
You can configure the linear scaling settings of all sub channels while viewing the settings in a list. The settings
that you can view and configure are listed below.
Linear scaling (Linear Scale); A and B for AX+B or P1:X, P1:Y, P2:X, and P2:Y for P1-P2; unit string (Unit);
display mode (Disp Type); number of decimal places (Decim Num); unit prefix (Sub Unit)
Copy (Copy to)
You can copy the various vertical axis and linear scaling settings of one sub channel to another sub channel.
• Source sub channel (Source Sub Channel)
You can set the source sub channel to a channel from channel 1 to 16.
• Destination sub channel (DestinationSub Channel)
You can set the destination sub channels by using the following options.
Select ALL ON to select all sub channels, select ALL OFF to unselect all sub channels, and select
individual sub channels by selecting numbers 1 to 16.
• Execute (Execute)
Select Execute to copy the settings.
The waveform display color and label settings are not copied.
Notes about Using the 16-CH Voltage Input Module
2-18
IM DL850-01EN
2 Vertical Axis
Temperature Measurement
For temperature measurement, the items that have to be set for each input signal (CH1 to CH16) include vertical
scales, the vertical positions, input coupling, thermocouple type, the bandwidth limit, trace settings, temperature
settings, and the temperature unit.
You can connect a thermocouple to one of the temperature modules, 701261 (UNIVERSAL), 701262 (UNIVERSAL
(AAF)), or 701265 (TEMP/HPV), and measure temperatures.
For information about how to connect thermocouples, see section 3.8 in the Getting Started Guide, IM DL85003EN.
Waveform Display (Display)
Select whether to display each channel’s input signal waveform.
• ON: Displays the waveform
• OFF: Does not display the waveform
Labels (Label)
Input Coupling (Coupling)
Set the coupling to TC when you are measuring temperature using the 701261 (UNIVERSAL), 701262
(UNIVERSAL (AAF)), or 701265 (TEMP/HPV).
To measure voltage, set the input coupling to an appropriate voltage measurement setting.
Thermocouple Type (Type)
Select the appropriate thermocouple type for thermocouple that you are using.
You can select thermocouple type from the options listed below.
When the input terminals are open, the displayed value is less than or equal to the lower limit of the
measurement range.
Type
K
E
J
T
L
U
R
S
B
N
W
Au7Fe (AuFe-chromel)
Measurement Range
−200 to 1300°C
−200 to 800°C
−200 to 1100°C
−200 to 400°C
−200 to 900°C
−200 to 400°C
0 to 1700°C
0 to 1700°C
400 to 1800°C
0 to 1300°C
0 to 2300°C
0 to 300 K
Bandwidth (Bandwidth)
You can set the bandwidth limit to 2 Hz, 8 Hz, 30 Hz, or Full.
IM DL850-01EN
2-19
2 Vertical Axis
Display Range (Upper/Lower)
To display the measured waveform on the screen, you need to set upper and lower display range limits that are
appropriate for the input.
Maximum Range
• −5432 to 5432°C (when the resolution is 0.1°C)
• −5432 to 5432 K (when the resolution is 0.1 K)
The minimum span is 2°C (or 2 K).
Temperature Unit (Unit)
You can set the temperature unit to °C or K. The default setting is °C.
Trace Settings (Trace Setup)
Reference Junction Compensation and Burnout (Temperature Setup)
Reference Junction Compensation (RJC)
The voltage produced by thermocouple is based on the temperature of the point that you are measuring and the
temperature of the reference junction. Reference junction compensation (RJC) refers to the act of correcting for
the temperature of the measuring instrument and using it as a cold junction.
On the DL850/DL850V, you can turn the internal RJC circuit on and off.
• ON: Select ON to use the RJC circuit to perform reference junction compensation.
• OFF: Select OFF to check measured temperature values or use an external reference junction (0°C).
Normally, you should perform measurements with RJC set to ON.
When you set RJC to OFF and apply a voltage that corresponds to a temperature t to an input terminal, if the
measured temperature does not match temperature t, the DL850/DL850V or the module may be damaged.
Contact your nearest YOKOGAWA dealer.
Burnout (Burn Out)
Sets the operation to perform when thermocouple detects a burnout (circuit break).
• ON: When a burnout is detected, the measured value is fixed at the upper limit of the measurement range of
thermocouple.
• OFF: Burnouts are not detected.
The default setting is OFF.
2-20
IM DL850-01EN
2 Vertical Axis
Strain Measurement
For strain measurement, the items that have to be set for each input signal (CH1 to CH16) include vertical
scales, sensor settings, the bandwidth limit, the display range, the range unit, trace settings, waveform inversion,
and linear scaling.
To measure strain, connect a strain measurement bridge (bridgehead) or a strain gauge transducer to the
701270 (STRAIN_NDIS) or 701271 (STRAIN_DSUB) strain module.
For information about how to connect a bridgehead, see section 3.9 in the Getting Started Guide, IM DL85003EN.
•
•
•
•
•
•
•
•
•
•
•
•
Waveform Display (Display)
Labels (Label)
Vertical Scale (SCALE knob)
Setting the Sensor (Sensor Setup)
Performing Strain Balancing (Exec Balance)
Bandwidth (Bandwidth)
Display Range (Upper/Lower)
Range Unit (Range Unit)
Trace Settings (Trace Setup)
Inverted Waveform Display (Invert)
Linear Scaling (Linear Scale)
About Shunt Calibration
Waveform Display (Display)
Select whether to display each channel’s input signal waveform.
• ON: Displays the waveform
• OFF: Does not display the waveform
Labels (Label)
Vertical Scale (SCALE knob)
You can select one of the following measurement ranges.
When μSTR Is Selected
500μSTR, 1000μSTR, 2000μSTR, 5000μSTR, 10000μSTR, 20000μSTR
For information about the measurement ranges, see section 6.13 in the Getting Started Guide, IM DL850-03EN.
When mV/V Is Selected
0.25 mV/V, 0.5 mV/V, 1 mV/V, 2.5 mV/V, 5 mV/V, 10 mV/V
For information about the measurement ranges, see section 6.13 in the Getting Started Guide, IM DL850-03EN.
The number that appears to the right of the range display is the maximum input at the current bridge voltage
converted into a voltage value. It is the maximum input voltage for the selected range.
IM DL850-01EN
2-21
2 Vertical Axis
Setting the Sensor (Sensor Setup)
Bridge Voltage (Excitation)
You can select the voltage to apply to the bridgehead.
• 2V: When the bridgehead resistance (bridge resistance) is 120 Ω to 1000 Ω
• 5V*: When the bridge resistance is 350 Ω to 1000 Ω
• 10V*: When the bridge resistance is 350 Ω to 1000 Ω
You cannot change the bridge voltage during waveform acquisition.
* The bridge voltage can only be set to 5 V or 10 V when:
• The bridge resistance is 350 Ω or more
• The strain gauge transducer supports a bridge voltage of 5 V or 10 V
Gauge Factor (Gauge Factor)
You can set the gauge factor of the strain gauge.
Selectable range: 1.90 to 2.20 (in steps of 0.01)
The gauge factor is a constant that is unique to the gauge. It should be listed in the manual or other
documentation for your gauge. You cannot change the gauge factor during waveform acquisition.
Gauge Factor When mV/V Is Selected (Gauge Factor: K)
On the DL850/DL850V, you can specify the gauge factor. If there is no recommended gauge factor for the strain
gauge transducer, set the gauge factor to 2.00. For factors other than 2.00, e is computed with in the DL850/
DL850V using the following equation.
e = (4/K) × (V/E)
e: The measured value of the strain gauge transducer (mV/V).
V: The measured bridge voltage (V)
E: The applied bridge voltage (V)
K: The gauge factor
When you change the unit of a channel, the units for all the items related to the channel change.
• Upper and lower limits (Upper/Lower)
• Trigger level (Level)
• Automated measurement values of waveform parameters, cursor-measurement values, etc.
Performing Strain Balancing (Exec Balance)
You can automatically compensate for the unbalanced part of the bridge resistance. It takes a few seconds for
balancing to be performed.
Range within which balancing is performed:
• ±10000 μSTR (when μSTR is selected)
• ± 5 mV/V (when mV/V is selected)
Bandwidth (Bandwidth)
You can set the bandwidth limit to 10 Hz, 100 Hz, 1 kHz, or Full.
Display Range (Upper/Lower)
To display the measured waveform on the screen clearly, you can set upper and lower display range limits that
are appropriate for the input.
Selectable range:
• −3.0000E+04 to +3.0000E+04 (when μSTR is selected)
• −1.5000E+01 to +1.5000E+01 (when mV/V is selected)
Set the limits so that the upper limit is greater than the lower limit.
2-22
IM DL850-01EN
2 Vertical Axis
Range Unit (Range Unit)
Set the range unit.
• μSTR: Units of strain (×10−6 strain)
• mV/V: Units of strain-gauge-transducer output*
The default setting is units of strain (μSTR). The relationship between μSTR and mV/V is shown in the equation
below.
(mV/V) = 0.5 × (μSTR)/1000
Example
500 (μSTR) -> 0.5 × 500 (μSTR)/1000 = 0.25 (mV/V)
* A unit that corresponds to the strain gauge transducer’s output. It indicates the amount of transducer output in
mV that corresponds to 1 V of applied bridge voltage. On the DL850/DL850V, the bridge voltage (excitation:
applied bridge voltage) can be set to 2 V, 5 V, or 10 V, but the mV/V values are converted and displayed, so
the measured values normally remain constant.
Trace Settings (Trace Setup)
Inverted Waveform Display (Invert)
Linear Scaling (Linear Scale)
The 701271 (STRAIN_DSUB) supports shunt calibration.
• When you measure strain, be sure to perform balancing.
• Only set the bridge voltage to 5 V or 10 V when the bridge resistance is 350 Ω or greater. The strain will
not be measured properly if you apply a bridge voltage of 5 V or 10 V when the bridge resistance is 350 Ω
or less.
• When you use a strain gauge transducer, be sure to use it at a bridge voltage that is within the transducer’s
recommended voltage range.
• Balancing cannot be performed if there is no strain measurement bridge (bridgehead) or strain gauge
transducer connected to the channel that you are trying to perform balancing on.
• When you perform balancing on all channels, if balancing fails on even one of the channels, an error
message will appear along with information about the channels for which balancing failed.
• After you turn on the power, connect a new strain gauge, or change the measurement range, bridge
voltage, or gauge factor, you need to perform balancing again before you perform measurement.
The scale value is displayed as “imbalance” immediately after you turn on the power or when you change
the range. In this kind of situation, perform balancing.
• When you change the unit of a channel, the units for all the items related to the channel change. This
includes the upper and lower limits, trigger level, automated measurement values of waveform parameters,
and cursor-measurement values.
IM DL850-01EN
2-23
2 Vertical Axis
About Shunt Calibration (Only on the 701271(STRAIN_DSUB))
The 701271 (STRAIN_DSUB) strain module supports shunt calibration.
Shunt calibration is a type of scaling in which the strain measurement gain is adjusted through the connection
in parallel of a known resistance (the resistance for shunt calibration, hereinafter referred to as the shunt
resistance) to the strain gauge. The strain module (701271 (STRAIN_DSUB)) supports shunt calibration with a
built-in shunt-calibration relay circuit.
To perform shunt calibration, you need a bridgehead that supports shunt calibration (the 701957 or 701958).
When correcting the gain on the negative side (normal)
Shunt calibration relay circuit (Built into the strain module.
Turns on and off automatically when shunt calibration is executed.)
Shunt resistor (connected to the bridgehead)
Bridge+
120 Ω
In+
In–
120 Ω
Bridge voltage
120 Ω
Bridge–
When correcting the gain on the positive side
Shunt calibration relay circuit (Built into the strain module.
Turns on and off automatically when shunt calibration is executed.)
Shunt resistor, when correcting the positive side
Bridge+
120 Ω
In+
In–
120 Ω
Bridge voltage
120 Ω
Bridge–
On the DL850/DL850V, in addition to performing normal shunt calibration (when the shunt-calibration relay circuit
is on), you can also set the zero-point value when the relay circuit is off. The zero-point value is valid when the
strain value after balancing is performed is not 0.
Linear Scaling Modes (Scaling Mode)
• Shunt
Select this mode to perform shunt calibration.
The other linear scaling modes are the same as those listed for voltage measurement.
2-24
IM DL850-01EN
2 Vertical Axis
• P1:X
When (Shunt Cal) Exec is performed, the input value when the relay circuit is off is applied.
• P1:Y
Set the value for when the relay circuit is off (normally 0).
• P2:X
When the relay circuit is on and (Shunt Cal) Exec is performed, the input value when the relay circuit is on is
applied.
• P2:Y
Set the strain value that corresponds to the shunt resistance when the relay circuit is on.
Shunt calibration
After execution. The gain is corrected.
Strain
Before execution
Current measured
value*
Strain input
P2:X
P2:Y
In the setup menu, set the strain value
corresponding to the shunt resistor to P2:Y.
* Obtained automatically when shunt calibration is performed
Executing Shunt Calibration (Shunt Cal)
• Exec
Executes shunt calibration.
Unit String (Unit String)
You can set the unit using up to four alphanumeric characters.
Display Type (Display Type)
The same as the linear scaling settings for voltage measurement.
For details about shunt calibration, see appendix 4.
• When you execute shunt calibration, select an appropriate range so that the measured values will stay
within the range when the shunt-calibration relay circuit is on. The DL850/DL850V attempts to perform
shunt calibration within the current range.
• An error message will appear if shunt calibration fails (because of out-of-range values or some other
reason). When this happens, change the range, and perform shunt calibration again.
IM DL850-01EN
2-25
2 Vertical Axis
Acceleration Measurement
For acceleration measurement, the items that have to be set for each input signal (CH1 to CH16) include vertical
scales, the vertical positions, input coupling, the bias, the bandwidth limit, the zoom method, the gain, trace
settings, sensitivity, and the unit.
The 701275 (ACCL/VOLT) acceleration module (with AAF) can measure acceleration by using the signal from
an acceleration sensor. You can connect it directly to an acceleration sensor with a built-in amp.
Load-output-type acceleration sensors without amp circuits cannot be connected directly to the 701275 (ACCL/
VOLT). For information about how to connect acceleration sensors, see section 3.11 in the Getting Started
Guide, IM DL850-03EN.
Waveform Display (Display)
Select whether to display each channel’s input signal waveform.
• ON: Displays the waveform
• OFF: Does not display the waveform
Labels (Label)
Vertical Scale (SCALE knob)
Waveform Vertical Position (Vertical POSITION knob)
Input Coupling (Coupling)
To measure acceleration with the 701275 (ACCL/VOLT), set the input coupling to ACCEL.
To measure voltage, set the input coupling to an appropriate voltage measurement setting.
Bias (Bias)
Select whether to supply bias current to the acceleration sensor.
• ON: Bias current is supplied to the acceleration sensor.
• OFF: Bias current is not supplied to the acceleration sensor.
• Do not connect an acceleration sensor when Bias is set to ON. Doing so may damage the DL850/DL850V.
• The bias current is 4 mA.
Bandwidth (Bandwidth)
You can set the bandwidth limit to 40 Hz, 400 Hz, 4 kHz, Auto, or Full.
When you set the bandwidth limit to Auto, an anti-aliasing filter (AAF) and low-pass filter are set in accordance
with the sample rate, and high-frequency noise is removed from the input signal. By using an anti-aliasing filter
when you measure voltages, you can remove the aliasing in the FFT.
The filters can be used not just in acceleration measurements, but also in voltage measurements.
2-26
IM DL850-01EN
2 Vertical Axis
Zoom Method (V Scale), Zooming by Setting a Magnification (V Zoom), Zooming by
Setting Upper and Lower Display Limits (Upper/Lower)
Gain (Gain)
You can set the ratio of the output signal to the input signal to a value from 0.1 to 100.
The default setting is 1.
Trace Settings (Trace Setup)
Sensitivity (Sensitivity)
You can set the sensitivity of the acceleration sensor that you are using to a value between 0.10 mV/Unit and
2000.00 mV/Unit.
Unit (Unit)
Set the unit of acceleration to be displayed using up to four characters. The default setting is m/s2. Change the
unit as necessary.
Up to eight unit character strings can be stored in memory. You can recall stored character strings by pressing
the History soft key. Also, stored character strings can also be used by other acceleration modules on other
channels. This feature is useful when you want to set multiple channels to the same unit. The stored character
strings are not cleared when you turn the power off.
IM DL850-01EN
2-27
2 Vertical Axis
Frequency Measurement
For frequency measurement, the items that have to be set for each input signal (CH1 to CH16) include vertical
scales, the vertical positions, FV settings, the input settings, the zoom method, the offset, trace settings, and
linear scaling.
You can connect a sensor or probe to the 701280 (FREQ) frequency module and measure frequencies,
revolutions, periods, duty ratios, power supply frequencies, pulse widths, pulse integration, and velocities.
For the sensor connection method, see section 3.12 in the Getting Started Guide, IM DL850-03EN. For the
probe connection method, see section 3.5.
•
•
•
•
•
•
•
•
•
•
•
•
•
Waveform Display (Display)
Labels (Label)
Vertical Scale (SCALE knob)
Waveform Vertical Position (Vertical POSITION knob)
FV Settings (F/V Setup)
Settings for Each Item
Input Setup (Input Setup)
Zoom Method (V Scale)
Zooming by Setting a Magnification (V Zoom)
Zooming by Setting Upper and Lower Display Limits (Upper/Lower)
Offset (Offset)
Trace Settings (Trace Setup)
Linear Scaling (Linear Scale)
Waveform Display (Display)
Select whether to display each channel’s input signal waveform.
• ON: Displays the waveform
• OFF: Does not display the waveform
Labels (Label)
Vertical Scale (SCALE knob)
Waveform Vertical Position (Vertical POSITION knob)
FV Setting (F/V Setup) - frequency measurement
Measured Item (Function)
You can choose one of the following items to measure.
• Frequency (Frequency)
Frequency (Hz) = 1 ÷ Tw (s)
Measurable range: 0.01 Hz to 200 kHz
Tw(s)
2-28
IM DL850-01EN
2 Vertical Axis
• Revolutions (rpm)/Revolutions (rps) (Revolution(rpm)/Revolution(rps))
Revolutions (rpm) = Frequency (Hz) ÷ pulses per revolution (Nr) × 60
Measurable range: 0.01 rpm to 100000 rpm
Revolutions (rps) = Frequency (Hz) ÷ pulses per revolution (Nr)
Measurable range: 0.001 rps to 2000 rps
F(Hz)
Number of pulses per rotation: Nr
• Periods (Period)
Period (s) = Tw (s)
Measurable range: 5 μs to 50 s
• Duty Ratios (Duty)
Duty (%) = Thigh (s) ÷ Tw (s)
Or, Duty (%) = Tlow (s) ÷ Tw (s)
Measurable range: 0% to 100%
Tw(s)
Thigh(s) Tlow(s)
• Power Supply Frequencies (Power Freq)
Power supply frequency (Hz) = 1 ÷ Tw (s)
Resolution: 0.01 Hz
Measurable range: (50 Hz, 60 Hz, or 400 Hz) ± 20 Hz
Tw(s)
• Pulse Widths (Pulse Width)
Pulse width (s) = Thigh (s)
Or, pulse width (s) = Tlow (s)
Measurable range: 2 μs to 50 s
Thigh(s) Tlow(s)
• Pulse Integration (Pulse Integ)
Pulse integration = N (count) × physical amount per pulse (I)
Set the physical amount per pulse (I) to the distance or flow rate.
A suitable user-defined unit can be assigned to the specified physical amount.
Measurable range: Up to 2×10⁹ counts
N (count)
l
IM DL850-01EN
2-29
2 Vertical Axis
• Velocity (Velocity)
Velocity (km/h) = distance per pulse l (km) ÷ Tw (s) × 3600
Velocity (m/s) = distance per pulse l (m) ÷ Tw (s)
You can define unique distances and units (angular velocity and other units).
Measurable range: F (= 1/Tw) = 0.01 Hz to 200 kHz
Tw(s)
Distance per pulse (l)
Settings for Each Item
When Measuring Revolutions
Pulse/Rotation Setting (Pulse/Rotate)
Set the number of pulses per revolution to a value from 1 to 99999.
When Measuring Duty Ratios or Pulse Widths
• Measured Pulse Setting (Measure Pulse)
Set the type of pulse to measure to Positive or Negative.
When Measuring Duty Ratios
• Positive: The rising-pulse percentage is measured.
• Negative: The falling-pulse percentage is measured.
When Measuring Pulse Widths
• Positive: The rising-pulse width is measured.
• Negative: The falling-pulse width is measured.
When Positive Is Selected
Tp
Ta
Tb
When Negative Is Selected
Tp
Pulse width:
The width of Tp is
measured.
Ta
Duty:
Ta/Tb is measured.
Tb
Notes about Duty Ratio Measurement
During duty ratio measurement, the output changes to 0% or 100% when one of the following conditions is
met:
• A pulse is not received for a period of time equal to four times the period of the previous pulse (T).
• A pulse is not received for 20 seconds.
When Measure Pulse is set to Positive if one of the above conditions is met and the pulse input is low, the
ratio is 0%; if the pulse input is high, the ratio is 100%. When Measure Pulse is set to Negative if one of the
above conditions is met and the pulse input is high, the ratio is 0%; if the pulse input is low, the ratio is 100%.
T: Pulse period
The output is set to 0% when a time equal
to T × 4 or 20 s elapses after the last pulse
was input.
Status when the condition is met: Low
0% (when Measure Pulse is set to Positive)
2-30
IM DL850-01EN
2 Vertical Axis
When Measuring Power Supply Frequency
Center Frequency Setting (Center Frequency)
Set the center frequency to 50 Hz, 60 Hz, or 400 Hz.
When Measuring Pulse Integration
• Unit/Pulse Setting (Unit/Pulse)
You can set the physical amount per pulse to a value from −9.9999E+30 to 9.9999E+30.
• Unit Setting (Unit)
You can set the displayed pulse-integration unit as necessary using up to four characters.
• Over Limit Reset Setting (Over Limit Reset)
Select ON to reset the pulse count when the range is exceeded. If you do not want to reset the pulse count,
select OFF. The default setting is OFF.
• Manual Reset (Reset)
To manually reset the pulse count, select Exec.
When Measuring Velocity
• Distance/Pulse Setting (Distance/Pulse)
You can set the distance per pulse to a value from −9.9999E+30 to 9.9999E+30.
• Time Unit Setting (Time Unit)
You can set the unit of time to hour, min, or sec.
The output is automatically converted to the appropriate velocity for the specified time.
• Unit Setting (Unit)
Set the unit of velocity to be displayed using up to four characters. The default setting is m/s.
Filter (Filter)
• Smoothing (Smoothing)
The frequency module can display waveforms using real-time moving averages of the data. The moving
average order can be set through the specification of a time value from 0.1 ms to 1 s (the maximum number
of averages is 25000). The number of averages performed (moving average order) = the specified time ÷
40 μs.
The smoothing filter has the following characteristics.
• Smoothes out staircase patterns.
• Enables you to reduce measurement jitter and increase the resolution. Because of the increased
resolution, you can perform high-precision measurements, especially when you measure high frequencies
or use the offset feature and enlarge the waveform.
• Can be used with all frequency-module measurement items.
When using the smoothing
filter Filter order: 400 ms
Original waveform
IM DL850-01EN
2-31
2 Vertical Axis
When using the offset function and making measurements
by expanding near 100 kHz
Original waveform
Value/div:
200 Hz/div
Upper display
limit: 101 kHz
Lower display
limit: 99 kHz
When using the smoothing filter
Filter order: 50 ms
The accuracy
improves when
the smoothing
filter is used.
• Pulse Averaging (PulseAverage)
The input pulses are divided into groups of a specified number (1 to 4096 pulses) and measured. Pulse
averaging has the following characteristics.
• Enables you to eliminate the effects of missing pulses and inconsistent pulse intervals (inconsistencies in
the frequency or period waveform) on measurement.
• Even if you use pulse averaging, the measured results are displayed as per-pulse values, so there is no
need to reperform scaling.
• Pulse averaging can be used in measurements of frequencies, revolutions, periods, power supply
frequencies, pulse integration, and velocities.
N = 11
f1
f2
f3
When pulse averaging is used
When pulse averaging is not used
Deceleration and Stop Prediction
The 701280 (FREQ) automatically performs internal computation and displays waveforms by predicting the
deceleration curve and stop point even when the input pulse is suddenly cut off. This function enables the
measurement of waveforms of deceleration behavior that are close to the actual physical phenomenon in
applications in which the deceleration behavior of an object that has inertia is measured, such as in automobile
brake tests.
• Deceleration Prediction (Deceleration Prediction)
The deceleration curve is computed according to the following equation using the elapsed time after the pulse
input stops (Δt).
Frequency (f) = 1/elapsed time (Δt)
The deceleration prediction starts after the pulse input stops and a pulse period (T) of the pulse one period
before the pulse input stopped elapses.
• Stop Prediction (Stop Prediction)
The point at a specified time after the pulse input stops is considered a stop point, and the frequency is set to 0.
The time from the point when the pulse input stops to the point when the DL850/DL850V determines that the
object has stopped can be set to 1.5, 2, 3, ..., 9, or 10 times (10 options) the pulse period (T) of the pulse one
period before the pulse input stopped.
2-32
IM DL850-01EN
2 Vertical Axis
Pulse input stop
T×n
n: 1.5 to 10
f0
T
Deceleration
prediction
t
f = 1/ t
Stop prediction
0
Input Setup (Input Setup) - frequency measurement
Presets (Preset)
When you select a preset, the DL850/DL850V automatically configures appropriate settings for all the signals
(for some preset options, there are some settings that you will need to configure). You can select User to set
all the settings to user-defined values. There are 10 types of presets. For details about the settings of each
preset, see appendix 6.
• Logic 5V, Logic 3V, Logic 12V, Logic 24V
Use this preset when the output from the sensor or other equivalent item changes in the range of 0 V to 5
V (or 3 V, 12 V, or 24 V: supply voltage applied to the sensor). The voltage range is automatically set to the
optimum voltage range, and the threshold level is automatically set to one-half the voltage.
• Pull-up 5V
Use this preset when the sensor output is open collector or contact output. The pull-up function is enabled
only when this preset is selected. The pull-up voltage is approximately 5 V, and the pull-up resistor is 4.7 kΩ.
If you enable the pull-up function, set the input voltage to a value from 0 V to 5 V. If the input voltage exceeds
this range, the protection circuit is tripped, and the pull-up resistor is automatically cut off.
• Zero Cross (ZeroCross)
Use this preset when the input voltage changes around 0 V. The input coupling is automatically set to AC, and
the threshold level is automatically set to 0 V. When you set the voltage range, make sure that the maximum
amplitude does not exceed the voltage range.
• AC100V, AC200V
Use this preset when measuring the supply voltage of 100 V or 200 V power supply systems. The probe type
is automatically set to 10:1, the voltage range is automatically set to a value suitable for the input voltage and
probe factor, and the coupling is automatically set to AC. Be sure to use the isolated probe (700929) when
measuring the power supply voltage.
• Electromagnetic Pickup (EM Pickup)
Use this preset when connecting an electromagnetic pickup directly. The voltage range is automatically set to
±1 V, and the threshold level is automatically set to 0 V.
• User-Defined (User)
Use this preset to configure user-defined input conditions. The pull-up function cannot be enabled.
• When measuring high voltages exceeding 42 V (AC+DCpeak) on the 701280 (FREQ), be sure to use the
isolated probe (700929).
• Use EM Pickup only when connecting an electromagnetic pickup.
• When the EM Pickup preset is selected, the LEDs of the frequency module do not illuminate in red, even
when the range is exceeded.
• The DL850/DL850V does not support electromagnetic pickups that need to have power supplied to them
or pickups that require terminators at the output. Handle these types of electromagnetic pickups using
sensors.
• Keep the output of the electromagnetic pickup within 42 VP-P. The minimum sensitivity is 0.2 VP-P. If the
output is less than the minimum sensitivity, the measured values may be unstable.
• When you use the pull-up function, do not let the voltage go outside the range of 0 to 5 V. If the voltage
goes outside of this range, the protection circuit will be tripped, and the pull-up circuit will be cut off.
IM DL850-01EN
2-33
2 Vertical Axis
The following 9 setup items are available.
Voltage Range (V Range)
You can set the input voltage range (±FS) to one of the options below.
• When the probe attenuation (Probe) is set to 1:1
±1 V, ±2 V, ±5 V, ±10 V, ±20 V, ±50 V (±FS)
• When the probe attenuation (Probe) is set to 10:1
±10 V, ±20 V, ±50 V, ±100 V, ±200 V, ±500 V (±FS)
Input Coupling (Coupling)
You can set the input coupling to DC or AC.
Probe Type (Probe)
You can set the probe type to 1:1 or 1:10.
Bandwidth (Bandwidth)
You can set the bandwidth limit to 100 Hz, 1 kHz, 10 kHz, 100 kHz, or Full. You cannot select Full when Preset is
set to AC100V or AC200V.
Threshold Level (Threshold)
You can set the level within the FS of the input voltage range. The resolution is the value that corresponds to 1%
of the FS.
Hysteresis (Hysteresis)
You can set the hysteresis to ±1%, ±2.5%, or ±5% of the FS of the input voltage range.
Slope (Slope)
Select
(rising) or
(falling).
Chattering Elimination (Chatter Elimination)
Eliminates the chattering that occurs in cases such as when the contact input is turned on or off. The changes in
the signal over the specified time can be discarded. You can set the interval to a value from 0 to 1000 ms (in 1
ms steps). When 0 ms is selected, chattering elimination is turned off.
Chattering elimination works on both rising and falling edges.
2-34
IM DL850-01EN
2 Vertical Axis
Pull Up (Pull Up)
You can only choose whether to enable the pull-up function when Preset is set to Pull-up 5V. You cannot
configure the pull-up setting when another preset is selected.
If you enable the pull-up function, set the input voltage to a value from 0 V to 5 V. If you apply a voltage that is
outside of this range, the internal protection circuit will cut off the pull-up circuit.
Internal Equivalent Circuit for When the Pull-up Function Is Enabled
+5 V
4.7 kΩ
990 kΩ
10 kΩ
Zoom Method (V Scale), Zooming by Setting a Magnification (V Zoom), Zooming by
Setting Upper and Lower Display Limits (Upper/Lower)
Offset (Offset)
Trace Settings (Trace Setup)
Linear Scaling (Linear Scale)
IM DL850-01EN
2-35
2 Vertical Axis
Logic Measurement
For logic measurement, the items that have to be set for each input signal (CH1 to CH16) include vertical scales,
the logic bit settings, the logic bit mapping, the zoom method, and trace settings.
You can measure logic signals by connecting a logic probe to the 720230 (LOGIC) logic module.
For information about how to connect logic probes, see section 3.10 in the Getting Started Guide, IM DL85003EN.
Waveform Display (Display)
Select whether to display each channel’s input signal waveform.
• ON: Displays the waveform
• OFF: Does not display the waveform
Labels (Label)
Waveform Vertical Position (Vertical POSITION knob)
Logic Bit Settings (Logic Bit Setup)
Bit Display (Display)
You can set whether to display the waveform of each bit.
Bit1 to Bit8, All Bits On, All Bits Off
Bit Name (Bit Name)
You can assign labels to bits using up to eight characters.
Chattering Elimination (Chatter Elimination)
For each bit, you can set whether to eliminate chattering. To eliminate chattering, select an elimination time.
OFF, 5msec, 10msec, 20msec, 50msec, 100msec
Bit Mapping (Bit Mapping)
• Fixed: Spaces are allocated for bits that are turned off.
• Auto: Spaces are not allocated for bits that are turned off. Only the bits that are turned on are displayed. The
bits are displayed in order from the top.
Fixed (When bit 7 is off)
A1
Auto (When bit 7 is off)
A1
A2
A2
A3
A3
A4
A4
A5
A5
A6
A6
A8
A8
2-36
IM DL850-01EN
2 Vertical Axis
Zooming by Setting a Magnification (V Zoom)
Trace Settings (Trace Setup)
Note about Logic Measurement
In the logic settings in the preferences, you can set the display format (Bit or Hex), the cursor order, and the bit
order.
IM DL850-01EN
2-37
2 Vertical Axis
CAN Bus Signal Monitoring (Applies to the DL850V)
You can monitor CAN bus signals using the CAN bus monitor module (720240). CAN bus signal monitoring is
only available on the DL850V.
The module can be connected as a node to an ISO-11898 CAN bus. The DL850V uses the module to read the
data frames transferred on the CAN bus and then extracts the specified portion of the data field (CAN data),
converts it to time series data, and displays its waveform. The module has two ports. Up to 16 sub channel
waveforms can be displayed for each port. You can specify (define) the CAN data using Vector Informatik CANdb
database files. Both the standard and extended formats are supported.
In addition, you can output single data frames or remote frames to a CAN bus at a specific time (one-shot
output).
For CAN bus signal monitoring using a CAN bus monitor module, the items that have to be set include port
settings, data extraction conditions, the sub channel display range, the unit of measurement, trace settings, and
scaling.
• You can install up to two CAN bus monitor modules (CAN MONITOR). CAN bus monitor modules can only
be installed in slots 7 and 8.
• The DL850V requires the following processing times to read data frames transferred on the CAN bus. New
data frames that the DL850V receives during these processing times may be discarded.
Number of Channels Used per Port
1
8
16
One Port in Operation
40 μs
60 μs
80 μs
Two Ports in Operation
80 μs
120 μs
160 μs
Waveform Display (Display)
You can select whether to display each port’s input signal waveforms. Each port corresponds to one of the CH13
to CH16 keys.
• ON: Displays the waveform
• OFF: Does not display the waveform
Reading Data Frames (Port Configuration)
Port Settings (Port Setup)
• Bit Rate (Bit Rate)
Select the CAN bus signal transmission speed from one of the options below.
10k, 20k, 33.3k, 50k, 62.5k, 83.3k, 125k, 250k, 500k, 800k, 1Mbps
• Sample Point (Sample Point)
Select the sample point for each bit from one of the options below.
71%, 78%, 85%
• Resynchronization Jump Width (Sync Jump Width)
Set the correction value used to synchronize the bit timing between sending and receiving nodes.
1 to 4 in units of Tq (Time Quantum)
• Number of Samples (Bit Sample Num)
You can set the number of samples at each bit’s sample point.
1: The sample point data is sampled once. We recommend that you use this setting for high-speed busses.
3: The sample point data is sampled three times. We recommend that you use this setting for slow and
medium speed busses.
• Listen Only (Listen Only)
ON: The ACK bit is not transmitted.
OFF: The ACK bit is transmitted.
2-38
IM DL850-01EN
2 Vertical Axis
• Terminator (Terminator)
ON: The 120 Ω terminator between CAN_H and CAN_L on the CAN bus line is turned on.
OFF: The terminator between CAN_H and CAN_L on the CAN bus line is turned off.
CAN I/F
CAN TRANSCEIVER
7 CAN_H
CAN_H
60 Ω
60 Ω
2 CAN_L
CAN_L
3 GND
0.1 μF
6 GND
CAN Data Extraction Conditions
You can use the extraction conditions to specify which portion of the CAN data in the data field to assign to each
sub channel. For each port, you can configure up to 16 sub channels (up to 60 sub channels on modules whose
firmware version is 1.2 or later).
When the data field contains two units of data
bit 64
56
48
40
32
24
16
CH15_2
8
0
CH15_1
• Start Bit = 0, Bit Count = 16bit → 2-byte integer (CH15_1)
• Start Bit = 32, Bit Count = 32bit → 4-byte integer (CH15_2)
4-byte real numbers can be extracted by modules whose firmware version
is 1.2 or later.
• Input (Input)
ON: The data is monitored.
OFF: The data is not monitored or displayed.
• Labels (Label)
You can specify a name of up to 16 characters in length for each channel.
You can use the DISPLAY menu to set whether to display labels.
• Message Format
Set the message format of the collected data frames.
STD: Standard format
XTD: Extended format
• ID
Set the message ID of the collected data frames.
Standard format: 0 to 7FFH (11 bits)
Extended format: 0 to 1FFFFFFFH (29 bits)
• Byte Count
Set the byte count.
Auto, 1 to 8
IM DL850-01EN
2-39
2 Vertical Axis
• Start Bit
Specify the bit number of the data extraction starting point.
0 to 63
• Bit Count
Specify the number of data bits to extract.
2 to 16 (32 for firmware versions 1.2 and later)
However, when the data type is set to Float, the only bit length that can be set is 32.
• Byte Order
Select the method (endian) to use to store the data in the acquisition memory.
Big Endian
56 55
63
MSB
0
8 7
•••••
LSB
•••••
0
7
msb
•••••
lsb
MSB:
LSB:
msb:
lsb:
Most significant byte
Least significant byte
Most significant bit
Least significant bit
MSB:
LSB:
msb:
lsb:
Most significant byte
Least significant byte
Most significant bit
Least significant bit
Little Endian
0 15
7
LSB
•••••
•••••
MSB
0
7
msb
56
55 63
•••••
lsb
CAN Data Conversion Conditions
• Value Type
Select the data type of the extracted CAN data.
Unsigned: Unsigned integer
Signed: Signed integer
Float: Real number (applies to modules whose firmware version is 1.2 or later)
Logic: Boolean
• Factor/Offset
Configure these settings when the data type is set to Unsigned, Signed or Float. The DL850/DL850V uses the
factor and offset values that you set here to convert extracted data to physical values
Factor: Scaling coefficient (value per bit)
Offset: Offset value
Selectable range: −9.9999E+30 to +9.9999E+30
• Unit
Using up to 16 characters, enter the unit to display for the waveform.
2-40
IM DL850-01EN
2 Vertical Axis
Loading a CAN Data Definition File (Setup File Read)
You can configure the CAN data extraction conditions by loading a CAN data definition file (an SBL file*).
Data that has been edited using Symbol Editor* is assigned to DL850V's sub channels 1 to 16 according to the
order in the definition list (the order can be changed as you like on the Symbol Editor's definition list).
* An SBL file (.SBL extension) is a CANdb file (.dbc extension) that has been converted and edited into
a physical value/symbol definition file using YOKOGAWA’s free Symbol Editor software. You can obtain
Symbol Editor from the YOKOGAWA website (http://www.yokogawa.com/tm/).
CANdb files (.dbc) are signal definition database files created using the CANdb or CANdb++ software
produced by Vector Informatik.
Sub Channels 1 to 16 (Sub Channel 1 to 16)
(You can configure up to 60 sub channels on modules whose firmware version is 1.2 or later.)
Configure the display-label, scaling-method, and display-range settings of the specified sub channel.
Labels (Label)
Scaling (Scale)
Auto: The upper and lower display range limits are set automatically.
Default: To the greatest extent possible within the settable range, the maximum and minimum values are used to
set the display range setting (which is explained below) of the specified sub channel.
Display Range (Upper/Lower)
Specify the upper and lower limits of the waveform display range.
Selectable range: −30.000E+30 to +30.000E+30
One-Shot Output (One shot out)
A single specified data frame or remote frame is output at the specified time.
Message Format
Select the message format.
STD: Standard format
XTD: Extended format
ID
Set the message ID of the output data frame.
Standard format: 0 to 7FFH (11 bits)
Extended format: 0 to 1FFFFFFFH (29 bits)
DLC
Set the byte size of the data area of the data frame.
Selectable range: 1 to 8
Data(Hex)
In hexadecimal notation, specify the data frame value to output.
IM DL850-01EN
2-41
2 Vertical Axis
One shot out
Output the data.
You cannot output the data when in the Port Setup menu, Listen Only is set to ON.
Trace Settings (Trace Setup)
Configuring the Scales of All Sub Channels (All SubChannel Scale)
Configure the scales of all sub channels.
All SubChannel Auto: The upper and lower display range limits are set automatically.
All SubChannel Default: To the greatest extent possible within the settable range, the maximum and minimum
values are used to set the upper and lower limits of all sub channels.
Frame Formats
Data Frames
• Standard format
Data Frame
Arbitration Field Control Field
4
8N (0 ≤ N ≤ 8)
15
Recessive
ACK Boundary
Data
ACK slot
DLC
3-0
CRC
Sequence
11 1 1 1
ACK
CRC Field
CRC Boundary
RB0
IDE
RTR
SOF
1
ID 28-18
Data Field
EOF
Dominant
11 1 7
• Extended format
Data Frame
Control Field Data Field
Arbitration Field
CRC
Sequence
1 1 1
4
8N (0 ≤ N ≤ 8)
15
ACK Slot
18
Data
ACK Boundary
1 1
DLC
3-0
ACK
CRC Boundary
11
ID 17-0
RB0
RB1
RTR
1
IDE
SRR
SOF
ID 28-18
CRC Field
EOF
1 1 1 7
Remote Frames
• Standard format
Remote Frame
Arbitration Field Control Field
1 1 1
4
15
ACK Boundary
CRC
Sequence
CRC Boundary
11
DLC
3-0
ACK
ACK Slot
1
RB0
IDE
RTR
SOF
ID 28-18
CRC Field
Recessive
EOF
11 1
7
Dominant
• Extended format
Remote Frame
Arbitration Field
18
1 1 1
4
15
ACK Boundary
1 1
CRC
Sequence
CRC Boundary
11
DLC
3-0
ACK Slot
IDE
SRR
1
ID 17-0
ACK
CRC Field
RB0
RB1
RTR
SOF
ID 28-18
Control Field
EOF
1 1 1 7
Motorola’s Forward format setting is not supported.
2-42
IM DL850-01EN
2 Vertical Axis
Displaying the Menu for Configuring All Channels (ALL CH)
Input Settings (Setup)
You can configure the settings of all channels while viewing the settings in a list. You can also set all the settings
for a type of item at once and copy the various vertical axis settings of one channel to another channel. There
are some items that cannot be configured from the ALL CH list.
Measurement Type Settings
Voltage
Waveform display color, waveform display (Disp), label (Label), coupling (Coupling), vertical
scale (V Scale), bandwidth limit (Band Width), zoom method (DIV/Scale), offset (Offset), position
(Position), magnification for zooming (V Zoom), display range limits for zooming (Upper/Lower),
probe attenuation and current-to-voltage conversion ratio (Probe)
Voltage (for the
Waveform display color, waveform display (Disp), label (Label), coupling (Coupling), vertical
16-CH Voltage Input scale (V Scale), bandwidth limit (Band Width), zoom method (DIV/Scale), offset (Offset), position
Module)
(Position), magnification for zooming (V Zoom), display range limits for zooming (Upper/Lower)
Temperature
Waveform display color, waveform display (Disp), label (Label), coupling (Coupling),
thermocouple type (Type), bandwidth limit (Band Width), display range settings (Upper/Lower),
reference junction compensation (RJC), burnout (Burn Out)
Strain
Waveform display color, waveform display (Disp), label (Label), range unit (Range Unit),
measurement range (Range), bandwidth limit (Band Width), display range settings (Upper/
Lower), gauge factor (Gauge Factor), bridge voltage (Excitation)
Acceleration
Waveform display color, waveform display (Disp), label (Label), coupling (Coupling), gain (Gain),
bandwidth limit (Band Width), zoom method (DIV/Scale), position (Position), magnification for
zooming (V Zoom), display range limits for zooming (Upper/Lower), sensitivity (Sensitivity)
Frequency
Waveform display color, waveform display (Disp), label (Label), measured item (Function),
vertical scale (V Scale), zoom method (DIV/Scale), offset (Offset), position (Position),
magnification for zooming (V Zoom), display range limits for zooming (Upper/Lower), center
frequency (CenterFreq), input settings (Input)
Logic
Waveform display color, waveform display (Disp), label (Label), bit display (Bit Display),
chattering elimination (Chatter Elim.), position (Position), magnification for zooming (V Zoom), bit
mapping (Mapping)
* In the menu for configuring all channels, for channels that correspond to CAN bus monitor modules, you
can only set the Display setting, which determines whether waveforms are displayed.
Linear Scaling (Linear Scale)
You can configure the linear scaling settings of all channels while viewing the settings in a list. The settings that
you can view and configure are listed below. This function is the same as the linear scaling function for voltage
measurement.
Linear scaling (Linear Scale); A and B for AX+B or P1:X, P1:Y, P2:X, and P2:Y for P1-P2; unit string (Unit);
display mode (Disp Type); number of decimal places (Decim Num); unit prefix (Sub Unit)
The 701271 (STRAIN_DSUB) strain module supports shunt calibration.
Copy (Copy to)
You can copy the various vertical axis and linear scaling settings from one channel to other channels whose
modules are of the same type as the source channel.
Source Channel (Source Channel)
Set the source channel to a channel from CH1 to CH16 or to 16chVOLT.*
* If the 16-CH Voltage Input Module is installed. After you select 16chVOLT, select a sub channel.
Destination Channels (Destination Channel)
You can set the destination channels by selecting ALL ON, ALL OFF, and CH1 to CH16.
Execute (Execute)
Select Execute to copy the settings.
IM DL850-01EN
2-43
2 Vertical Axis
• When the 16-CH Voltage Input Module is installed, you can also copy the settings of the sub channels. You
can only specify channels as copy destinations.
• The waveform display color and label settings are not copied.
Strain Balance (Strain Balance)
You can perform strain balancing on multiple installed strain modules.
CH1 to CH16
Select the modules that you want to perform strain balancing on.
Balance (Balance): Execute (Execute)
Select to perform strain balancing.
For information about strain balancing, see the section on strain measurement.
You cannot select channels in which strain modules are not installed.
2-44
IM DL850-01EN
3
Horizontal Axis
Time Axis Setting (TIME/DIV)
When the internal clock is being used, the time axis scale is set as a length of time per grid division (1 div).
The time axis scale can be set within the following ranges: 100 ns/div* to 30 s/div, 1 min/div to 30 min/div, 1
hour/div to 12 hour/div, and 1 day/div to 3 day/div. The transition from seconds to minutes to hours to days
occurs automatically. Because the horizontal display range is 10 div, the amount of time on the waveform that is
displayed is equal to the time axis setting × 10.
* When the 720210 (HS100M12) module is installed, the scale range starts at 100 ns/div; when it is not
installed, the scale range starts at 1 μs/div.
1 div = 500 µs
10 div = 5 ms
1 div = 1 ms
10 div = 10 ms
Internal and External Clocks (Time base selection)
Under the initial settings, the DL850/DL850V samples the waveform data using the clock signal produced by its
internal time-base circuit (internal clock).
You can also use an external clock signal to control sampling. Apply the external clock signal to the externalclock input terminal on the left panel of the DL850/DL850V. This external clock input is useful for synchronizing
to the clock signal of the waveform that is being measured.
When you control sampling using an external clock, you cannot change the time axis setting. To change the
time-axis display range, change the record length or zoom in on the time axis.
IM DL850-01EN
3-1
3 Horizontal Axis
How the Time Axis Relates to the Display of the Waveform
There are 10 div along the time axis, and 1001 points (logical number of points, not the dots on the screen) are
used to draw the waveforms. Therefore, if the display record length is exactly 1 kpoint (the number of acquired
data points is 1001), the waveform is displayed using 1001 points. However, if the display record length is
greater than or equal to 2 kpoint, as shown in the figure on the right, the DL850/DL850V draws the waveform
by determining the maximum and minimum values at each fixed interval (P-P compression) and aligning them
vertically at the same time position (total number of points: 2002).
Sampled data
Record length
Maximum value
Minimum value
Vertical axis
0
1001 points*
1000
* 1001 is the logical number of
points. On the screen, the data
is compressed to 800 or 500
dots (1000 dots in the
full-screen waveform display).
Time axis
<P-P compression display>
Zooming Horizontally and Drawing Waveforms
The DL850/DL850V can expand (zoom) the waveform horizontally. When the zoom factor of the waveform
is increased, the number of displayed points decreases. The DL850/DL850V displays the waveform using
P-P compressed until the number of displayed points falls to 2002, but it cannot display the waveform using
continuous lines when the number of displayed points falls below 1001. When this happens, the DL850/DL850V
interpolates the display data so that the number of displayed points is 1001.
Dot Display
Under the initial settings, display interpolation is performed automatically, but you can also disable display
interpolation (set it to OFF) and display the waveform using dots. When interpolation is disabled, up to 2002
points or 100100 points (whichever is selected) of all the acquired data are displayed without P-P compression.
For example, if the number of displayed points is set to 100 kpoint and the display record length is 10 kpoint (the
number of acquired data points is 10010 points), the DL850/DL850V draws all the points of the waveform by
aligning 10 points vertically at the same time axis position. If the number of acquired data points exceeds 2002
or 100100, to display the waveform, the DL850/DL850V reduces the amount of data to 2002 or 100100 points
(whichever is selected) by removing the data between displayed points.
Relationship between the Time Axis Setting, Record Length, and Sample Rate
If you change the time axis setting, the sample rate and the acquisition-memory record length also change. For
details, see appendix 1, “Relationship between the Time Axis Setting, Record Length, and Sample Rate” in the
Getting Started Guide, IM DL850-03EN.
3-2
IM DL850-01EN
3 Horizontal Axis
Sample Rate
If you change the time axis setting, the sample rate also changes. The sample rate is the number of samplesper-second (S/s).
* If the sample rate is comparatively low with respect to the input signal frequency, the harmonics contained in
the signal are lost. When this happens, some of the harmonics will be misread as low-frequency waves due
to the effects described by the Nyquist sampling theorem. This phenomenon is called aliasing. You can avoid
aliasing by acquiring waveforms with the acquisition mode set to Envelope.
Aliased signal
Input signal
Sampled points
Time Axis Setting and Roll Mode Display
When the trigger mode is Auto, Auto Level, Single, or On Start and the time axis setting is 100 ms/div or longer,
instead of updating waveforms through triggering (update mode), the DL850/DL850V displays the waveforms
in roll mode. In roll mode, waveforms scroll from right to left as new data is captured and the oldest values are
deleted from the screen.
This allows waveforms to be observed in the same way as on a pen recorder. Roll mode is useful for observing
signals with long repeating periods and signals that change slowly. It is also effective when you want to detect
occasional glitches (pulse signals in the waveform).
You can use auto setup to automatically configure the appropriate settings (such as vertical axis, horizontal
axis, and trigger settings) for the input signal. This feature is useful when you are not sure what type of signal
will be applied to the DL850/DL850V. The auto setup feature will not work properly on some input signals.
Also, there are some modules with which the auto setup feature cannot be used.
Notes about Using the 16-CH Voltage Input Module
IM DL850-01EN
3-3
4
Triggering
A trigger is a cue used to display the waveform on the screen. A trigger occurs when the specified trigger
condition is met, and a waveform is displayed on the screen.
Trigger Mode (MODE)
The trigger mode determines the conditions for updating the displayed waveforms. There are six trigger modes.
Auto Mode (Auto)
If the trigger conditions are met before an approximately 50 ms timeout, the DL850/DL850V updates the
displayed waveforms on each trigger occurrence. If not, the DL850/DL850V automatically updates the displayed
waveforms. Even when Auto mode is specified, the DL850/DL850V operates in Normal mode when the trigger
source is set to Time and a simple trigger is used.
If the time axis is set to a value that would cause the display to switch to roll mode, roll mode display will be
enabled.
Auto Level Mode (AutoLevel)
If a trigger occurs before a timeout (which is approximately 1 second), the DL850/DL850V updates the waveform
in the same way that it does in Auto mode. If a trigger does not occur, the DL850/DL850V detects the center
value of the trigger source amplitude, automatically changes the trigger level to the center value, triggers on
that value, and updates the displayed waveform. Auto-level mode is only valid if the trigger source is an analog
waveform on a channel between CH1 and CH16 (including sub channels). For all other cases, Auto Level mode
operates in the same way as Auto mode.
If the time axis is set to a value that would cause the display to switch to roll mode, roll mode display will be
enabled.
Normal Mode (Normal)
The DL850/DL850V only updates the waveform display when the trigger conditions are met. If no triggers occur,
the display is not updated. If you want to view waveforms that the DL850/DL850V cannot trigger on, or if you
want to check the ground level, use Auto mode.
Single Mode (Single)
When the trigger conditions are met, the DL850/DL850V updates the displayed waveform once and stops
waveform acquisition.
If the time axis is set to a range that causes the display to switch to roll mode, the roll mode display will be
enabled. When the DL850/DL850V triggers, it begins recording data. When data has been acquired up to the
amount specified by the set record length, the waveform display stops.
N Single Mode (SingleN)
The DL850/DL850V acquires waveforms each time the trigger conditions are met until a specified number of
waveforms have been acquired, and then displays all the acquired waveforms. If no triggers occur, the display is
not updated.
Instant Start Mode (On Start)
Regardless of the trigger settings, when you press the START key, the DL850/DL850V updates the displayed
waveforms once and stops signal acquisition.
If the time axis is set to a value that would cause the display to switch to roll mode, roll mode display will be
enabled. When data has been acquired up to the amount specified by the set record length, the waveform
display stops.
• The trigger mode setting applies to all trigger types.
• When waveforms are being acquired, the trigger condition appears in the center of the bottom of the
screen.
IM DL850-01EN
4-1
4 Triggering
Trigger Types (Type)
The following trigger types are available.
Simple (Simple)
• Simple trigger: Simply triggers on a trigger source edge.
In addition to using the signals (analog signals and logic signals) applied to the modules installed in the slots
as trigger sources, you can also use the time, an external signal (the signal applied to the TRIG IN terminal),
or the power line signal as a trigger source.
Enhanced (Enhanced)
• A -> B(N) trigger: After state condition A is met, the DL850/DL850V triggers when the state condition B is met
N times.
• A Delay B trigger: After state condition A is met and the specified amount of time elapses, the DL850/DL850V
triggers when the state condition B is first met.
• Edge On A trigger: While state condition A is met, the DL850/DL850V triggers on the OR of multiple trigger
source edges.
• OR trigger: The DL850/DL850V triggers on the OR of multiple trigger source edges.
• AND trigger: The DL850/DL850V triggers on the AND of multiple trigger source conditions.
• Period trigger: The DL850/DL850V triggers on a specified period of occurrence of state condition B.
• Pulse Width trigger: The DL850/DL850V triggers after state condition B has been met for a specified duration
(width).
• Wave Window trigger: The DL850/DL850V creates real-time templates (Wave Window) using a number of
cycles directly preceding the current waveforms. The DL850/DL850V compares the current waveforms to the
real-time templates and triggers if one of the current waveforms falls outside of its real-time template.
* A state condition is a condition that is met when the levels of specified trigger sources are High or Low relative
to a specified trigger level. If you set a signal to X (Don’t Care), the state of the specified signal is not used to
determine whether the state condition is met.
Manual Trigger (Manual Trigger)
Regardless of the trigger settings, you can make the DL850/DL850V trigger by pressing the MANUAL TRIG key
on the front panel.
Signal Type and Trigger Type Combinations
The signal type (analog or logic) determines what trigger types you can use.
Simple
A -> B(N)
A Delay B
Edge On A
OR
AND
Period
Pulse Width
CH1 to CH16
Analog Signal
Logic Signal
(including sub channels)
Bit 1 to Bit 8
Yes
Yes
Yes
Yes
Yes
Yes
Yes
Yes
Yes
Yes
Yes
Yes
Yes
Yes
Yes
Yes
Mixed
−
Yes
Yes
Yes
Yes
Yes
Yes
Yes
About the Wave Window Trigger
Basic Trigger Settings
•
•
•
•
Trigger source: The trigger source signal.
Trigger slope: Specifies which edge, rising or falling, the DL850/DL850V will trigger on.
Trigger level: The trigger determination level.
Trigger hysteresis: The trigger level margin (the DL850/DL850V does not trigger on changes in the signal
level within this margin).
• Trigger hold-off: The amount of time to wait before the next trigger detection (applies to all triggers except for
the simple trigger when the trigger source is Time, the period trigger, and the manual trigger).
• Trigger position: The position where the trigger point will be displayed (applies to all trigger types).
• Trigger delay: The delay from the trigger point (applies to all trigger types).
4-2
IM DL850-01EN
4 Triggering
Simple Trigger (Simple)
The DL850/DL850V triggers on trigger source edges (rising or falling edges). Edge refers to a point where the
trigger source passes through the trigger level.
Trigger level
Trigger source
The DL850 triggers here (at this edge)
when the trigger edge is set to rising ( ).
Trigger Source (Source)
The trigger source is the signal that is used to check for the trigger condition. You can set the source waveform
to one of the waveforms below.
Analog Signal (CH1 to CH16)
Select a channel from CH1 to CH16 to use the analog signal being applied to the corresponding terminal as the
trigger source.
CH1 to CH16,1 16chVOLT,2 CAN3
1 You can select the channel of an installed module.
2 If the 16-CH Voltage Input Module is installed. After you select 16chVOLT, select a sub channel.
3 On the DL850V when a CAN bus monitor module is installed. After you select CAN, select a sub channel.
However, you cannot select a sub channel whose Input setting is set to OFF.
Logic Signal (Bit 1 to Bit 8)
Select a bit from 1 to 8 to use the logic signal being applied to the port of a logic input module as the trigger
source. When a logic input module is installed in a slot, bits 1 to 8 appear as options below the channel that
corresponds to that slot (CH1 to CH16).
Time (Time)
Select Time to use the date and time as the trigger source. The trigger occurs at the specified date and time and
at specified intervals afterwards.
• Specify the year, month, day, hour, minute, and second.
• You can select one of the time intervals listed below.
10sec, 15sec, 20sec, 30sec, 40sec, 50sec, 1min, 2min, 3min, 4min, 5min, 6min, 7min, 8min, 9min, 10min,
15min, 20min, 25min, 30min, 40min, 45min, 50min, 1hour, 2hour, 3hour, 4hour, 5hour, 6hour, 7hour, 8hour,
9hour, 10hour, 11hour, 12hour, 18hour, 24hour
Specified date and time
Trigger
Trigger
Trigger
Time interval
• Depending on the specified time interval, a trigger may occur while the waveform is being acquired or in
the pre-trigger section (the section before the trigger that is acquired for observation). When this happens,
the trigger is ignored.
• If the specified date and time fall within the pre-trigger section, a trigger occurs at the end of the pre-trigger
section.
• If the specified date and time are in the past, triggers occur at the points in the present defined by the
function (specified date and time) + (time interval × integer N).
• If you set the number of acquisitions, the specified number of waveforms are acquired. When the specified
number of acquisitions is infinite, waveform acquisition continues until you press START/STOP.
IM DL850-01EN
4-3
4 Triggering
External Signal (External)
Select External to use the signal that is received through the left-panel TRIG IN input terminal as the trigger
source.
Power Line Signal (Line)
Select Line to use the power line signal received by the DL850/DL850V as the trigger source. The DL850/
DL850V only triggers on the rising edge. This option enables you to observe waveforms in synchronization with
the power supply frequency (50 Hz or 60 Hz).
Trigger Level (Level)
Trigger level refers to the signal level used as a reference for detecting a signal’s rising and falling edges or
high and low states. With simple triggers such as the edge trigger, the DL850/DL850V triggers when the trigger
source level passes through the specified trigger level.
The range and resolutions that you can use to set the trigger level vary depending on the type of signal being
measured.
When Measuring Voltage
Selectable range: ±10 div (two times the display range)
Resolution: 0.01 div. (Example: when the probe attenuation is 1:1 and the voltage scale is 2 mV/div, the
resolution is 0.02 mV.)
When Measuring Temperature
Selectable range: The range of thermocouple being used
Resolution: 0.1°C or 0.1 K
When Measuring Strain
Selectable range: The range of the strain module being used
Resolution: 1 μSTR or 0.0005 mV/V
When Measuring Acceleration
Selectable range: ±10.00 div
Resolution: 0.01 unit
When Measuring Frequency (Revolutions, periods, duty ratios, power supply frequencies, pulse widths,
pulse integration, velocities,
When Monitoring CAN Bus Signals
See section 6.13 in the getting started guide, IM DL850-03EN.
You can normally set the trigger level using the jog shuttle and arrow keys. If you press the NUM LOCK key
so that it illuminates, you can also enter numbers by pressing the CH key.
Trigger Slope (Slope)
Slope refers to the movement of the signal from a low level to a high level (rising edge) or from a high level to a
low level (falling edge). When a slope is used as one of the trigger conditions, it is called a trigger slope.
The following trigger slope settings are available for triggering the DL850/DL850V.
The DL850/DL850V triggers when the trigger source changes from a
level below the trigger level to a level above the trigger level (rising).
The DL850/DL850V triggers when the trigger source changes from a
level above the trigger level to a level below the trigger level (falling).
The DL850/DL850V triggers on both rising and falling edges.
*
4-4
can only be selected when a simple trigger is used with an analog trigger source.
IM DL850-01EN
4 Triggering
Trigger Hysteresis (Hysteresis)
Noise rejection establishes a trigger level margin (hysteresis) so that the DL850/DL850V does not trigger if the
signal level change is within the margin.
For each type of measured signal, you can set the hysteresis around the trigger level to one of the options listed
below. You cannot set hysteresis when the trigger source is set to Time, External, Line, or a logic signal.
Voltage
Temperature
Strain
Approx. ±0.1 div
Approx. ±0.5°C (K)
Approx. ±2.5% of the
range
Approx. ±0.1 div of the
range
Approx. ±0.01 div of the
range
Acceleration
Frequency
module
Approx. ±0.5 div
Approx. ±1°C (K)
Approx. ±12.5% of the
range
Approx. ±0.5 div of the
range
Approx. ±0.5 div of the
range
Approx. ±1 div
Approx. ±2°C (K)
Approx. ±25% of the
range
Approx. ±1 div of the
range
Approx. ±1 div of the
range
* The above values are approximate values. They are not strictly warranted.
Trigger Hold-Off (Hold Off)
The trigger hold-off feature temporarily stops the detection of the next trigger once a trigger has occurred. This
feature is useful in cases when you want to change the waveform acquisition interval, such as when you are
observing a PCM (pulse code modulation) code or other pulse train signal or when you are using the history
feature.
Trigger level
Repeating interval: T
Input signal
Trigger source
signal
Trigger signals that have been suppressed over the hold-off
period t (when the trigger slope is set to rising)
t
Selectable range: 0.00 μs to 10000000.00 μs (10 s). The default settings is 0.00 μs
Resolution: 0.01 μs
• To trigger with the hold-off time set to 50 ms or longer, set the trigger mode to Normal.
• For the A -> B(N) and A Delay B triggers, the hold-off time only applies to state condition B.
• The trigger hold-off time does not apply to the simple trigger when the trigger source is Time, to the period
trigger, or to the manual trigger.
IM DL850-01EN
4-5
4 Triggering
Trigger Position (Position)
When you move the trigger position, the ratio of the displayed data before the trigger point (the pre-trigger
section) to the data after the trigger point (the post-trigger point) changes. When the trigger delay is 0 s, the
trigger point and trigger positions coincide.
Display record length
T Trigger position
0%
100%
Pre-trigger section Post-trigger section
Selectable range: 0.0 to 100% of the display record length.
Resolution: 0.1%
• When waveform acquisition is stopped, if you change the trigger position, the setting is not applied until
you start waveform acquisition and update the waveforms.
• If you change the time axis setting (using the TIME/DIV knob), the location of the trigger position does not
change.
Time Reference Point
In addition to the trigger position, a time reference point is indicated. The times that appear in the lower left and
right of the screen are the times from this time reference point. The cursor time-measurement values are also
based on this reference point.
When waveform acquisition is stopped the displayed location of the time reference point varies as indicated
below.
• In Update Mode
When the displayed waveform is updated by the trigger, the time reference point is displayed as indicated
below. The time reference point and the trigger point are the same.
• Under Normal Waveform Update Conditions When All Pre-Trigger and Post-Trigger Data Has Been
Acquired
The trigger position and the time reference point are
displayed at the same position.
T
• When Waveform Acquisition Is Stopped before All Pre-Trigger and Post-Trigger Data Has Been Acquired
The trigger position and the time reference point
are displayed separately.
Trigger position Time reference point
T
4-6
IM DL850-01EN
4 Triggering
• In Roll Mode
In roll mode, in which waveforms scroll from right to left, the time reference point is displayed as indicated
below.
• When the Trigger Mode Is Auto Mode or Auto Level Mode
The point in time when waveform acquisition was stopped is
the time reference point (right side of the screen).
Time reference point
• When the Trigger Mode Is Instant Start Mode (On Start)
The point in time when waveform acquisition was started is
the time reference point.
Time reference point
Trigger Delay (Delay)
The DL850/DL850V normally displays waveforms before and after the trigger point. You can set a trigger delay to
display waveforms that the DL850/DL850V has acquired a specified amount of time after the trigger occurrence.
Selectable range: 0.00 μs to 10000000.00 μs (10 s). The default settings is 0.00 μs
Resolution: 0.01 μs
T Trigger position
Delay
Trigger point
• If you change the time axis setting (using the TIME/DIV knob) so that the unit becomes larger, because of
display-digit limitations, the delay time that you set when the unit was small will not appear in the setting
menu, but it is retained.
• You cannot specify a trigger delay when an external clock is being used as the time base.
IM DL850-01EN
4-7
4 Triggering
A -> B(N) Trigger (Enhanced)
After state condition A is met, the DL850/DL850V triggers when state condition B is met N times.
Met N times
B B
B
Met
A
Trigger
Trigger Source
You can use CH1 to CH16 and Bit 1 to Bit 8 as the trigger sources. Bit 1 to Bit 8 appear as options when a logic
input module is installed in a slot.
State Conditions (A State, B State)
To set state conditions A and B, select the states of the trigger sources in relation to the trigger level.
Example
CH1
CH2
CH3Bit 1
Bit 2
……
State Condition State Condition
B
A
H
H
L
L
L
H
…
H
X
…
Bit 8
CH4
……
X
X
…
L
X
…
CH16
X
H
H: The signal level must be high.
L: The signal level must be low.
X: The signal is not used as a condition.
State Condition Achievement Condition (A Condition, B Condition)
Select how the result of comparing the trigger source states to their specified conditions must change for a state
condition to be considered met.
Enter
Exit
The result must change from not being met to being met.
The result must change from being met to not being met
Number of Times State Condition B Must Be Met
Set the number of times that state condition B must be met.
Selectable range: 1 to 10000. The default setting is 1.
Trigger Level (Level) and Trigger Hysteresis (Hys)
Set these items for each trigger source.
These items are the same as the trigger level
and hysteresis
of the simple trigger.
Trigger Hold-Off (Hold Off), Trigger Position (Position), Trigger Delay (Delay)
These items are the same as trigger hold-off
of the simple trigger.
4-8
, trigger position
, and trigger delay
IM DL850-01EN
4 Triggering
A Delay B Trigger (Enhanced)
After state condition A is met and the specified amount of time elapses, the DL850/DL850V triggers when state
condition B is first met.
Met
A
Delay time
passes
Met
B
Trigger
Trigger Source
You can use CH1 to CH16 and Bit 1 to Bit 8 as the trigger sources. Bit 1 to Bit 8 appear as options when a logic
input module is installed in a slot.
State Conditions (A State, B State)
To set state conditions A and B, select the states of the trigger sources in relation to the trigger level.
Example
State Condition State Condition
A
B
H
H
L
L
CH1
CH2
CH3Bit 1
Bit 2
……
L
H
…
H
X
…
Bit 8
CH4
……
X
X
…
L
X
…
CH16
X
H
H: The signal level must be high.
L: The signal level must be low.
X: The signal is not used as a condition.
State Condition Achievement Condition (A Condition, B Condition)
Select how the result of comparing the trigger source states to their specified conditions must change for a state
condition to be considered met.
Enter
Exit
The result must change from not being met to being met.
The result must change from being met to not being met
Delay Time
Set the amount of time that must pass after state condition A is met.
Selectable range: 0.0 μs to 10000000.0 μs (10 s). The default settings is 0.0 μs.
Resolution: 0.1 μs
Trigger Level (Level) and Trigger Hysteresis (Hys)
Set these items for each trigger source.
These items are the same as the trigger level
and hysteresis
of the simple trigger.
Trigger Hold-Off (Hold Off), Trigger Position (Position), Trigger Delay (Delay)
These items are the same as trigger hold-off
of the simple trigger.
IM DL850-01EN
, trigger position
, and trigger delay
4-9
4 Triggering
Edge On A Trigger (Enhanced)
While state condition A is met, the DL850/DL850V triggers on the OR of multiple trigger source edges.
Trigger
Condition A is being met
Edge detection
Trigger Source
You can use CH1 to CH16 and Bit 1 to Bit 8 as the trigger sources. Bit 1 to Bit 8 appear as options when a logic
input module is installed in a slot.
State Condition (A State)
To set state condition A, select the states of the trigger sources in relation to the trigger level.
Example
CH1
CH2
CH3Bit 1
Bit 2
……
State Condition
A
H
L
H: The signal level must be high.
L: The signal level must be low.
X: The signal is not used as a condition.
L
H
…
Bit 8
CH4
……
X
X
…
CH16
X
State Condition Achievement Condition (Condition)
Select whether the result of comparing the trigger source states to their specified conditions must be true or false
for the state condition to be considered met.
True
False
The result must be true.
The result must be false.
Edge Detection Condition (Edge)
Set the condition for detecting the trigger source edge.
−
An edge is detected when the trigger source changes from a level
below the trigger level to a level above the trigger level (rising).
An edge is detected when the trigger source changes from a level
above the trigger level to a level below the trigger level (falling).
The signal is not used as a trigger condition.
Trigger Level (Level) and Trigger Hysteresis (Hys)
Set these items for each trigger source.
These items are the same as the trigger level
and hysteresis
of the simple trigger.
Trigger Hold-Off (Hold Off), Trigger Position (Position), Trigger Delay (Delay)
These items are the same as trigger hold-off
of the simple trigger.
4-10
, trigger position
, and trigger delay
IM DL850-01EN
4 Triggering
OR Trigger (Enhanced)
The DL850/DL850V triggers on the OR of multiple trigger source edges.
Trigger Source
You can use CH1 to CH16 and Bit 1 to Bit 8 as the trigger sources. Bit 1 to Bit 8 appear as options when a logic
input module is installed in a slot.
Edge Detection Condition (Edge)
Set the conditions for detecting each trigger source edge.
An edge is detected when the trigger source changes from a level
below the trigger level to a level above the trigger level (rising).
An edge is detected when the trigger source changes from a level
above the trigger level to a level below the trigger level (falling).
An edge is detected when the trigger source enters the specified
level range.
An edge is detected when the trigger source leaves the specified
level range.
The signal is not used as a trigger condition.
IN
OUT
−
* IN and OUT are only selectable when the trigger source is an analog signal (CH1 to CH16).
Trigger Level (Level)
Set these items for each trigger source.
When the Edge Detection Condition Is
or
Set the level used to detect the trigger source’s rising or falling edge.
When the Edge Detection Condition Is IN or OUT
An edge is detected when the trigger source enters (IN) or leaves (OUT) the specified level range. You can
specify the level range settings for each analog signal trigger source.
IN
Edge detection
OUT
Width (Width)
Level
Edge detection
Edge detection
Width (Width)
Level
Setting
Selectable Range
Level (center value)
Same as the trigger level
Width (Width)
Resolution
Trigger Hysteresis (Hys)
Set this item for each trigger source.
This item is the same as the hysteresis
of the simple trigger.
Trigger Hold-Off (Hold Off), Trigger Position (Position), Trigger Delay (Delay)
These items are the same as trigger hold-off
of the simple trigger.
IM DL850-01EN
, trigger position
, and trigger delay
4-11
4 Triggering
AND Trigger (Enhanced)
The DL850/DL850V triggers on the AND of multiple trigger source conditions. The DL850/DL850V triggers when
all the specified conditions are met at a single point.
Trigger Source
You can use CH1 to CH16 and Bit 1 to Bit 8 as the trigger sources. Bit 1 to Bit 8 appear as options when a logic
input module is installed in a slot.
Achievement Condition (Condition)
Set the achievement condition for each trigger source.
H
L
IN
OUT
−
The signal level must be high.
The signal level must be low.
The signal must be within the specified level range.
The signal must be outside of the specified level range.
The signal is not used as a trigger condition.
* IN and OUT are only selectable when the trigger source is an analog signal (CH1 to CH16).
Trigger Level (Level)
Set this item for each trigger source.
When the Achievement Condition Is H or L
Set the level for determining whether the trigger sources are high or low.
When the Achievement Condition Is IN or OUT
An edge is detected when the trigger source enters (IN) or leaves (OUT) the specified level range. You can
specify the level range settings for each analog signal trigger source.
Trigger Hysteresis (Hys)
Set this item for each trigger source.
This item is the same as the hysteresis
of the simple trigger.
Trigger Hold-Off (Hold Off), Trigger Position (Position), Trigger Delay (Delay)
These items are the same as trigger hold-off
of the simple trigger.
4-12
, trigger position
, and trigger delay
IM DL850-01EN
4 Triggering
Period Trigger (Enhanced)
The DL850/DL850V triggers on a specified period of occurrence of state condition B. The DL850/DL850V
triggers when state condition B occurs again.
Met
B
Reference time T
Met
B
Trigger
Trigger Source
You can use CH1 to CH16 and Bit 1 to Bit 8 as the trigger sources. Bit 1 to Bit 8 appear as options when a logic
input module is installed in a slot.
State Condition (B State)
To set state condition B, select the states of the trigger sources in relation to the trigger level.
Example
CH1
CH2
CH3Bit 1
Bit 2
……
State Condition
B
H
H: The signal level must be high.
L: The signal level must be low.
L
X: The signal is not used as a condition.
L
H
…
Bit 8
CH4
……
X
X
…
CH16
X
Determination Mode (Mode)
Set what kind of relationship must be established between period T and the specified reference times (Time or
T1 and T2) for the DL850/DL850V to trigger.
T < Time
T > Time
T1 < T < T2
T < T1, T2 <T
Period T must be shorter than the reference time (Time).
Period T must be longer than the reference time (Time).
Period T must longer than reference time T1 and shorter than reference time T2.
Period T must be shorter than reference time T1 or longer than reference time T2.
Reference Times (Time, T1, T2)
You can set the reference times (Time, T1, and T2) within the following ranges.
Setting
Time
T1
T2
Selectable Range
0.02 μs to 10000000.00 μs (10 s)
0.02 μs to 9999999.99 μs
0.03 μs to 10000000.00 μs (10 s)
Default
0.02 μs
0.02 μs
0.03 μs
Resolution
0.01 μs
Trigger Level (Level) and Trigger Hysteresis (Hys)
Set these items for each trigger source.
These items are the same as the trigger level
and hysteresis
of the simple trigger.
Trigger Hold-Off (Hold Off), Trigger Position (Position), Trigger Delay (Delay)
These items are the same as trigger hold-off
of the simple trigger.
IM DL850-01EN
, trigger position
, and trigger delay
4-13
4 Triggering
Pulse Width Trigger (Enhanced)
The DL850/DL850V triggers according to a specified duration (achievement time) for which state condition B has
been met. The timing of the triggering varies depending on the determination mode.
Achievement time
B
Trigger
Trigger Source
You can use CH1 to CH16 and Bit 1 to Bit 8 as the trigger sources. Bit 1 to Bit 8 appear as options when a logic
input module is installed in a slot.
State Condition (B State)
To set state condition B, select the states of the trigger sources in relation to the trigger level.
Example
CH1
CH2
CH3Bit 1
Bit 2
……
State Condition
B
H
H: The signal level must be high.
L: The signal level must be low.
L
X: The signal is not used as a condition.
L
H
…
Bit 8
CH4
……
X
X
…
CH16
X
Determination Mode (Mode)
Set what kind of relationship must be established between the state condition B achievement time and the
specified reference times (Time or T1 and T2) for the DL850/DL850V to trigger.
B < Time
B > Time
B TimeOut
B Between
The DL850/DL850V triggers when the achievement time is shorter than the reference
time (Time), and the state condition changes to not met.
The DL850/DL850V triggers when the achievement time is longer than the reference
time (Time), and the state condition changes to not met.
The DL850/DL850V triggers when the achievement time is longer than the reference
time (Time).
The DL850/DL850V triggers when the achievement time is longer than reference time
T1 and shorter than reference time T2, and the state condition changes to not met.
Reference Times (Time, T1, T2)
You can set the reference times (Time, T1, and T2) within the following ranges.
Setting
Time
T1
T2
Selectable Range
Default
0.02 μs
0.02 μs to 10000000.00 μs (10 s)
0.01 μs for B TimeOut
0.01μs to 9999999.99μs
0.01μs
0.02μs to 10000000.00μs(10 s)
0.02 μs
Resolution
0.01μs
Triggering may not function properly when the interval between achievement times is less than 0.01 μs or
when the duration of the achievement time is less than 0.01 μs (Typical).
4-14
IM DL850-01EN
4 Triggering
Trigger Level (Level) and Trigger Hysteresis (Hys)
Set these items for each trigger source.
These items are the same as the trigger level
and hysteresis
of the simple trigger.
Trigger Hold-Off (Hold Off), Trigger Position (Position), Trigger Delay (Delay)
These items are the same as trigger hold-off
of the simple trigger.
, trigger position
, and trigger delay
Wave Window Trigger (Enhanced)
The DL850/DL850V creates real-time templates (Wave Window) using a number of cycles directly preceding the
current waveforms. The DL850/DL850V compares the current waveforms to the real-time templates and triggers
if one of the current waveforms falls outside of its real-time template.
Reference cycles (example: the waveforms
for the four previous cycles)
Current waveform
Measured waveform
Average of 1, 2, or
4 cycles
Real-time template
Trigger
Tolerance
width
Average waveform
+ tolerance width
The DL850/DL850V compares
the current waveform to the
real-time template and
triggers if the current
waveform falls outside of the
real-time template.
Trigger Source
You can select the trigger sources from CH1 to CH16. The modules that you can use as sources for the Wave
Window trigger are listed below. You cannot use other modules or temperature-measurement channels as
sources.
701250 (HS10M12)
701251 (HS1M16)
701261 (UNIVERSAL) (only voltage measurement)
701270 (STRAIN_NDIS) 701271 (STRAIN_DSUB)
701255 (NONISO_10M12) 701260 (HV (with RMS))
701262 (UNIVERSAL (AAF)) (only voltage measurement)
701275 (ACCL/VOLT)
720210 (HS100M12)
Template Channels (Condition)
Select which trigger sources to use to make real-time templates. The DL850/DL850V triggers if the condition of
even one of the channels is met.
ON
OFF
Use
Don’t use
Tolerance Width (Width)
To create a real-time template for a channel, set the distance from the averaged waveform (of 1, 2, or 4 cycles
before the current waveform) that will be tolerated. The range within which you can set the distance varies
depending on the type of signal being measured.
Signal Type
Voltage
Strain
Acceleration
Selectable Range
0.01 × the voltage scale to 10 × the voltage scale
1 μSTR to (measurement range) × 2
or 0.0005 mV/V to (measurement range) × 2
0.01 Unit to (Unit/div) × 10
Default
0.01div
1μSTR
0.0005mV/V
10mUnit
Resolution
Same as the trigger level
resolution
For example, when Width is set to 2V, the tolerance width is ±1 V around the averaged waveform.
IM DL850-01EN
4-15
4 Triggering
Cycle Frequency (Cycle Frequency)
Set the trigger source frequency. If the actually frequency is within ±10% of the specified value, it is automatically
tracked.
Selectable range: 40 to 1000 Hz. The default setting is 50 Hz.
Resolution: 0.1 Hz
Reference Cycles (Reference Cycle)
Select how many waveforms before the current waveform are used to create the real-time templates. When the
sample rate is 500 kS/s and the number of channels used to make real-time templates is 9 or more, you can only
set the number of cycles to 2. Even if you select 4 cycles, only two are used.
1
2
4
One previous waveform is used.
Two previous waveforms are used.
Four previous waveforms are used.
If a surge or other abnormal waveform occurs in the reference cycle, the abnormal waveform will be included
in the averaged waveform, so the DL850/DL850V will trigger on the next normal waveform. This may make it
appear is if the trigger has been delayed by a few cycles.
T
Surge
Pre-trigger section
Trigger occurrence
When you use the wave window trigger, we recommend that you set a pre-trigger length that is longer than
the reference cycle so that you can observe waveform abnormalities that occur in the reference cycle.
Sync Channel (Sync. Ch)
Select the channel used to detect the points at which waveform comparison for the wave window trigger starts
and stops. Select the synchronization channel by selecting Auto or a channel from CH1 to CH16 that has a
module that the wave window trigger can be used with.
Auto
Of the modules that the wave window trigger can be used with, the module with the smallest number is
automatically selected.
Level for detecting the start and end points: The center of the amplitude of the sync-channel signal measured for
0.5 seconds after the start of waveform acquisition.
Detection hysteresis: Same as the edge trigger hysteresis
CH1 to CH16
Select a channel whose module can be used with the wave window trigger. If triggering does not function
properly when you select Auto, you can specify an appropriate channel.
For the selected channel, you need to set the level for detecting the start and end points and set the detection
hysteresis.
4-16
IM DL850-01EN
4 Triggering
Level for Detecting the Start and End Points (Level) and Detection Hysteresis
(Hysteresis)
If you set the sync channel to a channel from CH1 to CH16, you need to set the level for detecting the start
and end points and set the detection hysteresis. These items are the same as the trigger level
and
hysteresis
of the simple trigger.
Trigger Hold-Off (Hold Off), Trigger Position (Position), Trigger Delay (Delay)
These items are the same as trigger hold-off
of the simple trigger.
, trigger position
, and trigger delay
Operating Conditions of the Wave Window Trigger
You can use the wave window trigger with the following waveforms and settings. You cannot use the wave
window trigger when the record length is 25 kpoint or less and the time axis setting is shorter than 10 ms/div.
Waveforms
Sample rate
Acquisition mode
Trigger mode
Dual capture feature
IM DL850-01EN
AC waveforms and triangular waveforms between 40 kHz and 1 kHz.
(The trigger cannot be used with rectangular waveforms, such as
inverter waveforms, or waveforms with fast rising edges.)
10 kS/s to 500 kS/s
Normal
Normal, Single, Single(N)
When the trigger mode is Auto or Auto Level, it is difficult for the wave
window trigger to occur.
OFF
4-17
5
Waveform Acquisition
Based on the data that has been stored in the acquisition memory, the DL850/DL850V performs various
operations, such as displaying waveforms on the screen, computing, measuring cursors, and automatically
measuring waveform parameters.
This chapter explains how to set the number of data points to store in the acquisition memory (the record length),
how to enable or disable the sample data averaging feature, and so on.
Record Length (Record Length)
Record length refers to the number of data points that are stored to the acquisition memory for each channel.
Display record length refers to the data points from the data stored in the acquisition memory that are displayed
on the screen. Normally, the acquisition-memory record length and display record length are the same, but the
time axis setting may cause them to differ. When you change the time axis setting, the sample rate and record
length also change.
On the standard model of the DL850/DL850V, you can set the record length to a value between 1 kpoint and 250
Mpoint. On models with the /M2 option, you can set the length to up to 2 Gpoint. On models with the /HD0 option
or /HD1 option and the /M2 option, when you enable hard disk recording, you can set the record length to up to
50 Gpoint. For details about the record lengths that can be set, see appendix 2 in the getting started guide, IM
DL850-03EN.
Use a long time axis setting when you want to observe a phenomenon over a long period of time. When you
want to observe a phenomenon at a high time resolution, set a long record length, and raise the sample rate.
When the record length is long, computation and measurement processing take longer than when the record
length is short.
The amounts of time for which you can record data to the acquisition memory when the record length is 2 Gpoint
are listed below.
Sample Rate
100 MS/s
10 MS/s
1 MS/s
100 kS/s
10 kS/s
1 kS/s
500 S/s
In Seconds
20
200
1800
18000
180000
1728000
2593000
In Minutes
0.33
3.33
30
300
3000
28800
43217
In Hours
0.0056
0.056
0.50
5.0
50
480
720
In Days
0.00023
0.0023
0.021
0.21
2.1
20
30
The following limitations on waveform acquisition conditions and the number of waveforms that can be stored
in the acquisition memory (the number of history waveforms) apply depending on the set record length.
Notes about Setting the Record Length
• Increasing the record length automatically limits the number of channels that can be used. When some
channels are unavailable, the number of channels that can be used appears in the record length soft key
menu.
• When the acquisition mode is set to Average, the maximum record length is 5 Mpoint on standard models,
10 Mpoint on models with the /M1 option, and 25 Mpoint on models with the /M2 option.
• When the dual capture feature is being used, the maximum record length is 100 Mpoint on standard
models, 500 Mpoint on models with the /M1 option, and 1 Gpoint on models with the /M2 option.
• The maximum record length during hard disk recording is 50 Gpoint (one channel).
• When the trigger mode is Auto, Auto Level, Normal, or N Single and the display is not in roll mode, you can
only select a record length that is less than 5 Mpoint on standard models, 10 Mpoint on models with the
/M1 option, or 25 Mpoint on models with the /M2 option.
• On the DL850/DL850V, record lengths are expressed in units of points. There are some products, such as
the DL750, for which record lengths are expressed in units of words.
IM DL850-01EN
5-1
5 Waveform Acquisition
Acquisition Mode (Acquisition Mode)
You can set the acquisition mode to one of the options below.
Normal Mode (Normal)
Displays waveforms without processing the sampled data.
Envelope Mode (Envelope)
The DL850/DL850V determines the maximum and minimum values among the data sampled at the maximum
sampling rate for each module at a time interval that is twice the sampling period (the inverse of the sample rate)
of Normal mode, saves the values as pairs in the acquisition memory, and uses the saved value pairs to display
the waveforms. This mode is effective when you want to avoid aliasing, because the sample rate is essentially
kept high regardless of the time axis setting. It is also effective when you want to detect glitches (narrow pulse
signals) or when you want to display the envelope of a modulated signal.
Envelope mode
Normal mode
When the dual capture feature is used, captured waveforms cannot be displayed as envelope waveforms.
Box Average Mode (BoxAverage)
This mode can be used with the 701250 (HS10M12), 701255 (NONISO_10M12), and 720210 (HS100M12). The
DL850/DL850V determines the moving averages of the data sampled at the maximum sample rate, saves them
to the acquisition memory, and uses them to display waveforms. This mode is useful for removing small levels of
noise from the input signal. It is also useful for removing the noise from a single-shot signal.
Input signal Voltage
Box
averaged
data
5-2
1
2
••••
•
•••
20 21
••••
36
Time
b
Voltage
a
Time
IM DL850-01EN
5 Waveform Acquisition
The number of data points that are averaged varies as indicated below depending on the sample rate.
Sample Rate (S/s)
Number of Data Points
100 M*
1 point
50 M
2 points
20 M
4 points out of 5
10 M
8 points out of 10
5M
16 points out of 20
2M
32 points out of 50
1M
64 points out of 100
500 k
128 points out of 200
200 k
256 points out of 500
100 k or less
256 points out of the number of points equivalent to (100 M ÷ sample rate)
* The same as Normal mode
Averaging Mode (Average)
The DL850/DL850V acquires waveforms multiple times, averages the same time points relative to the trigger
point, saves them in the acquisition memory, and uses them to display averaged waveforms. Averaging mode is
useful when you want to remove random noise from waveforms.
The averaging method varies depending on the acquisition count.
When Acquisition Count Is
When Acquisition Count Is
Set to a Value between 2
Set to Infinity
and 65536 (in 2n steps)
Linear average
Exponential average
N
1
An = {(N – 1)An – 1 + Xn}
Σ
Xn
N
n=1
AN =
An : nth averaged value
N
Xn : nth measured value
Xn : nth measured value
N : Attenuation constant
N : Average count = acquisition count
(2 to 256 in 2n steps)
• When waveforms are acquired in averaging mode, they are saved to the acquisition memory as a single
record. This means that the history feature cannot be used.
• You cannot select averaging mode when:
- The display is in roll mode.
- The trigger mode is Single, N Single, or On Start.
- The dual capture feature is being used.
- Data is being recorded to a hard disk.
• To average waveforms that have been acquired in N Single mode, set the acquisition mode to Normal, and
set the history feature’s display mode to Averaging.
• Logic waveforms and CAN monitor module waveforms cannot be averaged.
Acquisition Count (Acquisition Count)
The ranges within which you can set the waveform acquisition count are indicated below. If you select Infinite,
the DL850/DL850V continues waveform acquisition until you stop it using the START/STOP key. The default
setting is Infinite. Changes to the number of acquisitions are not applied during waveform acquisition. They are
applied after acquisition stops.
• When the acquisition mode is set to Normal, Envelope, or BoxAverage
1 to 65536 (in steps of 1) or Infinite
• When the acquisition mode is set to Average.
2 to 65536 (in 2n steps) or Infinite
The number of waveforms that have been stored to the acquisition memory appears in the lower left of the
screen.
IM DL850-01EN
5-3
5 Waveform Acquisition
Trigger Mode (Trigger Mode)
Hard Disk Recording (HD RecordCondition; optional)
When measurement starts, you can record data an external hard disk that supports eSATA (external Serial ATA;
/HD0 option) or to an internal hard disk (/HD1 option).* The recorded data is saved to files automatically. You can
load the data that has been saved.
* Models with the /HD0 option are equipped with eSATA connectors. You need to purchase a hard disk that
supports eSATA separately. For information about supported hard disks, contact your nearest YOKOGAWA
dealer. A single DL850/DL850V cannot be equipped with both the /HD0 and /HD1 option.
• The DL850/DL850V stops acquiring waveforms after it has acquired the amount of data that corresponds to
the set record length. The maximum record length is 30 days.
• When you enable hard disk recording, the trigger mode is automatically set to On Start.
• Hard disk recording is possible for the numbers of channels, sample rates, set record lengths, and time axis
settings listed below.
Number of Channels
1
3
8
16
Maximum Sample Rate
1 MS/s
500 kS/s
200 kS/s
100 kS/s
Hard disk recording
Input signal
Set Record Length
Time Axis Setting
1 Mpoint or more
1 s/div or more
(the roll mode display area)
External hard disk that supports eSATA
(/HD0 option)
or
an internal hard disk
(/HD1 option)
Loading of
waveform data
Normal measurement
Acquisition
memory
Saving and loading
of waveform data
Recorded Data File (HD Recording Setup)
You can save data to a specific file name on a hard disk and add comments to it.
In hard disk recording, a folder for the current date is created on the specified drive, and the recorded-data files
are saved to that folder.
• File Name (File Name) and Comment (Comment)
You can set file names and comments. You can also use the auto naming feature to automatically assign file
names.
• File Division (Data File Divide)
You can specify the number of files that the recorded data is divided into. You can use this feature to avoid
creating large files that take time to process. You can specify the number of divisions, but the actual number
of files that will actually be saved is a number close to the specified number.
5-4
IM DL850-01EN
5 Waveform Acquisition
• Before you turn on the DL850/DL850V, connect the external hard disk to the DL850/DL850V, and turn on
the external hard disk. If you connect a hard disk or turn it on after you turn on the DL850/DL850V, the hard
disk will not be detected. Also, when the external hard disk is on, do not disconnect its cable.
• Hard disk recording cannot be performed when the record length is less than 1 Mpoint.
• Hard disk recording cannot be performed when the acquisition trigger is on or when the dual capture
feature is being used.
• Hard disk recording can only be performed when the trigger mode is set to On Start. It cannot be
performed in other modes.
• When hard disk recording is enabled, you cannot use an external clock as the time base.
• When you start hard disk recording, cursor measurement and the automated measurement of waveform
parameters stop.
• During hard disk recording, only starting and stopping of hard disk recording, the zoom display settings,
and the protect feature are valid.
• The upper limit of the zoom factor during hard disk recording is the maximum zoom factor that can be
displayed during hard disk recording.
• During hard disk recording, you cannot display history waveforms, loaded waveforms, or computed
waveforms.
• You can perform the following operations on data that has been recorded to a hard disk. You cannot use
the history feature.
Cursor measurement, automated measurement of waveform parameters (up to 100 Mpoint), waveform
zooming, computation, waveform data saving and loading, printing
• During hard disk recording, the DL850/DL850V may respond more slowly to operations.
• The maximum number of files that can be saved to a single folder is 1000.
Time Base (Time Base)
Under the initial settings, the DL850/DL850V samples the measured signals using the clock signal produced by
its internal time-base circuit (internal clock). You can also use an external clock signal to control sampling. One
data sample is stored to the acquisition memory at every pulse in the external clock signal. The external clock
input is useful when you want to monitor the waveform using a clock signal that is in sync with the signal being
measured.
Apply the external clock signal to the external-clock input terminal (EXT CLK IN) on the left panel. For the
specifications of the external-clock input terminal, see the getting started guide, IM DL850-03EN.
Int
Ext
IM DL850-01EN
The internal clock signal is used as the time base (the TIME/DIV time axis setting is valid).
An external clock signal is used as the time base (the TIME/DIV time axis setting is invalid).
5-5
5 Waveform Acquisition
Pulses per Rotation (Pulse/Rotate)
When the time base is an external clock, you can specify how many pulses of the external clock signal (how
many sampled data acquisitions) correspond to one mechanical rotation (or period). For example, if you set
Pulse/Rotate to 100 pulses, when the record length is 1 kpoint, 10 rotations worth of sampled data will be
acquired. When Pulse/Rotate is set to 1 pulse, each point of sampled data corresponds to a single rotation.
The Pulse/Rotate setting only affects the horizontal-cursor measurement values and how the time axis is
displayed on the screen. For example, if you set Pulse/Rotate to 100 pulses, when the record length is 1 kpoint,
1 div will correspond to 1 rotation. With these settings, if you move the cursor by 1 div, the measured horizontal
value will only increase by 1.
Selectable range for pulses: 1 to 24000
Notes about Sampling Using an External Clock Signal
• You cannot acquire waveforms when the acquisition mode is set to Envelope or BoxAverage.
• You cannot display waveforms in roll mode.
• There is no function for dividing the frequency of the clock signal.
• The time axis cannot be changed. To change the time-axis display range, change the record length, or
zoom in on the time axis.
• The measured time values in cursor measurements and automated measurements of waveform
parameters indicate the number of clock signal pulses. For these measurements, units are not displayed.
• Hard disk recording cannot be used.
• The dual capture feature cannot be used.
• The trigger settings listed below are invalid.
Hold-off, trigger delay, period trigger, pulse width trigger
Maximum Sample Rates for Each Module
If you set the sample rate of the DL850/DL850V to a rate that is higher than a module’s maximum sample
rate, because the data is updated at the module’s maximum sample rate, all the data within the module’s data
update interval will be the same. The maximum sample rates for each module are listed below.
Module
701250/701255
701251
701260/701270/701271/701275
(when measuring voltage)
701261/701262
(when measuring temperature)
701280
701265
720210
720220
720230 (LOGIC)
720240 (CAN MONITOR)
Maximum Sample Rate
Internal Clock
10 MHz
1 MHz
100 kHz
100 kHz
500 Hz
25 kHz
500 Hz
100 MHz
200 kHz
10 MHz
100 kHz
External Clock
9.5 MHz
1 MHz
100 kHz
100 kHz
500 Hz
25 kHz
500 Hz
9.5 MHz
200 kHz
9.5 MHz
100 kHz
Notes about Using the 16-CH Voltage Input Module
5-6
IM DL850-01EN
5 Waveform Acquisition
Dual Capture (DUAL CAPTURE)
You can use dual capturing to simultaneously acquire waveform data (main waveform) in low-speed roll mode
and at a high sampling rate (captured waveform). Dual capturing is useful during low-speed sampling when you
are observing waveforms over a long period of time and want to capture fast phenomena at a high sample rate.
• When the waveform data is saved, captured waveforms are saved along with the main waveforms. When you
load the main waveforms, the captured waveforms are also loaded.
• When the window for displaying captured waveforms (the dual capture window) is displayed, cursor
measurement, automated measurement of waveform parameters, and statistical processing can be performed
on the captured waveforms. Measured captured-waveform values are displayed in italics. When captured
waveforms are not displayed, the measurement and processing are performed on the main waveforms. When
the waveforms that are measured and processed change, the measured values are reset.
Main waveforms
(low-speed sampling)
Roll mode display (up to 1 Gpoint)
Sample rate:
100 kS/s or less
Captured waveforms
(high-speed sampling)
Update mode display
Sample rate:
Faster than that of the main waveform
Events
The points where triggering
occurred during dual capturing
are displayed as events.
Main waveform
Zoomed waveform
(along the time axis)
Because there is not
enough sampled data,
the shape of the
waveform may not be
displayed correctly.
Captured
waveforms
Because the data is
sampled at a high speed,
the correct shape of the
waveform is displayed.
Channels That Dual Capturing Is Performed On
Normally, dual capturing is performed on all the channels detected by the DL850/DL850V. However, under the
following conditions, dual capturing is only performed on channels whose displays are turned on.
• When hard disk recording is enabled
• When an increase in the record length of the main waveforms places a limitation on the number of channels
that can be used
In both cases, dual capturing is not performed on 16-CH Voltage Input Module sub channels whose input
coupling is set to OFF.
Turning Dual Capturing On and Off (Display)
Set whether to enable or disable dual capturing.
• ON: Dual capturing is enabled.
• OFF: Dual capturing is disabled.
IM DL850-01EN
5-7
5 Waveform Acquisition
Main Waveform Acquisition Settings
• Time axis setting: A value from 100 ms/div to 3 days/div
• Main waveform sample rate: 100 kS/s or slower
• Acquisition mode: Normal, Envelope, or BoxAverage
Captured-Waveform Acquisition Settings (Capture Setup)
• Time axis setting (Time/div): A value from 1 μs/div to 500 ms/div (in 1-2-5 steps) or 1 sec/div to 1 min/div
• Capture length (Capture Length): 5 kpoint, 10 kpoint, 25 kpoint, 50 kpoint, 100 kpoint, 250 kpoint, or 500
kpoint
• Capture mode (Capture Mode): Auto or On Start
Auto (Auto)
Instant start (On Start)
The DL850/DL850V continues waveform acquisition until you stop it using the START/STOP
key.
After the amount of data that corresponds to the set record length or 10 div worth of data is
acquired, waveform acquisition stops.
• Main-waveform sample rate < captured-waveform sample rate
The sample rates must be set so that the sample rate of the captured waveforms is faster than the sample
rate of the main waveforms.
Trigger Condition
When dual capturing is enabled, the trigger conditions apply to the captured waveforms. When the trigger
conditions are met, the DL850/DL850V triggers and acquires the captured waveforms.
Action (Action Setup)
You can make the DL850/DL850V perform a specified action when it triggers and acquires captured waveforms.
Captured-Waveform Display Number (Select Number)
You can select the number of a captured waveform and display it. The trigger time of the selected waveform
appears to the lower left of the waveform display area.
When Capture Mode Is Set to Auto
The numbers that you can select vary as indicated below. You can select and display the numbers when
waveform acquisition is stopped.
Current, −1, −2, ...
Current: the most recent waveform, −1: one waveform before the most recent waveform, −2: two waveforms
before the most recent waveform, ...
When Capture Mode Is Set to On Start
The numbers that you can select vary as indicated below. You can select and display the numbers even during
waveform acquisition.
Current, 1, 2, ...
Current: the most recent waveform, 1: the oldest waveform, 2: the second oldest waveform, ...
Displaying a List of Captured Waveforms (List)
When waveform acquisition is stopped, you can display a list of captured-waveform numbers and trigger times.
You can select a waveform that you want to display from the list and display it.
5-8
IM DL850-01EN
5 Waveform Acquisition
Zooming Captured Waveforms (Mag, Position)
Zooms the displayed captured waveforms.
Zoom Factor (Mag)
You can set the zoom factor to a value between the time axis setting at the time when the captured waveform
was acquired to the minimum captured-waveform time-axis setting of 1 μs/div.
Position (Position)
The captured waveform is zoomed around the position that you set here.
Turning the Display of the Capture Window On and Off (Window ON and OFF)
You can set whether to display the dual capture window. When the dual capture window is displayed, cursor
measurement, automated measurement of waveform parameters, and statistical processing are performed on
the captured waveforms. When the dual capture window is not displayed, measurement and processing are
performed on the main waveforms.
• ON: The dual capture window is displayed.
• OFF: The dual capture window is not displayed.
Display Ratio of the Main Window (Main Ratio)
Window Layout (Window Layout)
Set the display position of the dual capture window.
• Side: Horizontal
• Vertical: Vertical
Format (Format)
Set the display format of the dual capture window.
Main (Main): The same format as the main window
1, 2, 3, 4, 6, 8, 12, 16: The dual capture window is broken up into the specified number of divisions.
Event Display (Event Display)
You can display the points where triggering occurred during dual capturing as events. When the waveform data
is saved, the event data is saved along with the main waveforms. When you load the main waveforms, the
events are also loaded.
The locations of captured waveforms are indicated.
Trigger Trigger
Event
Main waveform
Waveforms That Are Captured (Allocation)
The waveforms of the channels whose check boxes are selected in the allocation window and whose displays
are turned on are displayed.
IM DL850-01EN
5-9
5 Waveform Acquisition
•
•
•
•
•
•
•
•
•
•
When the main waveform acquisition mode is Average, dual capturing cannot be executed.
Dual capturing cannot be performed during hard disk recording.
During dual capturing, the DL850/DL850V may respond more slowly to operations.
Use the internal clock as the time base when you perform dual capturing. You cannot perform dual
capturing when an external clock is being used.
When you perform dual capturing, all the previous waveform data is deleted.
Dual capturing cannot be performed on X-Y waveforms.
The accumulate function cannot be used.
Computation cannot be performed on captured waveforms.
When the automated measurement of waveform parameters is enabled, the time it takes for the DL850/
DL850V to enter the trigger-ready state may become longer after a captured waveform is acquired.
The history feature cannot be used on waveform data acquired through dual capturing.
Waveform Acquisition (START/STOP)
When you start waveform acquisition, the DL850/DL850V stores waveform data to the acquisition memory and
updates the displayed waveforms each time it triggers. The acquisition memory is divided into many areas based
on the set record length, and the maximum number of acquirable waveforms are stored in the memory. You can
recall past waveforms that are stored in the memory by using the history feature when waveform acquisition is
stopped.
DL850/DL850V Operation When the Acquisition Mode Is Set to Averaging
• Averaging stops when you stop acquisition.
• If you start acquisition again, averaging starts from the beginning.
START/STOP Key Operations during Accumulation
• Accumulation stops when you stop waveform acquisition.
• When you start acquisition again, the displayed waveforms up to that point are cleared, and accumulation
restarts from the beginning.
The START/STOP Key Is Disabled:
• When the DL850/DL850V is in remote mode.
• When the DL850/DL850V is printing to a printer, when it is being set up automatically, or when it is accessing
a storage medium.
• If you change the waveform acquisition conditions and start waveform acquisition, the past data stored in
the acquisition memory is cleared.
• You can use the snapshot feature to retain the displayed waveform on the screen. This feature allows you
to update the display without having to stop waveform acquisition.
• Regardless of the trigger settings, you can make the DL850/DL850V trigger by pressing the MANUAL
TRIG key on the front panel.
5-10
IM DL850-01EN
6
Display
Window Types (DISPLAY)
The DL850/DL850V has the following types of windows.
T-Y (Time axis) Waveform Display Window
• Main window
Displays normal waveforms, which are not magnified
• Zoom window (Zoom1 and Zoom2)
Displays zoomed waveforms according to the settings specified using the ZOOM key
X-Y Window (Window 1 and Window 2)
Displays X-Y waveforms according to the settings specified using the X-Y key
FFT Window (FFT1 window and FFT 2 window)
Displays FFT waveforms according to the settings specified using the FFT key
Dual Capture Window
Appears when the dual capture feature is used
Extra Window
This window displays cursor-measurement values, automated measurement values of waveform parameters,
and so on. It can be used when values overlap with waveforms and are difficult to see.
Switching the Menu Area Display
You can switch between the full-screen waveform display, the channel information display, and the waveform
numeric-monitor display.
Display Pattern Examples
The main display patterns are shown in the figure below.
<Main>,
<Z1>, <Z2>,
<W1>, <W2>,
<FFT 1>, or
<FFT 2>
<Main>
<Z1>
or
<Z2>
<W1>
or
<W2>
<Main>
<Z1>, <Z2>, <W1>,
<W2>, <FFT 1>,
or <FFT 2>
<Main>
<Z1>
or
<Z2>
<Main>
<Z1>
<Z2>
<Main>
<FFT 1> <FFT 1>
or
or
<FFT 2> <FFT 2>
<W1>
or
<W2>
<Main>
<W1>
<W2>
<Main>
<FFT 1> <FFT 2>
<Main>
<Main>
<Z1>
<Z1> or <Z2>
<Z2>
<FFT 1> or <FFT 2>
<W1>
<Z1>
or
<Z2>
<Z1>
or
<Z2>
<FFT 1>
or
<FFT 2>
<W2>
<W1>
or
<W2>
<FFT 1>
or
<FFT 2>
<W1>
or
<W2>
• Zoom1 and Zoom2 are abbreviated to Z1 and Z2.
• You can create patterns in which the main window is not displayed.
• The dual capture window is also displayed as shown in the patterns above.
IM DL850-01EN
6-1
6 Display
Display Format (Format)
You can evenly divide the T-Y waveform display window so that you can easily view input waveforms and
computed waveforms. You can set the number of divisions to one of the values listed below.
1, 2, 3, 4, 6, 8, 12, or 16
The number of displayed points in each division varies depending on the number of divisions. Even if the
number of displayed points changes, the vertical resolution does not change. The number of displayed points
when only the Main window is displayed is as follows:
Divisions Displayed
Points
1
656 points
6
109 points
Divisions Displayed
Points
2
328 points
8
82 points
Divisions Displayed
Points
3
218 points
12
54 points
Divisions Displayed
Points
4
164 points
16
41 points
Extra Window (Extra Window)
When waveforms and measured values overlap and are difficult to see, you can use the extra window to display
them separately. The extra window appears below the T-Y waveform display window. The following values
appear in the extra window.
• Cursor-measurement values
• Automated measurement values of waveform parameters
• The digital values of each channel (only during roll mode display)
Height of the Extra Window
Set the height of the extra window.
OFF: The extra window is not displayed.
1 to 8: The extra window is set to the selected height.
Auto: The extra window appears automatically when you perform cursor measurements and automated
measurements of waveform parameters.
• The number of displayed points on the T-Y waveform display window varies depending on the height of the
extra window. Even if the number of displayed points changes, the vertical resolution does not change.
• When the extra window is displayed, depending on the Zoom Format, the scale values may overlap and be
difficult to read.
Grid (Graticule)
You can set the window grid to one of the following options.
•
•
•
6-2
: Displays the grid using broken lines
: Displays the grid using crosshairs
: Displays a frame
IM DL850-01EN
6 Display
Turning the Scale Value Display On and Off (Scale Value)
You can display the upper and lower limits (scale values) of each waveform’s vertical or horizontal axes.
• ON: Displays the scale values
• OFF: Does not display the scale values
Waveform Arrangement, Color, and Display Gr. (Trace Setup)
You can set the following items for the input channels (CH1 to CH16) of the modules installed in the slots and
for the computation channels (Math1 to Math8). You cannot configure settings for input modules that are not
installed.
Allocation Mode (Allocation Mode)
Select which channels to display in which window divisions (zones).
• Auto
The waveforms whose displays are turned on are arranged by number from the top of the window.
• User
The waveforms are arranged according to the settings configured for Zone.
Moving Input Channels (CH)
You can move input and computation channels. To move a channel, remove it from the list, and then select it in
the location that you want to move it to.
Display Color (Color)
You can set the display color of each of the waveforms to one of 16 colors.
You can assign all waveforms regardless of whether their displays are turned on.
• You can set the colors of each of the sub channels on the 16ch Voltage input and CAN bus monitor modules.
• Because logic input modules are not displayed as individual bits but are instead displayed as single channels,
a logic input channel can only have one color assigned to it.
Zone (Zone)
When Allocation Mode is set to User, you can specify which division of the screen (zone) to display each of the
waveforms in. You can assign all waveforms regardless of whether their displays are turned on.
• You can assign zones to each of the sub channels on the 16ch Voltage input and CAN bus monitor modules.
• Because logic input modules are not displayed as individual bits but are instead displayed as single channels,
a logic input module can only be assigned to one zone.
Display Groups (Select Display Gr.)
When modules, such as 16-CH Voltage Input Modules, that have multiple channels (sub channels) are installed,
you can divide the channels into groups and display them. You can divide the channels into up to four groups.
• You can assign the same channel to multiple groups.
• You cannot assign the following channels to separate groups.
• The bits of a single logic input module
Trace Label Display (Trace Label)
You can display waveform labels next to the displayed waveforms. If the waveform display is narrow because of
the display format settings, labels may not be displayed.
• ON: Displays labels
• OFF: Does not display labels
IM DL850-01EN
6-3
6 Display
Level Indicator
A level indicator that shows the levels of the waveforms whose displays are turned on appears on the right side
of the waveform display area. It shows the current levels of the sampled data.
Interpolation Method (Dot Connect)
When the number of data points is within the interpolation zone of the T-Y waveform display,* the DL850/DL850V
displays waveforms by interpolating between sampled data points.
* Interpolation zone refers to the condition in which a given number of data points are not contained in the 10
div along the time axis. The number of data points that define the interpolation zone varies depending on the
display record length and zoom ratio.
You can set the interpolation method to one of the options below.
• OFF
Displays the data using dots without interpolation.
• Sine Interpolation (Sine)
Interpolates a sine curve between two points using the (sinx)/x function. This method is suitable for the
observation of sine waves.
• Linear Interpolation (Line)
Linearly interpolates between two points.
• Pulse Interpolation (Pulse)
Interpolates between two points in a staircase pattern.
Outside of the Interpolation Zone
If the interpolation method is set to Sine, Line, or Pulse, the dots are connected vertically.
If the number of data points is 2002 or greater, the DL850/DL850V determines the P-P compression values (the
maximum and minimum sampled-data values in a given interval), and displays vertical lines (rasters) connecting
each pair of maximum and minimum P-P compression values.
OFF
Sine/Line/Pulse
In the Interpolation Zone
OFF
Sine
Line
Pulse
The interpolation method is set to Pulse when:
• The input signal is a logic signal.
• The acquisition mode is Envelope.
6-4
IM DL850-01EN
6 Display
Setting the Number of Data Points to Use for Waveform Display
(Decimation)
When the T-Y waveform display is not in the interpolation zone and the interpolation method is not set to OFF,
P-P compressed values are displayed.
When the T-Y waveform display is not in the interpolation zone and the interpolation method is set to OFF
or when the X-Y waveform display is shown, the DL850/DL850V displays the acquired data without P-P
compression by removing the data between fixed intervals. You can set the number of points to use to display
waveforms to one of the options listed below.
2k, 100k
• When 2k Is Selected
When the record length exceeds 2 kpoint, the DL850/DL850V removes data until there are only 2 kpoint
and displays two points on each vertical line. When the record length is less than 2 kpoint, all the points are
displayed.
• When 100k Is Selected
When the record length exceeds 100 kpoint, the DL850/DL850V removes data until there are only 100 kpoint
and displays 100 points on each vertical line. When the record length is less than 100 kpoint, all the points
are displayed.
During hard disk recording and roll mode display, if there are more than 100 points of data per div, the
maximum and minimum values for specified intervals of data are displayed through linear interpolation.
Accumulation (Accumulate)
Ordinarily, momentary waveform anomalies are difficult to recognize because the displayed waveform is updated
whenever the trigger is activated. In waveform accumulation, older waveforms remain on the screen for a period
of time that is longer than the waveform update period, so that older waveforms remain while new waveforms
continue to appear. The specified number of accumulated waveforms are displayed with gradually decreasing
intensity.
• ON: Waveforms are accumulated.
• OFF: Waveforms are not accumulated.
Count (Count)
Set the number of accumulated waveforms to display. Waveforms will accumulate infinitely if you choose Infinite.
Selectable range: 2 to 128 waveforms (in 2n steps). The default setting is 16.
Clearing Accumulated Waveforms
You can clear accumulated waveforms by pressing the CLEAR TRACE key.
• Automated measurement of waveform parameters and GO/NO-GO determination are performed on the
most recent waveform.
• If you press START/STOP to stop waveform acquisition, accumulation stops. When you restart waveform
acquisition, accumulation resumes from the condition that it was in when it was stopped.
• The built-in printer does not show the intensity differences between accumulated waveforms.
• When Accumulate is set to ON, you cannot change the settings of the history feature.
• When Accumulate is set to ON, even if you change the display format, the waveforms that are currently on
the screen are not cleared. To clear waveforms, press CLEAR TRACE.
• You cannot set accumulate to ON in the roll mode display.
• When you set accumulate to OFF, the accumulated waveforms are cleared. To redisplay the waveforms,
use the history feature, and select the record number of the waveforms that you want to display. You can
only select waveforms that have record numbers. You cannot display earlier waveforms.
• If the DL850/DL850V does not trigger when the trigger mode is set to Normal, the waveform intensity is
retained until the next time the DL850/DL850V triggers.
IM DL850-01EN
6-5
6 Display
Manual Event (Manual Event)
Indicates the positions of manually input events. You can only input manual events during hard disk recording
or when the dual capture feature is enabled. You can input manual events by applying a high/low signal to the
external start/stop input (EXT I/O) terminal or by turning a switch contact on and off. You can enter up to 1000
events. For the specifications of the EXT I/O terminal, see section 5.5 in the getting started guide, IM DL85003EN.
Switching the Menu Area Display
When the setup menu is displayed and you press the ESC key, the menu disappears, and the display switches
to the full-screen waveform display. If you press the ESC key again, the channel information of the waveforms
whose displays are turned on appears. If you press the ESC key yet again, the numeric monitor for the
waveforms whose displays are turned on appears. Each time you press the ESC key, the display switches
between the full-screen waveform display, the channel information display, and the numeric-monitor display.
Full-Screen Waveform Display
The menu disappears, and the waveform display area expands horizontally.
Channel Information
The following items are displayed.
However, as the number of displayed channels increases, some items may be omitted.
• Voltage measurement: V/div, input coupling, probe attenuation (type), bandwidth limit
• Temperature measurement: Temperature/div, thermocouple type, bandwidth limit
• Strain measurement: μSTR/div (or [mV/V]/div), measurement range, bandwidth limit
• Acceleration measurement: Acceleration/div, gain, input coupling, bias
• Frequency measurement: Value/div, measurement mode, preset
Numeric Monitor
The level indicator values for each channel appear in the numeric monitor display. The numeric monitor display
is updated at approximately every 0.5 s.
Size of the Channel-Information and Numeric-Monitor Display Area (Ch. Information)
You can set the size of the display area that appears when you switch from the menu to the channel-information
or numeric-monitor display.
• Full: Full screen
• Narrow: Width of the menu (displayed in the location of the menu)
• Wide: Displayed on the right half of the screen
6-6
IM DL850-01EN
7
Displaying X-Y Waveforms
You can view the correlation between two waveform levels by assigning the level of one waveform to the X-axis
(horizontal axis) and the level of the other waveform to the Y-axis (vertical axis). There are two X-Y waveform
windows, and you can display four pairs of waveforms in each window (for a total of eight pairs).
You can perform cursor measurements on the displayed X-Y waveforms. You can also observe T-Y (time axis)
waveforms and X-Y waveforms simultaneously.
Turning the X-Y Window Display On and Off (Display)
You can select whether to display each X-Y window.
• ON: Displays the X-Y window
• OFF: Does not display the X-Y window
Eight Pairs of X-Y Waveforms (Setup)
You can display XY1 to XY4 in window 1 and XY5 to XY8 in window 2. You can configure the display settings of
a total of 8 X-Y waveforms. You can configure the following settings for each X-Y waveform.
Display (DISPLAY)
You can select whether to display each X-Y waveform.
• ON: Displays the X-Y waveform
• OFF: Does not display the X-Y waveform
X Trace and Y Trace (X Trace and Y Trace)
For XY1 to XY4 and XY5 to XY8, you can select which waveforms to assign to the X and Y axes from the
following options.
CH1 to CH16,1 16chVOLT,2 CAN,3 Math1 to Math8
1 You can select the channel of an installed module. However, you cannot select the channel of a logic module.
2 If the 16-CH Voltage Input Module is installed. After you select 16chVOLT, select a sub channel.
3 On the DL850V when a CAN bus monitor module is installed. After you select CAN, select a sub channel. If
the data type (Value Type) is set to Logic, you will not be able to select it.
• An X-Y waveform cannot be displayed if the waveforms assigned to its X and Y axes have different sample
rates.
• An X-Y waveform cannot be displayed if it is a combination of a sub channel on the 16-CH Voltage Input
Module and a normal channel. You can display an X-Y waveform of two sub channels that have the same
sample rate. The same limitation that applies to the 16-CH Voltage Input Module also applies to CAN bus
monitor modules.
• An X-Y waveform can be displayed if it is a combination of a sub channel on the 16-CH Voltage Input
Module and a sub channel on a CAN bus monitor module and if the two sub channels have the same
sample rate.
• X-Y waveforms can be created from normal T-Y waveforms. They cannot be created from zoomed
waveforms.
• Logic waveforms and event waveforms cannot be used to make X-Y waveforms.
• You cannot create an X-Y waveform using one trace whose horizontal-axis unit is time and another trace
whose horizontal-axis unit is frequency.
Start Point and End Point (Start Point and End Point)
You can set the start and end points of the X-Y waveforms on the T-Y waveforms. You can set different start and
end points for each X-Y window.
Selectable range: ±5 div from the center of the T-Y waveform window
Pen Marker (Pen Marker)
You can display a pen marker on an X-Y waveform whose display is turned on. It shows the current sampled
point of the waveform.
IM DL850-01EN
7-1
7 Displaying X-Y Waveforms
Clearing Waveforms at Acquisition Start (Trace clear on Start)
Choose whether to clear the current X-Y waveforms when waveform acquisition is started through the pressing
of the START/STOP key.
• ON: X-Y waveforms are cleared.
• OFF: X-Y waveforms are not cleared.
Display Ratio of the Main Window (Main Ratio)
Window Layout (Window Layout)
Set the display position of the X-Y window.
• Side: Horizontal
• Vertical: Vertical
Combine Display (Combine Display)
Choose whether to combine the two X-Y windows into one window.
• ON: The windows are combined.
• OFF: The windows are not combined.
Interpolation Method (Dot Connect)
When the number of data points is within the interpolation zone of the X-Y waveform display,* the DL850/DL850V
displays waveforms by interpolating between sampled data points.
* Interpolation zone refers to the condition in which a given number of data points are not contained in the
X-Y waveform display. The number of data points that define the interpolation zone varies depending on the
display record length.
You can set the interpolation method to one of the options below.
• OFF
Displays the data using dots without interpolation.
• Linear Interpolation (Line)
Linearly interpolates between two points.
Diagram Explaining the Interpolation Method
Setting the Number of Data Points to Use for Waveform Display
(Decimation)
In the X-Y waveform display, the DL850/DL850V displays the acquired data by removing the data between fixed
intervals. You can set the number of points to use to display waveforms to one of the options listed below.
2k, 100k
Detailed Explanation
• To zoom in or out on an X-Y waveform, change the upper and lower limits (Upper and Lower) of the
channel that you want to zoom, or change the vertical zoom (V Zoom).
• On voltage input modules, to change the displayed position of an X-Y waveform, change the positions of
the channels that it is based on.
7-2
IM DL850-01EN
8
Zooming in on Waveforms
You can magnify displayed waveforms along the time axis. The zoomed waveforms of two locations can be
displayed simultaneously (the dual zoom feature). You can also specify which channel you want to zoom in on.
You cannot zoom if the number of displayed points on the screen is less than or equal to 100.
Example of the Dual Zoom Display
Zoom box 2
Zoom box 1
Main window
Zoom1 window
Zoom2 window
If the Zoom1 or Zoom2 waveform window and the main waveform window (Main) are displayed at the same
time, a zoom box appears in the Main window so that you can check the zoom position.
Vertical Zoom
You can magnify displayed waveforms along the vertical axis by using the menu that appears when you press a
CH key.
Zoom Window Display (Display)
You can set whether to display each of the zoom windows, Zoom1 and Zoom2. When a zoom window is
displayed, a zoom bar appears at the top of the screen. This bar indicates what part of Main window is being
zoomed in on.
• ON: Displays the zoom windows
• OFF: Does not display the zoom windows
Zoom Source Window (Zoom2 Source)
Select the waveforms that you want to enlarge in the Zoom2 window.
• Main (Main): Main window waveforms
• Zoom1: Zoom1 window waveforms
IM DL850-01EN
8-1
8 Zooming in on Waveforms
Zoom Factor (MAG knob)
Use the Mag knob to set the zoom factor. You can set separate horizontal zoom factors for Zoom1 and Zoom2.
The zoom-window time-axis setting changes automatically based on the specified zoom factor.
Selectable Range
Two times the time axis setting (TIME/DIV) of the Main window to the point where the number of data points in
the zoom window reaches 10 points per div.
• When an external clock signal is being used as the time base, you can select one of the following
magnifications. You can select any magnification up to the point where the number of data points in the
zoom window reaches 10 points per div.
Up to 1000000 in 1-2.5-5 steps (×2, ×2.5, ×5, ×10, ×25, ×50, ×100, ×250, ×500, ×1000, ×2500, and so on)
• The upper limit of the zoom factor during hard disk recording is the maximum zoom factor that can be
displayed during hard disk recording.
Position (Zoom POSITION knob, Zoom1 Position, Zoom2
Position)
You can set the zoom position (position) using the zoom POSITION knob or the jog shuttle. Taking the horizontal
center of the main window to be 0 div, set the center position of the zoom boxes in the range of −5 to 5 div. In the
Main window, the box with solid lines is for Zoom1, and the box with dashed lines is for Zoom2. Waveforms are
magnified around the centers of the zoom boxes.
The Z1 or Z2 indicator on the front panel illuminates to show when the Zoom1 or Zoom2 window can be
moved by the Mag or zoom POSITION knob.
Zoom Link
If you press the Mag knob or zoom POSITION knob so that the Z1 and Z2 indicators both light, you can move
the zoom boxes while maintaining the spatial relationship between them. The relationship between the zoom
factors is also maintained.
Display Ratio of the Main Window (Main Ratio)
Set the size of the main window in relation to the overall waveform display area.
• 50%: The main window appears in the upper half of the screen.
• 20%: The main window appears in the upper 20% screen.
• 0%: The main window is not displayed.
Window Layout (Window Layout)
You can select the layout of the two zoom windows.
• Side: Horizontal
• Vertical: Vertical
8-2
IM DL850-01EN
8 Zooming in on Waveforms
Display Format (Format Zoom1 and Format Zoom2)
Select how to display the zoom windows from one of the options listed below. If you select a number, the zoom
windows are divided evenly, and waveforms are displayed within the divisions.
• Main: Same format as the Main window
• 1, 2, 3, 4, 6, 8, 12, 16
Moving the Zoom Position to the Latest Position (Move Zoom1
to Front and Move Zoom2 to Front)
You can move the position of one of the zoom boxes to the right side of the screen (where the most recent data
is). When the waveform flows from the right to the left of the screen, as in roll mode, you can zoom in on the
waveform where it starts from, on the right side of the screen. These menu items do not appear when the source
waveform of the Zoom2 window is set to Zoom1.
Auto Scroll (Auto Scroll)
This feature automatically moves the zoom position in the specified direction. You can view the waveform and
stop scrolling at the appropriate position.
Zooms in on the left edge of the Main window
Zooms in on the right edge of the Main window
Starts scrolling to the left
Starts scrolling to the right
Stops scrolling
Speed (Speed)
You can select the auto scrolling speed.
Selectable range: 1 to 10. The default setting is 4.
Waveforms That Are Zoomed (Allocation)
The waveforms of the channels whose check boxes are selected in the allocation window and whose displays
are turned on are displayed.
IM DL850-01EN
8-3
9
Cursor Measurement
You can move cursors on the waveforms displayed on the screen to view the measured values at the points
where the cursors intersect the waveforms.
Window Selection (Select Window)
Select the window to perform cursor measurement in. This option appears when X-Y or FFT waveforms are
being displayed.
• T-Y: Displays T-Y waveform cursor-measurement values.
• X-Y: Displays the cursor-measurement values for the waveform in an X-Y window.
• FFT: Displays the cursor-measurement values for the waveform in an FFT window.
T-Y Waveforms
Cursor Types (Type)
The following types of T-Y waveform cursors are available.
• OFF: Cursor measurement is not performed.
• Horizontal cursors (Horizontal): Two horizontal cursors are used to measure vertical values.
• Vertical cursors (Vertical): Two vertical cursors are used to measure time values.
• Horizontal and vertical cursors (H & V): Two horizontal cursors and two vertical cursors are used to measure
vertical and time values.
• Marker cursors (Marker): Four marker cursors that move on the waveform are used to measure waveform
values.
• Angle cursors (Degree): Two angle cursors are used to measure angles.
Horizontal Cursors (Horizontal) - T-Y waveforms
Two dashed lines (horizontal cursors) appear on the horizontal axis. You can measure the vertical value at the
position of each horizontal cursor and measure the level difference between the horizontal cursors.
Y1
Cursor1
ΔY
Y2
Cursor2
Measurement Source Waveform (Trace)
Set the measurement source waveform to one of the waveforms below.
CH1 to CH16,1 16chVOLT,2 CAN,3 Math1 to Math8
1 You can select the channel of an installed module. You cannot select the channel of a logic module.
2 If the 16-CH Voltage Input Module is installed. After you select 16chVOLT, select a sub channel.
3 On the DL850V when a CAN bus monitor module is installed. After you select CAN, select a sub channel. If
the data type (Value Type) is set to Logic, you will not be able to select it.
Moving the Cursors (Cursor1/Cursor2)
Use Cursor1 and Cursor2 to move the cursors.
Taking the center of the waveform display window to be 0 div, you can move the cursors within the range of −5 to
5 div in 0.01 div steps.
IM DL850-01EN
9-1
9 Cursor Measurement
Measurement Items (Item Setup)
You can measure the following vertical values at the cursor positions.
Y1
Y2
ΔY
Vertical value at Cursor1
Vertical value at Cursor2
Difference between the vertical values of Cursor1 and Cursor2
Vertical Cursors (Vertical) - T-Y waveforms
Two straight dashed lines appear on the vertical axis (these are the vertical cursors). You can measure the time
between the trigger position and each cursor, the time difference between the two cursors, and the reciprocal
of the time difference between the two cursors. You can also measure the vertical signal value at each cursor
position and the level difference between the two cursors.
Cursor1
X1
Cursor2
ΔX
X2
Measurement Source Waveform (Trace)
Set the measurement source waveform to one of the waveforms below.
CH1 to CH16,1 16chVOLT,2 CAN,3 Math1 to Math8, All4
1 You can select the channel of an installed module.
2 If the 16-CH Voltage Input Module is installed. After you select 16chVOLT, select a sub channel.
3 On the DL850V when a CAN bus monitor module is installed. After you select CAN, select a sub channel.
4 Cursor measurement is performed on all channels. However, measured values that do not fit on the screen
are not displayed.
Moving the Cursors (Cursor1/Cursor2)
Use Cursor1 and Cursor2 to move the cursors.
Taking the center of the waveform display window to be 0 div, you can move the cursors within the range of −5 to
5 div in steps of the following size: Time/div × 10 ÷ display record length.
Measurement Items (Item Setup)
You can measure the following horizontal values at the cursor positions.
X1
X2
ΔX
1/ΔX
Y1
Y2
ΔY
Time value at Cursor1
Time value at Cursor2
Difference between the time values of Cursor1 and Cursor2
Reciprocal of the difference between the time values of Cursor1 and Cursor2
Vertical value at the intersection of Cursor1 and the waveform1
Vertical value at the intersection of Cursor2 and the waveform2
Difference between the vertical values at the intersections of the waveform with
Cursor1 and Cursor22
1 When Trace is set to All, the values for the channels of all installed modules, the sub channels, and the
Math channel are measured.
2 This option does not appear when Trace is set to All.
9-2
IM DL850-01EN
9 Cursor Measurement
Example of Logic Signal Measurement
When you measure logic waveforms using vertical cursors, the measured values of Y1 and Y2 are determined in
the manner shown below.
When No Bits Are Turned Off
Cursor 1
Cursor 2
1
2
3
4
5
• When the cursor order is 1->8
Bit
Y1: 01001010
Y2: 10110010
Hex Y1: 4A
Y2: B2
• When the cursor order is 8->1
Bit
Y1: 01010010
Y2: 01001101
Hex Y1: 52
Y2: 4D
6
7
8
When Some Bits Are Turned Off
Cursor 1
1
2
4
5
7
8
Cursor 2
• When the cursor order is 1->8
Bit
Y1: 01-01-10
Y2: 10-10-10
Hex Y1: 16
Y2: 2A
• When the cursor order is 8->1
Bit
Y1: 01-10-10
Y2: 01-01-01
Hex Y1: 1A
Y2: 15
In the logic settings in the preferences, you can set the display format (Bit or Hex), the cursor order (Cursor
Order), and the bit order (Bit Order).
IM DL850-01EN
9-3
9 Cursor Measurement
Horizontal and Vertical Cursors (H & V) - T-Y waveforms
Displays the horizontal and vertical cursors simultaneously.
Measurement Source Waveform (Trace)
Set the measurement source waveform to one of the waveforms below.
CH1 to CH16,1 16chVOLT,2 CAN,3 Math1 to Math8
1 You can select the channel of an installed module. You cannot select the channel of a logic module.
2 If the 16-CH Voltage Input Module is installed. After you select 16chVOLT, select a sub channel.
3 On the DL850V when a CAN bus monitor module is installed. After you select CAN, select a sub channel. If
the data type (Value Type) is set to Logic, you will not be able to select it.
Moving the Cursors (V Cursor1/V Cursor2, H Cursor1/H Cursor2)
Use V-Cursor1, V-Cursor2, H-Cursor1, and H-Cursor2 to move the cursors.
Taking the center of the waveform display window to be 0 div, you can move the cursors within the range of −5 to
5 div in steps of the following sizes: for horizontal cursors, 0.01 div; for vertical cursors, Time/div × 10 ÷ display
record length.
Measurement Items (Item Setup)
You can measure the following horizontal and vertical values at the cursor positions.
Horizontal Axis
X1
X2
ΔX
1/ΔX
Vertical Axis
Y1
Y2
ΔY
Time value at V-Cursor1
Time value at V-Cursor2
Difference between the time values of V-Cursor1 and V-Cursor2
Reciprocal of the difference between the time values of V-Cursor1 and V-Cursor2
Vertical value of H-Cursor1
Vertical value of H-Cursor2
Difference between the vertical values of H-Cursor1 and H-Cursor2
Marker Cursors (Marker) - T-Y waveforms
Four markers are displayed on the selected waveform. You can measure the level at each marker, the amount of
time from the trigger position to each marker, and the level and time differences between markers.
Marker1
Marker3
Y
X
Y
+
Marker2
Marker4
Markers (Marker1 through 4)
Select the markers, from Marker1 to 4, that you want to display. You can assign each marker to a different
waveform.
9-4
IM DL850-01EN
9 Cursor Measurement
Measurement Source Waveform (Trace)
Set the measurement source waveform to one of the waveforms below.
• OFF: Disables the marker
• CH1 to CH16,1 16chVOLT,2 CAN,3 Math1 to Math8
1 You can select the channel of an installed module. You cannot select the channel of a logic module.
2 If the 16-CH Voltage Input Module is installed. After you select 16chVOLT, select a sub channel.
3 On the DL850V when a CAN bus monitor module is installed. After you select CAN, select a sub channel. If
the data type (Value Type) is set to Logic, you will not be able to select it.
Position (Position)
Set the position of the selected marker.
Taking the center of the waveform display window to be 0 div, you can move the markers within the range of −5
to 5 div in steps of the following size: Time/div × 10 ÷ display record length.
Marker Shape (Marker Form)
Set the shape of the displayed marker to one of the options below.
• Mark: A dot
• Line: A crosshair
Measurement Items (Item Setup)
Marker cursors move on the waveform data. You can measure the following values at the markers.
X1
X2
X3
X4
Δ(X2-X1)
Δ(X3-X1)
Δ(X4-X1)
Δ(X3-X2)
Δ(X4-X2)
Δ(X4-X3)
Y1
Y2
Y3
Y4
Δ(Y2-Y1)
Δ(Y3-Y1)
Δ(Y4-Y1)
Δ(Y3-Y2)
Δ(Y4-Y2)
Δ(Y4-Y3)
IM DL850-01EN
Time value at Marker1
Time value at Marker2
Time value at Marker3
Time value at Marker4
Difference between the time values of Marker1 and Marker2
Difference between the time values of Marker1 and Marker3
Difference between the time values of Marker1 and Marker4
Difference between the time values of Marker2 and Marker3
Difference between the time values of Marker2 and Marker4
Difference between the time values of Marker3 and Marker4
Vertical value at Marker1
Vertical value at Marker2
Vertical value at Marker3
Vertical value at Marker4
Difference between the vertical values of Marker1 and Marker2
Difference between the vertical values of Marker1 and Marker3
Difference between the vertical values of Marker1 and Marker4
Difference between the vertical values of Marker2 and Marker3
Difference between the vertical values of Marker2 and Marker4
Difference between the vertical values of Marker3 and Marker4
9-5
9 Cursor Measurement
Angle Cursors (Degree) - T-Y waveforms
You can measure time values and convert them to angles. On the time axis, set the zero point (Ref Cursor1
position), which will be the measurement reference, the end point (Ref Cursor2 position), and the reference
angle that you want to assign to the difference between Ref Cursor1 and Ref Cursor2. Based on this reference
angle, you can measure the angle between two angle cursors (Cursor1 and Cursor2).
Cursor1
Cursor2
Reference angle
Ref Cursor1
Ref Cursor2
Measurement Source Waveform (Trace)
Set the measurement source waveform to one of the waveforms below.
CH1 to CH16,1 16chVOLT,2 CAN,3 Math1 to Math8, All4
1 You can select the channel of an installed module.
2 If the 16-CH Voltage Input Module is installed. After you select 16chVOLT, select a sub channel.
3 On the DL850V when a CAN bus monitor module is installed. After you select CAN, select a sub channel.
4 Cursor measurement is performed on all channels.
Moving the Cursors (Cursor1/Cursor2)
Use Cursor1 and Cursor2 to move the cursors.
Taking the center of the waveform display window to be 0 div, you can move the cursors within the range of −5 to
5 div in steps of the following size: Time/div × 10 ÷ display record length.
Reference Angle (Ref Value)
Set the reference angle you want to assign to the range defined by Ref Cursor1 and Ref Cursor2.
Selectable range: 1 to 720
References (Ref1/Ref2)
Set the zero point (Ref Cursor1) and the end point (Ref Cursor2).
Taking the center of the waveform display window to be 0 div, you can move the cursors within the range of −5 to
5 div in steps of the following size: Time/div × 10 ÷ display record length.
Measurement Items (Item Setup)
The DL850/DL850V measures the angle cursor (Cursor1 and Cursor2) positions as angles.
X1
X2
ΔX
Y1
Y2
ΔY
Angle of Cursor1 from Ref Cursor1
Angle of Cursor2 from Ref Cursor1
Angle difference between Cursor1 and Cursor2
Vertical value at the intersection of Cursor1 and the waveform1
Vertical value at the intersection of Cursor2 and the waveform2
Difference in the vertical values at the points where Cursor1 and
Cursor2 intersect the waveforms2
1 When Trace is set to All, the values for the channels of all installed modules, the sub channels, and the
Math channel are measured.
2 This option does not appear when Trace is set to All.
9-6
IM DL850-01EN
9 Cursor Measurement
X-Y Waveforms
Cursor Types (Type)
The following types of X-Y waveform cursors are available.
• OFF: Cursor measurement is not performed.
• Horizontal cursors (Horizontal): Two horizontal cursors are used to measure vertical (Y axis) values.
• Vertical cursors (Vertical): Two vertical cursors are used to measure horizontal (X axis) values.
• Horizontal and vertical cursors (H & V): Two horizontal cursors and two vertical cursors are used to measure
vertical (Y axis) and horizontal (X axis) values.
• Marker cursors (Marker): Four marker cursors that move on the waveform are used to measure waveform
values.
Horizontal Cursors (Horizontal)
Two dashed lines (horizontal cursors) appear on the horizontal axis. You can measure the vertical (Y axis) value
at the position of each horizontal cursor and measure the level difference between the horizontal cursors.
Measurement Source Waveform (Trace)
Set the measurement source waveform to one of the waveforms below.
XY1 to XY8
Moving the Cursors (Cursor1/Cursor2)
Use Cursor1 and Cursor2 to move the cursors.
Taking the center of the waveform display window to be 0 div, you can move the cursors within the range of −5 to
5 div in 0.01 div steps.
Measurement Items (Item Setup)
You can measure the following vertical (Y axis) values at the cursor positions.
Y1
Y2
ΔY
Vertical (Y axis) value at Cursor1
Vertical (Y axis) value at Cursor2
Difference between the vertical (Y axis) values of Cursor1 and Cursor2
Vertical Cursors (Vertical)
Two dashed lines (vertical cursors) appear on the vertical axis. You can measure the horizontal (X axis) value at
the position of each vertical cursor and measure the level difference between the vertical cursors.
Measurement Source Waveform (Trace)
Set the measurement source waveform to one of the waveforms below.
XY1 to XY8
Moving the Cursors (Cursor1/Cursor2)
Use Cursor1 and Cursor2 to move the cursors.
Taking the center of the waveform display window to be 0 div, you can move the cursors within the range of −5 to
5 div in 0.01 div steps.
IM DL850-01EN
9-7
9 Cursor Measurement
Measurement Items (Item Setup)
You can measure the following horizontal (X axis) values at the cursor positions.
X1
X2
ΔX
Horizontal (X axis) value at Cursor1
Horizontal (X axis) value at Cursor2
Difference between the horizontal (X axis) values of Cursor1 and Cursor2
Horizontal and Vertical Cursors (H & V)
You can display the horizontal and vertical cursors simultaneously and measure vertical (Y axis) and horizontal (X
axis) values.
Measurement Source Waveform (Trace)
Set the measurement source waveform to one of the waveforms below.
XY1 to XY8
Moving the Cursors (V Cursor1/V Cursor2, H Cursor1/H Cursor2)
Use V-Cursor1, V-Cursor2, H-Cursor1, and H-Cursor2 to move the cursors.
Taking the center of the waveform display window to be 0 div, you can move the cursors within the range of −5 to
5 div in 0.01 div steps.
Measurement Items (Item Setup)
You can measure the following horizontal (X axis) and vertical (Y axis) values at the cursor positions.
Horizontal Axis (X axis)
X1
Horizontal (X axis) value at V-Cursor1
X2
Horizontal (X axis) value at V-Cursor2
ΔX
Difference between the horizontal (X axis) values of V-Cursor1 and V-Cursor2
Vertical Axis (Y axis)
Y1
Vertical (Y axis) value at H-Cursor1
Y2
Vertical (Y axis) value at H-Cursor2
ΔY
Difference between the vertical (Y axis) values of H-Cursor1 and H-Cursor2
Marker Cursors (Marker)
Four markers are displayed on the selected waveform. You can measure the level at each marker, the amount of
time from the trigger position to each marker, and the level and time differences between markers.
Markers (Marker1 through 4)
Select the markers, from Marker1 to 4, that you want to display. You can assign each marker to a different
waveform.
Measurement Source Waveform (Trace)
Set the measurement source waveform to one of the waveforms below.
XY1 to XY8
9-8
IM DL850-01EN
9 Cursor Measurement
Position (Position)
Set the position of the selected marker.
Taking the center of the waveform display window to be 0 div, you can move the markers within the range of −5
to 5 div in steps of the following size: Time/div × 10 ÷ display record length.
Marker Shape (Marker Form)
Set the shape of the displayed marker to one of the options below.
• Mark: A dot
• Line: A crosshair
Measurement Items (Item Setup)
Marker cursors move on the waveform data. You can measure the following values at the markers.
X1
X2
X3
X4
Y1
Y2
Y3
Y4
T1
T2
T3
T4
Δ(T2-T1)
Δ(T3-T1)
Δ(T4-T1)
Horizontal (X axis) value at Marker1
Horizontal (X axis) value at Marker2
Horizontal (X axis) value at Marker3
Horizontal (X axis) value at Marker4
Vertical (Y axis) value at Marker1
Vertical (Y axis) value at Marker2
Vertical (Y axis) value at Marker3
Vertical (Y axis) value at Marker4
Time from the trigger position at Marker1
Time from the trigger position at Marker2
Time from the trigger position at Marker3
Time from the trigger position at Marker4
Time difference between Marker1 and Marker2
Time difference between Marker1 and Marker3
Time difference between Marker1 and Marker4
FFT Waveforms
Cursor Types (Type)
The following types of FFT waveform cursors are available.
• OFF: Cursor measurement is not performed.
• Marker cursors (Marker): You can use four marker cursors to measure frequencies, levels, and the distances
between markers.
• Peak cursors (Peak): You can use peak cursors to measure peak frequency and level values.
Marker Cursors (Marker)
You can measure the frequency and level at each marker and the frequency and level differences between
markers. You can select a measurement source waveform for each cursor.
Markers (Marker#)
The selected markers appear on the measurement source waveforms.
Measurement Source Waveform (Trace)
Set the measurement source waveform for each marker to one of the waveforms below.
• OFF: Disables measurement.
• FFT1: The waveform in the FFT1 window is measured.
• FFT2: The waveform in the FFT2 window is measured. You can make measurements in the FFT2 window on
models equipped with the /G2 option.
IM DL850-01EN
9-9
9 Cursor Measurement
Position (Position)
Set the position of the selected marker.
You can move the markers within the range of −5 to 5 div of the frequency axis in 0.01 div steps.
Marker Shape (Marker Form)
Set the shape of the displayed marker to one of the options below.
• Mark: A dot
• Line: A crosshair
Measurement Items (Item Setup)
Marker cursors move on the waveform data. You can measure the following values at the markers.
X1
X2
X3
X4
Δ(X2-X1)
Δ(X3-X1)
Δ(X4-X1)
Δ(X3-X2)
Δ(X4-X2)
Δ(X4-X3)
Y1
Y2
Y3
Y4
Δ(Y2-Y1)
Δ(Y3-Y1)
Δ(Y4-Y1)
Δ(Y3-Y2)
Δ(Y4-Y2)
Δ(Y4-Y3)
Frequency at Marker1
Frequency at Marker2
Frequency at Marker3
Frequency at Marker4
Frequency difference between Marker1 and Marker2
Frequency difference between Marker1 and Marker3
Frequency difference between Marker1 and Marker4
Frequency difference between Marker2 and Marker3
Frequency difference between Marker2 and Marker4
Frequency difference between Marker3 and Marker4
Level at Marker1
Level at Marker2
Level at Marker3
Level at Marker4
Level difference between Marker1 and Marker2
Level difference between Marker1 and Marker3
Level difference between Marker1 and Marker4
Level difference between Marker2 and Marker3
Level difference between Marker2 and Marker4
Level difference between Marker3 and Marker4
Peak Cursors (Peak)
The DL850/DL850V detects the waveform peaks in the range of −5 to 5 div of the frequency axis and measures
their frequencies and levels.
Measurement Items (Item Setup)
The following values at the peaks are measured. F2 and Y2 are items that can be measured on models with the
/G2 option.
F1
F2
Y1
Y2
9-10
Frequency at Peak1
Frequency at Peak2
Level at Peak1
Level at Peak2
IM DL850-01EN
9 Cursor Measurement
Notes about Cursor Measurement
Cursor Measurement
• You cannot perform cursor measurement on snapshot waveforms or accumulated waveforms that have been
acquired in the past. You can perform cursor measurement on the most recent accumulated waveform.
• For history waveforms, cursor measurement is performed on the waveform whose record number is selected.
• The measured time values are based on the trigger position.
• The measured value for data that cannot be measured appears as “***.”
• The pulse/rotate setting only affects the X-axis (horizontal) cursor measurement values.
• While the dual capture window is displayed, you can perform cursor measurements on captured waveforms.
To perform cursor measurements on the main waveform, on the DUAL CAPTURE menu, turn the display of
the dual capture window off (Window: OFF).
• The results of measuring captured waveforms are displayed in italics.
Selectable Range of Cursor Positions
In cursor measurements, measurement is performed on the data stored in the acquisition memory, not on the
displayed data. Because 1001 points along the time axis are used to display the waveform, the number of
acquired data points is equal to the set record length × 1.001. If the record length is set to 10 kpoint, the number
of acquired data points is 10010. Therefore, if the record length is set to 10 kpoint, there will be 10 points of
measured data at the same position on the screen. The cursor display position is normally within ±5 div of the
center of the waveform display window. In this case, if the cursor display position is set to 5 div from the center
of the window, only 1 point out of 10 points can be measured even if there are 10 points of measured data at
the same time axis position. For these kinds of situations, the cursor position can be set in the range of −5 div to
5.009 div (if the record length is set to 10 kpoint) from the center of the window. In other words, you can measure
the data at the right end of the waveform display window by setting the cursor position to a value in the range of
5.000 to 5.009 div from the center of the window. Because the number of points at the same time axis position
increases as the record length gets larger, the range varies depending on the record length (5.000 to 5.0099 div
for 100 kpoint).
–5 div
Range within which the
cursors can be moved
0
5 div
There are 10 points
of measured data.
Cursor positions for 10
points of measured data
0.001 div = 1 point of
measured
data
5.000 div 5.009 div
–5.000 div –4.991 div
0.000 div 0.009 div
Range within which the cursors can be set
Record length = 10 kpoint (10010 points)
Notes about Using the 16-CH Voltage Input Module
IM DL850-01EN
9-11
10 Automated Measurement of Waveform
Parameters
The DL850/DL850V can automatically measure various parameters of the displayed waveform, such as the
maximum and minimum values. It can also compute statistics for the automatically measured data.
Mode Settings (Mode)
The following types of statistical processing are available for the automatically measured values of waveform
parameters.
• OFF: Automated measurement is not performed.
• Automated measurement of waveform parameters (ON): Automated measurement is performed.
• Normal statistical processing (Statistics): Normal statistical processing is performed.
• Cyclic statistical processing (Cycle Statistics): Statistical processing is performed for each period (cyclic
statistical processing).
• Statistical processing of history waveforms (History Statistics): Statistical processing is performed on history
waveforms.
Automated Measurement of Waveform Parameters (ON)
The DL850/DL850V automatically measures the specified measurement items on the source waveform.
Measurement Items (Measure Setup)
Measurement Source Waveform (Trace)
Set the measurement source waveform to one of the waveforms below.
CH1 to CH16,1 16chVOLT,2 CAN,3 Math1 to Math8, XY1 to XY8
1 You can select the channel of an installed module. You cannot select the channel of a logic module.
2 If the 16-CH Voltage Input Module is installed. After you select 16chVOLT, select a sub channel.
3 On the DL850V when a CAN bus monitor module is installed. After you select CAN, select a sub channel. If
the data type (Value Type) is set to Logic, you will not be able to select it.
Measurement Item (Item)
You can choose from the 28 measurement items and delay measurement items listed below. The DL850/
DL850V can store a total of up to 64000 data values for all waveforms (CH1 through CH16, 16chVOLT, CAN,
and Math1 to Math8). A total of up to 32 measurement items can be displayed on the screen.
IM DL850-01EN
10-1
10 Automated Measurement of Waveform Parameters
• Voltage Measurement Items
Peak to Peak(P-P)
Amplitude(Amp)
Maximum(Max)
Minimum(Min)
High
Low
Average(Avg)
Middle(Mid)
RMS1
Std.Deviation(SDev)
+Overshoot(+Over)
−Overshoot(−Over)
P-P value (Max − Min) [V]
Amplitude (High − Low) [V]
Maximum voltage [V]
Minimum voltage [V]
High voltage [V]
Low voltage [V]
Average voltage ((1/n)Σxi) [V]
(Max + Min)/2 [V]
Rms voltage ((1/ (√n))(Σ(xN2))1/2) [V]
Standard deviation (1/n(Σxi2 − (Σxi)2/n)1/2) [V]
Overshoot ((Max − High)/(High − Low) × 100) [%]
Undershoot ((Low − Min)/(High − Low) × 100) [%]
1 On a channel that has been set to power spectrum computation (PS or PSD), if RMS is set to ON, “Rms
= overall value” appears on the screen.
* The names in parentheses are the measurement item names that appear when the measured values
are displayed.
Max
High
+Over
P-P
–Over
Min
Low
• Time Measurement Items
Rise
Fall
Frequency(Freq)
Period
+Width
−Width
Duty
Avg.Frequency(Avg.F)
Avg.Period(Avg.P)
Rise time [s]
Fall time [s]
Frequency [Hz]
Period [s]
Time width of the portion that is greater than the mesial value [s]
Time width of the portion that is less than the mesial value [s]
Duty cycle (+Width/Period × 100) [%]
Average frequency in the measurement time period [Hz]
Average period in the measurement time period [s]
* The names in parentheses are the measurement item names that appear when the measured values
are displayed.
Period
+Width
–Width
High (100%)
Distal line (90%)
Mesial line (50%)
Proximal line (10%)
Low (0%)
Rise
10-2
Fall
IM DL850-01EN
10 Automated Measurement of Waveform Parameters
Pulse
Pulse count
Set the measurement time period (Time Range) to a value appropriate for the pulse that you
want to measure.
When Pulse = 3
Distal line (90%)
Mesial line (50%)
Proximal line (10%)
Period
T2
T1
Burst1 and Burst2
Burst period [s]
Set the measurement time period (Time Range) to a value appropriate for the burst period
that you want to measure.
Distal line (90%)
Mesial line (50%)
Proximal line (10%)
T1
Burst2
Burst1
Period
T2
• Other Measurement Items
When Trace Is Set to CH, Sub Channel, or Math
Integ1TY(Integ1)
Area of the positive amplitude
Integ2TY(Integ2)
Area of the positive amplitude − area of the negative amplitude
When Trace Is Set to XY
Integ1XY(Integ1)
Total triangular area of the X-Y waveform
Integ2XY(Integ2)
Total trapezoidal area of the X-Y waveform
* The names in parentheses are the measurement item names that appear when the measured values
are displayed.
For detailed information about how the area of the X-Y waveform is computed, see Appendix 1, “How
Waveform Areas Are Calculated.”
All Clear (All Clear)
You can turn off all the items for the waveform selected for Trace at once.
Copy (Copy to)
You can copy the settings of the waveform selected for Trace to other traces.
• You can turn the following channels on and off separately: CH1 to CH16,1 16chVOLT,2 CAN,3 Math1 to Math8.
1 You can select the channel of an installed module. You cannot select the channel of a logic module.
2 If the 16-CH Voltage Input Module is installed. Select individual sub channels from the ones displayed.
3 On the DL850V when a CAN bus monitor module is installed. Select individual sub channels from the ones
displayed. If the data type (Value Type) is set to Logic, you will not be able to select it.
• All ON: All traces are turned on.
• All OFF: All traces are turned off.
• Execute: Select Execute to copy the settings.
When Trace is set to XY, All Clear and Copy to are not available.
IM DL850-01EN
10-3
10 Automated Measurement of Waveform Parameters
Setting the Delay (Delay Setup)
The time difference between traces or the time difference from the trigger point to a rising or falling edge is called
the delay between channels.
Period
Count 1
Count N1
Mesial line
Reference waveform
(Reference)
Delay between channels
Count 1
Count N2
Source waveform
(Measure)
Reference waveform settings
Source waveform settings
• Polarity
• Polarity
:
(rising)
:
(rising)
• Edge Count : N1 (an integer
• Edge Count : N1 (an integer
between 1 and 9)
between 1 and 9)
• Mode
Select a delay measurement mode.
• OFF: Delay measurement is not performed.
• Time: The delay between channels is displayed as a time.
• Degree: The delay between channels is displayed as an angle.
• Polarity
Select the slope of the edge you want to detect.
•
: Rising
•
: Falling
• Edge Count
Sets which edge counted from the start point (T Range1) of the measurement time period to use as a
detected point (measured point).
Selectable range: 1 to 9
• Reference
Select whether to use a trace or trigger as the reference for the reference waveform.
• Trace: A trace is used.
• Trigger: A trigger is used.
• Reference Waveform (Reference Trace)
When Reference is set to Trace, set the reference waveform.
• Trace: Select a reference waveform. CH1 to CH16,1 16chVOLT,2 CAN,3 Math1 to Math8
1 You can select the channel of an installed module. You cannot select the channel of a logic module.
2 If the 16-CH Voltage Input Module is installed. After you select 16chVOLT, select a sub channel.
3 On the DL850V when a CAN bus monitor module is installed. After you select CAN, select a sub
channel. If the data type (Value Type) is set to Logic, you will not be able to select it.
• Polarity: Select the slope of the edge you want to detect ( : rising, : falling).
• Edge Count: Sets which edge counted from the start point (T Range1) of the measurement time period to
use as a detected point (reference point). Selectable range: 1 to 9
10-4
IM DL850-01EN
10 Automated Measurement of Waveform Parameters
• The voltage level of the detected point is the mesial line.
• The measurement item name that appears when the measured values are displayed is (Delay).
• If Mode is set to Degree and Reference is set to Trigger, the measured value is displayed as ‘*****’.
Detail Parameter (Detail Parameter)
Set the reference level that is used to measure various parameter values, such as the rise and fall times, for
each measurement source waveform.
• Distal, Mesial, and Proximal Unit Setting (Mode)
Set the method for setting the three levels that are used as references in the measurement of various
parameter values, such as the rise and fall times.
• %
You can set the distal, mesial, and proximal values as percentages of the specified trace (CH1 to CH16,
16chVOLT, CAN, or Math1 to Math8). The high value of the specified trace is equal to 100%, and the low
value is equal to 0%.
• Unit
You can set the distal, mesial, and proximal values of the specified trace (CH1 to CH16, 16chVOLT, CAN,
or Math1 to Math8) by specifying physical values, such as voltages or temperatures.
• Distal, Mesial, and Proximal Settings (Distal, Mesial, Proximal)
You can set the distal, mesial, and proximal values.
• Selectable range: 0.0 to 100.0% (in 0.1% steps) or voltage or temperature values that correspond to ±
10 div (the steps that you can set voltage and temperature values in vary depending on the module. See
Range of V/div).
• High/Low Specification Method (High/Low)
The high and low levels are the 100% and 0% levels used to measure various parameter values, such as the
rise and fall times. You can choose one of the following methods for setting the high and low levels.
• Auto
The DL850/DL850V sets the high value to the high amplitude level and the low value to the low amplitude
level based on the voltage level frequency of the waveform in the measurement time period while taking
into account the effects of ringing, spikes, etc. This method is suitable for measuring square waves and
pulse waves.
• Max-Min
The DL850/DL850V sets the high and low values to the maximum and minimum values in the
measurement time period. This method is suitable for measuring sinusoidal and saw waves. It is not
suitable for waveforms that have ringing and spikes.
Measurement Time Period (Time Range1/Time Range2)
Set the measurement time period using two vertical cursors. The position of the thin dashed line (Time Range1)
is the measurement start point. The position of the thick dashed line (Time Range2) is the measurement end
point. The number of data points in the measured waveform can be up to 100 Mpoint from the measurement
start point.
The measurement time period is similar to the selectable range of the cursor display position in cursor
measurement.
For details, see “Selectable Range of Cursor Positions.”
IM DL850-01EN
10-5
10 Automated Measurement of Waveform Parameters
1-Cycle Mode (1-Cycle Mode)
Instead of automatically measuring the measurement time period specified by Time Range1 and Time Range2,
you can automatically measure the first period after Time Range1.
The method of determining the period is the same as the method for determining the Period measurement item.
In this mode, after the period is determined, the values of the measurement items related to voltage and area
are computed. This mode is effective for measurement items, such as Rms or Avg, that may result in errors
depending on the measurement time period setting.
The measurements of time axis items and X-Y areas are not affected.
• OFF: 1-cycle mode is disabled.
• ON: 1-cycle mode is enabled.
Measurement Time Period for Each Cycle Mode
High (100%)
Distal line (90%)
Mesial line (50%)
Proximal line (10%)
1 Cycle
Time Range1
OFF
Low (0%)
Time Range2
If the space between Time Range1 and Time Range2 is less than one period, “*****” is displayed for the
measured value.
Notes about Automated Measurement of Waveform Parameters
• Measurements cannot be made on a snapshot waveform or an accumulated waveform that is not the most
recent waveform.
• When an item is impossible to measure (its measurement time period is greater than 100 Mpoint), its
measured value is displayed as ‘*****’.
• The DL850/DL850V may not measure correctly if the waveform amplitude is small.
• If there are two or more waveform periods within the measurement time period, the time-axis parameters are
measured on the first period.
• Logic waveforms cannot be automatically measured.
• When automated measurement is performed on a waveform that has been recorded to a hard disk, extra time
will be required for hard disk access.
• Automated measurement may require additional time depending on settings such as the memory length, the
•
•
•
•
10-6
appears in the
number of measurement items, and the input waveform. During automated measurement,
center of the screen.
To cancel automated measurement, set Mode to OFF. Measurement stops immediately.
Only the Max and Min items can be measured for FFT waveforms. Only the overall rms power spectrum value
can be measured.
While the dual capture window is displayed, you can perform automated measurements of waveform
parameters on captured waveforms.
To perform automated measurement of the waveform parameters in the main window, turn the display of the
dual capture window off.
The automated measurement results of captured waveforms are displayed in italics.
IM DL850-01EN
10 Automated Measurement of Waveform Parameters
Normal Statistical Processing (Statistics)
While acquiring waveforms, the DL850/DL850V calculates the statistics of the waveforms that it has acquired so
far. If you stop waveform acquisition and then restart it, the DL850/DL850V will continue statistical processing
and include the data from before waveform acquisition was stopped. The DL850/DL850V also performs
statistical processing for selected automatically measured items that are not displayed. The number of measured
values used to calculate statistics (Count) is equal to the number of waveforms that have been acquired up to
that point.
If you add an additional automatically measured item to apply statistical processing to, the number of measured
values used to calculate the statistics (Cnt) is reset to 1 regardless of whether the DL850/DL850V is acquiring
waveforms.
Measurement Items (Measure Setup)
Statistical processing is performed on the same measurement items that the automated measurement of
waveform parameters is performed on. The following five statistics are computed for the measurement items
whose measurement has been turned on. The maximum number of measurement items that can be displayed
on the screen is 3.
• Maximum: Maximum value
• Minimum: Minimum value
• Average: Average value
• SDev: Standard deviation
• Count: Number of measured values used to calculate statistics
The measurement items are the same as those for the automated measurement of waveform parameters.
If you select CH1 P-P as the automatically measured item, the number of measured values used to calculate
the maximum, minimum, mean, and standard deviation values for CH1 P-P appear at the bottom of the
screen.
The DL850/DL850V can display the statistical results of three automatically measured items. If four or more
automatically measured items are selected, the DL850/DL850V displays the first three items ordered by
ascending channel number and the order that the items appear in the Item Setup automated-measurementitem selection menu (P-P, Amp, Max, Min, ..., Init1XY, and Init2XY).
Example 1:
When CH1: P-P, Amp; CH2: Min; CH3: Max, Min are selected, the following items are displayed: CH1: P-P;
CH2: Min; CH3:Max.
Example 2:
When CH1: Max, Min; CH2: P-P, Amp are selected, the following items are displayed: CH1: Max, Min; CH2:
P-P.
You can view the statistics of other items in the following way.
• Load the items into a PC using the communication feature.
• Save the statistical items as automated measurement values of waveform parameters, and load the data
into a PC.
• Scroll through the list of calculated statistics using the arrow keys.
Measurement Time Period (Time Range1/Time Range2)
This setting is the same as the measurement time period setting for the automated measurement of waveform
parameters.
IM DL850-01EN
10-7
10 Automated Measurement of Waveform Parameters
1-Cycle Mode (1-Cycle Mode)
This setting is the same as the 1-cycle mode setting for the automated measurement of waveform parameters.
Cyclic Statistical Processing (Cycle Statistics)
The DL850/DL850V determines periods in order from the oldest data of the displayed waveform, measures the
selected automatically measured items within each period, and performs statistical processing on the results of
automated measurement. The method used to determine the period in cyclic statistical processing is the same
as the method used to determine the Period waveform parameter. You can choose whether to determine the
period for the selected waveform and use it on all source waveforms or to determine individual periods for each
waveform.
Example in Which Cycle Trace Is Set to CH2
CH1
CH2
a
b
c
Measures the items in ranges a, b, and c, and calculates statistics on the
items in the order a, b, and c.
The items of other channels are also measured in ranges a, b, and c.
If you select Own, the items are measured over each waveform’s period.
Measurement Items (Measure Setup)
These items are the same as those for the normal statistical processing of automated measurement parameters.
The following items are not measured:
• For waveforms that are used in period determination
Avg.Frequency, Avg.Period, Pulse (pulse count), Integ1XY (area), Integ2XY (area), Delay
• For other waveforms
Integ1XY (area), Integ2XY (area), Delay
Measurement Time Period (Time Range1/Time Range2)
This setting is the same as the measurement time period setting for the automated measurement of waveform
parameters.
10-8
IM DL850-01EN
10 Automated Measurement of Waveform Parameters
Cycle Trace (Cycle Trace)
Selects the source waveform used to determine the period.
• CH1 to CH16,1 16chVOLT,2 CAN,3 Math to Math8
The period of the specified waveform is applied to all waveforms.
1 You can select the channel of an installed module. You cannot select the channel of a logic module.
2 If the 16-CH Voltage Input Module is installed. After you select 16chVOLT, select a sub channel.
3 On the DL850V when a CAN bus monitor module is installed. After you select CAN, select a sub channel.
If the data type (Value Type) is set to Logic, you will not be able to select it.
• Own
A period is determined for each source waveform. However, if signals that have different periods are applied
to multiple channels, the number of iterations of automated measurement and statistical processing for each
signal is equal to the number of periods in the slowest signal.
When Cycle Trace Is Set to Own
CH1
Statistically processed cycles
CH2
Statistically processed cycles
CH3
Statistically processed cycles
The number of cycles in the channel with the slowest cycle (CH3)
is four, so statistical processing is performed on the four oldest
cycles of the data for CH1 and CH2. The remaining data is not
used for statistical processing.
Statistical processing is performed in periods that are determined in order from the oldest data of the
displayed waveform. It cannot be used at the same time as 1-cycle mode.
Execution of Measurement (Execute Measure)
Executes statistical processing. You can select Execute Measure when Mode is set to Cycle Statistics or History
Statistics.
Press Abort to stop statistical processing.
• The number of cycles being used for the cyclic statistical processing is displayed in the statistical display’s
Count column.
• The number of cycles that can be used in cyclic statistical processing varies depending on the number of
measured items that the DL850/DL850V is calculating the statistics of.
64000/(the number of measured items that the DL850/DL850V is calculating the statistics of)
IM DL850-01EN
10-9
10 Automated Measurement of Waveform Parameters
Result Display (Display Result)
Displays a list of calculated statistics. You can display the list of statistics when Mode is set to Cycle Statistics or
History Statistics.
Numbers are assigned to the data in order from the oldest cycle data or history data, and the automated
measurement results for each number are displayed.
The maximum and minimum values for each parameter are indicated on the list by (maximum value) and
(minimum value). If the same value appears in multiple locations, the oldest occurrence of the value is marked
as the maximum or minimum value.
The number of data points that can be listed is 64000. If the number of data points exceeds 64000, the most
recent data points in the history waveform or automatically measured item data are displayed. If the number of
data points exceeds 64000, the maximum and minimum values may be outside of range of the displayed list.
When this happens, (maximum value) and (minimum value) will not appear.
• Sort
Sorts the list in the specified order.
Forward (from the oldest) or Reverse (from the latest)
• Statistics Max
Moves to the maximum value ( ) for the selected measurement item.
• Statistics Min
Moves to the minimum value ( ) for the selected measurement item.
In cyclic statistical processing, you can select a waveform number (one period) with the jog shuttle and press
the SET key to zoom in on it. Statistical processing is only performed on the number of data points that can
be displayed in the list.
Statistical Processing of History Waveforms (History Statistics)
In the statistical processing of history waveforms, the DL850/DL850V measures automatically measured items
on the acquired waveform using the history feature and performs statistical processing on them. Statistical
processing is performed on older waveform data first. The waveforms that statistical processing is performed on
are those waveforms shown in the List that can be accessed from the HISTORY menu. Statistical processing of
history waveforms can be used with 1-cycle mode and the delay feature.
Measurement Items (Measure Setup)
These items are the same as those for the normal statistical processing of automated measurement parameters.
Measurement Time Period (Time Range1/Time Range2)
This setting is the same as the measurement time period setting for the automated measurement of waveform
parameters.
Execution of Measurement (Execute Measure)
This item is the same as the Execute Measure item for cyclic statistical processing.
• In the statistical processing of history waveforms, the number of history waveforms that processing is
performed on is indicated in the Count column of the statistical value display.
• The number of history waveforms that can be used in the statistical processing of history waveforms varies
depending on the number of measured items that the DL850/DL850V is calculating the statistics of.
64000/(the number of measured items that the DL850/DL850V is calculating the statistics of)
10-10
IM DL850-01EN
10 Automated Measurement of Waveform Parameters
Result Display (Display Result)
This item is the same as the Display Result item for cyclic statistical processing.
In the statistical processing of history waveforms, you can select a waveform with the jog shuttle and press
the SET key to zoom in on it.
Notes about Statistical Processing
• During statistical processing,
appears in the center of the screen. All soft keys except for Abort are invalid.
• Statistical processing cannot be performed:
• On waveforms that have been recorded to a hard disk.
• On FFT waveforms.
• When the measurement time period is greater than 100 Mpoint.
• The starting and stopping of statistical processing may require additional time depending on settings such as
the record length, the number of statistical processing items, and the input waveform.
• While the dual capture window is displayed, you can perform statistical processing on captured waveforms.
To perform statistical processing on the waveforms in the main window, turn the display of the dual capture
window off.
• The automated measurement results of captured waveforms are displayed in italics.
Notes about Using the 16-CH Voltage Input Module
IM DL850-01EN
10-11
11 Computation
You can perform various computations on up to 1 Mpoint of data. (When more than 1 Mpoint of waveform data is
displayed, computation is performed on the first 1 Mpoint of data from the computation start point.)
The results of computation are displayed in Math1 to Math8. Waveforms stored through hard disk recording
cannot be computed.
Turning Computation On and Off (Mode)
Select whether to use computation.
• ON: Computation is used.
• OFF: Computation is not used.
Computation Waveform Selection (Select Math Trace)
Select a computed waveform to use to display the computation results.
Math1 to Math8
Computation Settings (Math Setup)
Operator (Operation)
Select an operator (type of computation) from the options below.
• OFF: Computation is not performed.
• S1+S2: Adds the waveforms assigned to Source1 and Source2
• S1−S2: Subtracts the waveform assigned to Source2 from the waveform assigned to Source1
• S1*S2: Multiplies the waveforms assigned to Source1 and Source2
• S1/S2: Divides the waveform assigned to Source1 by waveform assigned to Source2
• Bin(S1): Converts the waveform assigned to Source to binary
• PS(S1): Computes the power spectrum of the waveform assigned to Source
• Shift(S1): Shows the waveform assigned to Source with its phase shifted
• User Define: Performs user-defined computation (/G2 option).
IM DL850-01EN
11-1
11 Computation
Basic Arithmetic (S1+S2, S1−S2, S1*S2, and S1/S2)
Performs addition, subtraction, multiplication, or division on the two waveforms assigned to Source1 and
Source2.
+ computed
waveform
– computed
waveform
× computed
waveform
Computation source
waveforms
Computed waveform
Computation Source Waveforms (Source or Source1 and Source2)
CH1 to CH16,1 16chVOLT,2 CAN,3 Math1 to Math74
1 You can select the channel of an installed module. You cannot select the channel of a logic module.
2 If the 16-CH Voltage Input Module is installed. After you select 16chVOLT, select a sub channel.
3 On the DL850V when a CAN bus monitor module is installed. After you select CAN, select a sub channel. If
the data type (Value Type) is set to Logic, you will not be able to select it.
4 You can use other computed waveforms as computation source waveforms. If the waveform that you are
configuring is MathX, you can use a computation waveform up to MathX − 1 as the computation source
waveform. You cannot use another computation waveform as the computation source waveform for Math1.
When computation is performed on a linearly scaled channel, the scaled values are used.
Unit (Unit)
You can assign a unit of up to four characters in length to the computed results. The specified unit is reflected in
the scale values.
Label (Label)
You can create a label of up to eight characters in length. The labels that you create are displayed on the screen.
Turning the Display On and Off (Display)
Select whether to display the computed waveform.
• ON: Displays the computed waveform
• OFF: Does not display the computed waveform
Binary Conversion (Bin (S1))
Using the specified threshold levels, you can convert the waveform assigned to Source to a digital waveform.
Upper
Lower
1
0
Computation Source Waveform (Source), Unit (Unit), Label (Label), and Turning the Display On and Off
(Display)
These settings are the same as those for basic arithmetic.
Upper and Lower Thresholds (Thr. Upper/Thr. Lower)
Set the upper and lower threshold values. All values above the upper threshold on the computation source
waveform are converted to ones, and all values below the threshold are converted to zeros.
11-2
IM DL850-01EN
11 Computation
Power Spectrum (PS (S1))
Performs an FFT (fast Fourier transform) on the waveform assigned to Source, and displays a power spectrum.
You can use this function to view the frequency distribution of an input signal.
Computation Source Waveform (Source), Unit (Unit), Label (Label), and Turning the Display On and Off
(Display)
These settings are the same as those for basic arithmetic.
FFT Settings (FFT Setup)
Select the data points and window function to use for the FFT.
• Number of FFT Points (FFT Points)
You can set the number of points from the start of computation on the T-Y waveform to one of the options
below.
1k, 2k, 5k, 10k, 20k, 50k, or 100k
• Window Function (Window)
You can select the window function from the following options.
Rect, Hanning, Flat Top, Hamming
Phase Shift (Shift (S1))
You can shift the phase of the waveform assigned to Source, display the resulting waveform, and use the phaseshifted data in computations.
Computation Source Waveform (Source), Unit (Unit), Label (Label), and Turning the Display On and Off
(Display)
These settings are the same as those for basic arithmetic.
Shift (Shift)
You can shift waveforms within the following ranges.
• When an Internal Clock Is Being Used as the Time Base
Selectable range: The time values between −(record length/2) points to (record length/2 points)
Step: 1 ÷ sample rate
The sample rate varies depending on how the record length and Time/div settings are configured. For details,
see appendix 1, “Relationship between the Time Axis Setting, Record Length, and Sample Rate” in the
Getting Started Guide, IM DL850-03EN.
• When an External Clock Is Being Used as the Time Base
Selectable range: −(record length/2) points to (record length/2 points)
Step: 1
IM DL850-01EN
11-3
11 Computation
Scaling Mode (Scaling Mode)
Set the method used to set the vertical display range of computed waveforms to one of the following options.
• Auto: The upper and lower limits are set automatically.
• Manual: The upper and lower limits must be set manually.
Upper and Lower Limits (Upper/Lower)
Set the upper and lower limits when Scaling Mode is set to Manual.
The selectable range is −9.9999E+30 to 9.9999E+30.
Start Point and End Point (Start Point and End Point)
Set the range of computation by specifying a computation start and end point. The default settings are −5 div
and +5 div.
The maximum range from the computation start point to the computation end point varies as indicated below
depending on the number of computations.
• One computation: Up to 1 Mpoint
• Two computations: Up to 500 kpoint
• Three or four computations: Up to 250 kpoint
• Five to eight computations: Up to 125 kpoint
The computation range points are similar to the settable range of the cursor display position in cursor
measurement.
For details, see “Selectable Range of Cursor Positions.”
An icon (
) appears in the center of the top of the screen when computations are being executed.
User-Defined Computation (Optional)
You can perform user-defined computation on models with the /G2 option.
Operator (Operation)
Select User Define.
Expression (Expression) - user-defined
Create an expression by combining computation source waveforms, variables, constants, functions, and
operators.
Computation Source Waveforms and Variables
You can use the following waveforms and variables.
Menu Item
C1 to C16
Cn_1 to Cn_16
Cn_1 to Cn_16
M1 to M7
T
Description
Waveforms from CH1 to CH16
The waveforms of sub channels 1 to 16 on a 16-CH Voltage Input Module
n = 1, 3, 5, 7, 9, 11, 13, 15
The waveforms of sub channels 1 to 16 on a CAN Bus Monitor Module (You can configure up to 60
sub channels on modules whose firmware version is 1.2 or later.)
n = 13 to 16
If the data type (Value Type) is set to Logic, you will not be able to select it.
Math waveforms
Total number of data points in the time direction
When computation is performed on a linearly scaled channel, the scaled values are used.
11-4
IM DL850-01EN
11 Computation
Operators and Functions
You can use the following operators and functions.
Menu Item
+, −, *, /
SHIFT
ABS
SQRT
LOG
EXP
NEG
SIN
COS
TAN
ATAN
PH
DIF
DDIF
INTG
IINTEG
BIN
P2
P3
F1
Example
C1+C2
SHIFT(C1)
ABS(M1)
SQRT(C2)
LOG(C1)
EXP(C1)
NEG(C1)
SIN(T)
COS(C1)
TAN(C1)
ATAN(C1, C2)
PH(C1, C2)
DIF(C1)
DDIF(C1)
INTG(C1)
IINTEG(C1)
BIN(C1, Up, Lo)
P2(C1)
P3(C1)
F1(C1, C2)
F2
Displays the result of computing C12−C22 for the specified waveforms
Displays the inverse of the PWHH of the pulse width
Displays the computation of the pulse widths between a rising edge and the next
rising edge1
PWHL(C2, Up, Lo)
Displays the computation of the pulses width between a rising edge and the next
falling edge1
PWLH(C1, Up, Lo)
Displays the computation of the pulse widths between a falling edge and the next
rising edge1
PWLL(C1, Up, Lo)
Displays the computation of the pulse widths between a falling edge and the next
falling edge1
PWXX(C2, Up, Lo)
Displays the computation of the pulse widths from a rising or falling edge to the
next rising or falling edge1
DUTYH(C1, Up, Lo)
Positive (high) duty cycle within each cycle of the specified waveform1
DUTYL(C1, Up, Lo)
Negative (low) duty cycle within each cycle of the specified waveform1
FILT1(C1)
Displays the result of applying a filter to the specified waveform
FILT2(C1)
Displays the result of applying a filter to the specified waveform
HLBT(C1)
Displays the Hilbert transform of the specified waveform
MEAN(C1)
Displays the 10th-order moving average of the specified waveform
LS-MAG(C1)
Displays the amplitude of the specified waveform’s linear spectrum
LS-LOGMAG(C1)
Displays the logarithmic amplitude of the specified waveform’s linear spectrum
LS-PHASE(C1)
Displays the phase of the specified waveform’s linear spectrum
LS-REAL(C1)
Displays the real part of the specified waveform’s linear spectrum
LS-IMAG(C1)
Displays the imaginary part of the specified waveform’s linear spectrum
PS-MAG(C1)
Displays the amplitude of the specified waveform’s power spectrum
PS-LOGMAG(C1)
Displays the logarithmic amplitude of the specified waveform’s power spectrum
PSD-MAG(C1)
Displays the amplitude of the specified waveform’s power spectrum density
PSD-LOGMAG(C1)
Displays the logarithmic amplitude of the specified waveform’s power spectrum
density
CS-MAG(C1, C2)
Displays the amplitude of the cross spectrum of the two specified waveforms
CS-LOGMAG(C1, C2) Displays the logarithmic amplitude of the cross spectrum of the two specified
waveforms
CS-PHASE(C1, C2)
Displays the phase of the cross spectrum of the two specified waveforms
CS-REAL(C1, C2)
Displays the real part of the cross spectrum of the two specified waveforms
CS-IMAG(C1, C2)
Displays the imaginary part of the cross spectrum of the two specified waveforms
TF-MAG(C1, C2)
Displays the amplitude of the transfer function of the two specified waveforms
TF-LOGMAG(C1, C2) Displays the logarithmic amplitude of the transfer function of the two specified
waveforms
TF-PHASE(C1, C2)
Displays the phase of the transfer function of the two specified waveforms
TF-REAL(C1, C2)
Displays the real part of the transfer function of the two specified waveforms
TF-IMAG(C1, C2)
Displays the imaginary part of the transfer function of the two specified waveforms
CH-MAG(C1, C2)
Displays the amplitude of the coherence function of the two specified waveforms
FV
PWHH
PWHL
PWLH
PWLL
PWXX
DUTYH
DUTYL
FILT1
FILT2
HLBT
MEAN
LS-
PSPSDCS-
TF-
CH-
Description
Displays the result of performing basic arithmetic on two specified waveforms
Displays the result of shifting the specified waveform’s phase
Displays the absolute values of the specified waveform
Displays the square root of the specified waveform
Displays the log of the specified waveform
Displays the exponent of the specified waveform
Displays the specified waveform inverted around 0
Displays the sine of the specified waveform
Displays the cosine of the specified waveform
Displays the tangent of the specified waveform
Displays the arc tangent of the two specified waveforms (a value within ±π)
Displays the phase difference between the two specified waveforms
Displays the derivative of the specified waveform
Displays the 2nd order derivative of the specified waveform
Displays the integral of the specified waveform
Displays the double integral of the specified waveform
Displays the result of converting specified waveform to binary1
Displays the square of the specified waveform
Displays the cube of the specified waveform
C12+C22 for the specified waveforms
Displays the result of computing
F2(C1, C2)
FV(C1)
PWHH(M1, Up, Lo)
1 Set the source waveform and the upper and lower threshold levels (Up and Lo).
IM DL850-01EN
11-5
11 Computation
Constants
Menu Item
K1 to K8
0 to 9
Exp
Description
−
E notation. Selectable range: −30 to +30
Use this constant to enter values in E notation (1E+3 = 1000, 2.5E−3 = 0.0025).
It is displayed as “E” in expressions to distinguish it from the “EXP” operator.
Automated Measurement Values of Waveform Parameters (Measure)
You can use the automated measurement values of waveform parameters in expressions. The DL850/DL850V
cannot retrieve waveform parameter values when the display of the measurement source waveform is off.
Combinations of Operators That Are Not Allowed
• An expression cannot be used in another expression with a smaller number.
Example: Math5 = M6 + M3
• Expressions containing only constants (K1 to K8) are not allowed.
Example: Math5 = K1 + K8
• An expression can only contain up to two FILT1 or FILT2 functions.
Example: FILT1(C1)+FILT1(C2)+FILT1(C3)
• A single FFT expression can only contain one operator.
Example: PS−MAG(C1+C2)
• Additional computations cannot be performed on FFT results.
Example: PS−MAG(C1)+C2
• Additional computations cannot be performed on pulse width computations.
Example: PWHH(C1)+C2
• Only one operator can be used in a single phase-shift computation, pulse-width computation, or binaryconversion expression.
Example: SHIFT(C1+C2), BIN(C1−C2), PWHH(C1*C1)
If you want to perform an FFT, phase-shift, pulse-width, or binary-conversion computation on the computed
results of an expression such as C1+C2, create expressions like these: M1=C1+C2, M2=PS−MAG(M1).
Unit (Unit), Label (Label), and Turning the Display On and Off (Display)
These settings are the same as those for basic arithmetic.
Scaling Mode (Scaling Mode), Upper and Lower Limits (Upper/Lower), and Start and End Points (Start
Point/End Point)
11-6
IM DL850-01EN
11 Computation
Averaging Settings (Average Setup) - user-defined
You can average and compute the peak values of the results of user-defined computation.
Averaging Modes (Average Mode)
The following types of averaging are available.
• OFF: Averaging is not performed.
• Linear averaging (Linear): Values are averaged linearly.
• Exponential averaging (Exp): Values are averaged exponentially.
• Cycle averaging (Cycle): Values are averaged across cycles.
• Peak computation (Peak): Peak values are computed.
Linear Averaging (Linear)
The number of values specified by the average count are added and divided by the average count, and the
resulting values are used to display the waveform. For the equation, see the equation for linear averaging in
Averaging Mode.
• Average Domain (Average Domain)
Select what to average.
• Time: A time-domain waveform is averaged.
• Freq: A frequency-domain waveform is averaged.
• Linear Count (Linear Count)
Set the average count.
Selectable range: 2 to 128 in 2n steps
Exponential Averaging (Exp)
Using the specified attenuation constant, the DL850/DL850V attenuates the influence of previous computed data
to produce averaged values, and uses the results to display the waveform. For the equation, see the equation
for exponential averaging in Averaging Mode.
• Average Domain (Average Domain)
• Attenuation Constant (Average Weight)
Set the attenuation constant.
Selectable range: 2 to 256 in 2n steps
IM DL850-01EN
11-7
11 Computation
Cycle Averaging (Cycle)
The data from the computation start point to the computation end point is divided into the number of data points
(Cycle Count) that is specified as being a single cycle, and equivalent points in each divided cycle are averaged
with each other. The resulting values are used to display the waveform.
The figure below shows the results of cycle averaging when Cycle Count is set to 720.
Computed Data
3
2
45 •••
1
724 (4) 725 (5) • • •
723 (3)
722 (2)
1443 (3)
1442 (2)
721 (1)
720
1441 (1)
1440 (720)
1 cycle
1 cycle
•••••
Cycle Averaging Results
Equivalent points in each divided cycle are linearly averaged,
and the resulting values are used to display the waveform.
720
1440
2160
.......
............
1 721 1441
• Cycle Count (Cycle Count)
Set the number of data points in one cycle.
Selectable range: 10 to 1800
• All the data between the computation start and end points can be computed. If the data cannot be divided
evenly by the specified cycle count, the remaining data is ignored.
• Cycle averaging cannot be performed on an FFT waveform.
• Cycle Averaging Example
When the record length is 10 kpoint, the cycle count is 720, the computation start point is −5.000 div, and the
computation end point is +5.000 div
10 k/720 = 13.88... : 13 cycles are used for the computation.
13×720 = 9360 : The data from the computation start point (point 1) to point 9360 is included in the cycle
average computation.
11-8
IM DL850-01EN
11 Computation
Peak Computation (Peak)
The maximum value at each point of the computed data is determined, and the resulting values are used to
display the waveform. For each computation, the new computed value is compared with the past value, and the
larger value is kept.
3 sets of FFT data
The maximum values of each point
are displayed.
• The DL850/DL850V normally performs scaling by using the computed data at the beginning (auto scaling).
For coherence functions and in other cases where the amplitude of the averaged waveform changes
significantly, use manual scaling.
• When you execute averaging, after measurement is stopped, computation cannot be restarted. However,
computation can be restarted if the number of data points for cycle averaging is changed.
• If you measure an averaged waveform with auto scaling enabled, you cannot change the scaling by
switching to manual scaling after measurement has stopped. Changes to the scaling settings are applied
to the next measurement.
• In user-defined computation, averaging cannot be performed on pulse width computation.
• If you change the computation conditions during averaging, the computed data up to that point is deleted,
and averaging starts over.
FFT Settings (FFT Setup) - user-defined
FFT computation is performed when you specify an operator that uses FFT computation (LS, PS, PSD, CS, TF,
or CH). Set the number of FFT points, the window function, the damping rate, and Force1 and Force2.
The results of the FFT appear in the selected computation waveform. Other than the fact that no FFT window is
displayed, this is the same as the FFT computation that can be performed from the FFT menu.
Filter Settings (Filter Setup) - user-defined
When using FILT1 and FILT2 in user-defined computation, set the digital filter type, filter band, and cutoff
frequency for each of the two filters (Filter1 and Filter2).
Filter Type (Filter Type) and Filter Band (Filter Band)
Filter Type (Filter Type)
Gauss
Sharp
IIR (Butterworth)
Filter Band (Filter Band)
Low-Pass
Low-Pass, High-Pass, Band-Pass
Low-Pass, High-Pass, Band-Pass
CutOff1 and CutOff2 (CutOff1/CutOff2)
Set the cutoff frequency. When Filter Band is set to Low-Pass or High-Pass, set CutOff1; when Filter Band is set
to Band-Pass, set CutOff1 and CutOff2.
Selectable range: 2.0 to 30.0% of the sample rate
Resolution: Steps of 0.2% of the sample rate
IM DL850-01EN
11-9
11 Computation
Constant Settings (Constant Setup) - user-defined
Set values for K1 to K8.
The selectable range is −9.9999E+30 to 9.9999E+30.
Notes about Computation
• FFT computation can be performed through the configuration of settings in the Math menu or the FFT menu
(
). In the FFT menu, you can set the display format and choose a linear or logarithmic frequency
domain (horizontal axis) scale. The data point and window function settings are shared for the Math and FFT
menus. When you change the settings in one menu, the settings in the other menu are also changed.
• On models that do not have user-defined computation (/G2 option), when you enter the FFT menu and turn
FFT computation on, the Math7 operators become invalid and Math7 cannot be used. On models that do
have user-defined computation, when you enter the FFT menu and set FFT 1 and FFT 2 to ON, Math7 and
Math8 cannot be used.
• When you perform FFT computation on 50 kpoint or more of data using the FFT menu, you cannot use
computed waveforms.
• An icon ( ) appears in the center of the top of the screen when user-defined computation is being executed.
• Waveforms stored through hard disk recording cannot be computed.
Notes about Using the 16-CH Voltage Input Module
11-10
IM DL850-01EN
12 FFT
You can display the power spectrum of an input waveform in the FFT window. On models with user-defined
computation (/G2 option), you can display up to two FFT waveforms, and you can analyze the following
spectrums in addition to the power spectrum. However, FFT analysis cannot be performed on waveforms stored
through hard disk recording.
Linear spectrums, power spectrum densities, cross spectrums, transfer functions, and coherence functions
Turning the FFT On and Off (Display)
Set whether to perform FFT analysis. If you set this to ON, the FFT window appears.
• ON: FFT analysis is performed.
• OFF: FFT analysis is not performed.
Analysis Source Waveform (Source)
Set the analysis source waveform to one of the waveforms below.
CH1 to CH16,1 16chVOLT,2 CAN,3 Math1 to Math64
1 You can select the channel of an installed module. You cannot select the channel of a logic module.
2 If the 16-CH Voltage Input Module is installed. After you select 16chVOLT, select a sub channel.
3 On the DL850V when a CAN bus monitor module is installed. After you select CAN, select a sub channel. If
the data type (Value Type) is set to Logic, you will not be able to select it.
4 You cannot select Math7 or Math8.
When analysis is performed on a linearly scaled channel, the scaled values are used.
Start Point and Number of FFT Points (Start Point and FFT
Points)
Start Point (Start Point)
Set the computation start point. The default setting is −5 div.
Selectable range: −5 div to +5 div
The start point is similar to the settable range of the cursor display position in cursor measurement.
For details, see “Selectable Range of Cursor Positions.”
Number of FFT Points (FFT Points)
You can set the number of points from the start of computation on the T-Y waveform to one of the options below.
1k, 2k, 5k, 10k, 20k, 50k, or 100k
IM DL850-01EN
12-1
12 FFT
Window Function (Window)
You can select the window function from the following options.
Rect (Rectangular window)
The rectangular window is suited to transient signals, such as impulse waves, which attenuate completely within
the time window.
Hanning (Hanning window)
The Hanning window encourages continuity of the signal by gradually attenuating the parts of the signal located
near the ends of the time window down to the 0 level. Hence, it is suited to continuous signals. The Hanning
window has a higher frequency resolution than the flattop window.
FlatTop (Flattop window)
The flattop window encourages continuity of the signal by gradually attenuating the parts of the signal located
near the ends of the time window down to the 0 level. Hence, it is suited to continuous signals. The flattop
window has a higher spectral level accuracy than the flattop window.
Hamming (Hamming window)
In the Hanning window, the values at the ends become 0 and the signal components there do not affect the
spectrum. The Hamming window is a corrected Hanning window. Its characteristics are similar to those of the
Hanning window, but the frequency resolution of its main beam is greater than that of the Hanning window. The
Hamming window is suited for dividing close signals.
Exponential (Exponential)
The exponential window removes noise from the signal. It can only be selected on models with the user-defined
computation option. The exponential window is suited for the signals of impulse-excitation frequency-response
tests and other similar signals.
Time windows
Integral
Rectangular
T
Power spectrum
T
Hanning
T
T
Sine wave
t
Flattop
T
T
Hamming
T
T
Rectangular : W(t) = u(t) – u(t – T)
Hanning
Flattop
Hamming
u(t): Step function
: W(t) = 0.5 – 0.5cos( 2π t )
T
t sin{2π(1 – 2t/T)}
: W(t) = {0.54 – 0.46 cos( 2π )}
T
2π(1 – 2t/T)
: W(t) = 0.54 – 0.46cos( 2π t )
T
For details about the exponential window, see appendix 2.
Vertical Scale (Vert. Scale Mode)
You can select the method for setting the vertical scale from the following options.
• Auto: The center and scale of the vertical axis are set automatically.
• Manual: The center and scale of the vertical axis must be set manually.
Center/Scale (Center/Sensitive)
When Vert. Scale Mode is set to Manual, set the center and scale of the vertical axis.
12-2
IM DL850-01EN
12 FFT
Display Ratio of the Main Window (Main Ratio)
Window Layout (Window Layout)
Set the display position of the FFT window.
• Side: Horizontal
• Vertical: Vertical
Horizontal Scale (Horiz. Axis)
Select one of the following horizontal scale types.
• Hz: A normal (linear) scale is used.
• Log Hz: A logarithmic scale is used.
FFT Analysis on Models with User-Defined Computation (Option)
You can analyze the following types of spectrums on models with user-defined computation (/G2 option).
Linear spectrums, power spectrum densities, cross spectrums, transfer functions, and coherence functions
Turning FFT 1 and FFT 2 On and Off (Display)
Set whether to perform FFT analysis. If you set this to ON, the FFT windows appear. You can display separate
FFT analysis results in the FFT 1 and FFT 2 windows.
• ON: FFT analysis is performed.
• OFF: FFT analysis is not performed.
FFT Settings (FFT Setup)
Set the spectrum type, the window function, and the type of averaging.
Spectrum Type (Type/Sub Type)
Set the spectrum type.
IM DL850-01EN
Type
LS
LS
LS
LS
LS
PS
PS
PSD
PSD
Sub Type
MAG
LOGMAG
PHASE
REAL
IMAG
MAG
LOGMAG
MAG
LOGMAG
CS
CS
MAG
LOGMAG
CS
CS
CS
TF
TF
PHASE
REAL
IMAG
MAG
LOGMAG
TF
TF
TF
CH
PHASE
REAL
IMAG
MAG
Description
Magnitude of the specified waveform’s linear spectrum
Logarithmic magnitude of the specified waveform’s linear spectrum
Phase of the specified waveform’s linear spectrum
Real part of the specified waveform’s linear spectrum
Imaginary part of the specified waveform’s linear spectrum
Magnitude of the specified waveform’s power spectrum
Logarithmic magnitude of the specified waveform’s power spectrum
Magnitude of the specified waveform’s power spectrum density
Logarithmic magnitude of the specified waveform’s power spectrum
density
Magnitude of the cross spectrum of the specified two waveforms
Logarithmic magnitude of the cross spectrum of the specified two
waveforms
Phase of the cross spectrum of the specified two waveforms
Real part of the cross spectrum of the specified two waveforms
Imaginary part of the cross spectrum of the specified two waveforms
Magnitude of the transfer function of the specified two waveforms
Logarithmic magnitude of the transfer function of the specified two
waveforms
Phase of the transfer function of the specified two waveforms
Real part of the transfer function of the specified two waveforms
Imaginary part of the transfer function of the specified two waveforms
Magnitude of the coherence function of the specified two waveforms
12-3
12 FFT
Analysis Source Waveforms (Source1 and Source2)1
Set the analysis source waveform to one of the waveforms below.
CH1 to CH16,2 16chVOLT,3 CAN,4 Math1 to Math65
1 You can set Trace2 when Type is set to CS, TF, or CH.
2 You can select the channel of an installed module. You cannot select the channel of a logic module.
3 If the 16-CH Voltage Input Module is installed. After you select 16chVOLT, select a sub channel.
4 On the DL850V when a CAN bus monitor module is installed. After you select CAN, select a sub channel. If
the data type (Value Type) is set to Logic, you will not be able to select it.
5 You cannot select Math7 or Math8.
When analysis is performed on a linearly scaled channel, the scaled values are used.
Window Function (Window)
• Damping Rate (Damping Rate)
You can configure this setting when Window is set to Exponential. You can set the value in the range of 1 to
100% (1% resolution). The weight of the last data point is used as a damping rate, with the weight of the first
data point of the FFT computation taken to be 100% (= 1). When the damping rate is set to 100%, the window
functions like a rectangular window. This setting applies to the input and output (response) signals.
• Force1
You can configure this setting when Window is set to Exponential. Set the area over which computation is
performed in terms of a percentage from the first FFT point, taking the number of FFT points to be 100%. You
can set the area to a value from 1 to 100% (in 1% steps). When the area is set to 100%, the window functions
like a rectangular window. The outer area is the average of the results of the window function for the data
outside the area. This setting applies to the input signals (first parameter) of one-waveform and two-waveform
FFTs.
• Force2
You can configure this setting when Window is set to Exponential. This setting applies to the output (response)
signal (second parameter) of a two-waveform FFT. It can be set in the same manner as Force1.
100%
Weight
1
Force (%)
0
Damping
rate
(%)
100%
FFT computation data points
Average (Average)
FFT analysis data can be linearly or exponentially averaged, and its peak values can be computed.
These settings are the same as those for user-defined computation.
12-4
IM DL850-01EN
12 FFT
Notes about FFT Computation
Notes about Displaying Power Spectrums
• You cannot display a power spectrum if the display record length is less than the number of computed data
points.
• The following settings are shared for all computation channel: FFT Points, Window, and Start Point.
• You cannot magnify an FFT waveform along the horizontal access so that 50 points or fewer are displayed.
Notes about Computation
• Computation is normally performed on the sampled data in the acquisition memory. For waveforms that
are acquired in Envelope mode, computation is performed on the maximum and minimum values at each
acquisition interval.
• FFT computation can be performed through the configuration of settings in the Math menu or the FFT menu.
The data point and window function settings are shared for the Math and FFT menus. When you change the
settings in one menu, the settings in the other menu are also changed.
• • On models that do not have user-defined computation (/G2 option), when you enter the FFT menu and turn
FFT computation on, the Math7 operators become invalid, and Math7 cannot be used. On models that do
have user defined computation, when you enter the FFT menu and set FFT 1 and FFT 2 to ON, Math7 and
Math8 cannot be used.
• When you perform FFT computation on 50 kpoint or more of data using the FFT menu, you cannot use
computed waveforms.
• An icon ( ) appears in the center of the top of the screen when FFT computation is being executed.
• FFT analysis cannot be performed on waveforms stored through hard disk recording.
Notes about Using the 16-CH Voltage Input Module
IM DL850-01EN
12-5
13 GO/NO-GO Determination
The DL850/DL850V determines whether the acquired waveform meets the reference condition (GO result) or not
(NO-GO result). When the DL850/DL850V produces a GO or NO-GO result, it executes the specified actions.
Mode (Mode)
Set the method for GO/NO-GO determination.
• OFF: GO/NO-GO determination is not performed.
• Waveform zone (Wave Zone): GO/NO-GO determination is performed using a waveform zone configured on
the screen.
• Waveform parameter (Parameter): GO/NO-GO determination is performed through the use of the specified
waveform parameters.
Waveform Zone (Wave Zone)
The DL850/DL850V returns GO/NO-GO results based on whether waveforms leave or enter the zone that you
create using a base waveform.
When the reference condition is set to IN,
a NO-GO judgment is made here.
Start of the
determination range
(Time Range1)
End of the
determination range
(Time Range2)
Editing a Waveform Zone (Edit Zone)
Select the number of the waveform zone you want to edit from the range indicated below. If a zone has already
been created for that number, the zone will be displayed. If no zone has been created for a number, select a
base waveform from the base waveform editing menu (New), and then edit the zone.
Zone 1 to Zone 6 (Zone1 to Zone6), Cancel1
1 The selected menu closes.
Editing a Base Waveform (New)
When you create a new waveform zone, you need to select the waveform that you will base it on (the base
waveform). Select a waveform whose display is on.
CH1 to CH161, Cancel (Cancel)2
1 You can select the channel of an installed module. However, you cannot select the channel of a logic module,
16-CH Voltage Input Module, or CAN bus monitor module.
2 The selected menu closes.
Specifying the Editing Range (Edit)
Select the part of the base waveform that you want to edit.
• Whole (Whole): The whole waveform is within the editing range.
• Part (Part): A portion of the waveform is within the editing range.
Whole
Part
Editing range
boundary 1
(Time Range1)
IM DL850-01EN
Editing range
boundary 2
(Time Range2)
13-1
13 GO/NO-GO Determination
Zone Settings
When Edit is set to Whole, you can set the upper, lower, left, and right boundaries of the waveform zone. When
Edit is set to Part, you can set the upper and lower boundaries of the zone.
• Upper and lower boundaries (Upper and Lower)
Selectable range: ±10 div vertically from the base waveform
When Edit is set to Part, you can set the upper and lower boundaries of the area between Time Range1 and
Time Range2.
• Left and right sides (Left and Right): These settings can only be configured when Edit is set to Whole.
Selectable range: ±5 div from the center of the screen
• Time range 1 and time range 2 (Time Range1 and Time Range2): These settings can only be configured
when Edit is set to Part.
Selectable range: ±5 div on the time axis
Save Destination (Store as)
You can select one of the following save destinations for the waveform zone.
• Zone 1 to zone 6 (Zone1 to Zone6): The save destination is changed to the selected zone number.
• Cancel (Cancel): The save destination is not changed.
Saving a Waveform Zone (Execute Store)
Save the waveform zone.
Ending Editing (Quit)
Exit the waveform zone editor. If you do not press the Execute Store soft key to save the zone that you have
edited, it will be lost.
Judgment Conditions (Judgement Setup)
For each of 16 judgment conditions, you can set the source waveform, zone number, and judgment criterion.
You can also set the judgment logic, action condition, sequence, and acquisition count and enable or disable
synchronization with a remote signal.
Judgment Criterion (Mode)
Select the judgment criterion from the following options.
• X: The condition is not used for GO/NO-GO determination.
• IN: The DL850/DL850V returns a GO result when the source waveform is within the GO/NO-GO determination
zone. If even part of the source waveform is outside of the determination zone, the DL850/DL850V returns a
NO-GO result.
• OUT: The DL850/DL850V returns a GO result when the entire source waveform is outside the GO/NO-GO
determination zone. If even part of the source waveform is inside the determination zone, the DL850/DL850V
returns a NO-GO result.
Source Waveform (Trace)
Set the waveform to use for GO/NO-GO determination to one of the waveforms below.
CH1 to CH161
1 You can select the channel of an installed module. However, you cannot select the channel of a logic module,
16-CH Voltage Input Module, or CAN bus monitor module.
Zone Number (Zone No.)
Select the number of the waveform zone you want to use for GO/NO-GO determination from the range indicated
below.
Zone 1 to zone 6 (Zone1 to Zone6)
Determination Logic (Logic)
You can select the determination logic from the following options.
• AND: The actions are performed when all the conditions from 1 to 16 are met.
• OR: The actions are performed when a condition from 1 to 16 is met.
13-2
IM DL850-01EN
13 GO/NO-GO Determination
Action Condition (ActCondition)
Set the action condition to one of the settings below.
• Always (Always): The actions are always performed. The actions will be executed each time that the DL850/
DL850V triggers.
• At failure (Fail): The actions are executed when the specified GO conditions are not met.
• At success (Success): The actions are executed when the specified GO conditions are met.
Sequence (Sequence)
Select the sequence for executing actions.
• Single (Single): Execution stops after the actions are performed once.
• Continue (Continue): Actions are executed repeatedly. However, the actions stop repeating after the number
of specified waveform acquisitions (the Acquisition Count setting). If Acquisition Count is set to Infinite, the
actions continue until waveform acquisition is stopped by the pressing of the START/STOP key.
Acquisition Count (Acquisition Count)
Set the number of waveform acquisitions.
• Infinite: Waveform acquisition continues until it is stopped by the pressing of the START/STOP key.
• 1 to 65536: The DL850/DL850V stops waveform acquisition after it acquires the specified number of
waveforms.
External Start (Ext Start)
You can perform GO/NO-GO determination and output the results in sync with an external signal applied to the
GO/NO-GO I/O terminal of the DL850/DL850V.
• OFF: GO/NO-GO determination is not performed through the use of an external signal.
• ON: GO/NO-GO determination is performed through the use of an external signal.
Action (Action)
Determination Period (Time Range1 and Time Range2)
You can set the determination period by setting Time Range1 and Time Range2. The default settings are −5 div
and +5 div.
Selectable range: −5 div to +5 div
The determination period is similar to the settable range of the cursor display position in cursor measurement.
For details, see “Selectable Range of Cursor Positions.”
GO/NO-GO Determination Results
The results of GO/NO-GO determination (and the numbers of determinations and failures) appear at the bottom
of the screen.
Exe Count: 10
Determination
count
Fail Count: 2
Failure count
O: Condition met
X: Condition not met
- : No condition specified
Result: XXOOOO-----------Indication of whether reference
conditions 1 to 16 are met
XXOOOO------------
1,2,3, ...,16: Reference conditions
In this example, reference conditions 1 and 2 are not met while the conditions defined
by base waveforms 3 to 6 are met.
IM DL850-01EN
13-3
13 GO/NO-GO Determination
Waveform Parameters (Parameter)
Set the upper and lower limits for automated measurement values of waveform parameters, and perform GO/
NO-GO determination based on whether the values are within or outside of the limits.
Judgment Conditions (Judgement Setup)
For each of 16 judgment conditions, you can set the source waveform, waveform parameter, and upper
and lower waveform parameter limits. You can also set the judgment logic, action condition, sequence, and
acquisition count and enable or disable synchronization with an external start signal.
Judgment Criterion (Mode)
Select the judgment criterion from the following options.
• X: The condition is not used for GO/NO-GO determination.
• IN: The DL850/DL850V returns a GO result when the parameter is within the specified limits. The DL850/
DL850V returns a NO-GO result when the parameter is outside the specified limits.
• OUT: The DL850/DL850V returns a GO result when the parameter is outside the specified limits. The DL850/
DL850V returns a NO-GO result when the parameter is inside the specified limits.
Source Waveform (Trace)
Set the waveform to use for GO/NO-GO determination to one of the waveforms below.
CH1 to CH161
1 You can select the channel of an installed module. However, you cannot select the channel of a logic module,
16-CH Voltage Input Module, or CAN bus monitor module.
Waveform Parameter (Item)
You can use all automatically measured waveform parameters as reference conditions. You can perform GO/
NO-GO determination on up to 16 parameters at the same time.
Upper and Lower Parameter Limit Settings (Upper/Lower)
Depending on the parameter, you can set the upper and lower limits within the range of −9.9999E+30 to
9.9999E+30.
Judgment Logic (Logic), Action Condition (ActCondition), Sequence (Sequence), Acquisition Count
(Acquisition Count), and External Start (Ext Start)
Action (Action)
Determination Period (Time Range1 and Time Range2)
GO/NO-GO Determination Results
The results of GO/NO-GO determination (number of determinations, number of failures) appear at the bottom of
the screen.
Exe Count: 10
Fail Count: 4
Result: XXXXOOOO--------
Indication of whether reference
conditions 1 to 16 are met
XXXXOOOO-------1,2,3, ...,16: Reference conditions
O: Condition met
X: Condition not met
- : No condition specified
In this example, reference conditions 1 and 4 are not met while reference conditions 5
to 8 are met.
Determination
Failure count
count
Measured values for
each parameter
13-4
IM DL850-01EN
13 GO/NO-GO Determination
Notes about GO/NO-GO Determination
• During determination, all keys other than START/STOP are invalid.
• The determination interval is synchronized to the trigger. However, while actions are being performed after
determination, the DL850/DL850V will not trigger.
• While you are accessing the DL850/DL850V through the FTP or Web server, if one of the following operations
is performed, actions cannot be executed until you finish accessing the DL850/DL850V.
Printing and saving of screen capture data and saving of waveform data
• When the GO/NO-GO mode is not set to OFF, computation and FFT analysis cannot be performed. Also,
when computation or FFT analysis is enabled, the GO/NO-GO mode cannot be set to any setting other than
OFF.
Notes about the “Save Data” and “Save Image” Actions
Notes about Using the 16-CH Voltage Input Module
IM DL850-01EN
13-5
14 Action-On-Trigger
You can make the DL850/DL850V execute specified actions whenever a trigger occurs.
Mode (Mode)
Select whether to use action-on-trigger.
• OFF: Action-on-trigger is not used.
• ON: The specified actions are executed whenever a trigger occurs.
Action (Action Setup)
You can select the actions that are performed when a trigger occurs from the options below.
Beep (Beep)
The DL850/DL850V sounds an alarm.
Screen Capture Printing (Print Image)
The DL850/DL850V prints a screen capture to the specified printer. You can specify a printer in the PRINT menu
by setting “Print to” to BuiltIn (built-in printer) or Network (network printer).
Waveform Data Saving (Save Data)
The DL850/DL850V saves the waveform data to the specified destination (SD card, internal or external HD
[option], USB storage device, or network drive).
File Path (File Path)
Specify where to save the file.
Auto Naming (Auto Naming), File Name (File Name), Data Format (Data Type)
These settings are the same as the auto-naming, file-name, and data-format settings for saving waveform
data.
Changing the auto-naming, file-name, and data-format settings for saving waveform data will change the
auto-naming, file-name, and data-format settings under Waveform(SAVE) in the FILE menu.
Screen Capture Saving (Save Image)
The DL850/DL850V saves the screen capture data to the specified destination (SD card, internal or external HD
[option], USB storage device, or network drive).
File Path (File Path), Auto Naming (Auto Naming), File Name (File Name)
Changing the auto-naming and file-name settings for saving image data will change the auto-naming and filename settings under Others(SAVE) in the FILE menu.
IM DL850-01EN
14-1
14 Action-On-Trigger
E-mail Sending (Send Mail)
The DL850/DL850V sends an e-mail to the specified address. Set the e-mail address by pressing UTILITY and
then selecting Network > Mail.
E-mail Send Count (Mail Count)
Set the upper e-mail transmission limit. When the number of transmitted e-mails reaches Mail Count, the DL850/
DL850V stops sending e-mails.
Notes about Action-on-Trigger
• You cannot change settings while the action-on-trigger feature is active.
• The action-on-trigger actions may be slow if there is network access while the following operations are being
performed.
Printing and saving of screen capture data and saving of waveform data
• When the dual capture feature is enabled, the only action-on-trigger action that can be used is e-mail sending.
• When hard disk recording to an external or internal hard disk is enabled, the action-on-trigger feature cannot
be used.
Notes about the “Save Data” and “Save Image” Actions
• Do not set the storage medium’s root folder as the save destination. (The DL850/DL850V can only store 512
files to the root folder of a storage medium that it has formatted.)
• The maximum number of files that can be created in a single folder is 1000. Make sure that there are no files
in the destination folder before you start the action-on-trigger feature.
• If you select waveform data saving (Save Data) and screen capture saving (Save Image) at the same time,
use the FILE menu to specify separate folders to save to.
• In the FILE menu, if you set Auto Naming to Numbering, as the number of saved files increases, the amount
of time required to save a file will also increase.
Select whether to enable the action-on-trigger feature when the power is turned on.
14-2
IM DL850-01EN
15 Searching Waveforms
You can search the displayed waveforms for locations that match the specified conditions. You can zoom-in on
the detected locations. You can search the waveforms within the specified search range over up to 2 Gpoint.
However, you cannot search through waveforms that have been stored through hard disk recording.
Point of detection
Search start point
Search end point
Hysteresis
Specified level
Detected section is displayed
expanded in the zoom window.
Search condition: Two rising edges
Search Type (Type)
Set the search type to one of the options below.
• Edge: The DL850/DL850V searches for edges.
• Event: The DL850/DL850V searches for an event.
• Logic Pattern: The DL850/DL850V searches for logic patterns. This setting is only valid for logic modules.
• Time: The DL850/DL850V searches for a time.
IM DL850-01EN
15-1
15 Searching Waveforms
Edge Search (Edge)
Search for positions where the rising or falling slope of the specified waveform passes through the specified
level.
Detected point for rising edge ( )
Level
Source
Search Conditions (Setup)
Set the search conditions, such as the waveforms to search, judgment level, polarity, hysteresis, count, and bit
settings.*
* Only on the channel of a logic module
Source Waveform (Trace)
Select the waveforms to search from the options listed below.
CH1 to CH16,1 16chVOLT,2 CAN3
1 You can select the channel of an installed module.
2 If the 16-CH Voltage Input Module is installed. After you select 16chVOLT, select a sub channel.
3 On the DL850V when a CAN bus monitor module is installed. After you select CAN, select a sub channel.
Judgment Level (Level)
Set the level used to detect the rising or falling edges of the waveforms. You can set the level to a value within
the 10 div of the screen. The resolution at which you can set the level varies depending on the module.
Polarity (Polarity)
Select which type of edge to detect from the options listed below.
•
: Rising
•
: Falling
•
: Rising or falling
Hysteresis (Hysteresis)
You can set a range (hysteresis) within which level changes are not treated as edges. You can set the hysteresis
to one of the settings below. The hysteresis widths vary depending on the input module.
•
•
•
: Low hysteresis
: Medium hysteresis
: High hysteresis
Bit Settings (Bit Setting)
For each bit from Bit1 to Bit8, you can select which type of edge to detect from the options listed below. This
setting is only available for the channels of logic modules. The DL850/DL850V searches based on the OR of
each bit.
•
: Rising
•
: Falling
•
: Rising or falling
• −: The signal is not used as a trigger condition.
Count (Count)
Set the number of times the specified edge ( , , or
1000000.
15-2
) must repeat. You can select a number from 1 to
IM DL850-01EN
15 Searching Waveforms
Searched Waveform Display (Result Window)
You can select whether to display the zoomed area around the point specified by Pattern No. in Zoom1 or
Zoom2.
You only need to make this selection when both the Zoom1 and Zoom2 displays are turned on.
If the Zoom1 and Zoom2 displays are both off and you press SEARCH, the Zoom1 display turns on.
Detected Point Number (Pattern No.)
Specify the number of the detected point to display in the zoom window. The maximum detected point number is
1000.
If the search does not yield any results, “No Match” appears.
Search Range (Start Point and End Point)
Set the search start and end points (Start Point and End Point). The default settings are −5 div and +5 div.
Selectable range: −5 div to +5 div
The start and end points are similar to the settable range of the cursor display position in cursor measurement.
For details, see “Selectable Range of Cursor Positions.”
Executing a Search (Execute)
The DL850/DL850V searches for positions where the specified search conditions are met. Then, the DL850/
DL850V displays the waveforms expanded in the zoom window with the detected point that corresponds to the
number you specify at the center.
Up to 1000 points can be detected.
Edge Search Determination
If the peak is below the upper limit of the hysteresis immediately after a rising edge or above the lower limit of
the hysteresis immediately after a falling edge, the DL850/DL850V will not count the edge.
This rising edge is determined to be false.
Point of detection
Upper hysteresis
value
Lower hysteresis
value
Search start position
IM DL850-01EN
Specified level
When the search condition is set to
two rising edges
15-3
15 Searching Waveforms
Event Search (Event)
You can search for an event number that was assigned during measurement.
Event Number (Select Number)
Select the event number that you want to search for. You can select a number from 1 to 100.
Searched Waveform Display (Result Window)
Event Type (Select Event)
Select the type of event that you want to detect.
• Capture: A dual-capture event
• Manual: A manual event assigned through the application of a signal to the EXT I/O terminal.
Executing a Search (Execute)
The DL850/DL850V displays the waveforms of the area around the selected event number expanded in the
zoom window.
Logic Pattern Search (Logic Pattern)
The DL850/DL850V searches for the specified logic pattern. This setting is only valid for logic modules.
Search Conditions (Setup)
Set the following search conditions: the waveforms to search, bit settings, and count.
Source Waveform (Trace)
Select the waveforms to search from the options listed below.
CH1 to CH16*
* You can only select the channel of a logic module.
Bit Settings (Bit Setting)
To set the logic signal pattern that you want to detect, set the signal states for Bit1 to Bit8. The DL850/DL850V
searches based on the AND of each bit.
• H: High level
• L: Low level
• X: The state of the bit is not used as a condition.
Count (Count)
Set the number of times the specified pattern must repeat. You can select a number from 1 to 1000000.
Searched Waveform Display (Result Window), Detected Point Number (Pattern No),
Search Range (Start Point and End Point), Executing a Search (Execute)
15-4
IM DL850-01EN
15 Searching Waveforms
Time Search (Time)
Search for a specific year, month, day, and time.
Search Conditions (Setup)
Specify the time that you want to search for.
Set the year (Year), month (Month), day (Day), hour (Hour), minute (Minute), second (Second), and microsecond
(μSecond).
Searched Waveform Display (Result Window)
Executing a Search (Execute)
The DL850/DL850V displays the waveforms of the area around the specified time expanded in the zoom
window.
Notes about Searching Waveforms
• You cannot search during data acquisition.
• The search results are invalid after you:
• Start data acquisition.
• Change the settings.
• Undisplayed waveforms and waveforms stored through hard disk recording are not included in searches.
• If you invert or change the offset voltage of a waveform that has been selected as a waveform to search, the
search is performed on the new waveform.
Notes about Using the 16-CH Voltage Input Module
IM DL850-01EN
15-5
16 Displaying and Searching History Waveforms
Acquisition memory stores waveforms that are displayed on the screen and waveform data that have been
acquired in the past. The history feature allows you to display or search past waveforms (history waveforms).
You can perform the following operations on history waveforms:
Display
You can display any single waveform or display all waveforms (and highlight only the specified waveform).
You can also list the timestamps (the trigger times) of all history waveforms.
Waveform Data for the Last N Triggers Is Stored
Current displayed waveform
(Select Record = 0)
Selected Record 0
Past waveform
Selected Record –25
Set Select Record to a value
in the range of 0 to – (N – 1).
Search
You can search for waveforms that meet the specified conditions, display the detected history waveforms, and
list the timestamps of the waveforms.
Zone Search
You can search for history waveforms that did or did not pass through a specified search zone.
Waveforms Stored in the Acquisition Memory
Specified area
Selected Record 0
Only waveforms that pass
through the specified area
are detected and displayed.
Selected Record –25
IM DL850-01EN
16-1
16 Displaying and Searching History Waveforms
Parameter Search
You can search for history waveforms that do or do not meet specified search parameter conditions.
Waveforms Stored in the Acquisition Memory
Source: P-P
Condition: OUT
End Record
Selected Record 0
Start Record
Waveforms whose P-P value
exceeds the specified range
are detected.
P-P
Time Range1
Selected Record 28
Time Range2
History Waveform Search Range
The search range is from Start Record to End Record.
Search Method
The DL850/DL850V starts searching in order from the newest waveform.
Calculation, Cursor Measurement, Automated Measurement, Statistical Processing,
and FFT
You can perform calculations, cursor measurement, automated measurement of waveform parameters, or FFT
analysis on the history waveform that you specified with Selected Record. You can also calculate statistics of
automatically measured values on all history waveforms.
Displaying and Analyzing XY Waveforms
You can display XY waveforms and perform analysis on the history waveform you specified with Selected
Record. If the display mode is set to All, XY waveforms of all history waveforms are displayed.
Display Mode (Display Mode)
Selects how history waveforms are displayed.
• One waveform (1 Record): Only the waveform that corresponds to the selected record number is displayed.
• All waveforms (All Record): All history waveforms from the specified start (Start Record) to stop (End Record)
number are overlaid. All waveforms other than the highlighted one are displayed in an intermediate color.
• Averaged waveform (Average Record): Linear averaging is performed on all history waveforms from the
specified start (Start Record) to stop (End Record) number, and the results are displayed as a single
waveform.
An averaged waveform cannot be displayed for the following history waveforms.
Waveforms with record lengths of 250 kpoint or greater on the standard model, 1 Mpoint or greater on
models with the /M1 option, or 2.5 Mpoint or greater on models with the /M2 option.
Highlighting (Selected Record)
The latest history waveform is assigned the record number zero, and older waveforms are assigned numbers in
descending order (−1, −2, −3, and so on).
The waveform and timestamp that correspond to the record number you specify here are highlighted.
Selectable range: 0 to −(the number of waveform acquisitions − 1)
16-2
IM DL850-01EN
16 Displaying and Searching History Waveforms
Maximum Number of Waveform Acquisitions
(Maximum number of history waveforms that can be stored in the acquisition memory)
The number of history waveforms that can be stored varies depending on the selected record length and the
installed memory options as follows:
Record Length
1 kpoint
2.5 kpoint
5 kpoint
10 kpoint
25 kpoint
50 kpoint
100 kpoint
250 kpoint
500 kpoint
1 Mpoint
2.5 Mpoint
5 Mpoint
10 Mpoint
25 Mpoint
50 Mpoint
100 Mpoint
250 Mpoint
500 Mpoint
1 Gpoint
2 Gpoint
Number of Waveforms
No options
/M1 Option
(250 Mpoint)
(1 Gpoint)
5000
5000
5000
5000
2976
5000
1487
5000
593
2381
295
1189
144
583
57
236
28
116
13
54
4
22
1
10
1
4
11
1
12
1
13
11
4
1
12
−
13
−
14
−
−
/M2 Option
(2 Gpoint)
5000
5000
5000
5000
5000
2381
1168
474
235
111
46
22
10
4
1
1
11
12
13
14
1
2
3
4
Only eight channels’ worth of history waveforms are acquired.
Only four channels’ worth of history waveforms are acquired.
Only two channels’ worth of history waveforms are acquired.
Only one channel’s worth of history waveforms are acquired.
− This record length cannot be set.
Display Range (Start and End Record)
Using record numbers, set the range of history waveforms to display when the display mode is set to All or
Average.
Selectable range: 0 to −(the number of waveform acquisitions −1)
List of History Waveforms (List)
The history waveform record numbers and the times when the waveforms were acquired are listed.
IM DL850-01EN
16-3
16 Displaying and Searching History Waveforms
History Waveform Search Mode (Search Mode)
When waveform acquisition is stopped, you can search for history waveforms that meet the specified conditions.
• OFF: Searching is not performed. All history waveforms are displayed.
• Zone: The DL850/DL850V searches for history waveforms that did or did not pass through a specified search
zone.
• Parameter: The DL850/DL850V searches for history waveforms that do or do not meet specified search
parameter conditions.
Search Condition Settings for Zone Searching (Search Setup)
Search Zone (Select Zone)
You can register four search zones to Zone1 to Zone4. For each search zone, set the channels to search, the
search condition, and the search range.
Search Condition (Condition)
IN: The DL850/DL850V searches for waveforms that pass through the specified search window.
OUT: The DL850/DL850V searches for waveforms that do not pass through the specified search window.
OFF: The DL850/DL850V does not search for waveforms.
Source Waveforms (Source)
The DL850/DL850V searches through the waveforms that you select for Source. You can select waveforms from
CH1 to CH16. The waveforms of channels that have not been specified as search source channels are also
displayed. However, you cannot search through the waveforms of a logic module, 16-CH Voltage Input Module,
or CAN bus monitor module.
Search Window Upper and Lower Limits (Upper and Lower)
You can set the limits within ±5 div. You can set them in 0.01 div steps.
You cannot set the upper limit to a value that is less than the lower limit.
Left and Right Sides of the Search Window (Left and Right)
You can set the left and right sides within the range of ±5 div. The resolution is 10 div/display record length.
You cannot set the left side to a value that is greater than the right side.
Search Logic (Logic)
AND: The DL850/DL850V searches for waveforms that meet all the search conditions specified for Zone1 to
Zone4.
OR: The DL850/DL850V searches for waveforms that meet at least one of the search conditions specified for
Zone1 to Zone4.
16-4
IM DL850-01EN
16 Displaying and Searching History Waveforms
Search Condition Settings for Waveform Parameter Searching
(Search Setup)
Search Parameter (Select Param)
You can register four search conditions to Param1 to Param4. For each search condition, you can change the
channels to search, the search condition, and the search range.
Search Condition (Condition)
IN: The DL850/DL850V searches for waveforms in which the specified parameter is within the specified range.
OUT: The DL850/DL850V searches for waveforms in which the specified parameter is outside the specified
range.
OFF: The DL850/DL850V does not search for waveforms.
Source Waveforms and Parameters (Source)
The DL850/DL850V searches through the specified parameter of the specified trace (Trace). You can specify
one type of automatically measured waveform parameter. However, you cannot search through the waveforms
of a logic module, 16-CH Voltage Input Module, or CAN bus monitor module.
Search Condition Upper and Lower Limits (Upper and Lower)
Specify the range used to determine the condition of the specified parameter.
Search Logic (Logic)
AND: The DL850/DL850V searches for waveforms that meet all the search conditions specified for Param1 to
Param4.
OR: The DL850/DL850V searches for waveforms that meet at least one of the search conditions specified for
Param1 to Param4.
Parameter Measurement Time Period (Time Range1/Time Range2)
You can set the measurement time period for the specified parameter by setting Time Range1 and Time Range2.
The default settings are −5 div and +5 div. The number of data points in the measured waveform can be up to
100 Mpoint from the start of the measurement time period.
Selectable range: −5 div to +5 div
The measurement time period is similar to the settable range of the cursor display position in cursor
measurement.
For details, see “Selectable Range of Cursor Positions.”
Search Execution (Execute Search)
Searches for waveforms that meet the specified search conditions and displays only the waveforms and
timestamps that are detected.
Notes about Using the History Feature
Notes about Configuring the History Feature
• You cannot use the history feature when you are using the dual capture feature or during hard disk recording.
• When the acquisition mode is set to Average, you cannot use the history feature.
• If you stop waveform acquisition, even if one complete screen’s worth of waveform data has not been
acquired, the waveform at which the trigger occurred is displayed as a single history waveform.
• If you stop waveform acquisition and then start it again without changing the waveform acquisition conditions,
the waveform data continues to be stored in the acquisition memory.
• If you change the waveform acquisition conditions and start waveform acquisition, the past data stored in the
acquisition memory is cleared.
• An averaged waveform cannot be displayed for the following waveforms.
Waveforms with record lengths of 250 kpoint or greater on the standard model, 1 Mpoint or greater on models
with the /M1 option, or 2.5 Mpoint or greater on models with the /M2 option.
IM DL850-01EN
16-5
16 Displaying and Searching History Waveforms
Notes about Recalling Data Using the History Feature
• You cannot use the history feature while waveform acquisition is in progress.
• The settings are restricted so that the following relationship is retained: Last record (End Record) ≤ Selected
Record ≤ first record (Start Record).
• Waveform data is always loaded from the specified storage medium to record number 0. When there are
multiple records, the most recent waveform is placed in record number 0, and other waveforms are placed in
order in record numbers −1, −2, and so on.
• Computation and automated measurement of waveform parameters are performed on the waveform of
the record number specified by Selected Record. You can analyze old data as long as you do not restart
waveform acquisition and overwrite the contents of the history. However, when an averaged waveform is
displayed (Average Record), you cannot recompute the data even if you change the record number.
• The times that are listed are the waveform trigger times. These times vary as indicated below depending on
the trigger mode.
Trigger Mode
Auto/Auto Level
Single
On Start
Condition
Roll mode
Roll mode, no trigger
−
Time Displayed in the List
Stop time
Stop time
Start time
• When all the waveforms are displayed, if a large number of records are selected, it may take time for them
to be displayed completely. When the display is not complete,
want to stop the operation, set Display Mode to 1 Record.
• The history memory is cleared when you turn the power off.
16-6
appears in the center of the screen. If you
IM DL850-01EN
17 Printing and Saving Screen Captures
You can print screen captures from a built-in printer (option) or a network printer, save images to files, and so on.
Destination Type (Print To)
You can save screen captures and print them on the following types of printers.
• Built-in printer (BuiltIn): You can select this option when the optional built-in printer is installed.
• Network printer (Network): You can select a network printer that the DL850/DL850V is connected to. You must
configure the network printer in advance.
• File (File): You can save screen captures to files in PNG, BMP, and JPEG formats.
Printing from the Built-In Printer (BuiltIn; option)
Models that have the optional built-in printer installed can print from it. Images printed from the built-in printer are
printed just as they are displayed on the DL850/DL850V.
Comment (Comment)
You can enter a comment of up to 26 characters in length. The comment that you create is displayed in the
bottom of the screen.
Changing this comment also changes the network printer and file comments.
Printing from a Network Printer (Network)
You can select a network printer that the DL850/DL850V is connected to. You must configure the network printer
in advance.
Images printed from the network printer are printed just as they are displayed on the DL850/DL850V.
Printer Type (Format)
The printers that the DL850/DL850V can use are listed below.
• HP Inkjet: HP inkjet printers
• HP Laser: HP laser printers
• EPSON Inkjet: EPSON inkjet printers
Color (Color)
You can select the color format to print in from the options below.
• ON: The DL850/DL850V prints using the same colors as the screen, excluding the background color. The grid
and some other items are printed in black.
• OFF: The DL850/DL850V prints in the same way that it prints from the built-in printer.
Comment (Comment)
You can enter a comment of up to 26 characters in length. The comment that you create is displayed in the
bottom of the screen.
Changing this comment also changes the built-in printer and file comments.
IM DL850-01EN
17-1
17 Printing and Saving Screen Captures
Saving Screen Captures to Files (File)
You can save screen captures to files in PNG, BMP, and JPEG formats.
Data Format (Format)
You can select the format to save to from the options listed below.
• PNG: The extension is .PNG. The file size is approximately 50 KB for black and white mode and
approximately 100 KB for color mode.
• BMP: The extension is .BMP. The file size is approximately 150 KB for black and white mode and
approximately 2 MB for color mode.
• JPEG: The extension is .JPG. The file size is approximately 250 KB for color mode.
The file sizes listed here are for reference. Actual file sizes will vary depending on the image that is saved.
Color (Color)
You can select the color format to save to from the options below.
• ON: Saves data using 65536 colors.
• ON (Gray): Saves data using 16 grayscale levels.
• ON (Reverse): Saves data using 65536 colors. The image background is set to white.
• OFF: Saves data in black and white.
Background Transparent or Opaque (Background)
For PNG format, you can save the waveform display area with a transparent background. This feature is
convenient when you want to compare waveforms by overlaying screen captures on the PC.
• Normal (Normal): Saves data without changing the background (not made transparent).
• Transparent (Transparent): Saves data by making the background transparent.
Frame On or Off (Frame)
For JPEG format, you can add a white frame to the image to prevent the surrounding area from dropping out
when the capture is printed.
• ON: The capture is saved with a frame.
• OFF: The capture is saved without a frame.
File Name Setting (File Setup)
You can set file names, comments, and so on. This is the same as the file feature.
Changing the comment also changes the built-in printer and network printer comments.
Printing or Saving a Screen Capture (PRINT)
The screen capture is printed from the specified printer or saved to the specified file.
17-2
IM DL850-01EN
18 Saving and Loading Data
You can save the following kinds of data to an SD memory card, USB storage device, internal or external hard
disk, or network drive.
Waveform data, setup data, screen capture data, snapshot waveform data,
automated measurement data of waveform parameters
You can load the following types of data from a storage medium into the DL850/DL850V.
Waveform data, setup data, snapshot waveform data
You can also rename and copy files and set or clear protection on files.
Storage Media You Can Save and Load From
The DL850/DL850V can access the following five types of storage media for saving and loading data.
SD Memory Card (SD-1)
The SD memory card inserted into the SD memory card slot of the DL850/DL850V.
USB Storage Medium (USB-0 or USB-1)
A USB storage device that is connected to the DL850/DL850V USB port. USB2.0 mass storage devices
compatible with USB Mass Storage Class Ver. 1.1 can be connected to the DL850/DL850V.
Internal Hard Disk (HD-0)
The internal hard disk installed on models with the /HD1 option.
External Hard Disk (HD-0)
An external hard disk connected to the EXT HDD connector on models with the /HD0 option. You can connect
an external hard disk that supports eSATA.
Network Drive (Network)
A storage device on the network. You can use a network storage device by connecting the DL850/DL850V to an
Ethernet network.
Notes about Using the USB Memory
• Connect USB storage media directly, not through a USB hub.
• Only connect a compatible USB keyboard, mouse, or storage device to the USB connector for peripherals.
• Do not connect and disconnect multiple USB devices repetitively. Provide a 10-second interval between
removal and connection.
• Do not connect or remove USB cables from the time when the DL850/DL850V is turned on until key
operation becomes available (approximately 20 to 30 seconds).
• You can use USB storage media that are compatible with USB Mass Storage Class Ver. 1.1.
• The DL850/DL850V can handle up to four storage media. If the connected medium is partitioned, the
DL850/DL850V treats each partition as a separate storage medium. As such, the DL850/DL850V can
handle up to four partitions.
IM DL850-01EN
18-1
18 Saving and Loading Data
Saving Data (Save)
The DL850/DL850V saves data to the specified storage medium.
Press SHIFT and then SAVE to display the SAVE menu. On this menu, you can configure the waveform-data
and screen-capture-data save operations. Press SAVE (without SHIFT) to execute the save operation. On the
menu for configuring the save operation (the SAVE menu), you cannot turn off both the waveform-data and
screen-capture-data save operations.
Saving Waveform Data (Waveform)
You can save the waveform data that the DL850/DL850V has measured to a file in binary, ASCII, or floatingpoint format.
Save Destination (File List)
Specify the file to save to.
File Name (File Name)
Set the file name.
• You can use the auto naming feature to automatically assign file names.
• Whether Auto Naming is set to Numbering, Date, or OFF, when the size of a single file exceeds 2 GB, an
underscore and a three-digit serial number (000 to 999) are appended to the file names.
File Name Example for When Auto Naming Is Set to Date
20100630_121530_100_000 (2010/06/30 12:15:30.100)
Year
Month
Day
ms The serial number (from 000 to
Second 999) that is appended when the
size of a single file exceeds 2 GB.
Minute
Hour
• The underscore and three-digit serial number are not appended to the file name when the file size is 2 GB or
less. However, when a file is saved through the hard disk recording feature, an underscore and the three-digit
serial number 000 are appended to the file name even if the file size does not exceed 2 GB.
• Auto Naming (Auto Naming)
• Numbering (Numbering)
The DL850/DL850V automatically adds a four-digit number from 0000 to 9999 after the common name
specified using the File Name setting (up to four characters) and saves files.
• Date (Date)
The file name is the date and time (down to ms) when the file is saved. The file name specified using the
File Name setting is not used.
• OFF
Disables the auto naming feature. The name that you specify using the File Name setting is used. If there
is a file with the same name in the save destination folder, you cannot save the data.
• Save Destination during Hard Disk Recording and Action Execution
In the specified drive, a folder is automatically created with the date (year, month, and day) as its name,
and data is saved to that folder using file names specified by the auto naming feature. If the number of files
in the save destination folder exceeds 1000, a new folder is automatically created with the date and an
incremented sequence number (000 to 999) as its name, and the data continues to be saved in the new
folder.
• File Name (File Name)
You can set the common file name that is used when the auto naming feature is turned off or when the auto
naming feature is set to Numbering. The maximum number of characters that you can use for file names and
folder names is 64 characters. The following restrictions apply.
• The following types of characters can be used: 0 to 9, A to Z, a to z, _, −, =, (, ), {, }, [, ], #, $, %, &, ~, !, `,and
@. @ cannot be entered consecutively.
18-2
IM DL850-01EN
18 Saving and Loading Data
• The following character strings cannot be used due to MS-DOS limitations.
AUX, CON, PRN, NUL, CLOCK, LPT1, LPT2, LPT3, LPT4, LPT5, LPT6, LPT7, LPT8, LPT9, COM1,
COM2, COM3, COM4, COM5, COM6, COM7, COM8, or COM9
• Make sure that the full file path (absolute path from the root directory) is less than or equal to 260
characters in length. If it exceeds 260 characters, an error occurs when you perform a file operation (such
as save, copy, rename, or create folder). When an operation is being performed on a folder, the full path is
up to the name of the folder. When an operation is being performed on a file, the full path is up to the name
of the file.
The following additional restrictions apply when you use the file name auto naming feature.
• If you set auto naming to Numbering, file names will be eight characters long. A file name will consist of the
four characters that you entered for the file name and a four-character sequence number.
• If you set auto naming to Date (date and time), the characters that you entered for the file name will not be
used. File names will only consist of the date information.
• Comment (Comment)
You can add a comment that consists of up to 120 characters when saving files. You do not have to enter a
comment. All characters, including spaces, can be used in a comment.
Data Type (Data Type)
Set the data type to binary, ASCII, or floating point.
• Binary (Binary)
• The sampled data stored to the acquisition memory is saved to a file in binary format. The extension is
.WDF. A thumbnail file is also saved at the same time. The thumbnail file can be viewed in the File Property
screen.
• You can load the saved binary format data into the DL850/DL850V, display the waveform of the data, and
view the values that it contains. Accumulate is always set to OFF for loaded data.
• If you save a waveform measured using the dual capture feature in binary format, the main waveform data
and captured waveform data are saved to the same file.
• ASCII (ASCII)
• The sampled data stored in the acquisition memory is converted using the specified range and saved to a
file in ASCII format. The extension is .CSV. You can use the file to analyze waveforms on your PC.
• You cannot load the file into the DL850/DL850V.
• Waveforms measured using the dual capture feature are saved simultaneously to separate mainwaveform-data and captured-waveform-data files. The captured-waveform-data file is automatically saved
to the same name as the main-waveform-data file with DC added to the end of the file name.
If you configure the record length and the number of channels so that the size of a file would exceed 2 GB,
the file cannot be created.
• Floating Point (Float)
• The sampled data stored in the acquisition memory is converted using the specified range and saved to
a file in 32-bit IEEE floating format. The extension is .FLD. You can use the file to analyze waveforms on
your PC. The data notation is little-endian (Intel format).
• You cannot load the file into the DL850/DL850V.
• Waveforms measured using the dual capture feature are saved simultaneously to separate mainwaveform-data and captured-waveform-data files. The captured-waveform-data file is automatically saved
to the same name as the main-waveform-data file with DC added to the end of the file name.
If you configure the record length and the number of channels so that the size of a file would exceed 2 GB,
the file cannot be created.
IM DL850-01EN
18-3
18 Saving and Loading Data
Data Size
The data sizes indicated below are for when the record length is 100 kpoint and you save the measured data
from CH1 to CH4 with all computed waveforms turned off and one history waveform.
Data Type
Binary
ASCII
Float
Extension
.WDF
.HDR
.CSV
.FLD
Size (In bytes)
Approx. 800 K: (100 kpoint + 32) × 4 channels × the number of history waveforms × 2
Approx. 2 K (approx. 3 K when Math1 and Math2 are set to ON)
4 to 5 Mpoint
Approx. 1.6 M: (100 kpoint + 32) × 4 × the number of history waveforms × 4
Save Range (Range)
You can select the waveform save range (area) from one of the choices below.
• Main window (Main): Saves the data displayed in the main window
• Zoom 1 or Zoom2 (Zoom1 or Zoom2): Saves the data displayed in the specified zoom window
• Cursor range (Cursor Range): Saves the data in the area between the cursors
Save Conditions (Waveform Save Setup)
• Waveform to Save (Select Save Trace)
• You can select All ON, CH1 to CH16,1 16chVOLT,2 CAN,3 and Math. The waveforms you select that are
displayed are saved. Even if you select All ON, only the waveforms that are displayed are saved.
1 You can select the channel of an installed module.
2 If the 16-CH Voltage Input Module is installed. You cannot select sub channels.
3 When a CAN bus monitor module is installed. You cannot select sub channels.
• The vertical-axis, horizontal-axis, and trigger settings are also saved along with the waveforms.
• Saving History Waveforms (History)
You can set the source waveform to one of the waveforms below.
• One waveform (One): Only the waveform with the record number specified in the history menu is saved.
• All waveforms (All): All history waveforms between the start and end numbers specified in the history menu
are saved.
To save an averaged history waveform, set the display mode in the history menu to Average Record, and set
History to One.
• P-P Compression (P-P Comp)
When you save waveform data in binary format, you can choose whether to use P-P compression on it.
• ON: P-P compression is used on the data before it is saved.
• OFF: The data is saved without being P-P compressed.
• Data Removal Interval (Interval)
When you save data in ASCII format, you can thin out the data before you convert it to ASCII format. Set the
data removal interval.
OFF (no data is removed), 5 points (Per 5), 10 points (Per 10), 20 points (Per 20), 50 points (Per 50), 100
points (Per 100), 200 points (Per 200), 500 points (Per 500), 1000 points (Per 1000), 2000 points (Per 2000),
5000 points (Per 5000)
For example, if you select Per 5, the data will be removed as indicated below.
First data point, +5, +10, +15...
• Time Information (Time Info.)
When you save data in ASCII format, you can choose whether to save time information.
• ON: Time information is saved.
• OFF: Time information is not saved.
• Extension (Extension)
When you save data in ASCII format, you can set the extension of the files that you save to .csv or .MATLAB.
18-4
IM DL850-01EN
18 Saving and Loading Data
• Decimal Point (Decimal Point)
When you save data in ASCII format, you can choose how to separate the data.
• Point (Point): The decimal point is a period, and the separator is a comma.
• Comma (Comma): The decimal point is a comma, and the separator is a semicolon.
• Saving Sub Channel Data (Sub Channel)
When you save data in ASCII format, you can choose whether to supplement the data of 16-CH Voltage Input
Module sub channels.
• Supplement (Supplement): Blank spaces are filled with repetitions of the same data so that the sub
channels have the same amount of data as an ordinary channel.
• Space (Space): Spaces are left where there is no data.
Notes about Using the 16-CH Voltage Input Module
• If you change the extension of the saved data file, by using a PC or some other device, the DL850/DL850V
will no longer be able to load it.
• Up to 1000 files and folders can be displayed in the file list. If there are more than a total of 1000 files and
folders in a given folder, the file list for that folder will only display 1000 files and folders. There is no way to
set which files and folders are displayed.
• Math waveforms are not saved if they are shorter than 10 div or if the computation start point is not −5 div.
Data Format for Saving Multiple Records
The DL850/DL850V saves data that contains multiple records, such as history waveforms, in the following data
format.
ASCII format: CR+LF is inserted between records.
<Header>
CH1 data 1-1, CH2 data 1-1, ..., [CR+LF]
CH1 data 1-2, CH2 data 1-2, ..., [CR+LF]
One history record
CH1 data 1-m, CH2 data 1-m, ..., [CR+LF]
[CR+LF]
CH1 data 2-1, CH2 data 2-1, ..., [CR+LF]
CH1 data 2-2, CH2 data 2-2, ..., [CR+LF]
CH1 data 2-n,
[CR+LF]
CH2 data 2-n, ...,
[CR+LF]
Float format: Data is saved separately by channel.
Measured data for CH1 on record 1
Measured data for CH1 on record 2
Measured data for CH1 on record N
Measured data for CH2 on record 1
Measured data for CH2 on record 2
Measured data for CH2 on record N
IM DL850-01EN
18-5
18 Saving and Loading Data
Saving Setup Data (Setup)
You can save the DL850/DL850V setup information to the specified storage medium. The extension is .SET.
Save Destination (File List), File Name (File Name), Comment (Comment)
Saving to Internal Memory
You can save setup data to internal memory from the Store/Recall menu.
Saving Other Types of Data (Others)
You can save the following types of data.
Save Destination (File List), File Name (File Name), Comment (Comment)
Data Type (Data Type)
• Screen capture (Screen Image): You can save the displayed screen image to a file in PNG, BMP, or JPEG
format. You can also save the screen image from the menu that appears when you press the PRINT MENU
key.
• Snapshot waveforms (Snap): You can save the waveform data captured in a snapshot. The extension is .SNP.
• Measure (Measure): You can save the results of the automated measurement of waveform parameters to a
file in CSV format.
Automated Measurement Values of Waveform Parameters (Measure)
Save the results of automatic waveform parameter measurement to a file in CSV format. The extension is .CSV.
CSV files are text files that contain data separated by commas. They are used to convert data between
spreadsheet and database applications.
The maximum number of previous values that you can save is equal to 100000 ÷ number of items that are
turned on.
Data size in bytes = Number of measured items × 15 × number of history waveforms
Saving (Execute Save)
Saves the data to the specified save destination with the specified file name.
18-6
IM DL850-01EN
18 Saving and Loading Data
Loading Data (Load)
You can load waveform data, setup data, and snapshot waveforms that have been saved by the DL850/DL850V.
Loading Waveform Data (Waveform)
Waveform data in binary format (files with .WDF extensions) can be loaded.
You can load a specified waveform data file with the setup data. You can load the entirety of the specified
waveform data file. Waveforms of computed data appear when computation is turned on. Because setup data is
also loaded, the DL850/DL850V settings change when you load waveform data. If you start waveform acquisition
by pressing the START/STOP key, the loaded data is cleared.
• If the modules that are currently installed in the DL850/DL850V are different from the modules that were
installed when the waveform data was saved, you cannot load the waveform data for the modules that are
different.
• If you load waveform data saved by a module with a larger amount of memory on a module with a smaller
amount of memory, the number of history waveforms, acquisition conditions, number of channels, and
other settings are adjusted to match the condition of the module with the smaller amount of memory.
• You can only load waveform data that you saved with the save range set to the main window.
Loading Setup Data (Setup)
The setup data of the specified file is loaded. The extension is .SET.
Recalling Data from the Internal Memory
You can recall setup data from the internal memory from the save/load menu.
If the modules that are currently installed in the DL850/DL850V are different from the modules that were
installed when the setup data was saved, you cannot load the setup data for the modules that are different.
Loading Other Types of Data (Others)
The snapshot waveforms of the specified file or the contents of a symbol definition file are loaded.
Snapshot Waveforms (Snap)
The snapshot waveforms that you load are displayed in white on the screen. The extension is .SNP.
Symbol Definition Files (Symbol)
CAN data definition files whose extensions are .SBL.
Loading (Execute Load)
Loads the data of the specified file.
IM DL850-01EN
18-7
18 Saving and Loading Data
File Operations (Utility)
You can perform file operations such as creating folders on the storage medium, deleting and copying files, and
changing file names.
Sorting the List (Sort To)
You can sort the file list by file name, data size, date, etc.
Display Format
Select whether to display a list of files or to display thumbnails.
Selecting the Type of File to List (File Filter)
You can limit the type of files that appear in the list by selecting an extension.
Changing the Storage Medium (Change Drive)
You can select the storage medium that you want to access. The DL850/DL850V displays various storage media
as follows:
• SD-1: The SD memory card inserted into the SD memory card slot of the DL850/DL850V
• USB-0: A USB storage device that is connected to a DL850/DL850V USB port (the first connected device)
• USB-1: A USB storage device that is connected to a DL850/DL850V USB port (the second connected device)
• HD-0: On models with the /HD0 option: an external hard disk that supports eSATA connected to the EXT HDD
connector. On models with the /HD1 option: the internal hard disk.
• Network: A storage device on the network
Making Folders (Make Dir)
Make a folder.
You can use the same characters in folder names that you can in file names.
Copying and Moving Files (Copy and Move)
You can copy or move the selected files and folders to other storage media or folders. You can copy or move
multiple files at the same time.
Deleting Files and Folders (Delete)
You can delete the selected files and folders.
Renaming Files and Folders (Rename)
You can rename a selected file or folder.
Turning File Protection On and Off (Protect ON and OFF)
You can turn protection on and off for the selected file. The change is reflected in the file attributes, displayed
under the Attr column in the file list.
Protection
ON
File Attribute
r
OFF
r/w
Description
File protection is on for the selected file.
The file can only be read. The file cannot be written to or deleted.
File protection is off for the selected file.
The file can be read and written to.
File Property (File Property)
You can view information about the selected file, such as its name (File Name), file size (File Size), the date and
time when it was saved (Date/Time), and its attributes (Attribute).
Selecting Files (ALL SET, ALL RESET, and SET/RESET)
Selects or deselects all the files in the list.
You can also only select or deselect the highlighted files.
18-8
IM DL850-01EN
18 Saving and Loading Data
To format the storage medium, press the UTILITY key to display the System Config menu, and then select
Storage Manager.
IM DL850-01EN
18-9
19 Ethernet Communication (Network)
You can configure TCP/IP parameters and use the optional Ethernet interface to perform the following tasks.
To use this feature, set the communication interface to Network (from the UTILITY menu, select Remote Ctrl
> Device > Network).
TCP/IP
TCP/IP settings for connecting to an Ethernet network.
Set the IP address, subnet mask, and default gateway.
FTP Server (FTP/Web Server)
You can connect the DL850/DL850V as an FTP server to a network.
You can connect to the DL850/DL850V from a PC on the same network and retrieve waveform data.
Web Server (FTP/Web Server)
You can connect the DL850/DL850V as a Web server to a network.
You can connect to the DL850/DL850V from a PC on the same network and monitor the DL850/DL850V display
from the PC.
Mail (Mail)
The action-on-trigger or GO/NO-GO action can be set to mail transmission.
Network Printer (Net Print)
You can specify a network printer for printing screen captures.
Network Drive (Net Drive)
You can save waveform data and setup data to a network drive through an Ethernet connection.
SNTP
The DL850/DL850V clock can be set using SNTP. The DL850/DL850V can be configured to automatically adjust
its clock when it is turned on.
To connect a PC to the DL850/DL850V, use a hub or router, and connect to a network. Do not connect a PC
directly to the DL850/DL850V.
IM DL850-01EN
19-1
19 Ethernet Communication (Optional)
TCP/IP (TCP/IP)
Configure the settings that the DL850/DL850V needs to connect to a network.
DHCP
DHCP is a protocol that temporarily allocates settings that a PC needs to connect to the Internet.
To connect to a network that has a DHCP server, turn the DHCP setting on. When DHCP is turned on, the IP
address can be automatically obtained when the DL850/DL850V is connected to a network. (You do not have to
set it manually.)
When DHCP is turned off, you must set the appropriate IP address, subnet mask, and default gateway for the
network.
DNS
DNS is a system used to associate Internet host names and domain names with IP addresses. Given AAA.
BBBBB.com, AAA is the host name and BBBBB.com is the domain name. You can use host names and domain
names to access the network instead of using IP addresses, which are just numbers. The DL850/DL850V allows
you to specify the host by name, instead of by IP address. Set the domain name and the DNS server address
(0.0.0.0 by default). For details, consult your network administrator.
DNS Servers (DNS Server1/DNS Server2)
You can specify up to two DNS server addresses: primary and secondary. If querying fails with the primary DNS
server, the secondary DNS server is automatically used to find the mapping of the host name and domain name
to the IP address.
Domain Suffixes (Domain Suffix1/Domain Suffix2)
The domain suffix is a piece of information that is automatically added when a query is made to a DNS server
using only a portion of the domain name. For example, if BBBBB.co.jp is registered as a domain suffix and a
query is made using “AAA,” the name “AAA.BBBBB.co.jp” is searched.
You can specify up to two domain suffixes: Domain Suffix1 and Domain Suffix 2.
You can use up to 127 characters. The characters that you can use are 0 to 9, A−Z, a−z, and dashes.
TCP/IP settings are applied when you press BIND and then SET or when you turn on the DL850/DL850V the
next time.
19-2
IM DL850-01EN
19 Ethernet Communication (Optional)
FTP Server (FTP/Web Server)
You can connect the DL850/DL850V as an FTP server to a network.
Set the user name and password that will be used by devices on the network to access the DL850/DL850V.
Also, set the access timeout value.
User Name (User Name)
Set the user name that will be used to access the DL850/DL850V from a PC. The characters that you can use
for the password are all the ASCII characters on the keyboard. If you set the user name to “anonymous,” you
can connect to the DL850/DL850V without entering a password.
Password (Password)
Set the password that will be used to access the DL850/DL850V from a PC. The characters that you can use for
the password are all the ASCII characters on the keyboard.
Timeout (Timeout)
If an ftp connection cannot be established between the DL850/DL850V and the PC within the amount of time
specified here, the DL850/DL850V aborts the connection process.
To apply the settings that you specified, press Entry.
FTP Server Overview
When the DL850/DL850V is connected to the network as an FTP server, the following features become
available.
FTP Server
From a PC, you can view a list of files that are stored in the DL850/DL850V storage medium (the internal
memory or a storage medium that is connected to it) and retrieve files.
PC System Requirements
PC
A PC running Microsoft Windows XP Professional or Mac OS X.
OS
Microsoft Windows XP Professional or Mac OS X (10.4.8)
Internal memory
512 MB or more recommended.
Communication ports
100BASE-TX or 1000BASE-T Ethernet port. Use this port to connect the PC to the network.
Display
A display compatible with any of the above operating systems and with a resolution of 1024×768 or higher.
Mouse or pointing device
Mouse or pointing device compatible with any of the above operating systems
Web browser
Internet Explorer 6.0, Firefox 3.0, or Safari (3.2.1)
IM DL850-01EN
19-3
19 Ethernet Communication (Optional)
Web Server (FTP/Web Server)
You can connect the DL850/DL850V as a Web server to a network.
Set the user name and password that will be used by devices on the network to access the DL850/DL850V.
Also, set the access timeout value.
User Name (User Name)
Set the user name that will be used to access the DL850/DL850V from a PC. The characters that you can use
for the password are all the ASCII characters on the keyboard. If you set the user name to “anonymous,” you
can connect to the DL850/DL850V without entering a password.
Password (Password)
Set the password that will be used to access the DL850/DL850V from a PC. The characters that you can use for
the password are all the ASCII characters on the keyboard.
To apply the settings that you specified, press Entry.
Web Server Overview
When the DL850/DL850V is connected to the network as an Web server, the following features become
available.
Web Server
You can display the DL850/DL850V screen on the PC and start and stop measurement through the Ethernet
network. You can refresh the DL850/DL850V screen that is displayed on the PC and take screen captures.
PC Operations
Setting the Screen Update Rate: You can set the update rate to 5 s, 10 s, 30 s, or 60 s.
Screen Update Start: The display starts updating automatically at the rate that you specify.
Screen Update Stop: You can stop the updating of the display.
Manually Update the Screen: You can update the display manually.
START/STOP: You can start and stop measurement on the DL850/DL850V.
Full Screen Capture: You can take full-screen screen captures.
PC System Requirements
• You need Adobe Flash Player (version 8 or later) to use the Web server function. When visiting this Web
site, the most recent Flash Player is automatically downloaded. If the download does not begin, please
obtain the latest Flash Player from the Adobe Web site.
• When using the full screen capture function, be sure to disable pop-up blockers on your browser.
• The Web server function is unavailable when printing on the instrument or manipulating files.
• The Web server function can also not be used if the instrument is connected to a PC while the Mass
Storage setting is enabled on the PC. After disconnecting the PC or enabling the USBTMC setting, restart
the DL850/DL850V.
19-4
IM DL850-01EN
19 Ethernet Communication (Optional)
Mail (Mail)
You can send trigger times and other information in emails to a specific email address as an action in the actionon-trigger or GO/NO-GO determination feature.
Mail Server (Mail Server)
Specify the IP address of the mail server on the network that the DL850/DL850V will use. In a network with a
DNS server, you can specify the host name and domain name instead of the IP address.
Mail Address (Mail Address)
You can specify multiple email recipient addresses. Separate each address with a comma.
Comment (Comment)
If necessary, you can enter a comment in the first line of e-mails.
Attaching Image Files (Attached Image File)
You can attach a capture of the screen that is displayed at the time the email is sent.
File format: The format that you set in the FILE menu for saving screen captures.
File name: DL_image[time].extension
(Example: DL Image1006171158.extension is a screen capture taken at 11:58 on June 17, 2010.)
Resolution: XGA (1024×768 dots)
Approximate File Size
Normal screen: Approx. 50 KB
Maximum: Approx. 1.6 MB (when the screen contains many colors)
Timeout (Timeout)
If the DL850/DL850V cannot send an email for the amount of time specified here, it disconnects from the mail
server.
Sending a Test Mail (Send Test Mail)
You can send a test mail to check whether emails can be sent properly.
IM DL850-01EN
19-5
19 Ethernet Communication (Optional)
Network Printer (Net Print)
You can print screen captures on a network printer.
The DL850/DL850V can print to the following printers.
EPSON Inkjet printers (EPSON Inkjet)
HP inkjet printers (HP Inkjet)
HP laser printers (HP Laser)
LPR servers (LPR Server)
Specify the IP address of the printer server that the DL850/DL850V will connect to. In a network with a DNS
server, you can specify the host name and domain name instead of the IP address.
LPR is a protocol used to print over a TCP/IP network.
LPR Name (LPR Name)
The name of the shared printer that the DL850/DL850V will connect to.
Timeout (Timeout)
If the DL850/DL850V cannot print for a certain amount of time, it disconnects from the network printer.
Network Drive (Net Drive)
You can save waveform data and setup data to a network drive through an Ethernet connection.
FTP Server (FTP Server)
Specify the IP address of the FTP server on the network that you want to save waveform or setup data to. In a
network with a DNS server, you can specify the host name and domain name instead of the IP address.
Login Name (Login Name)
Specify the login name. The characters that you can use for the password are all the ASCII characters on the
keyboard.
Password (Password)
Specify the password that corresponds to the login name. The characters that you can use for the password are
all the ASCII characters on the keyboard.
Passive Mode (Passive)
Turn passive FTP on or off.
In passive mode, the FTP client sets the port number for data transfer. Enable passive mode when you have set
an external FTP server as a network drive or when you are accessing an FTP server through a firewall.
Timeout (Time Out)
If the DL850/DL850V cannot transfer files for a certain amount of time, it disconnects from the FTP server.
Connecting to the Network Drive(Connect/Disconnect)
When you press the Connect button, the DL850/DL850V connects to the specified network drive, and the drive
appears in the file list (File List). When you press the disconnect button, the network drive is disconnected and
removed from the file list (File List).
19-6
IM DL850-01EN
19 Ethernet Communication (Optional)
SNTP (SNTP)
The DL850/DL850V clock can be set using Simple Network Time Protocol (SNTP). The DL850/DL850V can be
configured to automatically adjust its clock when it is turned on.
SNTP Server (SNTP Server)
Specify the IP address of the SNTP server that the DL850/DL850V will use. In a network with a DNS server, you
can specify the host name and domain name instead of the IP address.
Timeout (Timeout)
If the DL850/DL850V cannot connect to the SNTP server for a certain amount of time, it aborts the operation.
Executing Time Adjustment (Adjust)
The DL850/DL850V clock is synchronized to the SNTP server clock.
Automatic Adjustment (Adjust at Power On)
You can configure the DL850/DL850V so that its clock is automatically synchronized to the SNTP server clock
when the DL850/DL850V is turned on when it is connected to the network.
• If the time difference from GMT (Greenwich Mean Time) is set in the date/time setting, the DL850/DL850V
will make appropriate adjustments to the time information received from the SNTP server.
• If you do not want the DL850/DL850V to synchronize with an SNTP server, do not set the SNTP server IP
address.
IM DL850-01EN
19-7
20 Other Features
Auto Setup (Auto Setup)
The auto setup feature automatically sets the SCALE (vertical axis), TIME/DIV (horizontal axis), trigger level, and
other settings to values that are most suitable for the input signals. This feature is useful when you are not sure
what type of signal will be applied to the DL850/DL850V. The auto setup feature will not work properly on some
input signals. There are some modules with which the auto setup feature cannot be used.
Center Position after the Execution of Auto Setup
The center position after you execute auto setup will be 0 V.
Modules That Support Auto Setup
701250 (HS10M12), 701251 (HS1M16), 701255 (NONISO_10M12), 701260 (HV (with RMS)), 701261
(UNIVERSAL), 701262 (UNIVERSAL (AAF)), 701275 (ACCL/VOLT), 720210 (HS100M12), 720220 (16CH
VOLT)
Source Channels
The DL850/DL850V executes auto setup based on the signals of all channels excluding logic channels.
Waveforms Displayed before the Execution of Auto Setup
Waveforms that were displayed before you execute auto setup will be cleared.
Signals That Auto Setup Can Be Applied To
You can use auto setup for the following types of input signals.
• When module 720210 is installed: Simple, repeating signals with frequencies between 50 Hz and 10 MHz
When module 720210 is not installed: Simple, repeating signals with frequencies between 50 Hz and 1 MHz
• Signals whose maximum absolute input voltage is 20 mV at 1:1 probe attenuation to the maximum range × 10
The auto setup feature may not work properly for signals that include a DC component or high-frequency
components.
Undoing Auto Setup (Undo)
You can revert to the settings that were used immediately before you executed auto setup.
Initializing Settings (Initialize)
You can reset the DL850/DL850V settings to their factory default values. This feature is useful when you want to
cancel all the settings that you have entered or when you want to redo measurement from scratch. Default reset
refers to the act of resetting the DL850/DL850V settings to their factory default values.
Items That Cannot Be Reset
The following settings cannot be reset.
Date and time settings, communication settings, the language setting (Japanese or English), and environment
settings
Undoing Default Reset (Undo)
If you perform default reset by mistake, you can undo it by pressing the Undo soft key.
To Reset All Settings to Their Default Values
While holding down the RESET key, turn the power switch on. All settings except the date and time settings (display
on/off setting will be reset) and the setup data stored in internal memory will be reset to their factory default
values. If you reset the settings using this method, the changes cannot be undone.
IM DL850-01EN
20-1
20 Other Features
Storing and Recalling Setup Data (Setup Data Store and Recall)
You can save up to three sets of setup data to specific internal memory areas. It is convenient to save setup data
that you use frequently. You can save a set of setup data to one of the following numbers.
1, 2, 3
By specifying these numbers, you can store and recall setup data easily.
You can attach comments in the same way that you can when you save waveform data.
Calibration (CAL)
Executing Calibration (Execute Calibration)
Calibrates following items. Execute calibration when you want to make accurate measurements.
• Vertical-axis ground level
Calibration is performed automatically when the power switch is turned on.
Notes about Calibration
• Allow the DL850/DL850V to warm up for at least 30 minutes before you execute calibration. If you execute
calibration immediately after power-on, the calibrated values may drift due to temperature changes or other
environmental changes.
• Execute calibration in a stable temperature environment ranging from 5 to 40°C (23 ± 5°C recommended).
• Do not apply signals when calibrating. Calibration may not be executed properly when input signals are being
applied to the DL850/DL850V.
Auto Calibration (Auto Calibration)
Auto calibration is executed when you start signal acquisition if any of the time periods listed below has elapsed
since the power was turned on.
• Approx. 3 minutes
• Approx. 10 minutes
• Approx. 30 minutes and every 30 minutes thereafter
Snapshot (SNAP SHOT)
Retains the currently displayed waveforms on the screen. This feature allows you to update the display without
having to stop waveform acquisition. It is a useful feature when you want to compare waveforms.
Snapshot waveforms are displayed in white.
You cannot perform the following operations on snapshot waveforms.
Cursor measurement, automated measurement of waveform parameters, zoom, or computation
You can save and load snapshot waveforms.
Clear Trace (CLEAR TRACE)
Clears all the waveforms that are displayed on the screen.
If you change the display format or perform other similar operations, the DL850/DL850V redisplays the channel
waveforms, computed waveforms, and loaded waveforms that were displayed before you executed the clear
trace operation.
Snapshot and clear trace features are disabled:
• When the DL850/DL850V is in remote mode.
• When the DL850/DL850V is printing, when it is executing auto setup, or when it is accessing a storage
medium.
• When go/no-go determination is in progress, when action-on-trigger is in progress, or when searching is in
progress.
20-2
IM DL850-01EN
20 Other Features
Remote Control (Remote Ctrl)
Communication interface for controlling the DL850/DL850V from a PC. For details, see the communication
interface user’s manual, IM DL850-17EN.
Types of Communication Interfaces (Device)
USB, GP-IB, and Network are the available communication interfaces.
• Only use the selected communication interface. If you send commands simultaneously from another
communication interface that has not been selected, the DL850/DL850V will not execute the commands
properly.
• When the DL850/DL850V is in remote mode and is communicating with a PC, REMOTE appears in the
center of the DL850/DL850V screen. All keys except SHIFT + CLEAR TRACE are disabled in Remote
mode.
USB
Connects the DL850/DL850V to a PC using USB.
To remotely control the DL850/DL850V using communication commands through the USB port, select USBTMC
and then carry out the following procedure.
• Install YOKOGAWA USB TMC (Test and Measurement Class) driver on your PC. For information about how
to obtain the YOKOGAWA USB TMC driver, contact your nearest YOKOGAWA dealer. You can also access
the YOKOGAWA USB driver download webpage and download the driver (http://tmi.yokogawa.com/servicesupport/downloads/).
• Do not use USB TMC drivers (or software) supplied by other companies.
GP-IB
Connects the DL850/DL850V to a PC using GP-IB.
Address (Address)
• You can set the address to a value from 0 to 30.
• Each device that is connected by GP-IB has its own unique address in the GP-IB system. This address
is used to distinguish one device from other devices. Therefore, you must assign a unique address to the
DL850/DL850V when connecting it to a PC or other device.
• Several cables can be used to connect multiple devices. However, no more than 15 devices, including the
controller, can be connected on a single bus.
• When connecting multiple devices, you must assign a unique address to each device.
• When the controller is communicating with the DL850/DL850V or with other devices through GP-IB, do not
change the address.
• Use cables that are 2 m or shorter in length to connect devices.
• Keep the total length of the cables under 20 m.
• When devices are communicating, have at least two-thirds of the devices on the bus turned on.
• To connect multiple devices, use a star or daisy-chain configuration. Loop and parallel configurations are
not allowed.
IM DL850-01EN
20-3
20 Other Features
Network
Connects the DL850/DL850V to a PC using Ethernet.
• You must set TCP/IP parameters to connect the DL850/DL850V to an Ethernet network.
• To connect the DL850/DL850V to a PC, be sure to use straight cables through a hub. Correct operation is
not guaranteed for a one-to-one connection using a cross cable.
• Use one of the following types of network cable that conforms to the transfer speed of your network.
A UTP (Unshielded Twisted-Pair) cable
An STP (Shielded Twisted-Pair) cable
20-4
IM DL850-01EN
20 Other Features
System Configuration (System Configuration)
You can specify the following settings.
• DL850/DL850V date and time
• Language
• Click sound on/off
• LCD adjustment
• Format Internal Memory
• USB Keyboard Language
• USB Communication
Date and Time Settings (Date/Time)
The DL850/DL850V date and time.
Turning the Display On and Off (Display)
Set whether to display the date and time on the DL850/DL850V screen.
Display Format (Format)
You can display the date in one of the following formats.
2010/06/30 (year/numeric month/day)
30/06/2010 (day/numeric month/year)
30-JUN-10 (day-English abbreviation of the month-last two digits of the year)
30 JUN 2010 (day month (English abbreviation) year)
Date and Time Settings (Date/Time)
Sets the date and time.
Time Difference from Greenwich Mean Time (Time Diff. GMT)
Set the time difference between the region where you are using the DL850/DL850V and Greenwich Mean Time.
Selectable range: Set the time difference in the range of −12 hours 00 minutes to 13 hours 00 minutes.
For example, Japan standard time is ahead of GMT by 9 hours. In this case, set Time Hour to 9 and Minute to
00.
Checking the Standard Time
Using one of the methods below, check the standard time of the region where you are using the DL850/
DL850V.
• Check the Date, Time, Language, Regional Options on your PC.
• Check the standard time at the URL on the right. http://www.worldtimeserver.com/
• The DL850/DL850V does not support Daylight Savings Time. To set the Daylight Savings Time, reset the
time difference from Greenwich Mean Time.
• Date and time settings are backed up using the internal lithium battery. They are retained even if the power
is turned off.
• The DL850/DL850V has leap-year information.
IM DL850-01EN
20-5
20 Other Features
Time Synchronization Feature (Time Synchro; optional)
You can use this feature to use an IRIG (Inter Range Instrumentation Group) signal to synchronize the time on
the DL850/DL850V with the GPS (Global Positioning System). This feature has three conditions: Unlock, Lock,
and Stable. When an IRIG signal is properly received, the DL850/DL850V enters into the Lock condition and
acquires time information.
Turning the Time Synchronization Feature On and Off (Time Synchro)
You can select whether to use an IRIG (Inter Range Instrumentation Group) signal for time synchronization.
IRIG Code Format (IRIG Format)
You can set the IRIG code format to A or B.
IRIG Code Modulation Type (Modulation)
You can set the IRIG code modulation type to AM or Pulse-width Code (PWCode).
Input Impedance (Impedance)
You can set the input impedance to 50 Ω or 5 kΩ.
The time synchronization feature has three conditions: Unlock, Lock, and Stable. When an IRIG signal is
properly received, the DL850/DL850V enters into the Lock condition. Time acquisition and synchronization
are possible after 1 s. A few minutes after the DL850/DL850V enters the Lock condition, it enters into the
Stable condition. In the Stable condition, the internal clock of the DL850/DL850V is synchronized to within 10
ppm of the GPS.
Language (Language)
Sets the language that is used in the setup menu and messages.
The available languages vary depending on the DL850/DL850V model that you are using.
Adjusting the LCD (LCD)
You can turn off the LCD and adjust its brightness.
Adjusting the Brightness (Brightness)
You can adjust the brightness in the range of 1 (darkest) to 9 (brightest). You can prolong the LCD service life by
decreasing the LCD brightness or by turning off the LCD when you do not need to view it.
Turning Off the LCD (LCD Turn OFF)
You can turn off the LCD. When the LCD is off, you can turn it back on by pressing a key.
Automatically Turning Off the LCD (Auto OFF)
The LCD turns off automatically when there are no key operations for a given time period. The LCD turns back
on when you press a key.
Formatting Storage Media (Storage Manager)
You can format storage media.
If you format a storage medium, all saved data is erased.
USB Keyboard Language (USB Keyboard)
Sets the USB keyboard language to English or Japanese. The USB keyboard can be used to enter file names,
comments, etc.
20-6
IM DL850-01EN
20 Other Features
USB Communication (USB Function)
You can specify the communication features that are used when you connect the DL850/DL850V to a PC
through USB.
• TMC: You can use USB TMC (Test and Measurement Class) to control the DL850/DL850V from a PC.
To remotely control the DL850/DL850V using communication commands through the USB port, select
USBTMC and then carry out the following procedure.
• Install YOKOGAWA USB TMC driver on your PC.
• Do not use USB TMC drivers (or software) supplied by other companies.
• Storage: The connected PC can use the DL850/DL850V as a USB storage device.
• There is no need to install the USB TMC driver into your PC.
• For information about how to obtain the YOKOGAWA USB TMC driver, contact your nearest YOKOGAWA
dealer. You can also access the YOKOGAWA USB driver download webpage and download the driver (http://
tmi.yokogawa.com/service-support/downloads/).
• When USB Function is set to Storage, only the internal hard disk of the DL850/DL850V can be used as a
storage device. You cannot access the storage media connected to the USB ports of the DL850/DL850V.
• When you access the internal hard disk of the DL850/DL850V from a PC, only perform read, write, and
delete operations. Otherwise, the DL850/DL850V may be damaged.
• When USB Function is set to Storage and files are being accessed, do not remove the USB cable or turn
off the DL850/DL850V. Doing so may damage the DL850/DL850V.
IM DL850-01EN
20-7
20 Other Features
Environment Settings (Preference)
Action Performed at Power On (Power On Action)
Setting Whether to Start Waveform Acquisition (Start)
Select whether to start waveform acquisition at power on (ON) or not (OFF).
Setting Whether to Turn the Action Function On or Off (Action)
Select whether to enable the action function at power on (ON) or not (OFF).
• ON: When the power is turned on, the action mode setting is the same as it was when the power was turned
off.
• OFF: When the power is turned on, the action mode is off.
Logic Settings (Logic Setup)
Logic Channel Display Format (Numerical Format)
Choose whether to display the logic waveform values in the numeric monitor as binary (Bit) or hexadecimal (Hex)
values.
Cursor Read Order (Cursor Order)
Choose the order that you want to read the bit data from logic input signals in.
• 1->8: Bit 1 to bit 8
• 8->1: Bit 8 to bit 1
Bit Data Display Order (Bit Order)
Choose the order that you want to display the bit data from logic input signals in.
• 1->8: Bit 1 to bit 8
• 8->1: Bit 8 to bit 1
Terminal Setup (Terminal Setup)
Enabling or Disabling the Remote High (STOP) Signal (Remote Stop)
Select whether to ignore (ON) the remote high (STOP) signal or not (OFF).
Trigger Output Signal (Trigger Out)
You can set the type of signal that is generated from the trigger output terminal to Normal or Pulse.
Trigger Output Signal Pulse Width (Pulse Width)
When you set the trigger output signal type to Pulse, you can set the pulse width to 1 ms, 50 ms, 100 ms,
or 500 ms.
Configuring the Display (Display Setup)
Menu Font Size (Menu Font Size)
You can set the font size of the menu to Small or Large.
Menu Background Color (Base Color)
You can set the background color of the menu to Blue or Gray.
Scale Value Display Font Size (Scale Font Size)
You can set the font size of the scale value display to small or large.
Items Whose Scale Values Are Displayed (Scale On Item)
Set the items that you want to display when Scale Value is set to ON.
• ALL: The vertical axis (V Scale) and horizontal axis (Time Scale) are displayed.
• Time Scale: Only the horizontal axis (Time Scale) is displayed.
20-8
IM DL850-01EN
20 Other Features
Turning the Level Indicator Display On and Off (Level Indicator)
You can choose whether to display the level indicator (ON), which shows the waveform levels, or not (OFF). The
level indicator appears on the right side of the waveform display window.
Intensity (Intensity)
You can set the intensities of the grid (Grid), cursor (Cursor), and marker (Marker) to values within the range of 1
to 8.
Key and Knob Setup (Key/Knob Setup)
Turning On or Off the Click Sound (Click Sound)
You can turn on or off the click sound that is generated when you operate the jog shuttle.
START/STOP Key Response Time (START/STOP Response Time)
You can set the response time of the START/STOP key to instant (Quick) or 1 s or more (> 1sec).
Key Lock (Key Protect)
You can lock the operation keys to prevent unintentional changes to the current state of the DL850/DL850V.
• Type (Type)
Select whether to lock all the keys (ALL) or to lock all keys except the START/STOP key (Except START/
STOP).
• Release Method (Release Type)
Select whether to release the key lock by pressing the KEY PROTECT key (Key) or by entering a password
(Password).
• Password (Password)
Specify the password to use to release the key lock. Specify the password using up to eight alphanumeric
characters. If you forget the password, you can release the key lock by turning the DL850/DL850V on while
holding down the RESET key. Note that all settings will be initialized when you do this.
Self-Test (Selftest)
You can test the keyboard and memory operations.
Test Type (Type)
You can perform the following tests.
Key Test (Key Board)
Tests whether the front-panel keys are operating properly. If the name of the key that you press is highlighted,
the key is operating properly.
Memory Test (Memory)
You can test the internal memory to determine whether it is functioning normally. If it is functioning normally, “Test
Completed” appears. If an error occurs, “Failed” appears.
SD Memory Card Test (SD CARD)
You can test an SD memory card to determine whether it is functioning normally. If it is functioning normally, “Test
Completed” appears. If an error occurs, “Failed” appears.
Hard Disk Test (HDD)
You can test an internal or external hard drive to determine whether it is functioning normally. If it is functioning
normally, “Test Completed” appears. If an error occurs, “Failed” appears.
Printer Test (Printer)
Tests whether the optional built-in printer is operating properly. If the print density is correct, the built-in printer is
operating properly. If an error occurs, the built-in printer does not print properly.
Update (Version Up)
Select this option to update the firmware. For details on updating firmware versions, contact your nearest
YOKOGAWA dealer.
IM DL850-01EN
20-9
20 Other Features
Executing a Test (Test Exec)
The selected self-test starts.
If an Error Occurs during a Self-Test
If an error occurs even after you carry out the following procedure, contact your nearest YOKOGAWA dealer.
• Execute the self-test again several times.
• Check whether the media being tested is properly inserted.
• Check that the paper is set properly in the built-in printer and that paper is not jammed.
Overview (Overview)
You can display the following information about the DL850/DL850V.
• Model
• Record Length
• Serial Number
• Product ID: Unique number assigned to each instrument. This number is necessary for the purchase of
additional options.
• Slot: Names of the inserted modules
• Options
• Default Language
• Firm Version: Firmware version number
• FPGA1/2 Version: FPGA1/2 version number
* The 70126, 701280, and 720240 modules have internal CPUs and firmware. For slots that have these
modules installed in them, the version number of the firmware installed on the module is also displayed.
• For the 701265
A.AA
Example: 701265
A.AA is the version of the firmware installed on the module.
• For the 701280 or 720240
Example: 701280
B.BB/C.CC
B.BB is the version of the firmware installed on the module. C.CC is the version of the firmware on the
DL850/DL850V that can be installed on the 701280 (FREQ). If the two above versions are the same,
only one version number will be displayed.
Key Lock (KEY PROTECT)
You can lock the operation keys to prevent unintentional changes to the current state of the DL850/DL850V.
When the keys are locked, pressing any keys other than KEY PROTECT has no effect, and the USB mouse and
keyboard cannot be used.
NUM LOCK
Press this key to use the CH1 to CH16 keys to enter numbers. After you press NUM LOCK, you can press a
channel key to enter the number, sign, unit prefix, or exponent displayed to the upper right of the key in white, or
to confirm an entry or selection (ENTER).
20-10
IM DL850-01EN
Appendix
Appendix 1
How to Calculate the Area of a Waveform
Integ1TY
Sum of only the positive curve areas : S1 + S2
S2
S1
Integ2TY
Sum of the positive and negative curve areas: S1 + S3 – S2
S1
S3
S2
Integ1XY
(1) Multiple Loops
Area S = n × S0
n: The number of loops
S0
Start point,
stop point
Waveform
(2) Non-Closed Curve
Area S = S0
Area enclosed by a curve
connecting the start and stop points
S0
Start point
Stop point
(3) Loop Tracing a Figure-Eight
S1
Area S = |S0 – S1|
S0
Start point
Stop point
(4) Loop Tracing a Spiral
S1
S0
Start point
Area S = S0 × 2 + S1
The number of overlaps varies
according to the number of loops.
Stop point
IM DL850-01EN
App-1
Appendix
Integ2XY
(1) When Each Y Data Point Corresponds to a Single X Data Point
(1)
Stop point
Start point
Area S = S0
S0
X-axis (Y = 0)
(2)
Start point
Stop point
Area S = –S0
S0
X-axis (Y = 0)
(3)
X-axis (Y = 0)
Area S = –S0
S0
Stop point
Start point
(4)
X-axis (Y = 0)
Area S = S0
S0
Start point
Stop point
(2) When the Waveform Extends into the Negative Side
Start point
S0
X-axis (Y = 0)
S1
Area S = S0 – S1
Stop point
(3) When Multiple Y Data Corresponds to One Point of X Data
Start point
Area S = S0
S0
Stop point
X-axis (Y = 0)
Start point
S0
S1
S2
App-2
Stop point
Area S = S0 + 2 × S1 + S2
X-axis (Y = 0)
IM DL850-01EN
Appendix
Appendix 2
User-Defined Computation (Optional)
Digital Filter
Type
Type
Gauss (Gaussian)
Sharp
IIR (Butterworth)
Bandwidth
LowPass
LowPass/HighPass/BandPass
LowPass/HighPass/BandPass
Filter Order
See the following table for the filter orders.
Gauss
Sharp
IIR
LowPass
LowPass
HighPass
LowPass
HighPass
2%
49
88
159
4
4
5%
21
36
65
4
4
10%
9
18
33
4
4
20%
5
9
17
3
4
30% (Cutoff)
5
8
13
2
3
Filter Characteristics
Filter
Gauss
Sharp
Pass-band
Ripple
0 dB
±0.3 dB
IIR
0 dB
*
Attenuation Slope
*
−40 dB at 1 oct (Lowpass),
−40 dB at −1 oct (Highpass)
−5 dB at 1/6 oct (Lowpass),
−20 dB at −1 oct (Highpass)
Attenuation at
the Stop-band
−
−40 dB
−
−
−
Phase
Linear phase
Linear phase
Linear phase
Non-linear
phase
For Gaussian filter: −3.0 × (f/fc)2 dB (f: frequency, fc: cutoff frequency)
Frequency Characteristics of Filters
f: Sampling frequency (Hz)
Gauss (10% cutoff)
Sharp (Low pass; 10% cutoff)
IIR (Low pass; 10% cutoff)
The higher the filter order the longer it takes for computation.
IM DL850-01EN
App-3
Appendix
Hilbert Function (HLBT)
Normally, when we analyze real-time signals, it is useful to think of these signals as the real part of functions of
complex variables, and to carry out the actual signal analysis using such functions.
If the real-time signal is considered to be the real part of the function, the imaginary part can be determined with
the Hilbert transform of the real part.
The Hilbert transform does not change the order of the individual variables. The Hilbert transform of a time signal
results in another time signal.
The Hilbert transform procedure is as follows.
When a time-domain signal is transformed, the signal is first transformed into the frequency domain through
Fourier transform. Next, the phase of each frequency component is shifted by −90 degrees if the frequency is
positive and +90 degrees if the frequency is negative. Lastly, taking the inverse Fourier transform completes the
Hilbert transform.
Example
•
The Hilbert transform can be used to analyze an envelope waveform.
AM (amplitude modulation): SQRT(C1 × C1 + HLBT(C1) × HLBT(C1))
Demodulation of an FM Signal: DIF(PH(C1, HLBT(C1)))
Phase Function (PH)
Phase function PH(X1, Y1) computes tan−1(X1/Y1).
The phase function takes the phase of the previous point into consideration and continues to sum even when the
value exceeds ±π (the ATAN function reflects at ±π).
The unit is radians.
Previous
point
θ2
θ1
Δθ2
θ1
Δθ2
θ2
θ2 = θ1 + Δθ2
App-4
Previous
point
θ2 = θ1 – Δθ2
IM DL850-01EN
Appendix
Differentiation and Integration (DIF, DDIF, INTG, and IINTG)
Differentiation (DIF, DDIF)
The computation of the first-order and second-order differentiated values uses the 5th order Lagrange
interpolation formula to derive a point of data from the five points of data before and after the target.
The figure below shows data f0 to fn with respect to sampling times x0 to xn. The derivative and integrated
values corresponding to these data points are computed as shown below.
f
f2
f1
f3
fn
fn-4
f4
fn-1
f0
fn-3
fn-2
fk
x0
•
x1
x2
x3
x4
xk
xn-4
xn-3
xn-2
xn-1
xn
Equations for First Order Derivatives
1 [–25f0 + 48f1 – 36f2 + 16f3 – 3f4]
Point x0 f0’ =
12h
1 [–3f0 – 10f1 + 18f2 – 6f3 + f4]
Point x1 f1’ =
12h
1
Point x2 f2’ =
[f0 – 8f1 + 8f3 – f4]
12h
1
Point xk fk’ =
[fk-2 – 8fk-1 + 8fk+1 – fk+2]
12h
1 [fn-4 – 8fn-3 + 8fn-1 – fn]
Point xn-2 fn-2’ =
12h
1 [–fn-4 + 6fn-3 – 18fn-2 + 10fn-1 + 3fn]
Point xn-1 fn-1’ =
12h
1
Point xn fn’ =
[3fn-4 – 16fn-3 + 36fn-2 – 48fn-1 + 25fn]
12h
h = Δx is the sampling interval (s) (example: h = 200 × 10–6 at 5 kHz)
•
Equations for Second Order Derivatives (DDIF)
1 [35f0 – 104f1 + 114f2 – 56f3 + 11f4]
Point x0 f0” =
12h2
1 [11f0 – 20f1 + 6f2 + 4f3 – f4]
Point x1 f1” =
12h2
1
Point x2 f2” =
[–f0 +16f1 – 30f2 + 16f3 – f4]
12h2
1
Point xk fk” =
[–fk-2 + 16fk-1 – 30fk + 16fk+1 – fk+2]
12h2
1 [–fn-4 + 16fn-3 – 30fn-2 + 16fn-1 – fn]
Point xn-2 fn-2” =
12h2
1 [–fn-4 + 4fn-3 + 6fn-2 – 20fn-1 + 11fn]
Point xn-1 fn-1” =
12h2
1
Point xn fn” =
[11fn-4 – 56fn-3 + 114n-2 – 104fn-1 + 35fn]
12h2
IM DL850-01EN
App-5
Appendix
Integration (INTG, IINTG)
The first and second order integrated values are derived using the trapezoidal rule.
• Equations for First Order Integration (INTG)
Point x0 I0 = 0
Point x1 I1
Point x2 I2
Point xn In
•
1
(f0 + f1)h
2
1
1
1
=
(f0 + f1)h +
(f1 + f2)h = I1 +
(fI + I2)h
2
2
2
1
= In-1 +
(fn-1 + fn)h
2
=
Equations for Second Order Integration (IINTG)
Point x0 II0 = 0
1
(I0 + I1)h
2
1
1
1
=
(I0 + I1)h +
(I1 + I2)h = II1 +
(II + I2)h
2
2
2
1
= IIn-1 +
(In-1 + In)h
2
Point x1 II1 =
Point x2 II2
Point xn IIn
Binary Conversion (BIN)
Binary conversion is performed through the use of the specified threshold levels.
BIN(C1)
Upper threshold level
Lower threshold level
1
0
App-6
IM DL850-01EN
Appendix
Pulse Width Computation
The signal is converted to binary values according to the preset threshold levels, and the time of the pulse width
is plotted as the Y-axis value for that interval.
You can set the interval to one of the four settings below.
PWHH
From a rising edge to the next rising edge.
PWHL
From a rising edge to the next falling edge.
From a falling edge to the next rising edge.
PWLH
PWLL
From a falling edge to the next falling edge.
PWXX
From a rising or falling edge to the next rising or falling edge.
FV
Inverse of PWHH
Example for PWHH
Upper
threshold
level
Lower
threshold
level
Waveform to
be computed
t1
Computed
result
t2
t3
t1
t2
t3
FFT Function - user-defined
Each frequency component G of a linear spectrum is represented by G = R + jI, where R is the real part and I is
the imaginary part.
Linear Spectrum
The linear spectrum can be directly determined with the FFT. Through this spectrum, the magnitude and phase
of each frequency component included in the measured waveform can be found. The power spectrum and cross
spectrum can also be determined from the linear spectrums of one or two signals.
Because the FFT is a complex function, the linear spectrum produces the real part and imaginary part of the
frequency components. The magnitude and phase of the linear spectrum can also be determined from this
result.
The DL850/DL850V can determine the following spectrums.
Item
Real part
Imaginary part
Magnitude
Log magnitude
Phase
Expression
LS-REAL
LS-IMAG
LS-MAG
Computation
R
I
LS-LOGMAG
20 × log
LS-PHASE
(R2+I2)
(R2+I2)
−1
tan (I/R)
Log magnitude reference (0 dB): 1 Vpeak
IM DL850-01EN
App-7
Appendix
Power Spectrum
The power spectrum expresses the power (squared value) of each frequency component included in the
measured signal. It is determined by taking the product of the linear spectrum and its complex conjugate. It does
not contain phase information.
The DL850/DL850V can determine the following spectrums.
Item
Magnitude
Expression
PS-MAG
Log magnitude
PS-LOGMAG
Computation
DC component
AC component
DC component
AC component
R2 + I2
(R2 + I2)/2
10 × log(R2 + I2)
10 × log{(R2 + I2)/2}
Log magnitude reference (0 dB): 1 Vrms2
Power Spectrum Density
The power spectrum density expresses the power spectrum per unit frequency. It is determined by dividing
the power spectrum by the frequency resolution Δf found during the analysis of the power spectrum. The
computation varies depending on the window function.
Power spectrum density is used to compare power spectrums analyzed at different frequency bands. However, it
is not necessary for signals having a line spectrum such as sine waves.
The DL850/DL850V can determine the following spectrums.
Item
Magnitude
Log magnitude
Expression
PSD-MAG
PSD-LOGMAG
Computation
PS-MAG/(Δf × k)
10 × logPS-MAG/(Δf × k)
Log magnitude reference (0 dB): 1 Vrms2
Overall Value
The overall value is the total RMS value determined from the frequency spectrum included in the signal. The
overall value is the square root of the summation of the power spectrums of all frequencies.
Overall value =
2 × PS0 + Σ PSi
(Vrms)
k
“Rms = overall value” appears on the screen when automated measurement of waveform parameters is being
performed (MEASURE is set to ON) on the channel that has been selected for power spectrum computation (PS
or PSD) and Rms is set to ON.
However, when Window is set to Exponential, overall values are not displayed.
k
k varies as indicated below depending on the selected time window.
Time Window Type
Rect (rectangular window)
Hanning (hanning window)
FlatTop (flattop window)
Hamming (hamming window)
App-8
k
1
1.5
3.19693
1.3628
IM DL850-01EN
Appendix
Cross Spectrum
The cross spectrum is determined from two signals. It is the product of the linear spectrum of one signal (Gy)
and the complex conjugate (Gx*) of the linear spectrum of the other signal (Gx).
If the linear spectrums of the two signals are represented by
Gx = Rx + jIx
Gy = Ry + jIy
then the cross spectrum Gyx is
Gyx = Gy × Gx*
= (Ry + jIy)(Rx − jIx) = Ryx + jIyx
where Ryx = RyRx + IyIx
Iyx = RxIy − RyIx
The DL850/DL850V can determine the following spectrums.
Item
Real part
Imaginary part
Magnitude
Log magnitude
Phase
Expression
CS-REAL
CS-IMAG
CS-MAG
Computation
Ryx/2
Iyx/2
CS-LOGMAG
10 × log (
CS-PHASE
(Ryx2+Iyx2)/2
(Ryx2+Iyx2)/2)
−1
tan (Iyx/Ryx)
Transfer Function
The transfer function expresses the frequency responses of the input to and the output from the transfer system.
The transfer function is determined by the ratio of the output linear spectrum (Gy) and the input spectrum (Gx)
at each frequency. Also, as can be seen from the following equation, the transfer function can be defined as the
ratio of the cross spectrum of the input and output (Gyx) and the input power spectrum (Gxx).
Transfer function = Gy/Gx = (Gy × Gx*)/(Gx × Gx*) = Gyx/Gxx
= (Ryx + jIyx)/(Rx2 + Ix2)
The DL850/DL850V can determine the following items.
Item
Real part
Imaginary part
Magnitude
Log magnitude
Phase
Expression
TF-REAL
TF-IMAG
TF-MAG
Computation
Ryx/(Rx2 + Ix2)
Iyx/(Rx2 + Ix2)
(Ryx2+Iyx2) /(Rx2 + Ix2)
TF-LOGMAG
20 × log
TF-PHASE
(Ryx2+Iyx2) /(Rx2 + Ix2)
−1
tan (Iyx/Ryx)
The magnitude of the transfer function shows the ratio of the magnitudes of the output linear spectrum and the
input linear spectrum while the phase shows the phase difference of the two.
Coherence Function
The coherence function expresses the ratio of the output power generated by the input signal to the transfer
system and the total output power.
Coherence function = Gyx × Gyx*/(Gxx × Gyy)
Item
Phase
Expression
CH-MAG
Computation
tan−1(Ryx2 + Iyx2)/(Gxx × Gyy)
If the output signal is due entirely to the input signal, the coherence function becomes 1. As the ratio decreases,
it falls below 1. Thus, the coherence function always takes on a value between 0 and 1.
On one data acquisition, the coherence function becomes 1 across all frequencies. Make sure to take the
frequency average of the computation.
IM DL850-01EN
App-9
Appendix
Time Windows
You can use a rectangular, Hanning, flattop, or exponential time window (you can only use an exponential time
window on models with the user-defined computation option).
The rectangular window is suited to transient signals, such as impulse waves, which attenuate completely
within the time window. The Hanning and flattop windows allow continuity of the signal by gradually attenuating
the parts of the signal located near the ends of the time window down to the 0 level. Hence, they are suited to
continuous signals. The Hanning window provides a higher frequency resolution compared to the flattop window.
However, the flattop window has a higher level of accuracy. When the waveform being analyzed is a continuous
signal, consider the above characteristics in selecting the proper window to be applied.
Time windows
Integral
Rectangular
T
Power spectrum
T
T
Hanning
T
Sine wave
t
T
Flattop
T
T
Hamming
T
Rectangular : W(t) = u(t) – u(t – T)
Hanning
Flattop
Hamming
u(t): Step function
: W(t) = 0.5 – 0.5 cos( 2π t )
T
sin{2π(1 – 2t/T)}
: W(t) = {0.54 – 0.46 cos( 2π t )}
2π(1 – 2t/T)
T
t
: W(t) = 0.54 – 0.46 cos( 2π )
T
The exponential window is used to eliminate noise components from the signal. It is suited for the signals of
impulse-excitation frequency-response tests and other similar signals. On the DL850/DL850V, the exponential
window and force window are activated simultaneously.
Exponential Window
The damping rate is set in terms of the weight of the last data point, with the weight of the first data point in the
specified number of FFT points taken to be 100% (= 1). You can set the damping rate in the range of 1 to 100%
(1% resolution). The exponential window damps the signal exponentially along the time axis. It is effective when
the signal does not attenuate fully within the record length. When the damping rate is set to 100%, the window
functions like a rectangular window.
Force Window
Set the area over which computation is performed in terms of a percentage from the first FFT point, taking the
set number of FFT points to be 100%. The areas (force 1 and force 2) can be set in the range of 1 to 100%
(1% resolution) of the input/output signal. When an area is set to 100%, the window functions like a rectangular
window. On the DL850/DL850V, the outer area is the average of the results of the window function for the data
outside the area.
Force1: This setting applies to the input signals of one-waveform and two-waveform FFTs.
Force2: This setting applies to the output (response) signal (second parameter) of a two-waveform FFT.
Exponential window
0
1
100%
Setting
(%)
Time
Force window
Weight
Weight
1
0
Setting (%)
Time
1 frame = 100%
App-10
IM DL850-01EN
Appendix
Combined Form of the Exponential and Force Windows
The DL850/DL850V uses a window function that combines the exponential window and force window to perform
computations. The outer area of the force window is the average of the results of the window function for the
data outside the area.
When the Force Window Area Is Set to 80% and the Data Outside the Area Is
Taken into Account
1
Damping rate: 1%
Damping rate: 20%
Damping rate: 50%
Damping rate: 90%
0.9
Weight
0.8
0.7
0.6
0.5
0.4
0.3
0.2
0.1
0
0
20
40
60
Record length (%)
•
80
100
The damping rate does not change for the the
outer area (80% to 100% of the record length).
Application Example on the DL850/DL850V
When the Damping Rate Is Set to 20% and Force 1 Is Set to 80%
2
Original data
Computed result
from the
exponential
window
Weight
1.5
Computed result
from the
exponential and
force windows
1
0.5
0
0
20
40
60
Record length (%)
80
100
The outer area (80% to 100% of the record length) is the average
of the results of the window function for the data outside the
area with no change to the damping rate.
Notes about Executing FFT Computation
Computation is normally performed on the sampled data in the acquisition memory. However, for waveforms
that have been acquired in envelope mode, computation is performed on the maximum and minimum values per
acquisition interval.
IM DL850-01EN
App-11
Appendix
Appendix 3
Fundamental Equations for Defining Strain
Definition of Strain
ΔL/L = ε ...............................................(1)
ε: Strain
L: Initial length of the material
ΔL: Amount of change due to external strain
Definition of the Gauge Factor
Gauge factor (K) refers to the ratio between the mechanical strain and the change in the resistance of the strain
gauge resistor.
ΔL
ΔR/R
........................(2)
ε=
=
L
K
(ΔR/R) = K × ε ............................(3)
R: Gauge resistance
ΔR: Amount of change in resistance when strain is applied
Normally, K = 2.0. However, the value varies depending on the strain gauge material.
General Equation for the Measured Voltage (V) and Strain (ε) of a Wheatstone Bridge (1
Gauge Method)
If we assume V to be the voltage measured on the bridge and E to be the voltage applied to the bridge,
V = (1/4) × E × (ΔR/R) ........................(4)
From equation (3),
(ΔR/R) = K × ε
Thus, V = (1/4) × E × K × ε .................(5)
When Determining the Strain (e) from the Measured Voltage (V) (Using a Strain Gauge and the 1 Gauge
Method)
If we derive e from equation (5)
ε = (4/K) × (V/E) ...........................(6)
When Determining the Measured Value of the Strain Gauge Sensor (e) from the Voltage Measured on the
Bridge (V) (Strain Gauge Sensor)
Assuming e to be the measured value (measured value of the strain gauge sensor: mV/V unit) and
substituting ε = e in equation (6),
e = (4/K) × (V/E) ...........................(7)
In the case of a strain gauge sensor, set the gauge factor (K) to 2 on the DL850/DL850V. If you change the value
of K, the values are converted through the use of the above equation.
App-12
IM DL850-01EN
Appendix
Appendix 4
Shunt Calibration of the Strain Module
In shunt calibration, the strain measurement gain is adjusted through the connection of a known resistance (the
resistance for shunt calibration, hereinafter referred to as the shunt resistance) in parallel to the strain gauge.
The strain module (701271 (STRAIN_DSUB)) supports shunt calibration with a built-in shunt-calibration relay
circuit.
To perform shunt calibration, you need a bridgehead that supports shunt calibration (701957 or 701958).
Bridgehead 701957/701958
(with shunt calibration support)
Bridge-
Sense+
R
Shuntcal+
Shuntcal-
Input+
Input-
Input+
InputR
GND
terminal
Bridge+ Bridge+
R
Shunt resistor
Sense+
BridgeSense-
SenseShuntcal+
Shuntcal-
Twist
Bridge+
BridgeInput+
Twist
InputSense+
Sense-
Twist
Suntcal+
SuntcalFloating Common
Twist
Shell
Floating
Common
Case
B8023WP
9
6
8
7
5
2
4
3
1
Shield
The shield is connected to
the bridgehead case and the
The connector shell is
measuring instrument case.2
connected to the case
potential of the bridgehead.2
The floating common of the
module is grounded within the
bridgehead.1
Measurement instrument
(example: DL850)
1 The GND (floating common) of the module
is connected to the case potential inside the
bridge box.
2 The bridgehead case, the cable shield, and
the measuring instrument case are
connected as measures against noise.
Sense+
Sense-
+
-
9
6
8
7
5
2
4
3
1
Module
Bridge
Power
+
-
701271
STRAIN_DSUB
AD
Sense+
Sense-
Shuntcal+
Shuntcal
on/off
Shuntcal-
Shell
Floating
Common
All module
signals
are isolated.
Case
The connector shell is connected to the
case potential of the measuring
instrument. 2
• When correcting the gain on the negative side (normal)
Shunt calibration relay circuit
(Built into the strain module.
Turns on and off
automatically when shunt
calibration is executed.)
Shunt resistor
(connected to the bridgehead)
Bridge+
120 Ω
In+
In120 Ω
120 Ω
Bridge
voltage
Bridge-
IM DL850-01EN
App-13
Appendix
• When correcting the gain on the positive side
Shunt calibration relay circuit
(Built into the strain module.
Turns on and off
automatically when shunt
calibration is executed.)
Shunt resistor, when
correcting the positive side
Bridge+
120 Ω
In+
In-
120 Ω
120 Ω
Bridge
voltage
Bridge-
Shunt Calibration Procedure
1. Calculate the strain value (μSTR) that corresponds to the shunt resistor you will use. For the calculation
procedure, see “Calculating the Shunt Resistance” in the next section.
2. Execute balancing without applying a load to the strain gauge, and correct the zero point.
3. Execute shunt calibration, and correct the gain.
To execute shunt calibration, in the CH menu, select Linear Scale, Mode, and then Shunt. Usually, the
negative gain is corrected. However, if you are correcting the positive gain, change the position of the shunt
resistor as shown in the above figure.
• Balance
Strain
Before execution
After execution
Strain input
The zero point is corrected
when balancing is executed.
• Shunt calibration
After execution.
The gain is corrected.
Strain
Before execution
Current measured
value*
Strain input
P2:X
P2:Y
In the setup menu, set the strain value
corresponding to the shunt resistor to P2:Y.
* Obtained automatically when shunt calibration is performed
App-14
IM DL850-01EN
Appendix
Shunt Calibration Execution Menu
The shunt calibration execution menu appears when you select Linear Scale, Mode, and then Shunt in the CH
menu. In normal shunt calibration, only P2:Y is set. On the DL850/DL850V, in addition to performing normal
shunt calibration (when the shunt-calibration relay circuit is on), you can also set the zero-point value when the
relay circuit is off. The zero-point value is valid when the strain value after balancing is performed is not 0.
Items in the Execution Menu
(1) P1[X]: When shunt calibration is executed, the input value when the relay circuit is off is applied.
(2) P1[Y]: Set the value for when the relay circuit is off (normally 0).
(3) P2[X]: When shunt calibration is executed, the input value when the relay circuit is on is applied.
(4) P2[Y]: Set the strain value that corresponds to the shunt resistance when the relay circuit is on.
• When you execute shunt calibration, select an appropriate range so that the measured values will stay
within the range when the shunt-calibration relay circuit is on. The DL850/DL850V attempts to perform
shunt calibration within the current range.
• An error message will appear if shunt calibration fails (because of out-of-range values or some other
reason). When this happens, change the range, and perform shunt calibration again.
• Do not connect and disconnect multiple USB devices repetitively. Provide a 10-second interval between
removal and connection.
Reducing Noise
Because measurements are made at the mV level, the strain gauge is extremely susceptible to noise. If the
execution of balancing or shunt calibration fails, it may be due to noise. Please take the following points into
consideration.
• Because the strain gauge is attached away from the bridgehead, we recommend that you use twisted wire for
extensions.
• Use a bridgehead with high noise resistance. We recommended that you use a YOKOGAWA bridgehead
(701957 or 701958); they are highly resistant to noise.
IM DL850-01EN
App-15
Appendix
Calculation of the Shunt Resistance
To execute shunt calibration, you need to calculate the shunt resistance (Rs) and the expected strain (ε) in
advance. For “P2-Y,” use ε as given in the equation below (normally a negative value).
In the general method given for shunt calibration (the easy method), an error of 1 to 2% is introduced as the
strain value (ε) increases. Therefore, use the detailed method whenever possible.
Equation for Rs and ε When Shunt Calibration Is Executed
General Equation (Easy method)
ΔR/R = K × ε..................(1): Fundamental strain equation
ΔR = R − R//Rs*................(2): Equation for the change in resistance when the shunt resistance is on
* In this manual, the equation for parallel resistances is expressed as follows:
R//Rs =
1
R
1
+
1
Rs
=
R × Rs
R + Rs
If ΔR from (1) and (2) is cancelled out,
Rs = R × (1 – K × ε)/(K × ε)
Equation A: General equation for calculating the shunt
resistance (includes error)
ε:
Strain (strain value that you want to be generated
when the shunt resistance is turned on)
K: Gauge factor
R: Bridge resistance
ΔR: Resistance change
Rs: Shunt resistance (shunt resistance you want to derive)
App-16
IM DL850-01EN
Appendix
Detailed Equation
V0 = E × (R1 × R3 – R2 × R4)/{(R1 + R2) × (R3 + R4)}
.......................(1): Basic equation for a Wheatstone bridge
When shunt calibration is on,
V0 = E × (R1 × R3 – R’ × R4)/{(R1 + R’) × (R3 + R4)}
.......................(2): Equation when shunt calibration is on
R’ = R2//Rs ....................(3): Equation for combined resistance R’
R1 = R2 = R3 = R4 = R......(4): Since R1 to R4 are equal, they are represented as R.
Also, from the basic equation of strain,
V0/E = K × ε/4..................(5): Basic equation of strain
If V0/E and R1 to R4 from (2), (3), (4), and (5) are cancelled out,
Rs = R × (1 – K × ε/2)/(K × ε)
E:
V0:
R1 to R4:
Rs:
R’:
Bridge voltage
Bridge output voltage
Bridge resistance (R1 = R2 = R3 = R4)
Shunt resistance (shunt resistance you want to derive)
Combined resistance when the relay is turned on (R’ = R//Rs)
R4
R1
V0
R2
Equation B:
Detailed equation for calculating the
shunt resistance (no error)
E (bridge power supply)
R3
Rs
IM DL850-01EN
App-17
Appendix
Calculation Example
When Determining the Shunt Resistance (Rs) from the Strain (ε)
Given a gauge factor (K) of 2,
Detailed equation (equation B) Rs = R × (1 − ε)/(2 × ε).........................(6)
General equation (equation A) Rs = R × (1 − 2 × ε)/(2 × ε)...................(7) Degree of error of 1 to 2%
Desired Strain Rs Value (Ω) Derived from
the Detailed Equation (6)
ε (μSTR)
R = 120 Ω
R = 350 Ω
1,000
59,940
174,825
2,000
29,940
87,325
5,000
11,940
34,825
10,000
5,940
17,325
Rs Value (Ω) Derived from
the General Equation (7)
R = 120 Ω
R = 350 Ω
59,880
174,650
29,880
87,150
11,880
34,650
5,880
17,150
When Determining the Strain (ε) from the Shunt Resistance (Rs)
If we derive ε from equations (6) and (7),
Detailed equation (equation B) ε = 1/(1 + 2 × Rs/R)..............................(8)
General equation (equation A) ε = 1/{2 × (1 + Rs/R)}............................(9) Degree of error of 1 to 2%
•
When the Bridge Resistance R is 120 Ω
RS Value (Ω)
60,000
30,000
12,000
6,000
•
Strain ε (μSTR) Derived from
the General Equation (9)
998
1,992
4,950
9,804
When the Bridge Resistance R is 350 Ω
RS Value (Ω)
180,000
90,000
36,000
18,000
App-18
Strain ε (μSTR) Derived from
the Detailed Equation (8)
999
1,996
4,975
9,901
Strain ε (μSTR) Derived from
the Detailed Equation (8)
971
1,941
4,838
9,629
Strain ε (μSTR) Derived from
the General Equation (9)
970
1,937
4,814
9,537
IM DL850-01EN
Appendix
Appendix 5
Measurement Principle of the Frequency Module
Measurement Principle (Measurement Method and Update Rate) of the Frequency
Module
The measurement principle of the period, frequency, pulse width, and duty cycle on the frequency module (701280
(FREQ)) is described below.
Period and Frequency Measurement
The frequency module updates the waveform at a rate of 25 kHz (40 μs interval). The measurement method
differs for frequencies above 25 kHz and below 25 kHz as described below.
• When the input signal is less than or equal to 25 kHz, measurement is made as described in (1).
• When the input signal is greater than or equal to 25 kHz, measurement is made as described in (2).
• The sequence of processing described below is performed simultaneously through pipeline processing. Thus,
the period (t) and frequency (f) are updated every 40 μs.
(1) When the input signal is less than or equal to 25 kHz
The module measures the time of occurrence of the pulse edge (T1) in measurement interval A.
The module measures the time of occurrence of the pulse edge (T2) in measurement interval B.
The module calculates the period (t) in measurement interval C. t = T2 − T1
The frequency (f) is calculated as 1/period (t).
When the period of the input pulse spans over multiple measurement intervals, computation is performed in
the measurement interval following the interval in which the edge is detected.
A
Measurement
interval: 40 μs
B
C
40 μs
40 μs
Period (t)
Time: T2
Time: T1
Input pulse
Period (t) = T2 – T1
Frequency (f) = 1/period (t)
(2) When the input signal is greater than or equal to 25 kHz
The module measures the time of occurrence of the last pulse edge (Te1) in measurement interval A.
The module measures the time of occurrence of the last pulse edge (Te2) in measurement interval B.
The module measures the number of pulses between the last pulse edge in measurement interval A and the
last pulse edge in measurement interval B.
The module calculates the period (t) in measurement interval C. t = Te2 − Te1/number of pulses
The period (t) calculated is the average value of multiple pulses.
The frequency (f) is calculated as 1/period (t).
If the input pulse period is short, the DL850/DL850V automatically takes the average of multiple pulses and
calculates the period and frequency. Therefore, the resolution does not degrade even when the input pulse
period is short, and highly accurate measurement is possible.
A
Measurement
interval: 40 μs
B
C
40 μs
40 μs
Number of pulses: 3
Time: Te1
Time: Te2
Input pulse
Period (t) = (Te2 – Te1)/3
Frequency (f) = 1/period (t)
IM DL850-01EN
App-19
Appendix
Pulse Width and Duty Cycle Measurement
• When the input signal is less than or equal to 25 kHz, measurement is made as described in (1).
• When the input signal is greater than or equal to 25 kHz, measurement is made according to the last
waveforms in the measurement intervals as described in (2).
• The sequence of processing described below is performed simultaneously through pipeline processing. Thus,
the period (t) and frequency (f) are updated every 40 μs.
(1) When the input signal is less than or equal to 25 kHz
The module measures the times of occurrence of the pulse edges (T1, T2, and T3) in measurement intervals
A and B.
In measurement interval C:
For the pulse width: The module calculates the pulse width as T2 − T1.
For the duty cycle: The module calculates the duty cycle as (T2 − T1)/(T3 − T1).
A
Measurement
interval: 40 μs
B
C
40 μs
40 μs
Pulse width
Time: T2 Time: T3
Time: T1
Input pulse
Pulse width = T2 – T1
Duty = (T2 – T1)/(T3 – T1)
(2) When the input signal is greater than or equal to 25 kHz
The DL850/DL850V measures the times of occurrence of the last pulse edges (T1, T2, and T3) in
measurement interval A.
In measurement interval B:
For the pulse width: The module calculates the pulse width as T2 − T1.
For the duty cycle: The module calculates the duty cycle as (T2 − T1)/(T3 − T1).
A
Measurement
interval: 40 μs
B
40 μs
Pulse
width
T1 T2 T3
Input pulse
Pulse width = T2 – T1
Duty = (T2 – T1)/(T3 – T1)
App-20
IM DL850-01EN
Appendix
Computation Format (Resolution) of the Frequency Module
The computation flow on the frequency module is indicated below.
Offset
Internally, all
calculations are
performed using
floating-point values.
Input
32-bit
counter
A
(Float)
50 ns resolution
Binary→Float
Floating
-point
computation
Computations
Frequency
Period
...
Range value
Value/Div
Floating
point data
÷
2400 LSB/div
2400 LSB
/div
ACQ
E
Memory
(Binary)
1 LSB weight
C
(float)
–
Computation
(floating point)
D
(Float)
÷
Float→16bit Binary
The frequency module measures the period of the input signal using a 32-bit counter at a resolution of 50 ns.
Therefore, the minimum resolution of the counter values is 50 ns.
Computations are performed in floating point format. The data that is output from the frequency module and
written to the acquisition memory (ACQ Memory) is 16-bit binary data. The frequency module converts the data
using a weight of 1 LSB that is determined by Value/div. The data is normalized to 2400 LSB/div when displayed
on the screen.
Input: Conversion from 32-bit Counter Values to Floating Point Values
The frequency module converts the count value that it obtains using the 32-bit counter at 50 ns resolution to
floating point format, and determines period A using the following equation.
Period: A (Float) = (Count value) × 50 ns
Computation
Various computations are performed in floating point format based on the settings.
Example
Frequency: C (float) = 1/A (float)
Calculation of the 1 LSB Weight of the Output
The 1 LSB weight of the output is determined from the range (value/div).
Because 1 div = 2400 LSB,
1 LSB weight of the output = (Value/div)/2400
Computation Output: Conversion from Floating Point Values to 16-bit Binary Values (When the Offset Is 0)
When the offset value is 0, offset calculation is not performed, and C (float) = D (float).
The data is converted into 16-bit binary data and written to the acquisition memory (ACQ Memory).
16-bit binary data: E (binary) = D (float) ÷ (1 LSB weight of the output)
Offset Computation
When the offset value is not 0, the frequency module computes the offset value in floating point format using the
following equation and then converts the value to 16-bit binary data.
D (float) = C (float) − offset value (float)
In offset computation, if the computed result C (float) is equal to the offset value, the output is 0. If the computed
result C (float) is less than the offset value, E (binary) is negative.
IM DL850-01EN
App-21
Appendix
Filter Characteristics (Time Delay) of the Smoothing Filter
The smoothing filter is a moving average filter in which computation is performed in real time. The computation
interval for moving averages is 40 μs (25 kHz). It is constant independent of the sampling rate of the DL850/
DL850V.
The moving average order (the number of averaged points) is specified in terms of time. The maximum value is
25000 points (when the time is set to 1000 ms).
The characteristics of the smoothing filter are as follows:
• The filter is a low-pass filter.
• The pass band is flat.
• The filter has linear phase characteristics. The group delay is constant for a given filter order.
The group delay can be derived through the following equation.
Group delay = (the number of averaged points − 1) × 40 μs/2
• The filter has comb-shaped bandwidth characteristics.
The figure below shows the result of applying the smoothing filter to a waveform that changes in steps. The
smoothing filter setup time follows the step change.
Smoothing filter setup time
Waveform before the
smoothing
filter is applied
App-22
Waveform after the
smoothing filter is
applied
IM DL850-01EN
Appendix
Appendix 6
List of Preset Settings of the Frequency Module
Logic 5V
Setup Item
V Range
Coupling
Probe
Bandwidth
Threshold
Hys
Slope
Chattering Suppression
Pull Up
Setting
±10 V
DC
Yes1
Yes2
2.5 V
Yes3
Yes4
Yes5
No
Logic 3V
Setup Item
V Range
Coupling
Probe
Bandwidth
Threshold
Hys
Slope
Chattering Suppression
Pull Up
Setting
±5 V (Probe = 1:1)
±10 V (Probe = 10:1)
DC
Yes1
Yes2
1.5 V
Yes3
Yes4
Yes5
No
Logic 12V
Setup Item
V Range
Coupling
Probe
Bandwidth
Threshold
Hys
Slope
Chattering Suppression
Pull Up
Setting
±20 V
DC
Yes1
Yes2
6V
Yes3
Yes4
Yes5
No
Logic 24V
Setup Item
V Range
Coupling
Probe
Bandwidth
Threshold
Hys
Slope
Chattering Suppression
Pull Up
IM DL850-01EN
Setting
±50 V
DC
Yes1
Yes2
12 V
Yes3
Yes4
Yes5
No
App-23
Appendix
Pull-up 5V
Setup Item
V Range
Coupling
Probe
Bandwidth
Threshold
Hys
Slope
Chattering Suppression
Pull Up
Setting
±10 V
DC
1:1
Yes2
2.5 V
Yes3
Yes4
Yes5
Yes6
ZeroCross
Setup Item
V Range
Coupling
Probe
Bandwidth
Threshold
Hys
Slope
Chattering Suppression
Pull Up
Setting
Yes7
AC
Yes1
Yes2
0V
Yes3
Rising
Yes5
No
AC100V
Setup Item
V Range
Coupling
Probe
Bandwidth
Threshold
Hys
Slope
Chattering Suppression
Pull Up
Setting
±200 V
AC
10:1
Yes2 (Full cannot be
selected)
0V
Yes3
Rising
Yes5
No
AC200V
Setup Item
V Range
Coupling
Probe
Bandwidth
Threshold
Hys
Slope
Chattering Suppression
Pull Up
Setting
±500 V
AC
10:1
Yes2 (Full cannot be
selected)
0V
Yes3
Rising
Yes5
No
EM Pickup
Setup Item
V Range
Coupling
Probe
Bandwidth
Threshold
Hys
Slope
Chattering Suppression
Pull Up
App-24
Setting
±1 V
DC
1:1
Yes2
0V
Yes3
Rising
Yes5
No
IM DL850-01EN
Appendix
User
Setup Item
V Range
Coupling
Probe
Bandwidth
Threshold
Hys
Slope
Chattering Suppression
Pull Up
Setting
Yes7
Yes8
Yes1
Yes2
Yes9
Yes3
Yes4
Yes5
No
When you select a preset, the setup items are automatically set to the values in the table. The meaning of Yes
and No in the table is as follows:
Yes: The setting can be configured.
No: The setting cannot be configured (it does not appear on the menu).
1 Set the probe type to 1:1 or 10:1.
2 Set the bandwidth limit to 100 Hz, 1 kHz, 10 kHz, 100 kHz, or Full. You cannot select full for AC100V or
AC200V.
3 Set the hysteresis to ±1%, ±2.5%, or ±5%.
4 Set the slope to rising or falling.
5 Set the chattering elimination value to a value from 0 ms to 1000 ms.
6 Enable or disable the pull-up. This setting is only available for Pull-up 5V.
7 Voltage ranges:
When probe = 1:1, select ±1 V, ±2 V, ±5 V, ±10 V, ±20 V, or ±50 V.
When probe = 10:1, select ±10 V, ±20 V, ±50 V, ±100 V, ±200 V, or ±500 V.
8 Set the coupling to DC or AC.
9 Set the threshold level to a value within the specified voltage range.
IM DL850-01EN
App-25
Appendix
Appendix 7
TCP and UDP Port Numbers
The TCP and UDP port numbers that are used on the Ethernet interface of the DL850/DL850V are listed below.
TCP Port Numbers
Port Number
20
Description
File Transfer [Default Data]
21
File Transfer [Control]
25
80
515
1001
Simple Mail Transfer Protocol
World Wide Web HTT
−
−
Used For
FTP server, FTP client,* and a portion of the
Web server
FTP server, FTP client, and a portion of the
Web server
SMTP client
Web server and WebDAV server
LPR client
Instrument control through the Ethernet
interface
UDP Port Numbers
Port Number
67
68
123
Description
Bootstrap Protocol Server
Bootstrap Protocol Client
Network Time Protocol
Used For
DHCP client
(listen port)
SNTP client
* The port number when FTP passive mode is disabled. When FTP passive mode is enabled, you can set any
port number. When FTP passive mode is disabled, connections are established from the server. If you are
connecting the DL850/DL850V from behind a firewall, enable FTP passive mode.
App-26
IM DL850-01EN
Index
Symbols
Page
1-cycle mode ...................................................................... 10-6
16-CH module, notes about using ........................................ 1-8
16-CH module sampling timing ............................................ 1-8
A
Page
A -> B(N) trigger ................................................................... 4-8
ACCEL coupling setting ........................................................ 2-7
acceleration measurement ................................................. 2-26
AC coupling setting............................................................... 2-6
accumulation ........................................................................ 6-5
acquisition mode................................................................... 5-2
action .................................................................................. 14-1
A Delay B trigger................................................................... 4-9
all channels, configuring ..................................................... 2-43
all sub channels, setting ..................................................... 2-18
AND trigger ......................................................................... 4-12
angle cursors ........................................................................ 9-6
area, calculation of ........................................................... App-1
automated measurement of waveform parameters ............ 10-1
auto naming ........................................................................ 18-2
auto scroll ............................................................................. 8-3
auto setup ........................................................................... 20-1
averaging (computation) ...................................................... 11-7
averaging mode .................................................................... 5-3
AX + B linear scaling setting............................................... 2-13
B
Page
background color ................................................................ 20-8
balancing ............................................................................ 2-22
bandwidth ............................................................................. 2-8
basic arithmetic.................................................................... 11-2
bias ..................................................................................... 2-26
binary .................................................................................. 20-8
binary conversion ................................................................ 11-2
bit data display order .......................................................... 20-8
bit mapping ......................................................................... 2-36
bit rate (CAN)...................................................................... 2-38
box average mode ................................................................ 5-2
bridge voltage ..................................................................... 2-22
burnout ............................................................................... 2-20
C
Page
calibration ........................................................................... 20-2
CAN bus signal monitoring ................................................. 2-38
captured-waveform display number ..................................... 5-8
chattering ............................................................................ 2-34
clear trace ........................................................................... 20-2
click sound .......................................................................... 20-9
coherence function ........................................................... App-9
combine display .................................................................... 7-2
comment ............................................................................. 18-3
communication interfaces, types of .................................... 20-3
computation ......................................................................... 11-1
constants ............................................................................. 11-6
copy .................................................................................... 2-43
cross spectrum ................................................................. App-9
current-to-voltage conversion ratio ....................................... 2-7
cursor measurement............................................................. 9-1
cursor types (FFT waveforms).............................................. 9-9
cursor types (T-Y waveforms)............................................... 9-1
IM DL850-01EN
cursor types (X-Y waveforms) .............................................. 9-7
cycle averaging.................................................................... 11-8
cycle frequency................................................................... 4-16
cyclic statistical processing................................................. 10-8
D
Page
data, loading ....................................................................... 18-7
data, saving ........................................................................ 18-2
data frames, reading........................................................... 2-38
data type ............................................................................. 18-3
data type (CAN) .................................................................. 2-40
date and time settings ........................................................ 20-5
DC coupling setting .............................................................. 2-6
deceleration ........................................................................ 2-32
default settings ................................................................... 20-1
definition file (CAN)............................................................. 2-41
delay between channels ..................................................... 10-4
differentiation .................................................................... App-5
digital filter ........................................................................ App-3
display, configuring ............................................................. 20-8
display color.......................................................................... 6-3
display format ....................................................................... 6-2
display group ........................................................................ 6-3
display mode (history) ........................................................ 16-2
display pattern ...................................................................... 6-1
distal ................................................................................... 10-5
distance .............................................................................. 2-31
dot display ............................................................................ 3-2
dual capture .......................................................................... 5-7
duty ratio ............................................................................. 2-29
E
Page
Edge On A trigger ............................................................... 4-10
edge search ........................................................................ 15-2
electromagnetic pickup ....................................................... 2-33
enhanced .............................................................................. 4-8
envelope mode ..................................................................... 5-2
environment settings .......................................................... 20-8
Ethernet communication ..................................................... 19-1
event display......................................................................... 5-9
event search ....................................................................... 15-4
expression ........................................................................... 11-4
external clock........................................................................ 3-1
extra window......................................................................... 6-2
F
Page
FFT ..................................................................................... 12-1
FFT function ..................................................................... App-7
FFT points, number of ........................................................ 12-1
FFT settings......................................................................... 11-9
file division ............................................................................ 5-4
file list.................................................................................. 18-8
file name ............................................................................. 18-2
file operations ..................................................................... 18-8
file protection ...................................................................... 18-8
files, copying ....................................................................... 18-8
filter settings ........................................................................ 11-9
font size .............................................................................. 20-8
force window................................................................... App-10
format (dual capture) ............................................................ 5-9
frequency measurement ..................................................... 2-28
frequency module measurement principle...................... App-19
Index-1
Index
FTP server .......................................................................... 19-3
full-screen waveform display ................................................ 6-6
functions .............................................................................. 11-5
FV setting ........................................................................... 2-28
G
Page
gain ..................................................................................... 2-27
gauge factor........................................................................ 2-22
GND coupling setting............................................................ 2-6
GO/NO-GO ......................................................................... 13-1
grid........................................................................................ 6-2
H
Page
hard disk recording ............................................................... 5-4
hard disk test ...................................................................... 20-9
hexadecimal ....................................................................... 20-8
Hilbert function.................................................................. App-4
history ................................................................................. 16-1
history waveforms, list of .................................................... 16-3
history waveforms, statistical processing of ..................... 10-10
history waveform search..................................................... 16-4
horizontal and vertical cursors (T-Y waveforms) .................. 9-4
horizontal and vertical cursors (X-Y waveforms) .................. 9-8
horizontal axis....................................................................... 3-1
horizontal cursors (T-Y waveforms) ...................................... 9-1
horizontal cursors (X-Y waveforms) ..................................... 9-7
horizontal scale................................................................... 12-3
hysteresis ........................................................................... 2-34
I
Page
input coupling ....................................................................... 2-6
input coupling (16-CH module) ........................................... 2-16
instant start ........................................................................... 4-1
integration ......................................................................... App-5
intensity .............................................................................. 20-9
internal clock......................................................................... 3-1
interpolation method (T-Y waveforms).................................. 6-4
interpolation method (X-Y window)....................................... 7-2
inverted waveform display .................................................. 2-12
IRIG .................................................................................... 20-6
J
Page
judgment conditions................................................... 13-2, 13-4
K
Page
marker cursors (X-Y waveforms) .......................................... 9-8
measurement items ............................................................ 10-1
measurement resolution ....................................................... 2-4
memory test ........................................................................ 20-9
menu area display, switching................................................ 6-6
mesial ................................................................................. 10-5
message format (CAN) ....................................................... 2-39
N
Page
network drive ...................................................................... 19-6
network printer .................................................................... 19-6
numeric monitor .................................................................... 6-6
NUM LOCK....................................................................... 20-10
O
Page
OFF coupling setting ............................................................ 2-7
offset .................................................................................... 2-11
one-shot output................................................................... 2-41
operators .................................................................... 11-1, 11-5
OR trigger ............................................................................ 4-11
over limit ............................................................................. 2-31
overview ........................................................................... 20-10
P
Page
P1-P2 linear scaling setting ................................................ 2-13
peak computation ................................................................ 11-9
peak cursors ....................................................................... 9-10
pen marker ........................................................................... 7-1
period.................................................................................. 2-29
Period trigger ...................................................................... 4-13
phase function .................................................................. App-4
phase shift ........................................................................... 11-3
port numbers .................................................................. App-26
power on, action performed at ............................................ 20-8
power spectrum ....................................................... 11-3, App-8
power supply frequency...................................................... 2-29
printer test........................................................................... 20-9
probe attenuation.................................................................. 2-7
proximal .............................................................................. 10-5
pull up ................................................................................. 2-35
pulse averaging .................................................................. 2-32
pulse integration ................................................................. 2-29
pulse width.......................................................................... 2-29
pulse width computation ................................................... App-7
Pulse Width trigger ............................................................. 4-14
key lock.................................................................... 20-9, 20-10
R
L
read order ........................................................................... 20-8
recall ................................................................................... 20-2
record length......................................................................... 5-1
reference cycles ................................................................. 4-16
reference junction compensation........................................ 2-20
remote control..................................................................... 20-3
resynchronization jump width ............................................. 2-38
RMS measurement............................................................. 2-15
roll mode display................................................................... 3-3
Page
labels .................................................................................... 2-2
language ............................................................................. 20-6
LCD, adjusting .................................................................... 20-6
level indicator........................................................................ 6-4
linear scaling....................................................................... 2-13
listen only (CAN)................................................................. 2-38
logic display format ............................................................. 20-8
logic measurement ............................................................. 2-36
logic pattern search ............................................................ 15-4
M
Page
MAG knob............................................................................. 8-2
mail ..................................................................................... 19-5
main window, display ratio of ................................................ 8-2
manual event ........................................................................ 6-6
manual trigger....................................................................... 4-2
marker cursors (FFT waveforms) ......................................... 9-9
marker cursors (T-Y waveforms) .......................................... 9-4
Index-2
S
Page
Page
sample point (CAN) ............................................................ 2-38
sample rate ........................................................................... 3-3
samples, number of (CAN) ................................................. 2-38
sampling, timing.................................................................... 3-1
SCALE knob ......................................................................... 2-3
scale value............................................................................ 6-3
scaling mode ....................................................................... 11-4
screen captures, printing .................................................... 17-1
IM DL850-01EN
Index
screen captures, saving...................................................... 17-2
search ................................................................................. 15-1
self-test ............................................................................... 20-9
sensitivity ............................................................................ 2-27
sensor, setting .................................................................... 2-22
settings, initializing.............................................................. 20-1
setup data, loading ............................................................. 18-7
setup data, saving .............................................................. 18-6
setup data, storing and recalling......................................... 20-2
shunt calibration .................................................... 2-24, App-13
simple trigger ........................................................................ 4-3
smoothing ........................................................................... 2-31
snapshot ............................................................................. 20-2
SNTP .................................................................................. 19-7
spectrum type ..................................................................... 12-3
START/STOP ..................................................................... 5-10
start point ............................................................................ 12-1
statistical processing .......................................................... 10-7
stop prediction .................................................................... 2-32
storage media ..................................................................... 18-1
storage media, formatting ................................................... 20-6
store.................................................................................... 20-2
strain, fundamental equations for defining...................... App-12
strain balancing .................................................................. 2-22
strain measurement ............................................................ 2-21
sync channel....................................................................... 4-16
system configuration........................................................... 20-5
T
Page
T-Y waveform display window .............................................. 6-1
TC coupling setting ............................................................... 2-6
TCP/IP ................................................................................ 19-2
TCP and UDP port numbers ........................................... App-26
temperature measurement ................................................. 2-19
temperature unit ................................................................. 2-20
terminal setup ..................................................................... 20-8
terminator (CAN) ................................................................ 2-39
thermocouple type .............................................................. 2-19
time axis setting .................................................................... 3-1
time base .............................................................................. 5-5
time reference point .............................................................. 4-6
time search ......................................................................... 15-5
time synchronization feature............................................... 20-6
time unit .............................................................................. 2-31
trace label ............................................................................. 6-3
trademarks................................................................................. i
transfer function ................................................................ App-9
trigger delay .......................................................................... 4-7
trigger hold-off ...................................................................... 4-5
trigger hysteresis .................................................................. 4-5
trigger level ........................................................................... 4-4
trigger mode ......................................................................... 4-1
trigger position ...................................................................... 4-6
trigger slope .......................................................................... 4-4
trigger source........................................................................ 4-3
trigger types .......................................................................... 4-2
U
version update .................................................................... 20-9
vertical axis ........................................................................... 2-1
vertical cursors (T-Y waveforms) .......................................... 9-2
vertical cursors (X-Y waveforms).......................................... 9-7
vertical position ..................................................................... 2-5
vertical POSITION knob ....................................................... 2-5
vertical scale ................................................................ 2-3, 12-2
voltage measurement ........................................................... 2-2
voltage measurement (16-CH module) .............................. 2-16
voltage scale......................................................................... 2-3
W
Page
waveform acquisition ............................................................ 5-1
waveform area .................................................................. App-1
waveform arrangement......................................................... 6-3
waveform data, loading ...................................................... 18-7
waveform data, saving........................................................ 18-2
waveform display .................................................................. 2-2
waveform display (16-CH module) ..................................... 2-16
waveform display data point removal (T-Y waveforms) ........ 6-5
waveform display data point removal (X-Y waveforms) ....... 7-2
waveform parameters (GO/NO-GO)................................... 13-4
waveform parameter search ............................................... 16-5
waveforms, searching......................................................... 15-1
waveforms, zooming............................................................. 8-1
waveform zone (GO/NO-GO) ............................................. 13-1
Wave Window trigger ......................................................... 4-15
web server .......................................................................... 19-4
window function .................................................................. 12-2
window layout (dual capture) ................................................ 5-9
window layout (FFT window) .............................................. 12-3
window layout (X-Y window)................................................. 7-2
window layout (zoom window) .............................................. 8-2
window types ........................................................................ 6-1
X
Page
X-Y window........................................................................... 7-1
Z
Page
zero cross ........................................................................... 2-33
zone search ........................................................................ 16-4
zoom factor ........................................................................... 8-2
zoom link .............................................................................. 8-2
zoom method (vertical) ......................................................... 2-9
zoom POSITION knob .......................................................... 8-2
zoom window ........................................................................ 8-1
Page
USB communication ........................................................... 20-7
USB keyboard language..................................................... 20-6
user-defined computation .................................................... 11-4
V
Page
variables .............................................................................. 11-4
velocity................................................................................ 2-30
IM DL850-01EN
Index-3