1
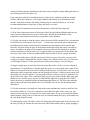
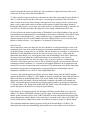
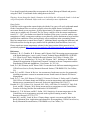
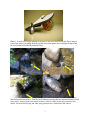
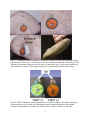
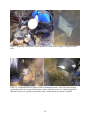
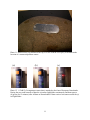
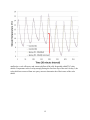
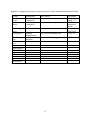
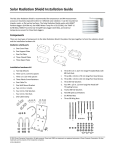
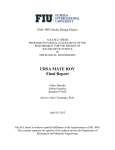
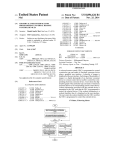
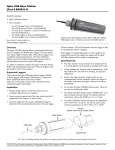
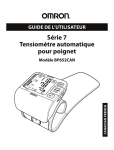
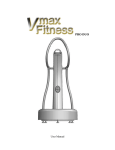
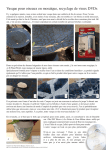
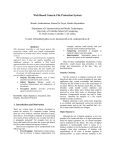
A Simple Method Using Underwater Epoxy to Permanently Install
Temperature Sensors in Mountain Streams
(Version 3.5; updated 9/9/14)
Dan Isaak ([email protected]), Dona Horan ([email protected]), and Sherry Wollrab
U.S. Forest Service, Rocky Mountain Research Station
Air, Water, and Aquatics Program – Boise Aquatic Sciences Lab
322 E. Front St., Suite 401
Boise, ID 83702
The Need for Annual Stream Temperature Data
Thermal regimes are fundamental to understanding aquatic ecology, given the ectothermic
physiologies of most aquatic organisms. Moreover, significant departures from historical
conditions are underway in response to a warming climate (Isaak et al. 2010; Kaushal et al. 2010;
Rieman and Isaak, In Press). Although considerable amounts of stream temperature data are now
routinely collected using inexpensive digital temperature sensors, most of these data are
collected during summer when temperatures are warmest and access to mountain streams is
easiest. This provides a narrow view of thermal regimes in streams and misses ecologically
relevant information about the date of spring onset, growing season length, overall variability,
and total annual thermal units.
Collection of annual stream temperature data has traditionally required labor intensive
instrumentation of permanent sites that often require steel cables or other obtrusive structures in
streams and instrument loss rates are often high. These difficulties limit deployments of sensors
for annual temperature data, despite the need for this information and potentially lower
maintenance costs (i.e., site visits) once a permanent site is established. Ideally, a method for
installing permanent temperature sensors would require minimal effort and materials, be largely
foolproof, and provide durable installations that can withstand large annual floods in mountain
streams. Moreover, it would be desirable if installations were relatively innocuous so that the
sensors were not stolen or otherwise vandalized during lengthy deployments. Here, we describe a
protocol that fulfills these requirements by using underwater epoxies to directly attach
temperature sensors to large boulders in mountain streams.
Necessary Equipment
After a series of laboratory and field trials that tested several underwater epoxies (AquaMend®
from Polymeric Systems Inc.; AquaStik® from DuPont, Waterweld from J-B Weld Company,
Mr. Sticky’s® Underwater Glue from Advanced Adhesion Inc., and HIT-RE 500 from Hilti), a
1
product manufactured by Fox Industries (see Appendix A for equipment list1) was selected for
use in this protocol. In addition to adhesive properties that were far superior to the other test
products, the putty-like consistency of the Fox epoxy makes it easy to use and attachments to
rocks have proven secure when initiated under a range of temperatures (5˚C - 20˚C). Numerous
temperature sensors are commercially available, but we used the TidbiT v2 Temperature Data
Logger (Appendix A) because of its compact size, large memory and battery life (up to 5 years),
a waterproof, durable casing, and because the sensors may be downloaded in situ using an
underwater data shuttle. The TidbiT v2 has an orange faceplate, in contrast to the older TidbiT
v1, which has a yellow faceplate and is not compatible with the data shuttle.
Other materials needed for underwater epoxy installations are listed in Appendix A and include:
(1) rubber gloves (to avoid skin contact with epoxy), (2) a wire brush to clean the rock surface
prior to sensor attachment, (3) a plastic box to view the sensor underwater and ensure a good
placement, and (4) metal forestry tree tags to monument the rock to which a sensor is attached
(Photo 1). For enhanced visibility, we paint a small circle on the rock using high-performance
industrial grade paint (RUST-OLEUM). A GPS, digital camera, and datasheet (Appendix B) are
needed to geo-reference and photo archive the sites where sensors are deployed.
Before installing temperature sensors in streams, calibrate the sensors in a common temperature
environment as described in Dunham et al. (2005) and discard sensors with anomalous readings.
The sensors should be outfitted with a shield so that direct solar radiation does not bias the
temperatures readings. We have had good success using a small neoprene flap (3mm thick)
attached to the top of the sensor with plastic cable ties (Photo 2). A small weight attached to the
front of the flap ensures that it hangs over the sensor to improve shading and helps to prevent
turbulent flow from lifting the flap (Photo 3). Neoprene shields are inexpensive, durable, flexible
to allow access for underwater downloads, and periphyton quickly grows on the neoprene to
camouflage the sensor.
Sensor Installation
Considerations regarding sampling designs, or where sensor sites are established across the area
of interest, are beyond the scope of this protocol and are covered elsewhere (Dunham et al. 2007;
Isaak et al. 2009; http://www.fs.fed.us/rm/boise/AWAE/projects/stream_temperature.shtml).
Here, we assume the user has already developed a sampling design to meet their needs and
concern ourselves only with sensor deployment at an individual site.
Once at the site, search for a large rock or boulder (charismatic megaboulders are best) that will
be immobile during large floods and is easy for others to identify on subsequent site visits.
Finding a good rock is the most important step to a successful sensor installation. The best rocks
are large enough that they often protrude a foot or more above the low flow water surface and
wide enough that they can effectively shield the sensor from moving rocks or debris during
floods (the sensor will be attached to the downstream side). Ideal site characteristics downstream
of large rocks are pockets of relatively calm water with smaller substrate sizes (Photo 4). If large
rocks and cobbles are on the downstream side, similarly large substrates are likely to move there
again during the next flood and could dislodge the sensor. Finally, the rock should provide a
1
Mention of trade names does not imply endorsement by the U.S. Forest Service.
2
relatively flat downstream attachment surface that is deep enough to remain submerged and in or
near flowing water for the entire year.
Large substrates suitable for attachment may be relatively rare within low-gradient, meadow
reaches, and in these instances, seek steeper channels immediately up or downstream of the
meadow. Immobile structures like bridge footings may be considered, however, we do not
recommend attachment to large logs, as they may decay over time.
Once the specific attachment site has been determined, perform the following steps:
(1) If an Onset temperature sensor is being used, check for the blinking light that indicates the
sensor has been launched and is ready to collect data. Record the serial number of the
temperature sensor and the metal forestry tag number on the datasheet.
(2) Use the wire brush to clean the surface where the sensor will be attached. Pick a location that
is well below the water surface, but at least 2 – 3 inches above the stream bed to minimize the
possibility that the sensor will be buried. If an underwater data shuttle will be used for data
retrievals, at least 8 inches of space in the downstream direction from the sensor is needed for
access. In addition, the angle of the mounted sensor must allow for the shuttle to be attached
without interference of the stream bed. It is suggested that you experiment with the shuttle and
the sensor in the office so that you understand the angle needed to ensure a proper download.
(3) Put on the rubber gloves and grab equal parts of the Fox epoxy (one white, one grey) after
wetting your fingers. Manipulate the two parts together for 1 minute until the epoxy is a consistent
color throughout (Photo 5). If the epoxy becomes tacky while mixing, re-wet your fingers.
(4) Apply enough epoxy to the back of the sensor that the surface can be covered to a depth of
approximately 1/8 inch (Photo 6). Initially apply the epoxy as a curved glob in the center of the
sensor so it can mold to the rock surface when pressed into place. Use the plastic view box to see
underwater while you push the sensor onto the cleaned rock surface. Gently twist the sensor back
and forth to set it in place (Photo 7). Do not push too firmly or the epoxy may be pushed too far
up the sides of the sensor. This could either block access to the sensor with the underwater data
shuttle or leave too little epoxy in place to establish firm adhesion. If using the Onset TidbiT,
ensure the sensor is mounted with the tab pointing upright (Photo 8). This allows the indicator
lights on the underwater data shuttle to be seen so that the success of a data download can be
determined.
(5) Use the underwater viewing box to inspect the sensor attachment to ensure a good fit to the
rock surface (Photo 9). If excessive amounts of epoxy block the sides of the sensor, use your
fingers to trim away the excess and use less epoxy in the future. If you are not satisfied with the
sensor location, slowly remove it from the rock, rework and reshape the epoxy, and reattach it to
the rock in the desired location.
(6) Although the sensor will adhere to the rock during the initial application, it takes 24 hours for
the epoxy to fully set. Ensure the sensor does not slide off the anchor point by gently propping a
3
small rock against the front of it (Photo 10). Do not attempt to support the sensor with a rock
from below or it may loosen the initial adhesion.
(7) Glue a metal forestry tag to the top or downstream side of the rock using the epoxy (Photos 4
and 11). Glue the tag directly above the sensor (or pointing at it) and above the water line to
make it easier to locate the sensor during a subsequent site visit. Lastly, you may wish to spray
paint a circle or other mark on the rock that provides greater visibility from longer distances.
Remember that it may be one or more years until the site is revisited (and it may be someone else
who retrieves the data) and unless the right rock can be found, valuable data will be lost.
(8) Geo-reference the sensor location using a GPS and take several digital photos of the specific
rock attachment site and immediate surroundings to aid in future relocations. Record the location
of the sensor on the datasheet (e.g., sensor attached to grey, rectangular boulder 1 meter in
diameter along the left side of the channel) and create a digital archive of your field notes and
photos for future reference. See Appendix C for summary of these steps.
Data Retrieval
Once temperature sensors are deployed, the sites should be revisited periodically to retrieve the
temperature data. One of the major advantages of permanent installations is that site visits can
occur infrequently, perhaps once a year initially and less thereafter as confidence is gained in the
durability of a site installation. Data can be retrieved in one of two ways—either using the
underwater data shuttle, or by removing the sensor and downloading it in the office. Removing
the sensor is the best option once sufficient data have been collected at a site, whereas
underwater downloads are best when electing to leave a sensor in place for continued data
collection. Collecting at least two years of data is desirable in many cases because the effects of
contrasting climatic conditions (i.e., seasonal or inter annual differences in air temperature and
stream flow) on stream temperature may be measured. This information is useful for doing longterm historical temperature reconstructions or projections based on relationships with air
temperatures (Mohseni et al. 1999; D. Isaak, unpublished data).
To retrieve data with the underwater shuttle, press the shuttle firmly onto the TidbiT and then
squeeze the black lever (Photo 12). If the shuttle is properly engaged, the amber light will start to
blink as the data are downloading (Photo 12a). If you cannot see the light, hold a metal mirror
underwater next to the shuttle. After the download is complete, the shuttle will relaunch the
TidbiT with a blank memory using the same logging interval, and the green light will blink for
15 minutes (Photo 12b). Remove the shuttle from the TidbiT at any time during this 15-minute
period and squeeze the black lever to stop the green blinking.
If the shuttle is not engaged properly, the red light will blink when the black lever is pressed
(Photo 12c). Remove the shuttle, reattach it, and try again. If the data download still does not
initiate, gently clean the surface of the TidbiT and check to ensure that debris does not preclude
proper engagement with the shuttle. If too much epoxy is present on the sides of the TidbiT, the
excess may need to be chipped away with a screwdriver to ensure a proper fit with the shuttle.
The underwater shuttle has memory capacity sufficient for downloading 63 TidbiTs. The
instructions for underwater downloading, presented herein, are not meant to be all-inclusive.
4
Users should consult the manual that accompanies the Onset Waterproof Shuttle and practice
using the TidbiT v2 and shuttle before taking them to the field.
Warning: do not change the shuttle’s batteries in the field as this will stop the shuttle’s clock and
will prevent further downloads. Refer to the user’s manual for more information.
Data Quality
Field trial results suggest that sensors deployed with the Fox epoxy will easily withstand annual
floods if attachment sites on rocks are properly selected to shield sensors from bedload
movement. Based on our experience, it takes approximately 20 minutes to install a temperature
sensor once a suitable rock is located. The Fox epoxy worked well in the stream temperatures
tested (5°C – 20°C), but further tests should be conducted if the epoxy is used in warmer water
temperatures. Finally, temperature readings are not biased by direct attachment to large boulders
(possible heat conduction effect) and accurately reflect conditions in the surrounding stream
based on comparisons to control data (Graph 1). Additional details regarding the laboratory and
field trials used to develop the epoxy method will be published (Isaak and Horan, In review).
Please consult our stream temperature website for the latest version of this protocol as it is
periodically updated (http://www.fs.fed.us/rm/boise/AWAE/projects/stream_temperature.shtml).
References
Dunham, J. B., G. Chandler, B. E. Rieman, and D. Martin. 2005. Measuring stream temperature
with digital dataloggers: a user’s guide. General Technical Report RMRSGTR-150WWW.
U.S. Forest Service, Rocky Mountain Research Station, Fort Collins, Colorado, USA.
Dunham, J.B., A.E. Rosenberger, C.H. Luce, B.E. Rieman. 2007. Influences of Wildfire and
Channel Reorganization on Spatial and Temporal Variation in Stream Temperature and the
Distribution of Fish and Amphibians. Ecosystems: 10: 335-346.
Isaak, D.J., B.E. Rieman, and D. Horan. 2009. A watershed-scale bull trout monitoring protocol.
USDA Forest Service, Rocky Mountain Research Station, GTR-RMRS-224, Fort Collins,
CO.
Isaak, D.J., and D.L. Horan. In Review. An assessment of underwater epoxies for permanently
installing temperature sensors in mountain streams. North American Journal of Fisheries
Management.
Isaak, D.J., C. Luce, B.E. Rieman, D. Nagel, E. Peterson, D. Horan, S. Parkes, and G. Chandler.
2010. Effects of climate change and wildfires on stream temperatures and salmonid thermal
habitats across a mountain river network. Ecological Applications 20:1350-1371.
Kaushal, S.S., G.E. Likens, N.A. Jaworski, M.L. Pace, A.M. Sides, D. Seekell, K.T. Belt, D.H.
Secor, and R.L. Wingate. 2010. Rising stream and river temperatures in the United States.
Frontiers in Ecology and the Environment doi:10.1890/090037.
Mohseni, O., T.R. Erickson, and H.G. Stefan. 1999. Sensitivity of stream temperatures in the
United States to air temperatures projected under a global warming scenario. Water
Resources Research 35:3723-3733.
Rieman, B.E., and D.J. Isaak. In Press. Climate change, aquatic ecosystems and fishes in the
Rocky Mountain West: implications and alternatives for management. USDA Forest Service,
Rocky Mountain Research Station, GTR-RMRS-xxx, Fort Collins, CO.
5
Photo 1. Equipment needed to permanently install temperature sensors in streams using
underwater epoxy includes: (a) FX-764 from Fox Industries, (b) underwater data shuttle (if data
are to be retrieved in situ), (c) metal forestry tree tag, (d) temperature sensors, (e) wire brush, (f)
rubber gloves, and (g) plastic viewing box.
Photo 2. TidbiT thermograph with a neoprene flap attached as a solar radiation shield. Plastic
cable ties are used to firmly attach the neoprene to the TidbiT. This solar shield is inexpensive,
durable, and flexible to permit data downloads with the underwater shuttle. Periphyton quickly
grows on the neoprene to camouflage the sensor.
6
Photo 3. A small lead weight attached to the front of the solar shield causes the flap to hang in
front of the sensor (providing the best possible protection against direct sunlight) and prevents
the shield from being lifted by turbulent flows.
Photo 4. Examples of boulders that provided good attachment sites because of their large size
and flat downstream surfaces. Note the small substrate particles that are deposited behind several
of the rocks. Arrows point to the sensor location, which is visible by the grey neoprene solar
shield. The metal forestry tag and white spray paint are also visible above the sensors.
7
Photo 5. Preparing the Fox epoxy for use involves extracting equal amounts of each component
and mixing together for one minute until the color is uniform throughout. Fingers should be
wetted before and during handling the epoxy to minimize messiness.
Photo 6. Fox epoxy applied to the back of a temperature sensor ready for deployment. Enough
epoxy should be applied that it can cover the surface of the sensor to a depth of approximately
1/8 inch.
8
Photo 7. Temperature sensor attached to rock surface with the Fox epoxy in a laboratory setting.
Once the epoxy fully sets in ~24 hours, the sensors are firmly attached to the rock surface. Lower
left panel demonstrates applying too much epoxy to attach the sensor, which would prohibit use
of the underwater shuttle. Lower right panel shows a 5 pound rock held aloft by the sensor.
Photo 8. TidbiT temperature sensors manufactured by Onset Computer. The tab must point up
when mounted on a rock surface to facilitate data retrieval with an underwater data shuttle.
Underwater downloads are possible only with the newer, TidbiT v2 shown on the right.
9
Photo 9. Inspecting a temperature sensor attached to a rock surface using a viewing box in the
field.
Photo 10. Temperature sensors glued to rocks in mountain streams. Notice the rocks propped
against the front of the sensors to hold them in place while the epoxy sets. Smaller prop rocks
than those shown are typically used because only a small amount of pressure is needed.
10
Photo 11. Metal forestry tag attached to the top of a rock with the Fox epoxy to monument the
location of a stream temperature sensor.
(a)
(b)
(c)
Photo 12. A TidbiT v2 temperature sensor that is attached to the Onset Waterproof data shuttle.
During the successful transfer of data the (a) amber light blinks continuously and then turns to
(b) green (for 15 minutes) after all data are downloaded. If data retrieval was unsuccessful the (c)
red light blinks.
11
Graph 1. Stream temperatures measured during an eight day July field trial using sensors
attached to a rock with epoxy and sensors adjacent to the rock suspended within PVC solar
shields. Temperature traces overlap strongly during the first four days of the trial. On day 5, the
solar shield was removed from one epoxy sensor to determine the effectiveness of the solar
shield.
12
Appendix A. Equipment necessary for epoxy protocol to collect annual stream temperature data1.
Product
Temperature
sensor
Underwater
shuttle
Manufacturer
Onset Computer
Corporation
Onset Computer
Corporation
Web Address
http://www.onsetcomp.com
Underwater
epoxy
Viewing box
Fox Industries
http://www.foxind.com
Hoffman
Manufacturing
Forestry
Suppliers
http://www.hoffmanmfg.com
Part number
UTBI-001
TidbiT v2
U-DTW-1
Waterproof
Shuttle
FX-764 Splash
Zone Epoxy
CONT79C
http://www.forestry-suppliers.com
79142
Metal forestry
tags
Lead weights,
¼ oz
Neoprene, 3mm
Rubber gloves
Wire brush
Zip ties, 4”
GPS
Camera
Datasheet
Metal mirror
1
http://www.onsetcomp.com
Mention of trade names does not imply endorsement by the U.S. Forest Service.
13
Appendix B. Sample datasheet for recording relevant information associated with the
deployment of annual stream temperature sensors.
Page 1:
Page 2:
14
Appendix C. Quick Start Guide for Installing Onset Sensor
15