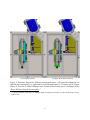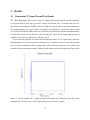
1
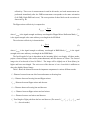
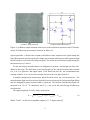
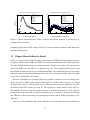
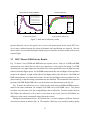
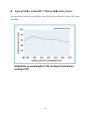
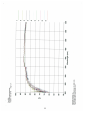
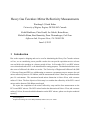
Real Mirror - ECI Testing Sample %Reflectivity
Real Mirror Reflectivity - ECI Testing Sample Reflectivity
10
Center Real Mirror Reflectivity - ECI testing sample #5 Reflectivity
Corner Real Mirror Reflectivity - ECI Testing Sample #7 Reflectivity
Left Real Mirror Reflectivity - ECI Testing Sample #4 Reflectivity
5
0
-5
-10
200
210
220
230
Wavelength (nm)
240
250
Figure 8: The difference between the witness samples and real measurement reflectivity results.
control, and these measurements are attached in App. C.
Witness sample reflectivity curves #4, #5 and #7 were chosen to compare with the measured
reflectivity curves at positions Left, Center and Corner between 200-250nm wavelength. The
mirror testing positions of #4 and Left, #5 and Center, #7 and Corner are similar. The sample
reflectivity curves were subtracted from the measured reflectivity curve and the difference is plotted
in Fig. 8. The ECI sample results have significant jitter. The estimated error below 230nm is 1%
and above 230nm is 0.5%. The error bar in Fig. 8 is calculated by
δDif f erence
q
2
2
= δECI
+ δM
easurement
(4)
where δECI is the ECI sample result error and δM easurement is the measurement error. For most of
the points, the difference is between 0-3%, which means the measured percentage reflectivity is
higher than the witness sample reflectivity. At the corner, the differences are slightly below 0, but 0
is still within the error bar. In the ECI witness sample results there is a sharp peak at 205nm which
does not exist in our measurement. Despite the peak, we can confirm the ECI sample testing result
represents the performance of the product and success of the reflectivity measurement setup.
14