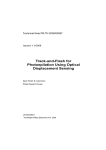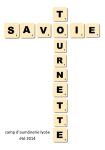
1
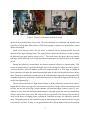
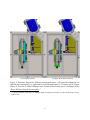
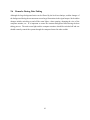
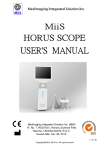
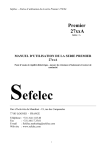
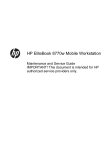
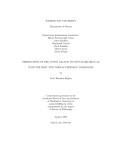
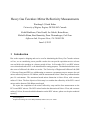
(a) Witness sample placement
(b) Mirror Measurement Position
Figure 4: (a) Witness sample locations with respect to the main mirror position in the ECI aluminzation. (b) Reflectivity measurement locations on Mirror #8.
signal registration. A shorter time constant would allow a faster response to the signal change but
larger fluctuation in signal strength, and a longer time constant would register stable signal strength
but take longer to react to the any change in signal. The preferred time constant settings during the
measurement were 1s and 3s.
For the data taking, monochromator was configured to perform a wavelength scan from 190400nm at 5nm steps. The dwell time at each wavelength was 20s, and the associated time constant
was 1s or 3s to generate a flat signal output. If the dwell time was 60s, the recommended time
constant would be 3s or 10s (the time constant does not need to be larger than 10s).
A baseline (background) measurement should be taken before any real measurement. The
monochromator light was diverted away from the detector so that only the background light falling
into the chopping frequency window could be registered. The baseline (background) signal was
measured to be 1.6×10⁻⁵ V consistently, and Rof f set was set for this value during all reflectivity
measurements.
The signal magnitude R can be can be calculated as
R=
q
(x + xof f set )2 + (y + yof f set )2 + Rof f set
Where X and Y are the lock-in amplifier outputs in X, Y display mode[3].
9
(3)