1
REJ10J0753-0100Z
M3T-KD38
User's Manual
Emulator Debugger for 740 Family Starter-Kit
Rev.1.00
Nov. 16, 2004
Active X, Microsoft, MS-DOS, Visual Basic, Visual C++, Windows and Windows NT are either registered trademarks or trademarks of Microsoft
Corporation in the United States and other countries.
IBM and AT are registered trademarks of International Business Machines Corporation.
Intel and Pentium are registered trademarks of Intel Corporation.
i386, i486, and MMX are trademarks of Intel Corporation.
Adobe and Acrobat are registered trademarks of Adobe Systems Incorporated.
All other brand and product names are trademarks, registered trademarks or service marks of their respective holders.
Keep safety first in your circuit designs!
z Renesas Technology Corporation and Renesas Solutions Corporation put the maximum effort into making semiconductor products better and
more reliable, but there is always the possibility that trouble may occur with them. Trouble with semiconductors may lead to personal injury,
fire or property damage. Remember to give due consideration to safety when making your circuit designs, with appropriate measures such as
(i) placement of substitutive, auxiliary circuits, (ii) use of nonflammable material or (iii) prevention against any malfunction or mishap.
Notes regarding these materials
z These materials are intended as a reference to assist our customers in the selection of the Renesas Technology product best suited to the
customer's application; they do not convey any license under any intellectual property rights, or any other rights, belonging to Renesas
Technology Corporation, Renesas Solutions Corporation or a third party.
z Renesas Technology Corporation and Renesas Solutions Corporation assume no responsibility for any damage, or infringement of any thirdparty's rights, originating in the use of any product data, diagrams, charts, programs, algorithms, or circuit application examples contained in
these materials.
z All information contained in these materials, including product data, diagrams, charts, programs and algorithms represents information on
products at the time of publication of these materials, and are subject to change by Renesas Technology Corporation and Renesas Solutions
Corporation without notice due to product improvements or other reasons. It is therefore recommended that customers contact Renesas
Technology Corporation, Renesas Solutions Corporation or an authorized Renesas Technology product distributor for the latest product
information before purchasing a product listed herein. The information described here may contain technical inaccuracies or typographical
errors. Renesas Technology Corporation and Renesas Solutions Corporation assume no responsibility for any damage, liability, or other loss
rising from these inaccuracies or errors. Please also pay attention to information published by Renesas Technology Corporation and Renesas
Solutions Corporation by various means, including the Renesas home page (http://www.renesas.com).
z When using any or all of the information contained in these materials, including product data, diagrams, charts, programs, and algorithms,
please be sure to evaluate all information as a total system before making a final decision on the applicability of the information and products.
Renesas Technology Corporation and Renesas Solutions Corporation assume no responsibility for any damage, liability or other loss
resulting from the information contained herein.
z Renesas Technology semiconductors are not designed or manufactured for use in a device or system that is used under circumstances in
which human life is potentially at stake. Please contact Renesas Technology Corporation, Renesas Solutions Corporation or an authorized
Renesas Technology product distributor when considering the use of a product contained herein for any specific purposes, such as apparatus
or systems for transportation, vehicular, medical, aerospace, nuclear, or undersea repeater use.
z The prior written approval of Renesas Technology Corporation and Renesas Solutions Corporation is necessary to reprint or reproduce in
whole or in part these materials.
z If these products or technologies are subject to the Japanese export control restrictions, they must be exported under a license from the
Japanese government and cannot be imported into a country other than the approved destination. Any diversion or reexport contrary to the
export control laws and regulations of Japan and/or the country of destination is prohibited.
z Please contact Renesas Technology Corporation or Renesas Solutions Corporation for further details on these materials or the products
contained therein.
For inquiries about the contents of this document or product, fill in the text file the installer generates in the following directory and email to your
local distributor.
\SUPPORT\KD38\SUPPORT.TXT
Renesas Tools Homepage http://www.renesas.com/en/tools
In this User’s Manual, the emulator debuggers "M3T-KD38" is represented as "KD38".
Please replace it with the corresponding one, when you read it.
Preface
KD38 is an emulator debugger for Starter-Kit of 740 Family. It controls emulator from Windows
on a PC, and it helps debugging of application programs and target system.
The basic information is written in User's Manual, that is necessary to understand how to use
KD38. For details, please refer to the online help included in product package.
Rights to the Program
The right to use the program is granted according to provisions under a software license
agreement.
The program can only be used for the purpose of product development by the user, and cannot be
used for any other purpose.
Note also that the information in this manual does not convey any guarantee or license for the use
of software.
[MEMO]
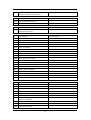
Contents
Contents
Setup
1.
1
Starting the Debugger
3
1.1 Features of KD38 ...................................................................................................... 3
1.3 Before starting the Debugger ................................................................................... 4
1.4 Starting the Debugger .............................................................................................. 5
2.
Setup Debugger
6
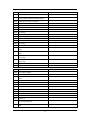
2.1 MCU Tab.................................................................................................................... 7
2.2 Run Mode Tab ........................................................................................................... 8
2.3 Resume Tab ............................................................................................................... 9
2.4 Method of making MCU file ................................................................................... 10
3.
Environmental Setting of Debugger
11
3.1 ShortcutKey Tab ..................................................................................................... 12
3.2 Download Tab.......................................................................................................... 14
3.3 Font Tab................................................................................................................... 15
3.4 Path Tab................................................................................................................... 16
3.5 Tool Entry Tab......................................................................................................... 17
3.6 Other Tab................................................................................................................. 19
3.7 Customizing of Toolbar ........................................................................................... 21
4.
Ending the Debugger
23
i
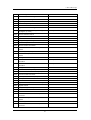
Reference
1.
25
Windows / Dialogs
27
1.1 KD38 Window.......................................................................................................... 28
1.2 Program Window..................................................................................................... 32
1.3 Source Window ........................................................................................................ 38
1.4 Register Window ..................................................................................................... 39
1.5 Memory Window...................................................................................................... 40
1.6 Dump Window ......................................................................................................... 42
1.7 RAM Monitor Window ............................................................................................ 44
1.8 ASM Watch Window ............................................................................................... 46
1.9 C Watch Window ..................................................................................................... 48
1.10 Local Window ........................................................................................................ 50
1.11 File Local Window ................................................................................................. 52
1.12 Global Window ...................................................................................................... 54
1.13 Script Window ....................................................................................................... 56
1.14 GUI Input Window................................................................................................ 58
1.15 GUI Output Window ............................................................................................. 59
1.16 S/W Break Point Setting Dialog Box.................................................................... 61
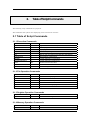
2.
Table of Script Commands
62
2.1 Table of Script Commands...................................................................................... 62
2.2 Table of Script Commands (alphabetical order).................................................... 65
3.
Error Messages
67
ii
Contents
[MEMO]
iii
Setup
1
2
1. Starting the Debugger
1.
Starting the Debugger
1.1 Features of KD38
The KD38 have the following functions.
1.1.1 RAM Monitor Function
Refer to 1-Kbyte RAM monitor area for KD38. (which cannot be divided into smaller areas).
When change of the contents of a memory is referred to, the real-time nature of target program
execution is spoiled.
1.1.2 Break Functions
z
Software Break
This function causes the target program to stop immediately before executing the instruction
at a specified address. Up to 2 breakpoints can be set. If multiple breakpoints are set, the
program breaks at one of the breakpoints that is reached.
1.1.3 GUI Input/Output Function
This function simulates the user target system's key input panel (buttons) and output panel on a
window. Buttons can be used for the input panel, and labels (strings) and LEDs can be used for the
output panel.
3
1.2 Before starting the Debugger
Before you can start the Debugger, the following tasks must be completed.
1.2.1 Communication method by emulator
The supported communication methods vary with the type of emulator used.
1.2.1.1 USB Interface
KD38 support only USB Interface.
z
The supported Operating System is Windows Me/98/2000/XP. The USB communication cannot
be used in any other OS.
z
Compliant with USB Standard 1.1.
z
Connections via USB hub are not supported.
z
By connecting the host computer and the emulator with USB cable, it is possible to install the
supported device drivers using a wizard (The KD38 that supports USB connections must be
installed before this installation can be performed). See “1.2.3.1 USB communication” for
details.
z
The necessary cable is included with the emulator.
1.2.2 Download of Firmware
When the firmware program, that is corresponding to the mcu that is specified by the mcu file, is
different from the one that is downloaded in the target, KDxx notices you to download it.
If the mcu file you specified is correct, download it by pressing OK button.
4
1. Starting the Debugger
1.2.3 Setting before emulator starts
1.2.3.1 USB communication
Windows’ Plug & Play function detects the connection of USB devices. The device driver needed for the
connected USB device is automatically installed.
<<Install of USB device driver>>
Windows’ Plug & Play function detects the connection of USB devices. The installation wizard for USB
device drivers start after the device had been detected. The following shows the procedure for
installing the USB device drivers.
1.
2.
Connect the host computer and the emulator with USB cable.
The dialog box shown below appears.
Go on following the wizard and a dialog box for specifying the setup information file (INF file) is
displayed. Specify the usbmon.inf file stored in a location below the directory where the KD38 is
installed (e.g., c:¥mtool¥kd38¥drivers).
ATTENTION
z
z
z
z
Before the USB device drivers can be installed, the KD38 you use must already be installed.
Install the KD38 first.
USB communication can be used only in Windows Me/98/2000/XP, and cannot be used in any
other OS.
When using Windows 2000/XP, a user who installs the USB device driver needs administrator
rights.
During installation, a message may be output indicating that the device driver proper
usbmon.sys cannot be found. In this case, specify the usbmon.sys, which is stored in the same
directory, as is the usbmon.inf file.
1.3 Starting the Debugger
Click the Windows start button, and then select menu:
Program (P) -> [RENESAS-TOOL] -> [KD38 V.x.xx Release x] -> [KD38]
5
2.
Setup Debugger
The Init dialog box is provided for setting the items that need to be set when the debugger starts up.
The contents set from this dialog box are also effective the next time the debugger starts. The data set
in this dialog remains effective for the next start.
To keep the Init dialog closed next time the debugger is started, check "Next Hide" at the bottom of the
Init dialog.
You can open the Init dialog using either one of the following methods:
z
After the debugger gets started, select Menu - [Environment] -> [Init...].
z
Start KD38 while holding down the Ctrl key.
6
2. Setup Debugger
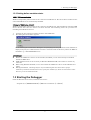
2.1 MCU Tab
Set the MCU file here.
The specified content becomes effective when the next being start.
2.1.1 Specifying the MCU file
Click the "Refer" button, the File Selection dialog is opened. Specify the corresponding MCU file.
An MCU file is saved under the directory in which KD38 is installed (For example:
C:¥mtool¥kd38¥mcufiles).
z An MCU file contains the information specific to the target MCU.
z The specified MCU file is displayed in the MCU area of the MCU tab.
If the corresponding MCU file is not contained in the debugger, you must create a new MCU file.
To do this, see the following:
z Method of making MCU file (KD38)
-> 2.4 Method of making MCU file
2.1.2 Setting of the communications interface
2.1.2.1 Setting of USB interface (PC4701U only)
Before USB communication can be performed, the computer must have a dedicated device driver
installed in it. For details on how to install USB device drivers, see "1.2.3.1 USB communication".
7
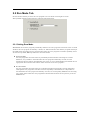
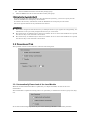
2.2 Run Mode Tab
Set the mode in which you want the user program to be run when executing Go or Come.
The specified content becomes effective when the next being start.
2.2.1 Setting Rum Mode
With KD38, the monitor program periodically monitors the user program's execution status to check
whether the user program is halted by a break, etc. This means that the monitor program interrupts
the CPU when executing the user program and, hence, the user program's real-time capability is lost.
To solve this problem, KD38 provides two execution modes:
z Sampling Mode:
the user program's execution status is periodically monitored when executing Go or Come.
Therefore, it is possible to check whether the user program is halted by a break, etc. The
monitoring interval time is determined by the value you set in the Sampling period field. Set an
appropriate interval time that will not affect execution of the user program.
z Free Run Mode:
the user program's execution status is not monitored when executing Go or Come. Therefore,
although the user program's real-time execution capability is maintained, it is impossible to
check whether the user program is halted by a break, etc. Consequently, KD38 shows executing
Go or Come status while the user program has been halted. To show the stop status, press the
STOP button.
8
2. Setup Debugger
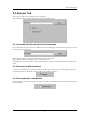
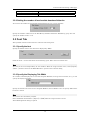
2.3 Resume Tab
The operation when the debugger starts is specified.
The specified content becomes effective when the next being start.
2.3.1 Automatically Execute the Script Commands
To automatically execute the script command at start of Debugger, click the "Refer" button to specify
the script file to be executed.
By clicking the "Refer" button, the File Selection dialog is opened.
The specified script file is displayed in the "Init File:" field.
To disable auto-execution of the script command, erase a character string displayed in the "Init File:"
field.
2.3.2 Restore the Window Status
To restore the window status (window position, window size) after the previous debugger program is
terminated, check the "Resume" check box (Resume is ON by default).
2.3.3 Re-download a Load Module
To re-download a load module (target program), check the "AutoDownLoad" check box (Re-download is
OFF by default).
9
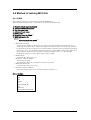
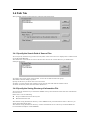
2.4 Method of making MCU file
2.4.1 KD38
The following content is sequentially described in the MCU file.
Please describe information on 1-4 referring to the data book on MCU used.
1.
2.
3.
4.
5.
6.
7.
Number of stack page selection bit
Address of CPU mode register
End address of stack *1
Address of reset vector
POD number *2
Firmware name (for PD38) *3
MCU Information No. *4
[Monitor]
Name= Firmware name (for KD38) *5
*1 End address of stack
Specify the last address of the area to be used as the stack. Consider the initial value of the
stack page selection bit in the CPU mode register. (The initial value of the stack page selection
bit depends on the microcomputer.) For a microcomputer which sets the stack page selection bit
initial value to "0", the allowable designation range is a 0 page address range (0h to FFh). For a
microcomputer which sets the stack page selection bit initial value to "1", the allowable
designation range is a 1 page address range (100h to 1FFh).
*2 POD number
In Starter-Kit, please set up "0".
*3 Firmware name (for PD38)
This item is not used.
In Starter-Kit, please set up arbitrary character sequences.
*4 MCU Information No.
In Starter-Kit, please set up "01".
*5 Firmware name (for KD38)
Specify the firmware file name, and don’t add the extension “.s”.
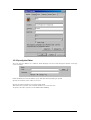
2.4.1.1 Example
2
3B
FF
FFFC
0
M37544STK_ES
01
[Monitor]
Name=M37544STK_ES
10
3. Environmental Setting of Debugger
3.
Environmental Setting of Debugger
Specify debugger environment setting in the Customize dialog.
You can open this dialog by selecting menu - [Environment] -> [Customize...].
The data set in this dialog remains effective for the next start.
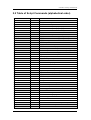
Tab
ShortcutKey
Download
Font
Path
Tool Entry
Other
Description
- Register the menus to the shortcut keys
- Setting the automatically Down-load of the Load Module
- Setting the number of load module download histories
- Specify the font
- Specify the default font for the characters displayed by KD38.
- Specify the Search Path of Source Files
- Specify the Saving Directory of Information File
- Setting the Make File
- Specify the Editor
- Setting the display of the Termination Confirmation Dialog
- Setting the debugger Forced Ending when Error Occurs
- Setting the target Continuance Execution when Debugger Ends
- Setting the display of the Absolute Path of Source File
- Control the Display Mode Switching of Program Window
- Specify the number of execution history of script command
11
You can also customize the buttons in the tool bar.
3.1 ShortcutKey Tab
The specified content becomes effective when the next being start.
3.1.1 Register the menus to the shortcut keys
You can register the menus to the shortcut keys.
You can also register execution of the script file and opening of the Custom window to the shortcut
keys.
z Assignable shortcut keys are any one key*, or combination of Shift/Ctrl/Alt keys + any one key*.
*Any one key covers the following:
Alphabet key
Numeric Key
Function key
Symbol key (",", "@", ":" etc.)
z When the shortcut key information is changed, the following dialog appears when exiting from
the Customize dialog (when clicking the "OK" button) asking you whether you want to save the
changed data or not.
When you save the changed data, the data is automatically loaded at the next start of KD38.
<<Specification of Shortcut Key Tab>>
Key Assign Group
12
3. Environmental Setting of Debugger
Category combo box
Displays the menu category. The enabled menus in the selected category are displayed in
the Menu List list box.
The category name [Main Menu] indicates all the menus except the option menus of
each window.
When the category of the window name is selected, the menu options available in
that window become enabled.
When the category name [Custom Window] is selected, the registered Custom
windows become enabled.
When the category name [Script Command] is selected, the registered script
commands become enabled.
Menu List list box
Lists the menus enabled in the menu category selected in the Category combo box. The
listed menus are sorted in the alphabet order.
Key edit box
Specifies the shortcut key to be assigned to the menu selected in the Menu List list box.
Current Key Assign list box
Displays the shortcut key to be assigned to the menu selected in the Menu List list box.
ADD button
Enables the shortcut key specified in the Key Edit box.
DEL button
Disables the shortcut key selected from the Current Key Assign list box.
Current Shortcut Key List Group
Lists the preset shortcut keys.
SAVE button
Saves the shortcut key information displayed in the Current Shortcut Key List group in a file.
LOAD button
Reads the shortcut key information from a file.
SCR button
Registers a script to be assigned to the shortcut key.
CB button
Registers the Custom window to be assigned to the shortcut key.
<<Registering the shortcut key>>
1.
Select the category of the menu to be registered in the Category combo box in the Key Assign
group.
The menus available for the category are displayed in the Menu List list box
2.
Select the menu to be registered from the Menu List list box and click the Key exit box.
KD38 is now waiting for the entry of shortcut key.
3.
Press the shortcut key to be assigned. The content of the shortcut key is displayed in the Key edit
box.
4.
Click the ADD button below the Current Key Assign list box.
<<Deleting the shortcut key>>
1.
Select the shortcut key to be deleted using one of the following methods:
z
Select the shortcut key from the list in the Current Shortcut Key List group.
13
2.
z
Select the Menu List list box in the Key Assign group.
Click the DEL button in the Current Shortcut Key List group.
<<Saving/reading the shortcut key>>
To use (save/read) the assigned shortcut key information separately, you need to specify the file.
Click the SAVE button and specify the file name.
To read the shortcut key information, click the LOAD button and specify the file name.
All of the registered shortcut key information is deleted.
ATTENTION
z
z
z
You cannot assign the same shortcut key to multiple menus. If you register the assigned key, the
information on the previously assigned shortcut key is overwritten.
The shortcut key is enabled only for the active window. If two or more same windows are opened,
the shortcut key is not reflected to all of them.
The shortcut key is enabled only for the active window. If two or more same windows are opened,
the shortcut key is not reflected to all of them.
3.2 Download Tab
The specified content becomes effective when the next being start.
3.2.1 Automatically Down-load of the Load Module
When the downloaded load module is updated by re-compile assemble, the file can be autodownloaded.
The load module is updated at timing when it is operated by a command of execution group (Go, Step,
etc).
In the Auto Download group, select any one of the following ("Disable" is selected by default).
14
3. Environmental Setting of Debugger
Enable (with confirmation)
Enable (without confirmation)
Disable
Asks for confirmation at auto-download.
Does not ask for confirmation at auto-download.
Does not auto-download the load module file.
3.2.2 Setting the number of load module download histories
You can set the number of load module download histories ("4" is set by default).
Specify the number of histories in the File History Number field in the File History group. You can
specify the number from 1 to 16.
3.3 Font Tab
The specified content becomes effective when the next being start.
3.3.1 Specify the font
Specify the default font for the characters displayed by KD38.
Click the "Font..." button. The Font selection dialog opens. Enter the font and font size.
Note
You can set the font independently in each window. With the target window active, select [Option]>[Font...] from the menu in the KD38 Window to open the font selection dialog.
3.3.2 Specify the Displaying Tab Width
In a window, which displays the source files (Program Window, Coverage source window, etc.), you can
specify the display tab width.
Specify the default tab values for the Program Window, Source Window. You can specify TAB values
between 1 and 32.
Note
You can set the tab width by window.
Select the KD38 window Menu - [Option] -> [TAB] while the target window is active.
The TAB designation dialog is opened.
15
3.4 Path Tab
The specified content becomes effective when the next being start.
3.4.1 Specify the Search Path of Source Files
You can specify the directory position (search path) of the source file to be displayed in a window such
as the Program Window.
This method is useful when the source file does not exist in the current directory or divided into
multiple directories.
To register the search path, click the Add... button in the File Search Path group.
The folder selection dialog is opened.
Specify the directory in which the source file exists.
To delete a certain search path, click the target search path and click the Delete button.
To delete all search paths, click the Delete All button.
3.4.2 Specify the Saving Directory of Information File
You can specify the directory in which the ASM/C watch point information file and other information
file are saved.
Other files cover the following:
z
Script command execution history file
z
Break information file
The default saving destination directory of the ASM/C watch point information file is a directory in
which the load module exists.
The default saving destination directory of other information file is a directory in which KD38 has
been installed (example: c:¥mtool¥kd38).
16
3. Environmental Setting of Debugger
To change the directory in which the ASM/C watch point information file is saved, reset a check mark
from the "Use the same directory as the absolute module file" check box in the Directory Setting group.
Then, the "Watch Points:" field is enabled.
Click the Refer... button on the right of the "Watch Points:" field and specify the saving destination
directory from the Directory Selection dialog.
To change to directory, in which other information file is saved, click the Refer... button on the right of
the "Other Settings:" field and specify the saving destination directory from the Directory Selection
dialog.
3.5 Tool Entry Tab
The specified content becomes effective when the next being start.
3.5.1 Execute the Make File
Prepare a PIF file to start the Make file.
Click the Refer button in the Make group. The Directory Selection dialog is opened.
Specify the directory in which the Make file exists.
Name the PIF file to be registered in the PIF Filename field.
3.5.1.1 Creating a PIF file
1. Create a keyboard shortcut for command.com located in the Windows directory.
Command.com is in the Windows directory in Windows 98/Me. It is in the system32 directory (The
example: ¥winnt¥system32) under the Windows directory in Windows 2000/XP.
2. For the keyboard shortcut thus created, assign a file name xxxxx.pif (xxxxx denotes a name
specified by the user) and moves the file into the directory that contains makefile.
3. Open the property dialog box for this file and input the same command in the command line of this
dialog box that was input on the DOS window.
4. Open the property dialog box for this file and input the same command in the command line of this
dialog box that was input from the DOS window.
17
3.5.2 Specify the Editor
You can start the Editor in a window, which displays the source file (Program window, Coverage
source window).
Click the Refer button in the Editor group. The File Selection dialog is opened.
Specify the item file of the editor to be used.
Specify the editor parameter in the Argument field.
File names are stored in "%F", and line numbers are stored in "%L".
To specify the editor options, see the Editor Manual/Help.
18
3. Environmental Setting of Debugger
3.6 Other Tab
The specified content becomes effective when the next being start.
3.6.1 Display the Termination Confirmation Dialog
You can set a parameter so that the termination confirmation dialog will not be opened, which is
supposed to be opened when exiting from the debugger.
To keep the dialog closed, remove a check mark from the above check box in the Exit group.
3.6.2 Debugger Forced Ending when Error Occurs
You can set a parameter so that the debugger will not be forced to end when a communication error
occurs (The debugger is forced to end by default).
To do this, remove a check mark from the above check box in the Exit group.
3.6.3 Target Continuance Execution when Debugger Ends
When exiting from the debugger during execution of the target program, you can select to continue
execution or stop execution of the emulator (The emulator is stopped by default).
To continue execution, remove a check mark from the above check box in the Exit group.
ATTENTION
The target program, which is executed continuously, cannot be re-controlled next time the debugger
gets started.
To start the debugger, press the system reset switch on the emulator to reset the target program.
19
3.6.4 Enabling multiple startup
Multiple KD38 startup can be enabled (By default, multiple startup is disabled.).
To enable multiple startup, check the above check box included in the Exit group.
3.6.5 Display the Absolute Path of Source File
When the file name is displayed with the absolute path in the title bar in the Program (Source)
window, you can hide the absolute path from the screen.
To hide the file path, check the above check box in the Other Setting group.
3.6.6 Control the Display Mode Switching of Program Window
You can set switching of the display mode at stop of the target program to "Suppress" (keep the
current display mode) in the Program window (However, the display mode may be switched depending
on where the target program is stopped).
To control the display mode switching, check the above check box in the Other Setting group.
3.6.7 Execution History of Script Command
You can save the execution history of the script command (Ten sets of history data are saved by
default).
To change the history of script commands, specify the number of history in the Number of Commands
field. (0 to 100) To clear history of script commands, remove a check mark from the above check box in
the Other Setting group.
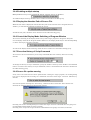
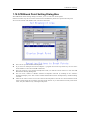
3.6.8 Source file update warning
If any source file exists that has been updated after creating the target program, an warning dialog
box can be displayed when issuing the commands associated with target execution. (Warned, by
default)
If source file update warnings are unnecessary, uncheck the above check box. If the check box is
checked, the warning dialog box shown below appears
Choosing "No" in this warning dialog box cancels the target execution command that was going to be
issued. Build and download the target program.
Choosing "Yes" accepts the target execution command that was going to be issued, so that the
20
3. Environmental Setting of Debugger
command is processed normally. From the next time on (until the next time downloading is processed),
no warnings will be displayed even when using target execution commands.
If the warning dialog box is closed by checking the Next Hide check box, no source file update
warnings are displayed from the next time on (This is the same as when the Warn to update the target
program check box is unchecked.).
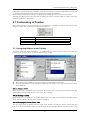
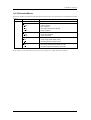
3.7 Customizing of Toolbar
The toolbar buttons on each window can be customized. To customize any button, right-click on the
window's toolbar. The popup menu shown below appears.
Flat style
Text labels
Labels on right side
Customize…
Flattens the button when checked.
Shows text below the button when checked.
Shows text to the right of the button when checked.
Opens a toolbar customize dialog box.
3.7.1 Assigning Buttons to the Toolbar
To do this, select the menu “Customize…” or double-click an area in which no button is placed in the
tool bar in the window. The Customize Tool Bar dialog opened.
z
z
The buttons corresponding to the option menus in the window are provided.
You can only add the buttons, which are enabled in each window. You cannot add the buttons for
other windows.
3.7.1.1 Adding a button
Click the buttons to be added in the "Available Button" list box at right of the Customize Tool Bar
dialog. Then, click the "Add" button in the center of the dialog.
3.7.1.2 Deleting a button
Click the button to be deleted in "Tool Bar Button" list box at left of the Customize Tool Bar dialog.
Then, click the "Delete" button in the center of the dialog.
3.7.1.3 Changing the button display order
Use the "Up" button or "Down" button at right of the dialog to change the display order. Click the
button for which the display order is to be changed in the "Tool Bar Button" list box at left of the
21
Customize Tool Bar dialog. Then, click the "Up" or "Down" button to change the display position.
3.7.1.4 Resetting the display buttons
Click the "Help" button at right of the dialog. The display buttons are reset to the default settings.
22
4. Ending the Debugger
4.
Ending the Debugger
To ending the debugger, select Menu - [File] -> [Exit]. The Confirmation dialog opens.
When ending the KD38, click the "OK" button.
"Other Tab of Customize Dialog"
To keep the dialog closed, refer to “3.6.1 Display the Termination Confirmation Dialog”.
23
[MEMO]
24
Reference
25
26
1. Windows / Dialogs
1.
Windows / Dialogs
z Windows
The window of this debugger is shown below.
Window Name
KD38 Window
Program Window
Source Window
Register Window
Memory Window
Dump Window
RAM Monitor Window
ASM Watch Window
C Watch Window
Local Window
File Local Window
Global Window
Script Window
GUI Input Window
GUI Output Window
z Dialogs
The dialog of this debugger is shown below.
Dialog
S/W Break Point Setting Dialog Box
27
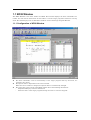
1.1 KD38 Window
The KD38 Window is the main window for KD38. This window displays the main commands on a
toolbar. You can click on the buttons on this toolbar to run the target program in normal or one-step
mode. The main display area accommodates windows such as the Target Program Window.
1.1.1 Configuration of KD38 Window
z
z
z
The main commands, such as execution/stop of the target program and step execution, are
located to the tool bar.
The Option menu is dependent on the active window.
When the active window is changed, the Option menu is automatically changed.
The status bar at the bottom of the KD38 window shows the following information:
Explanation/display of menus and buttons
Execution state of the target program (during execution or execution stopped)
28
1. Windows / Dialogs
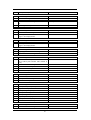
1.1.2 Tool Bar
A basic operation is allocated to the toolbar.
Button
Name
Contents
Go
Execute target Program.
Come
Step
Execute the target program from the value in the program counter to the
position of the cursor.
One-step execution of target program.
Over
Step over function/subroutine call.
Return
Run the program up to the higher routine.
Stop
Stop execution of the target program.
Break
Set S/W breakpoint.
Reset
Set H/W breakpoint.
SW
Set S/W breakpoint.
1.1.3 Option
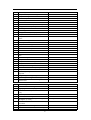
In the KD38 window, the following menus are prepared.
File Operation
Menu
Menu Options
File
Download
Load Module...
Editing
Menu
Edit
Function
Download target program
Memory Image...
Download machine language data and debugging
information
Download only machine language data
Symbol...
Download only debugging information
Rom Data...
Additional download machine language data
Reload...
Reload target program
Upload...
Upload target program
Save Disasm...
Save disassembly result
(Download File)
List the file name of target program downloaded
Exit
Terminate KD38
Menu Options
Function
Copy
Copy character strings specified to clipboard.
Paste
Paste character strings of clipboard.
Cut
Cut character strings specified to clipboard.
Delete
Cut character strings specified.
Undo
Undo of edit.
Find…
Find character strings
29
Display
Menu
View
Setup
Menu
Menu Options
Function
Tool Bar
Switch display or non-display of toolbar
Status Bar
Switch display or non-display of status bar
Tool Bar(Child)
Switch display or non-display of toolbar (child window)
Menu Options
Function
Environment Init…
Start Up…
Startup function settings
Customize…
Open Customize dialog box
Debugging (Basic)
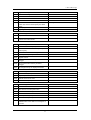
Menu
Menu Options
Debug
Go
Go
Go Option...
Function
Start target program
Run from current program counter
Run from specified address
GoFree
Free-run target program
Come
Run to cursor position
Step
Step execution
Step
Execute one step
Step Option...
Execute specified No. of steps
Over
Over
Over Option…
Over-step execution
Execute one over-step
Execute specified No. of over-steps
Return
Execute until return from current subroutine
Reset
Reset target program
Stop
Stop target program
Break Point
Set break point
S/W Break Point...
Break
Open S/W Break Point Setting dialog box
Set/cancel software break at cursor
Scope...
Open Scope Setting dialog box
Make
Make target program
Debugging (Option)
Menu
Menu Options
Option
Environment setup(open the Init dialog box)
Function
The content of option menu depends on the active window.
The content of the menu changes automatically when an active window changes.
Please refer to the reference of each window for the content of the menu of each window.
30
1. Windows / Dialogs
Window Operations (Basic Window)
Menu
Menu Options
Basic
Windows
Cascade windows
Title
Tile windows
Arrange Icon
Arrange icons
Program Window
Make Program Window active
Source Window
Open Source Window
Register Window
Open Register Window
Memory Window
Open Memory Window
Dump Window
Open Dump Window
RAM Monitor Window
Open RAM Monitor Window
ASM Watch Window
Open ASM Watch Window
C Watch Windows
Open C (language-level) Watch Window
C Watch Window
Open C Watch Window
Local Window
Open Local Window
File Local Window
Open File Local Window
Global Window
Script Window
Window Operations (Optional Window)
Menu
Menu Options
GUI Windows
Help
Menu
Help
Function
Cascade
Open Global Window
Open Script Window
Function
GUI Widows
GUI Input Window
Open GUI Input Window
GUI Output Window
Open GUI Output Window
Menu Options
Function
Contents
Display Help
Active Window
Display Help of Active Window
About...
Display version information
31
1.2 Program Window
The Program window always displays the source file corresponding to the current program counter
position.
This window is opened automatically at start. The background of the program counter position is
displayed in yellow.
This window allows you to execute the source program up to the cursor position, set/reset the software
breakpoint, and perform line assemble.
The Program window provides the three display modes as below:
z Source display mode
Displays the source file of the target program.Can also be used to edit the source file.
z Disassemble Mode
Displays the disassemble result of the target program.
z MIX display mode
Displays the source file of the target program and its disassemble result in a mixed style.
1.2.1 Configuration of Source Display Mode
The program window has the following two source display modes. These display modes can be changed
from menus on the program window.
z Debug mode
This mode is used to debug (e.g., run or stop) the target program.
z Edit mode
This mode is used to edit the source file.
The program window's source display mode (debug mode) is configured as shown below.
32
1. Windows / Dialogs
z
z
z
z
z
z
z
z
z
z
z
You can switch "Display/Hide" for the line number display area / address display area.
You can change the source file to be displayed by double-clicking the line number display area.
You can change the display start address/display start line by double-clicking the address
display area.
You can set/reset the breakpoint by clicking (or double-clicking) the breakpoint display area.
By staying the mouse cursor on a C language variable for a given period of time (about 0.5
second), the variable data is popped up.
You can drag the function name and then click the mouse right button to display the source file
corresponding to the function.
You can drag the C language variable and then click the mouse right button to register the
variable as the C watch point.
You can drag the assembler symbol and then click the mouse right button to register the symbol
as the ASM watch point.
You can open the displayed source file on the editor (You must have registered the editor
name).
The source file being displayed can be edited on the window.
You can line-assemble the clicked position.
The program window's source display mode (edit mode) is configured as shown below.
z
z
z
The line number display, address display, and breakpoint display areas are not shown.
The right-click menu changes for exclusive use in edit mode.
The status bar on the KD38 window shows the line and column numbers of the cursor position.
33
1.2.2 Configuration of MIX Display Mode
The mix display mode of the window is the following configurations.
z
z
z
z
z
z
z
z
z
You can switch "Display / Hide" for the line number display area / address display area / object
code display area.
You can change the source file to be displayed by double-clicking the line number display area.
You can change the display start address / display start line by double-clicking the address
display area.
You can set / reset the breakpoint by clicking (or double clicking) the breakpoint display area.
You can change the display ratio between the object code display area and the label display area,
and between the label display area and the program display area, using the mouse.
You can open the displayed source file on the editor (You must have registered the editor
name).
The MIX display result can be saved as a text file.
You can line-assemble the clicked position.
You can scroll the display up/down in units of source line.
34
1. Windows / Dialogs
1.2.3 Configuration of Disassemble Display Mode
The disassemble display mode of the window is the following configurations.
You can switch "Display / Hide" for the address display area/object code display area.
You can change the display start address by double-clicking the address display area.
You can set / reset the breakpoint by clicking (or double clicking) the breakpoint display area.
You can change the display ratio between the object code display area and the label display area,
and between the label display area and the program display area, using the mouse.
z You can line-assemble the clicked position.
z
z
z
z
35
1.2.4 Extended Menus
The Program window provides the following menu when being active (This menu is called Program
window option).
Menu
Option
Menu Options
Function
Font...
Change font
TAB...
Set source file display tabs
Color...
Change display color
View
Change contents of display
Source...
Display from specified source file or function
Address...
Display from specified address or line No
Program Counter
Mode
Display from current program counter
Switch display mode
Source Mode
Switch to source display mode
Mix Mode
Switch to MIX display mode
Disasm Mode
Layout
Switch to disassemble display mode
Set layout
Line Area
Turn on / off line No. area
Address Area
Turn on / off address area
Code Area
Turn on / off object code area
Line Assemble...
Open Line Assemble dialog
Save Mix…
Saves MIX display result
Edit
Edit functions
On
Turns editing on or off
Save
Saves the edited contents by overwriting
Save As…
Saves the edited contents with another name
Save All
Saves all of the edited contents by overwriting
1.2.5 Shortcut Menu
The Program window provides the shortcut menu by clicking the mouse right button within the
window (This menu is called Program window right-click menu).
The menu content varies depending on the clicked position.
When right-clicking the line number display area or address display area:
The shortcut menu same as the option menu appears.
z When right-clicking the breakpoint display area:
The shortcut menu does not appear.
z When right-clicking other area:
The following shortcut menu appears.
z
36
1. Windows / Dialogs
(Debug Mode)
Menu
Right-Click
Menu Options
Display the selected function
Open Source Window
Display the selected function(by Source Window)
Add C Watch...
Register the C watch point on selected variable
Add C Watch Pointer…
Register the C watch point on selected pointer variable
Add ASM Watch…
Register the ASM watch point on selected symbol
BitAdd ASM Watch…
Register the ASM watch point on selected bit symbol
Open Editor
Open the source file by the editor
Line Assemble...
Open the Line Assemble dialog
Save Mix…
Saves MIX display result
Edit
Edit functions
On
(Edit Mode)
Menu
Right-Click
Function
Jump to function
Turns editing on or off
Menu Options
Function
Copy
Copy character strings specified to clipboard.
Paste
Paste character strings of clipboard.
Cut
Cut character strings specified to clipboard.
Delete
Cut character strings specified.
Undo
Undo of edit.
Find
Find character strings.
Font
Change font.
Tab
Set source file display tabs.
Edit
Edit functions
On
Turns editing on or off
Save
Saves the edited contents by overwriting
Save As…
Saves the edited contents with another name
Save All
Saves all of the edited contents by overwriting
37
1.3 Source Window
The Source window continuously displays any position of the source file. (The Program window always
displays the source file corresponding to the current program counter position.)
When the program counter points the displayed source file position, its background is displayed in
yellow.
Like the Program window, the Source window allows you to execute the source program up to the
cursor position, set/reset the software breakpoint and perform line-assemble.
You can open up to 30 Source windows.
1.3.1 Configuration of Source Window
The Source Window configuration, toolbar and option menu is the same as that in the Program
Window.
38
1. Windows / Dialogs
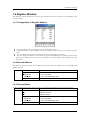
1.4 Register Window
The Register window displays the register data and flag data. You can change a register/flag value
from the window.
1.4.1 Configuration of Register Window
If a register/flag value is changed, the value is displayed in red.
Double-clicking the register display line opens a dialog, which allows you to change a register
value.
z You can change a flag value by clicking the button corresponding to the flag.
z You can change the display ratio between the register name display area and the register value
display area, and between the register value display area and the radix point display area, using
the mouse.
z
z
1.4.2 Extended Menus
The Register window provides the following menu when being active (This menu is called Register
window option).
Menu
Menu Options
Function
Layout
Set layout
Hide Radix
Hide FLAGs
Font...
Turn on/off radix
Turn on/off flags display area
Change font
1.4.3 Shortcut Menu
Press the right button on the register display area in Register Window to display shortcut menu.
Menu
Menu Options
Function
Right Click
Hex
Display in hexadecimal
Dec
Display in decimal
Bin
Display in binary
Layout
Set layout
Hide Radix
Turn on/off radix
Hide FLAGs
Turn on/off flags display area
Font...
Change font
39
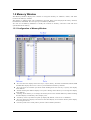
1.5 Memory Window
The Memory Window displays the contents of contiguous memory in "address", "label", and "data
(contents of memory)" formats.
The display is updated after each command is executed. Data can be displayed in binary, decimal,
hexadecimal, and ASCII. You can open up to 30 Memory Windows.
You can use the Memory Windows to modify the contents of memory, and also to fill and move
specified blocks of memory.
1.5.1 Configuration of Memory Window
z
z
z
z
z
z
z
You can select the display data from 1 byte, 2 bytes, binary, decimal, hexadecimal, ASCII, SJIS
and JIS (The display data is set to the 1 byte hexadecimal format by default).
You can select the window open menu while holding down the Ctrl key to specify the display
start address.
Double-clicking the address display area opens a dialog, which allows you to change the display
start address.
A dialog, which allows you to change the memory data at the clicked address by double-clicking
the label display area/memory data, display area.
A memory cache is provided to speed up display (By default, cache is set to "Disable").
You can change the display ratio between the label display area and the memory data display
area using the mouse.
Can keep track of the stack pointer position. (Not tracked by default.)
40
1. Windows / Dialogs
1.5.2 Option Menu
The Memory window provides the following menu when being active (This menu is called Memory
window option).
Menu
Option
Menu Options
Functions
Font
Change font
View
Change contents of display
Scroll Area...
Address...
S
Followed Stack Pointer…
Data Length
Byte
Word
Radix
Bin
Dec
Hex
ASCII
Specify scroll range
Specify display starting address
Starting address to value of Stack Pointer.
Keep tracking of the stack pointer position.
Specify data length
Display in 1-byte units
Display in 2-byte units
Specify data radix
Display in binary
Display in decimal
Display in hexadecimal
Display as ASCII characters
SJIS
JIS
Refresh
Display as SJIS characters
Display as JIS characters
Refresh display
Debug
Set memory contents
Set...
Fill...
Set data at specified address
Fill specified memory block with data
Move...
Move specified memory block to specified Address
Cache On
Use the cache of memory
1.5.3 Shortcut Menu
The Memory window provides the shortcut menu by clicking the mouse right button in the window.
Menu
Right-Click
Set…
Menu Options
Functions
Set data at specified address.
Fill…
Fill specified memory block with data.
Move
Byte
Word
Radix
Bin
Dec
Hex
ASCII
SJIS
JIS
Register
S
Move specified memory block to specified Address.
Display in 1-byte units
Display in 2-byte units
Specify data radix
Display in binary
Display in decimal
Display in hexadecimal
Display as ASCII characters
Display as SJIS characters
Display as JIS characters
Display the specified register.
Starting address to value of Stack Pointer.
Followed Stack Pointer
Refresh
Scroll Area...
Keep tracking of the stack pointer position.
Refresh display.
Specify scroll range.
Font...
Change font.
41
1.6 Dump Window
The Dump Window displays the contents of contiguous memory in dump format.
The display is updated after each command is executed. You can open up to 30 Dump Windows.
You can use the Dump Windows to modify the contents of memory, and also to fill and move specified
blocks of memory.
1.6.1 Configuration of Register Window
The display is updated after each command is executed. You can open up to 30 Dump Windows.
You can use the Dump Windows to modify the contents of memory, and also to fill and move specified
blocks of memory.
z
z
z
z
z
You can select the display data from 1 byte, 2 bytes, decimal, hexadecimal, ASCII, SJIS and JIS
(The display data is set to the 1 byte hexadecimal format by default).
You can select the window open menu while holding down the Ctrl key to specify the display
start address.
Double-click the address display area to change the display starting address.
Double-click a label or the memory display area to change the contents of memory.
A memory cache is provided to speed up display (By default, cache is set to "Disable").
42
1. Windows / Dialogs
1.6.2 Extended Menus
The Dump window provides the following menu when being active (This menu is called Dump window
option).
Menu
Option
Menu Options
Font
View
Scroll Area...
Address...
Data Length
Byte
Word
Radix
Dec
Hex
ASCII
SJIS
JIS
Function
Change font
Change contents of display
Specify scroll range
Specify display starting address
Specify data length
Display in 1-byte units
Display in 2-byte units
Specify radix
Display in decimal
Display in hexadecimal
Display as ASCII characters
Display as SJIS characters
Display as JIS characters
Refresh
Debug
Set...
Fill...
Move...
Cache On
Refresh display
Set memory contents
Set data at specified address
Fill specified memory block with data
Move specified memory block to specified Address
Use the cache of memory
1.6.3 Shortcut Menu
The Dump window provides the shortcut menu by clicking the mouse right button in the window.
Menu
Right-Click
Menu Options
Set…
Functions
Set data at specified address.
Fill…
Fill specified memory block with data.
Move
Byte
Word
Radix
Bin
Dec
Hex
ASCII
SJIS
JIS
Refresh
Scroll Area...
Move specified memory block to specified Address.
Display in 1-byte units
Display in 2-byte units
Specify data radix
Display in binary
Display in decimal
Display in hexadecimal
Display as ASCII characters
Display as SJIS characters
Display as JIS characters
Refresh display.
Specify scroll range.
Font...
Change font.
43
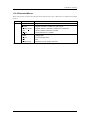
1.7 RAM Monitor Window
The RAM Monitor Window displays the contents of memory in the RAM monitor area in dump format.
Up to 10 RAM monitor windows can be opened. The display is updated at constant intervals (default =
1000ms) during execute ion of the target program. You can set any contiguous address area as the
RAM monitor area.
1.7.1 Configuration of RAM Monitor Window
z
z
z
z
z
The default RAM monitor area is from 0h to 3FFh. By clicking the Area button, a dialog is
opened, which allows you to change the RAM monitor area.
By double-clicking the address display area, a dialog is opened, which allows you to change the
display start address. If the specified address is outside the RAM monitor area, the RAM monitor
area is also changed.
The update interval during execution of the target program is displayed in the update interval
display field. (When the target is stopped, a character string "Address" is displayed.)
The update interval may be delayed from the specified update interval depending on the
operational factors (listed below).
Host machine performance
Window size (memory display capacity)
Number of memories in which the values have been changed
You can select the display data from 1 byte, 2 bytes, decimal, hexadecimal, ASCII, SJIS and JIS
(The display data is set to the 1 byte hexadecimal format by default).
ATTENTION
z
In order that the RAM monitor of KD38 may stop program execution and may acquire data,
real-time nature is not guaranteed.
44
1. Windows / Dialogs
1.7.2 Extended Menus
The RAM Monitor window provides the following menu when being active (This menu is called RAM
Monitor window option).
Menu
Option
Menu Options
Font
View
Address...
Data Length
Byte
Word
Radix
Dec
Hex
ASCII
SJIS
JIS
Layout
Ascii
RAM Monitor Area...
Sampling period...
Functions
Change font
Change contents of display
Display from specified address
Specify data length
Display in 1-byte units
Display in 2-byte units
Specify radix
Display in decimal
Display in hexadecimal
Display as ASCII characters
Display as SJIS characters
Display as JIS characters
Set layout
Turn on/off ASCII strings
Set RAM monitor area
Set sampling period for RAM monitor
These menus can be selected even by the short cut menu by a right click in the window.
45
1.8 ASM Watch Window
The ASM Watch Window allows you to check the values at any specified address.
You can specify the point to watch as an address (symbol or global variable), as an address and bit No.,
or as a bit symbols.
The display is updated after each command is executed.
1.8.1 Configuration of ASM Watch Window
z
z
z
z
z
An address to be referenced is called watch point. You can register one of the following as the
watch point:
Address (can be specified with symbol)
Address + Bit number
Bit symbol
By double-clicking the radix point display area, the radix display changes (Hex -> Dec -> Bin).
The registered watch point information is saved in the environment setting file when closing
the ASM Watch window. When re-opening the file, the information is automatically registered.
When you specify a symbol/bit symbol as the watch point, the debugger re-calculates the
address expression when downloading the target program and displays the memory data using
new addresses.
A disabled watch point is displayed as "--<not active>--".
46
1. Windows / Dialogs
1.8.2 Extended Menus
The ASM Watch window provides the following menu when being active. (This menu is called ASM
Watch window option.)
Menu
Option
Menu Options
Font
Watch
Add...
Bitadd...
Set...
Del
Del All...
Refresh
Radix
Bin
Dec
Hex
Layout
Address Area
Size Area
RAM Monitor
Sampling period...
File
Save...
Load...
Functions
Change font.
Register / delete watch point.
Register watch point.
Register bit-level watch point.
Set new data to be written to selected watch point.
Delete selected watch point.
Delete all watch points.
Refresh display.
Change display radix.
Display value at selected watch point in binary.
Display value at selected watch point in decimal.
Display value at selected watch point in hexadecimal.
Set layout.
Turn on/off address/bit area.
Set color of access attribute display.
Display RAM monitor.
Set sampling period for RAM monitor.
Save/Load the watch points.
Save the watch points.
Load the watch points.
These menus can be selected even by the short cut menu by a right click in the window.
47
1.9 C Watch Window
The C Watch Window displays C expressions and their values (results of calculations).
The C expressions displayed in the C Watch Window are known as C watchpoints. The displays of the
results of calculating the C watchpoints are updated each time a command is executed.
When RAM monitor function is effective and the C watch points are within the RAM monitor area, the
displayed values are updated during execution of the target program.
1.9.1 Configuration of C Watch Window
z
z
z
z
z
z
A C language expression to be referenced is called C watch point. You can register one of the
following as the C watch point:
C symbol
Variable name and function name defined by the C language source program
C language expression
C symbols combined with expressions.
If a C language expression cannot be calculated correctly (for example, when a C symbol has
not been defined), it is registered as invalid C watch point.
It is displayed as "--<not active>--". If that C language expression can be calculated correctly at
the second time, it becomes an effective C watch point.
You can change the display radix by C language expression (Hex -> Dec -> Bin).
The address display of pointers is fixed to hexadecimal regardless of the display radix.
You cannot change the values of the C watch points listed below:
Floating-point variables
Bit field variables
Register variables
C watch point which does not indicate an address(invalid C watch point)
The registered C watch point information is saved in the C watch point information file when
closing the C Watch window. When re-opening the file, the information is automatically
registered.
48
1. Windows / Dialogs
z
A C watch point information file is created for each object file that is loaded. (The file includes
the object file name information.)
The order of arrangement can be altered (using the Drag & Drop function).
1.9.2 Extended Menus
The C Watch window provides the following menu when being active. (This menu is called C Watch
window option.)
Menu
Option
Menu Options
Font
Watch
Add
Add Pointer
Del
Set...
Cancel
Del All…
View
Radix
Layout
Sort
Display String
RAM Monitor
Enable
Sampling period...
Functions
Change font.
Register/delete C watch point.
Register C watch point.
Register C watch point (pointer).
Delete selected C watch point.
Set new value for selected C watch point.
Cancel selection of C watch point.
Delete all C watch points.
Change contents of display.
Change radix.
Turn on/off type name.
Sort.
Display the string / Display character.
Display RAM monitor.
Turn on/off RAM monitor area.
Set sampling period for RAM monitor.
These menus can be selected even by the short cut menu by a right click in the window.
49
1.10 Local Window
The Local Window lists local variables in the C function with their values. The display is updated
after each command is executed.
1.10.1 Configuration of Local Window
z
z
z
z
The window displays a local variable of the function corresponding to the program counter
position.
If the corresponding function is changed by step execution or other operation, the local variable
after changing the function is automatically displayed.
You can register the selected C language variable to the C Watch window as a C watch point.
The address display such as a pointer is fixed to hexadecimal regardless of the display radix.
You can change the display radix for each C language variable. (Hex -> Dec -> Bin).
50
1. Windows / Dialogs
1.10.2 Extended Menus
The Local window provides the following menu when being active. (This menu is called Local window
option.)
Menu
Option
Menu Options
Font
Watch
Cwatch
Cwatch Pointer
Set...
Cancel
View
Radix
Layout
Sort
Display String
Functions
Change font.
Operations related to C-function.
Register selected C variable as C watch point.
Register pointer of selected C variable as C watchpoint.
Set new value for selected C variable.
Cancel selection of C variable.
Change contents of display.
Change radix.
Turn on/off type name.
Sort.
Display the string / Display character.
These menus can be selected even by the short cut menu by a right click in the window.
51
1.11 File Local Window
The File Local Window lists local variables in the C file with their values. The display is updated after
each command is executed.
When RAM monitor function is effective and the C watch points are within the RAM monitor area, the
displayed values are updated during execution of the target program.
1.11.1 Configuration of File Local Window
z
z
z
z
The window displays a file local variable of the function corresponding to the program counter
position.
If the corresponding function is changed by step execution or other operation, the local variable
after changing the function is automatically displayed.
You can register the selected C language variable to the C Watch window as a C watch point.
The address display such as a pointer is fixed to hexadecimal regardless of the display radix.
You can change the display radix for each C language variable. (Hex -> Dec -> Bin).
52
1. Windows / Dialogs
1.11.2 Extended Menus
The File Local window provides the following menu when being active. (This menu is called File Local
window option.)
Menu
Option
Menu Options
Font
Watch
Cwatch
Cwatch Pointer
Set...
Cancel
View
Radix
Layout
Sort
Display String
RAM Monitor
Functions
Change Fonts.
Operations related to C-function.
Register selected C variable as C watch point.
Register pointer of selected C variable as C watchpoint.
Set new value for selected C variable.
Cancel selection of C variable.
Change contents of display.
Change radix.
Turn on/off type name.
Sort.
Display the string / Display character.
Display RAM monitor.
Enable
Turn on/off RAM monitor area.
Sampling period...
Set sampling period for RAM monitor.
These menus can be selected even by the short cut menu by a right click in the window.
53
1.12 Global Window
The Global Window lists C global variables and their values. The display is updated after each
command is executed.
When RAM monitor function is effective and the C watch points are within the RAM monitor area, the
displayed values are updated during execution of the target program.
1.12.1 Configuration of Global Window
z
z
z
You can register the selected C language variable to the C Watch window as a C watch point.
The address display such as a pointer is fixed to hexadecimal regardless of the display radix.
You can change the display radix for each C language variable. (Hex -> Dec -> Bin).
54
1. Windows / Dialogs
1.12.2 Extended Menus
The Global window provides the following menu when being active. (This menu is called Global
window option.)
Menu
Option
Menu Options
Font
Watch
Cwatch
Catch Pointer
Set...
Cancel
View
Radix
Layout
Sort
Display String
RAM Monitor
Functions
Change Font.
Operations related to C-function.
Register selected C variable as C watch point.
Register pointer of selected C variable as C watchpoint.
Set new value for selected C variable.
Cancel selection of C variable.
Change contents of display.
Change radix.
Turn on/off type name.
Sort.
Display the string / Display character.
Display RAM monitor.
Enable
Turn on/off RAM monitor area.
Sampling period...
Set sampling period for RAM monitor.
These menus can be selected even by the short cut menu by a right click in the window.
55
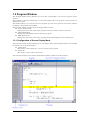
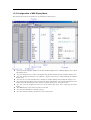
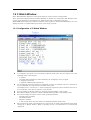
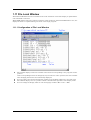
1.13 Script Window
The Script Window displays the execution of text -format script commands and the results of that
execution.
Script commands can be executed using a script file or interactively. You can also write script
commands in the script file so that they are automatically executed. The results of script command
execution can also be stored in a previously specified log file.
1.13.1 Configuration of Script Window
z
z
z
z
The Script Window has a view buffer that stores the results of executing the last 1000 lines. The
results of execution can therefore be stored in a file (view file) without specifying a log file.
When a script file is opened, the command history area changes to become the script file display
area and displays the contents of the script file. When script files are nested, the contents of the
last opened script file are displayed. The script file display area shows the line currently being
executed in inverse vide.
When a script file is open, you can invoke script commands from the command input area
provided the script file is not being executed.
The Script Window can record the history of the executed commands to a file. This function is not
the same as the log function. This function records not the result but only the executed
commands, so the saved files can be used as the script files.
56
1. Windows / Dialogs
1.13.2 Extended Menus
The Script window provides the following menu when being active. (This menu is called Script window
option.)
Menu
Menu Options
Functions
Option
Font...
Change font.
Script
Script file operations.
Open...
Open script file.
Run
Run script file.
Step
One-step execution of script file.
Close
Close script file.
View
View buffer operations.
Save...
Save view buffer file.
Clear
Clear view buffer.
Log
Log file operations.
On...
Open log file (start output to file).
Off
Close log file (stop output to file).
Record
Record the executed commands
On...
Record the executed commands to a file.
Off
Stop Recording the executed commands.
These menus can be selected even by the short cut menu by a right click in the window.
57
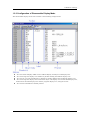
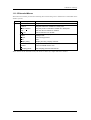
1.14 GUI Input Window
The GUI Input window allows you for port input by creating a user target system key input panel
(button) in the window and clicking the created button.
1.14.1 Configuration of GUI Input Window
You can label (name) the created button.
You can also save the created input panel in a file and reload it.
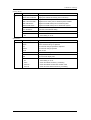
1.14.2 Extended Menus
The GUI Input window provides the following menu when being active (This menu is called GUI Input
window option).
Menu
Option
Menu Options
Set
Del
Copy
Paste
Make Button
Make Text
Display Grid Line
Load...
Save...
Function
Edits or moves button
Deletes button
Copies button
Pastes button
Creates button
Creates text label
Shows/hides grid line
Loads GUI input file
Saves GUI input file
These menus can be selected even by the short cut menu by a right click in the window.
58
1. Windows / Dialogs
1.15 GUI Output Window
The GUI Output window allows you to implement the user target system output panel in the window.
1.15.1 Configuration of GUI Output Window
You can arrange the following parts on the output panel.
z
Label (character string)
Displays/erases a character string specified by the user when any value is written to the
specified address (bit).
z
LED
Changes the display color of any area when any value is written to the specified address (bit).
(Substitution for LED ON)
z
Text
The text labels.
You can label (name) the created button.
You can also save the created output panel in a file and reload it.
You can set up to 200 address points to the created part.
If different addresses are set to the each parts, you can arrange up to 200 parts.
59
1.15.2 Extended Menus
The GUI Output window provides the following menu when being active (This menu is called GUI
Output window option).
Menu
Option
Menu Options
Set
Del
Copy
Paste
Make Label
Make LED
Make Text
Display Grid Line
Load...
Save...
RAM Monitor
RAM Monitor Area…
Sampling period...
Function
Edits or moves parts
Deletes parts
Copies parts
Pastes parts
Creates label
Creates LED
Create text label
Shows/hides grid line
Loads GUI output file
Saves GUI output file
Display RAM monitor
Set RAM monitor area
Set sampling period for RAM monitor
These menus can be selected even by the short cut menu by a right click in the window
60
1. Windows / Dialogs
1.16 S/W Break Point Setting Dialog Box
The S/W Break Point Setting dialog box allows you to set software break points.
Software breaks stop the execution of instructions immediately before the specified break point.
You can also enable and disable each of those break points.
z
z
z
z
z
You can set up to 2 software break points.
If you have set multiple software breakpoint s, program execution stops when any one soft ware
break address is encountered (OR conditions).
You can continue to set software breakpoints until you click the "Close" button to close the S/W
Break Point Setting Dialog Box.
You can clear, enable or disable software breakpoints selected by clicking in the software
breakpoint display area. You can also enable and disable software breakpoints by double clicking
on them.
Click on the "Save" button to save the software break points in the file. To reload software break
point settings from the saved file, click the "Load" button. If you load software break points from
a file, they are added to any existing break points.
61
2.
Table of Script Commands
The following script commands are prepared.
The commands with yellow color displaying can be executed at run time.
2.1 Table of Script Commands
2.1.1 Execution Commands
Command Name
Short Name
Contents
Go
G
Program execution with breakpoints
GoFree
GF
Free run program execution
Stop
-
Stops program execution
Status
-
Checks the operating status of the MCU
Step
S
Halts for user input until the specified time has elapsed
StepInstruction
SI
Step execution of instructions
OverStep
O
Overstep execution of source lines
OverStepInstruaction
OI
Overstep execution of instructions
Return
RET
Executes a source line return
ReturnInstruction
RETI
Executes an instruction return
Reset
-
Resets the target MCU
2.1.2 File Operation Commands
Command Name
Short Name
Contents
Load
L
Downloads the target program
LoadHex
LH
Downloads an Intel HEX-format file
LoadSymbol
LS
Loads source line/ASM symbol information
LoadIeee
LI
Downloads IEEE-695 absolute-format files
Reload
-
Re-downloads the target program
UploadHex
UH
Outputs data to an Intel HEX-format file
2.1.3 Register Operation Commands
Command Name
Short Name
Contents
Register
R
Checks and sets a register value
2.1.4 Memory Operation Commands
Commnad Name
Short Name
Contents
DumpByte
DB
Displays the contents of memory (in 1-byte units)
62
2. Table of Script Commands
DumpWord
DW
Displays the contents of memory (in 2-byte units)
SetMemoryByte
MB
Checks and changes memory contents (in 1-byte units)
SetMemoryWord
MW
Checks and changes memory contents (in 2-byte units)
FillByte
FB
Fills a memory block with the specified data (in 1-byte units)
FillWord
FW
Fills a memory block with the specified data (in 2-byte units)
Move
-
Moves memory blocks
2.1.5 Assemble/Disassemble Commands
Command Name
Short Name
Contents
Assemble
A
Line-by-line assembly
DisAssemble
DA
Disassembles memory contents line by line
Module
MOD
Displays modules names
Scope
-
Sets and checks the effective local symbol scope
Section
SEC
Checks section information
Bit
-
Checks and sets bit symbols
Symbol
SYM
Checks assembler symbols
Label
-
Checks assembler labels
Express
EXP
Displays an assembler expression
2.1.6 Software Break Setting Commands
Command Name
Short Name
Contents
SoftwareBreak
SB
Sets and checks software breaks
SoftwareBreakClear
SBC
Clears software breaks
SoftwareBreakClearAll
SBCA
Clears all software breaks
SoftwareBreakDisable
SBD
Disables software breakpoints
SoftwareBreakDisableAll SBDA
Disables all software breaks
SoftwareBreakEnable
SBE
Enables software breakpoints
SoftwareBreakEnableAll
SBEA
Enables all software breaks
BreakAt
-
Sets a software breakpoint by specifying a line No.
BreakIn
-
Sets a software breakpoint by specifying a function
2.1.7 Script/Log File Commands
Command Name
Short Name
Contents
Script
-
Opens and executes a script file
Exit
-
Exits the script file
Wait
-
Waits for an event to occur before command input
Pause
-
Waits for user input
Sleep
-
Halts for user input until the specified time has elapsed
Logon
-
Outputs the screen display to a log file
Logoff
-
Stops the output of the screen display to a log file
2.1.8 Program Window Control Commands
Command Name
Short Name
Contents
Func
-
Checks function names and displays the contents of functions
63
Path
-
Sets and checks the search path
File
-
Checks a filename and displays the contents of that file
2.1.9 C Language Debugging Commands
Command Name
Short Name
Contents
Print
-
Check value of specified C variable expression
Set
-
Set specified data in specified C variable expression
2.1.10 Utility Commands
Command Name
Short Name
Contents
Radix
-
Sets and checks the radix for numerical input
Alias
-
Specifies and checks command alias definitions
UnAlias
-
Cancels the alias defined for a command
UnAliasAll
-
Cancels all aliases defined for commands
Help
H
Displays the help of script commands
Version
VER
Displays the version No.
Date
-
Displays the date
Echo
-
Displays messages
Quit
-
Quits Debugger
CD
-
Specifies and checks the current directory
64
2. Table of Script Commands
2.2 Table of Script Commands (alphabetical order)
Command Name
Short Name
Contents
Alias
-
Specifies and checks command alias definitions
Assemble
A
Line-by-line assembly
Bit
-
Checks and sets bit symbols
BreakAt
-
Sets a software breakpoint by specifying a line No.
BreakIn
-
Sets a software breakpoint by specifying a function
CD
-
Specifies and checks the current directory
Date
-
Displays the date
DisAssemble
DA
Disassembles memory contents line by line
DumpByte
DB
Displays the contents of memory (in 1-byte units)
DumpWord
DW
Displays the contents of memory (in 2-byte units)
Echo
-
Displays messages
Exit
-
Exits the script file
Express
EXP
Displays an assembler expression
File
-
Checks a filename and displays the contents of that file
FillByte
FB
Fills a memory block with the specified data (in 1-byte units)
FillWord
FW
Fills a memory block with the specified data (in 2-byte units)
Func
-
Checks function names and displays the contents of functions
Go
G
Program execution with breakpoints
GoFree
GF
Free run program execution
Help
H
Displays the help of script commands
Label
-
Checks assembler labels
Load
L
Downloads the target program
LoadHex
LH
Downloads an Intel HEX-format file
LoadIeee
LI
Downloads IEEE-695 absolute-format files
LoadSymbol
LS
Loads source line/ASM symbol information
Logoff
-
Stops the output of the screen display to a log file
Logon
-
Outputs the screen display to a log file
Module
MOD
Displays modules names
Move
-
Moves memory blocks
OverStep
O
Overstep execution of source lines
OverStepInstruaction
OI
Overstep execution of instructions
Path
-
Sets and checks the search path
Pause
-
Waits for user input
Print
-
Check value of specified C variable expression.
Quit
-
Quits Debugger
Radix
-
Sets and checks the radix for numerical input
Register
R
Checks and sets a register value
Reload
-
Re-downloads the target program
Reset
-
Resets the target MCU
Return
RET
Executes a source line return
ReturnInstruction
RETI
Executes an instruction return
Scope
-
Sets and checks the effective local symbol scope
Script
-
Opens and executes a script file
Section
SEC
Checks section information
65
Set
-
Set specified data in specified C variable expression
SetMemoryByte
MB
Checks and changes memory contents (in 1-byte units)
SetMemoryWord
MW
Checks and changes memory contents (in 2-byte units)
Sleep
-
Halts for user input until the specified time has elapsed
SoftwareBreak
SB
Sets and checks software breaks
SoftwareBreakClear
SBC
Clears software breaks
SoftwareBreakClearAll
SBCA
Clears software breaks
SoftwareBreakDisable
SBD
Disables software breakpoints
SoftwareBreakDisableAll SBDA
Disables all software breaks
SoftwareBreakEnable
SBE
Enables software breakpoints
SoftwareBreakEnableAll
SBEA
Enables all software breaks
Status
-
Checks the operating status of the MCU
Step
S
Step execution of source line
StepInstruction
SI
Step execution of instructions
Stop
-
Stops program execution
Symbol
SYM
Checks assembler symbols
UnAlias
-
Cancels the alias defined for a command
UnAliasAll
-
Cancels all aliases defined for commands
UploadHex
UH
Outputs data to an Intel HEX-format file
Version
VER
Displays the version No.
Wait
-
Waits for an event to occur before command input
66
3. Error Messages
3.
Error Messages
Please click an error number.
No.
Error Message
Notes and Action
INTERNAL ERROR:Unset err number
Contact your nearest distributor.
Error Message
Notes and Action
200
Can't open more xxxxx window.
The maximum number of the specified window
is already open.
201
202
203
204
205
206
207
209
Can't Create xxxxx window.
KD38 is already exist.
Project file (xxxxx) is broken.
File not found (xxxxx).
Path not found (xxxxx).
Not enough memory.
Can't execute.
Failed to read/write data to the archive xxxxx
(CODE: n).
Failed to read/write data to the file xxxxx
(CODE: n).
0
No.
210
No.
Error Message
Notes and Action
400
Can't change view mode.
401
Can't find source file (xxxxx).
402
Can't find search string (xxxxx).
403
Line number of Source File (xxxxx) is over 2.
The display starting address does not match
the first line of the source file, or the specified
source file cannot be found.
Specified source file was not found. Use the
PATH command, or the [Environment] ->
[Customize] menu items to specify the
directory containing the source file.
The specified search string was not found
between the starting position and end.
Because the source file has more lines than
can be displayed, the file cannot be displayed
in the Source Window. Switch to disassemble
display mode.
No.
600
601
602
603
604
605
Error Message
Notes and Action
The address value is out of range.
Can not open file(xxxxx).
Can't find file (xxxxx).
Can not save because the line number is over
xxxxx.
Can not save as the file (xxxxx). [system error:
xxxxx]
Can not edit this file (xxxxx) because it is being
67
used by another process.
No.
800
801
802
803
804
Error Message
Notes and Action
Value is out of range.
Can't find the register information file.
There's incorrect line in register information
file.
Not enough memory.
Description of expression is illegal.
No.
Error Message
1000
1001
Address value is out range for scroll area.
The length of the set data is different from the
length of the displayed data.
Contact your nearest distributor.
Notes and Action
No.
Error Message
1200
1201
Address value is out range for scroll area.
The length of the set data is different from the
length of the displayed data.
Notes and Action
No.
Error Message
Notes and Action
1400 Sampling period value is out of range.
1401 Address value is out of range.
No.
Error Message
Notes and Action
1600 Can't add new watch point because it exceeds
limit of watch point number. Max number is
(num).
1601 Address value is out of range.
1602 Data value is out of range.
1603 Bit value is out of range.
1604 Can't save watch points.
No.
Error Message
Notes and Action
1800 There are no symbol information.
1801 The expression is too long.
1802 Can't save c watch points.
No.
Error Message
Notes and Action
2000 Can't open Script File (xxxxx).
2001 Script File is not open.
2002 Can't open Log File (xxxxx).
2003 Can't open more Log File.
2004 Can't open Log File.
2005 File (xxxxx) is already log on.
2006 Can't open View File (xxxxx) for new/add.
2007 Can't save command history.
No.
Error Message
Notes and Action
2200 Address value is out of range.
68
3. Error Messages
2201 Data value is out of range.
2202 Start address is larger than end address.
2203 Value is under (1).
2204 Data value is out of range.
2205 Data is not set.
No.
Error Message
Notes and Action
2400 Illegal endi. (xxxxx line)
2401 Illegal endw. (xxxxx line)
2402 INTERNAL ERROR:ER_BAT_EOF
2403 Can't find endi. (xxxxx line)
2404 Line length is overflow. (xxxxx line)
2405 Nest level is overflow. (xxxxx line)
2406 Can't find Script File (xxxxx).
2407 Can't read Script File (xxxxx).
2408 Description is illegal. (xxxxx line)
2409 Can't find endw. (xxxxx line)
2410 The nest level exceeds the limit (num).
2411 INTERNAL ERROR:ER_BAT_NONE
Contact your nearest distributor
2412 Illegal break. (xxxxx line)
No.
Error Message
Notes and Action
2600 Syntax error.
2601 Command name is wrong.
2602 Too many aliases.
2603 You can register the only command name for
alias.
2604 Can't use the command now.
2605 Can't up more.
2606 Can't down more.
2607 Can't set break point in this function.
2608 The start address larger than the end address.
2609 Can't register that token for alias.
2610 Can't register that token for alias.
2611 Can't find File (xxxxx).
2612 Data value is out of range.
No.
Error Message
Notes and Action
6000 INTERNAL ERROR:ER_ENV_END
No.
Contact your nearest distributor.
Error Message
Notes and Action
6200 SYMBOL file is illegal.
6201 Loading is canceled.
6202 Can't find SYMBOL file (xxxxx).
6203 Can't get enough memory.
6204 Cannot open temporary file.
No.
Error Message
Notes and Action
69
6402 Can't find symbol.
6403 Description of expression is illegal.
6404 Description is illegal.
6405 Can't find scope.
6406 Can't find symbol.
6407 Can't find function.
6408 Right hand side of the expression is illegal.
6409 The Type of structure (union) are not same.
6410 Can't assign.
6411 Can't find type.
6412 Not supported float (double) operation.
6413 The operation does not be allowed to pointers.
6414 The operation does not be allowed to the
pointer.
6415 Can't decrease by pointer.
6416 Divided by 0.
6417 The operator is not supported.
6418 Type information is broken.
6419 Left value must be the pointer.
6420 Left value must be a structure or an union.
6421 Can't find member.
6422 Left value must be reference of a structure or an
union.
6423 Left value is illegal.
6424 The operand must be a value.
6425 The operand is able to be opposite sign.
6426 Can't get address value.
6427 The array variable is illegal.
6428 The essential number of array is illegal.
6429 The operand must be an address value.
6430 Type casting for register variable is not be
supported.
6431 The type of type casting is illegal.
6432 Type casting for that type is not be supported.
6433 This expression can not be exchanged for some
address value.
No.
Error Message
Notes and Action
6601 Address value is out of range.
6602 Target program is already stopped.
6603 The number of break point is over the limit
(num).
6604 The break point isn't defined at that address.
6605 Data value is out of range.
6606 INTERNAL ERROR: ER_IN1_ILLEGAL_MODE Contact your nearest distributor.
has happen. (in xxxxx)
6607 Can't read/write, because there are no memory
at that area.
6608 Register value is out of range.
6609 Can't execute that command, when the target
70
3. Error Messages
program is running.
6610 Start address is larger than end address.
6611 STOP execution.
6612 Can't search more on the stack.
6613 Specified times of number is over than 65535.
6614 INTERNAL ERROR: The memory of the odd
number byte cannot be dumped by the Word
access.
6615 Memory alignment error.
Contact your nearest distributor.
6616 Illegal register is specified.
No.
Error Message
Notes and Action
6800
The process is canceled.
6801
Can't execute this command while some source
windows are in editor mode.
No.
Error Message
Notes and Action
10000 Cannot find source file (xxxxx).
10001 The number of lines of source file (xxxxx) is over
the limit (num).
10002 The address value is out of range.
10003 Cannot open file (xxxxx).
10004 Illegal file format.
10005 Cannot read the file saved by simulator
debugger.
10006 Cannot read the file saved by emulator
debugger.
10007 Not enough memory for display all function.
No.
Error Message
Notes and Action
10200 Operation code (code) not found.
10201 File (xxxxx) not found.
10202 Duplicate event set in xxxxx.
10203 File format error (xxxxx).
No.
Error Message
Notes and Action
10400 Can't execute more come instruction.
10401 Can't execute more step instruction.
10402 Cycle value is out of range.
10403 Can't find that address.
10404 Can not open file (xxxxx).
10405 Can not read file (xxxxx).
10406 The display mode is not able to change except
the BUS mode. Trace data is not enough or is
abnormal.
71
No.
Error Message
Notes and Action
10600 Can't open BUTTON file (xxxxx).
10601 BUTTON file is illegal.
No.
Error Message
Notes and Action
10800 Illegal file format.
10801 Address value is out of range.
10802 Data value is out of range.
No.
Error Message
Notes and Action
11000 File format error (xxxxx).
11001 File (xxxxx) not found.
11002 Can't file (xxxxx) open.
11003 Failed to read/write data to the file %s
(CODE: %d).
11004 Failed to read/write data to the archive %s
(CODE: %d).
11005 Data value is out of range.
11006 Function not found.
11007 Bit Symbol not found.
11008 Can not set trace points while program is
running.
11009 Specify BYTE access for ODD address.
No.
Error Message
Notes and Action
11200 Combination of bus width and access condition.
11201 The start cycle larger than the end cycle.
11202 HardwareBreak command cannot be used while
H/W Break Point Setting Window opens.
11203 TracePoint command cannot be used while
Trace Point Setting Window, Time
Measurement Window, MR Trace/Analyze
Window or Task Trace/Analyze Window opens.
11204 These trace data can't disassemble.
11205 Can't execute this command with PC4700L.
11206 Already set hard ware break.
11207 Cycle value is out of range.
No.
Error Message
Notes and Action
11400 Can't open temporary file.
11401 Can't delete temporary file.
11$02 Can't open I/O data file(filename).
11403 The I/O data not set.
11404 The Output file of the same already set.
72
3. Error Messages
11405 Data not found.
11406 The start cycle larger than the end cycle.
11407 The Output port already set.
11408 There is no data in the Input file.
11409 Illegal file format.
11410 Can't open file.
11411 Can't open ( filename ).
11412 Address value is out of range.
No.
Error Message
Notes and Action
11600 Can't execute this command.
11601 Already set hard ware break.
11602 Combination of bus width and access condition.
11603 The start cycle larger than the end cycle.
11604 HardwareBreak command cannot be used while
state transition break window opens.
11605 TracePoint command cannot be used while
State Transition Trace Window,
Time Measurement Window, MR Trace/Analyze
Window or Task Trace/Analyze Window opens.
11606 These trace data can't disassemble.
11607 Cycle value is out of range.
No.
Error Message
Notes and Action
11800 The I/O data not set.
11801 Can't open ( filename ).
11802 Can't open temporary file.
11803 Address value is out of range.
No.
Error Message
Notes and Action
16000 INTERNAL ERROR: Already connected with the Contact your nearest distributor.
target.
16001 INTERNAL ERROR: Fork error has happen.
Contact your nearest distributor.
16002 Can't find Host Name (xxxxx).
16003 INTERNAL ERROR: The Baud rate is illegal.
Contact your nearest distributor.
16004 The connection with the target isn't created.
16005 Can't connect with the target.
16006 INTERNAL ERROR: The Time of time out is out Contact your nearest distributor.
of range.
16007 Time Out ERROR.
Contact your nearest distributor.
16008 INTERNAL ERROR: Can’t disconnect with the
target.
16009 INTERNAL ERROR: Can’t send given size data. Contact your nearest distributor.
16010 INTERNAL ERROR: Parameter is illegal.
Contact your nearest distributor.
16011 Illegal Host Name.
73
16012 Communication ERROR. The connection with
the target is closed.
16013 Communication ERROR. Can't send data.
16014 Communication ERROR. Can't accept data.
16015 Target is already used.
16016 Specified communications interface doesn't
support.
16017 LAN I/F can't be used on Windows3.1.
16018 Parallel connection doesn't support on Windows
NT.
16019 Setting of the communications interface is
illegal.
16020 OverRun ERROR with serial communications.
No.
Error Message
Notes and Action
16200 Address value is out of range.
16201 That baud rate has not yet supported.
16202 Bit number is out of range.
16203 STOP execution.
16204 Data value is out of range.
16205 Monitor File (xxxxx) is broken.
16206 Can't find File (xxxxx).
16207 Target system is not constructed properly.
16208 INTERNAL ERROR: ER_IN2_ILLEGAL_MODE Contact your nearest distributor.
has happen. (in xxxxx)
16209 Mask value is out of range.
16210 Counter of measurement time is overflow.
16211 The version of string1 and the firmware on the
target are not same.
16212 Pass count value is out of range.
16213 Can't execute that command, when the target
program is running.
16214 Target MCU is reset state. Please reset target
systems.
16215 Target MCU is unable to reset. Please reset
target systems.
16216 Target MCU is HOLD state. Please reset target
systems.
16217 Target MCU is not given clock. Please reset
target systems.
16218 Target MCU is not given power. Please reset
target systems.
16219 INTERNAL ERROR: Break point number is
illegal.
Contact your nearest distributor.
16220 Please download the firmware to target.
16221 Can't download firmware.
74
3. Error Messages
16222 Can't find trace data which is able to refer.
16223 Cycle value is out of range.
16224 Target MCU is not under control. Please reset
target systems.
16225 First data is larger than second data.
16226 First address is larger than second address.
16227 No event set on the state transition path.
16228 Time out value is out of range.
16229 Process ID value is out of range.
16230 Communication protocol error. (Argument error) Contact your nearest distributor.
16231 There was sent undefined data from PC4700.
16232 Check sum error of the received data occurred.
16233 The specified data do not exist.
16234 The target program is running.
16235 The target program is not running.
16236 The measurement has already been stopping.
16237 The measurement has already been being
executed.
16238 The measurement is not completed.
16239 There is no trace data of the specified cycle.
16240 There is no trace data.
16241 The measurement counter of time overflowed.
16242 POF state was released by compulsory reset.
16243 A number of setting points exceeds the range.
16244 The program break is not set.
16245 Source line information is not loaded.
16246 The trigger mode is not a software output mode.
16247 The exception processing was detected while
executing the step.
16248 Function range error.
16249 The writing error to EEPROM occurred.
16252 Unexecutable command code was specified.
16253 The processor mode and the target system are
the disagreements. xxxxx mode is used.
16254 The specified bank isn't defined in the
expansion memory.
16255 The bank set up is duplicated.
16256 The specified area includes the debugging
monitor memory area.
16257 The specified area includes the debugging
monitor work area.
16258 Flash ROM deletion error occurred. Flash ROM
deletion error occurred.
16259 Flash ROM verify error occurred.
16260 Specification area includes the internal (flash)
75
ROM area.
16261 When Word is specified for a size, the odd
number address cannot be specified.
16262 Can not spesify the larger total bank size than
the total emulation memory size.
16263 The bank specified is defined as EXTERNAL.
16264 The setting value is invalid in this processor
mode.
16265 RDY signal of MCU is Low.
16266 HOLD signal of MCU is Low.
16267 All program break points in the spesified bank is
cleared.
16268 Please specify the address in the emulation
memory area.
16269 The mistake is found in setting the emulation
memory area.
16270 The specified area has already been used in the
debugging monitor bank address.
16271 Too many emulation memory area specification.
16272 The bank from 0 to 3 cannot be specified.
16273 The mistake is found in the specification of the
debugging monitor bank address.
16274 The mistake is found in the specification of the
debugging monitor work address.
16275 2Cannot specifiy to extend more than two
banks.
16276 Please specify the address in the emulation
memory area.
16277 Too many ROM area specification.
16278 Start address is larger than end address.
16279 Too many DMA area specification.
16281 The mistake is found in the specification of the
DMA area.
16282 When Word is specified for a size, the odd
number address cannot be specified.
16283 Too many memory mapping specification.
16284 The mistake is found in the specification of the
memory mapping.
16285 Please specify the address in the emulation
memory area.
16286 The mistake is found in setting the emulation
memory area.
16287 The specified area has already been used in the
debugging monitor bank address.
16288 Too many emulation memory area specification.
16289 The bank from 0 to 3 cannot be specified.
16290 The mistake is found in the specification of the
debugging monitor bank address.
76
3. Error Messages
16291 The mistake is found in the specification of the
debugging monitor work address.
16292 Cannot specifiy to extend more than two banks.
16293 Please specify the address in the emulation
memory area.
16294 Too many ROM area specification.
16295 Start address is larger than end address.
16296 Too many DMA area specification.
16298 The mistake is found in the specification of the
DMA area.
16299 Too many 8 bits bus mode area specification.
16300 The mistake is found in the specification of the
8-bit bus mode area.
16301 When Word is specified for a size, the odd
number address cannot be specified.
16302 The S/W breakpoint cannot be set in the SFR
area and the RAM area.
16303 The S/W breakpoint cannot be set in the flash
ROM area.
16304 The S/W breakpoint cannot be set.
16305 The H/W breakpoint cannot be set in the SFR
area and the RAM area.
16306 The H/W breakpoint cannot be set in the flash
ROM area.
16307 The H/W breakpoint cannot be set.
16308 Too many memory mapping specification.
16309 The mistake is found in the specification of the
memory mapping.
16314 Work Address value is out of range.
16315 The specified zone number does not exist.
16316 Flash ROM verify error occurred.
16317 The sent command cannot be executed in this
H/W environment.
16318 The specified event is used in an another mode.
16319 The chip break 0 is used in an another mode.
16320 An uninitialized interrupt vector was detected.
16321 This break function can't be set up in the ROM
territory or the memory territory which doesn't
exist.
16322 This break function can't be set up in the odd
number address.
16323 This break function can't be set up in the middle
of 32bit instruction.
16324 A memory territory which doesn't exist was
manipulated. Or, A memory territory was
manipulated on the condition which wasn't
forgiven.(address=H'xxxxx)
16325 A specified reference section number is outside
77
the range.
16326 Tracing data file can't be open.
16327 Tracing data can't be read from the file.
16328 The specified break condition does not
correspond to the trace output mode.
16329 This break function can't be set up in the LSB
side parallel instruction.
16330 Can't execute from the LSB side parallel
instruction.
16331 The received data is illegal. The received data
must be 'xxxxx'. But 'yyyyy' is received.
16332 INIT code is received.
16347 Specification area includes not only the internal
(flash) ROM area but also other area.
16348 Specification area includes the SFR area and
the internal RAM area.
No.
Error Message
Notes and Action
16400 INTERNAL ERROR:Already connected with the Contact your nearest distributor.
target.
16401 INTERNAL ERROR:Fork error has happen.
Contact your nearest distributor.
16402 Can't find Host Name (hostname).
16403 INTERNAL ERROR:The Baud rate is illegal.
Contact your nearest distributor.
16404 The connection with the target isn't created.
16405 Can't connect with the target.
16406 INTERNAL ERROR:The Time of time out is out
of range.
Contact your nearest distributor.
16407 Time Out ERROR.
16408 INTERNAL ERROR:Can't disconnect with the
target.
Contact your nearest distributor.
16409 INTERNAL ERROR:Can't send given size data. Contact your nearest distributor.
16410 INTERNAL ERROR: Parameter is illegal.
Contact your nearest distributor.
16411 Illegal Host Name.
16412 Communication ERROR.
The connection with the target is closed.
16413 Communication ERROR.Can't send data.
16414 Communication ERROR.
Can't send data.
16415 Target is already used.
16416 Parallel connection doesn't support on Windows
NT.
16417 Can't find Simulator Engine.
No.
Error Message
Notes and Action
16600 Address value is out of range. Address value is
out of range.
78
3. Error Messages
16601 That baud rate has not yet supported.
16602 Bit number is out of range.
16603 STOP execution.
16604 Data value is out of range.
16605 Monitor File ( filename ) is broken.
16606 Can't find File ( filename ).
16607 Target system is not constructed properly.
16608 INTERNAL ERROR:ER_IN2_ILLEGAL_MODE
has happen(in string1).
Contact your nearest distributor.
16609 Mask value is out of range.
16610 Counter of measurement time is overflow.
16611 The version of KD38 and the firmware on the
target are not same.
16612 Pass count value is out of range.
16613 Can't execute that command, when the target
program is running.
16614 Target MCU is reset state.
Please reset target systems.
16615 Target MCU is unable to reset.
Please reset target systems.
16616 Target MCU is HOLD state.
16617 Target MCU is not given power.
16618 INTERNAL ERROR:Break point number is
illegal.
Contact your nearest distributor.
16619 Please download the firmware to target
16620 Can't download firmware.
16621 Download firmware is finished.
Please restart KD38.
16622 Can't find trace data which is able to refer.
16623 Cycle value is out of range.
16624 Target MCU is not under control.
Please reset target systems.
16625 First data is larger than second data.
16626 First address is larger than second address.
16627 First address is larger than second address.
16628 No event set on the state transition path.
16629 Process ID value is out of range.
16630 Communication protocol error.(Argument error)
Contact your nearest distributor.
16631 Check sum error of the received data occurred. Contact your nearest distributor.
16632 The specified data do not exist.
16633 The target program is running.
16634 The target program is not running.
16635 The measurement has already been stopping.
16636 The measurement has already been being
executed.
79
16637 The measurement is not completed.
16638 There is no trace data of the specified cycle.
16649 There is no trace data.
16640 The measurement counter of time overflowed.
16641 POF state was released by compulsory reset.
16642 A number of setting points exceeds the range.
16643 The program break is not set.
16644 Source line information is not loaded.
16645 Source line information is not loaded.
1664& The exception processing was detected while
executing the step.
16647 Function range error.
16648 The writing error to EEPROM occurred.
1665) There was sent undefined data from simulator.
Contact your nearest distributor.
16650 The received data is illegal.
Contact your nearest distributor.
The received data must be ( data ). But ( data )
is received.
16651 INIT code is received.
Contact your nearest distributor.
16652 Can't read/write, because there are no memory
at that area.
16653 Number of points exceeds the limit ( num ).
16654 Point already set.
16655 Breakpoint of other type already set.
16656 No hardware breakpoint set at specified
address.
16657 Can't get enough memory.
16658 Can't set more I/O script file.
16659 Can't set more virtual output.
16660 Specified vector No. out of range.
16661 Specified level of priority out of range.
16662 Stack trace mode is not enabled.
16663 The simulator engine execution error occurred.
16664 Undefined instruction was executed.
16665 Software break point can't be set up in the
address.
16666 Software break point can't be set up in the odd
number address.
16667 Software break point can't be set up in the
middle of 32bit instruction.
16668 Software break point can't be set up in the LSB
side parallel instruction.
16669 A memory territory which doesn't exist was
manipulated. Or, A memory territory was
manipulated on the condition which wasn't
forgiven.
16670 Can't execute from the LSB side parallel
80
3. Error Messages
instruction.
No.
Error Message
Notes and Action
16800 . Can't find '{'.(line: num )
16801 Can't find '}'. (line: num )
16802 Can't find '('.(line: num )
16803 Symbol isn't defined. (line: num , token: string )
16804 Can't find ')'.(line: num )
16805 Description of expression is illegal. (line: num ,
token: string )
16806 Nest level of the if statement is overflow. (line:
num )
16807 Nest level of the while statement is overflow.
(line: num )
16808 Too many the break statement. (line: num )
16809 There is no if statement corresponding to the
else statement. (line: num )
16810 Unknown token. (line: num , token: string )
16811 Can't open the ( filename ) file
16812 The ( filename ) file is not a file made in the I/O
window.
16813 The description of the memory variable is illegal.
(line: num )
No.
Error Message
Notes and Action
17000 INTERNAL ERROR:External frash memory
rewrite module parameter is wrong.
17001 Can't find FTD file.
17002 The FTD file is broken.
17003 The number of External flash rom is over.
17004 INTERNAL ERROR:The device number is
illegal.
17005 An Error was detected in work ram area activate
commands.
17006 An Error was detected in work ram area activate
commands.
17007 An Error was detected in external flash rom area
activate commands.
No.
Error Message
Notes and Action
20000 Task with specified task No. not found.
20001 Context of specified task No. not found.
20002 Corrupted MR data.
20003 Can't get enough memory.
No.
Error Message
Notes and Action
81
20200 History of the system call issue that conforms to
the search condition cannot be found.
No.
Error Message
Notes and Action
20400 Can't use Task Pause function.
20401 Task Pause function (xxxxx) was failed.
No.
Error Message
Notes and Action
20600 Can't use Task Trace Window without setting
real-time OS information.
No.
Error Message
Notes and Action
20800 The save file name (xxxxx) is wrong.
20801 Can't find symbol (xxxxx) of MR.
20802 Initialization routine of MR is not executed.
20803 Can't find the task of the specified task number.
20804 Priority out of range.
20805 Task ID out of range.
20806 Flag ID out of range.
20807 Semaphore ID out of range.
20808 Mailbox ID out of range.
20809 Memory pool ID out of range.
20810 Cyclic handler ID out of range.
20811 Address out of range.
20812 Cannot invoke system call.
20813 System call not invoked.
20814 System call not completed.
20815 Address value is out of range.
20816 File Name is illegal.
20817 Corrupted MR data.
20818 Can't get enough memory.
No.
Error Message
Notes and Action
26000 Address value is out of range.
26001 Description of Assembly language is illegal.
26002 Address value for JUMP is out of range.
26003 Operand value is out of range.
26004 Description of expression is illegal.
26005 Addressing mode specified is not appropriate.
26006 INTERNAL ERROR: 'ALIGN' is multiple
specified in '.SECTION'.
Contact your nearest distributor.
26007 Operand value is undefined.
26008 Bit-symbol is in expression.
26009 Invalid bit-symbol exist.
82
3. Error Messages
26010 Symbol value is not constant.
26011 Same items are multiple specified.
26012 Same kind items are multiple specified.
26013 Characters exist in expression.
26014 Format specified is not appropriate.
26015 Invalid symbol definition.
26016 Invalid reserved word exist in operand.
26017 INTERNAL ERROR: 'JMP.S' operand label is
not in the same section.
Contact your nearest distributor.
26018 Reserved word is missing.
26019 No space after mnemonic or directive.
26020 INTERNAL ERROR: No '.FB' statement.
Contact your nearest distributor.
26021 INTERNAL ERROR: No '.SB' statement.
Contact your nearest distributor.
26022 INTERNAL ERROR: No '.SECTION' statement.
Contact your nearest distributor.
26023 Operand value is not defined.
26024 Operand size is not appropriate.
26025 Operand type is not appropriate.
26026 INTERNAL ERROR:Section attribute is not
defined.
Contact your nearest distributor.
26027 INTERNAL ERROR: Section has already
determined as attribute.
Contact your nearest distributor.
26028 INTERNAL ERROR: Section name is missing.
Contact your nearest distributor.
26029 INTERNAL ERROR: Section type is not
appropriate.
Contact your nearest distributor.
26030 INTERNAL ERROR: Section type is multiple
specified.
Contact your nearest distributor.
26031 Size or format specified is not appropriate.
26032 Size specified is missing.
26033 String value exist in expression.
26034 Symbol is missing.
26035 Symbol is multiple defined.
26036 Symbol is missing.
26037 Symbol is multiple defined.
26038 Invalid operand exist in instruction.
26039 Syntax error in expression
26040 Invalid operand exist in instruction.
26041 Operand expression is not completed.
26042 Too many operand.
26043 Too many operand data.
26044 Undefined symbol exist.
26045 Value is out of range.
26046 Division by zero.
26047 INTERNAL ERROR:'.VER' is duplicated.
Contact your nearest distributor
26048 '#' is missing.
26049 ',' is missing.
83
26050 ']' is missing.
26051 ')' is missing.
26052 INTERNAL ERROR: Symbol defined by external Contact your nearest distributor.
reference data is defined as global symbol.
26053 Invalid operand exist in instruction.
26054 Quote is missing.
26055 Right quote is missing.
26056 Can't get enough memory.
26057 Invalid chip mode.
26058 ':' is missing.
26059 Absolute addressing is not avail.
26060 Direct addressing is not avail.
26061 Invalid addressing mode declaration included.
26062 Syntax error in indexed addressing expression.
26063 '(' is missing.
26064 Internal error.
26065 Operand value of direct addressing is out of
range.
26066 Operand value of absolute addressing is out of
range.
26067 Operand value of absolute long addressing is
out of range.
26068 Operand value of stack relative addressing is
out of range.
26069 Operand value is illegal.
26071 An odd number address can't be specified.
No.
Error Message
Notes and Action
26200 Line number is illegal.
26201 Can't find right bracket ')'.
26202 The Number of Macro constant is over the limit
(num).
26203 Immediate value is out of range.
26204 Prefix which gives radix of the constant is illegal.
26205 Description of indirect reference is illegal.
26206 Can't find end of strings (xxxxx).
26207 Description of expression is illegal.
26208 Macro constant (xxxxx) isn't defined.
26209 Symbol (xxxxx) isn't defined.
26210 Immediate value is illegal.
26211 Divide by 0.
26212 The value is over the maximum value of which
can be treated by MCU.
26213 Register name is using for macro variable
name.
84
3. Error Messages
No.
Error Message
Notes and Action
26400 Address value is out of range.
26401 Bit number is out of range.
26402 File (xxxxx) is broken.
26403 Can't find File (xxxxx).
26404 Can't find sub routine information.
26405 Illegal character in the strings.
26406 INTERNAL ERROR: ER_IN2_ILLEGAL_MODE Contact your nearest distributor
has happen. (in xxxxx)
26407 Can't find that line number.
26408 Multiple definition of symbol/label.
26409 There are no code at that line.
26410 Can't get enough memory.
26411 Can't find scopes.
26412 Can't find section information.
26413 Can't find source lines which correspond to that
address.
26414 Can't find symbol (xxxxx).
26415 Can't find the scopes which include that
address.
26416 Loading is canceled.
26417 INTERNAL ERROR: The end of section
information.
Contact your nearest distributor.
26418 INTERNAL ERROR: The end of section
information.
Contact your nearest distributor.
26419 The register name is wrong.
26420 Can't find Source File (xxxxx).
26421 Unable to read Load Module File (xxxxx).
26422 The PATH name is incorrect.
26423 Cannot open the save file (xxxxx).
26424 Can't open SYSROF file.
26425 Can't read SYSROF file.
26426 Illegal file format. (no absolute format file)
26427 Illegal file format.
26428 Can't get enough memory.
26429 Can't find file.
26430 There are no address at that line.
26431 Can't find the function which correspond to that
source line.
26432 Can't find the scopes which include that
address.
26433 Can't find symbol.
26434 Can't find the function which correspond to that
source line.
85
26435 Loading is canceled.
26436 INTERNAL ERROR: ER_LOAD_SYMSCOPE
has happen.
Contact your nearest distributor.
26437 File Name is illegal.
26438 Display source codes.
26439 The path name is too long.
No.
Error Message
Notes and Action
26600 Can't open file (xxxxx).
26601 Can't create file (xxxxx).
26602 Can't close file (xxxxx).
26603 File seek error (in xxxxx).
26604 Out of disk space.
26605 Illegal file format (xxxxx --> xxxxx). (xxxxx)
26606 Out of heap space.
26607 Not yet implemented (xxxxx).
No.
Error Message
Notes and Action
30200 Comfirm the processor mode and the CNVss
terminal level.
30201 Comfirm the emulation memory allocation, or
the mapping.
No.
Error Message
Notes and Action
30400 MCU file is old format.
30401 MCU file is illegal format.
No.
Error Message
Notes and Action
30600 The target clock is external fixation.
No.
Error Message
Notes and Action
38000 The value of Bank is wrong.
86
3. Error Messages
[MEMO]
87
Emulator Debugger for 740 Family Starter-Kit
M3T-KD38 User's Manual
Publication Date:
Nov. 16, 2004
Rev.1.00
Published by:
Sales Strategic Planning Div.
Renesas Technology Corp.
Edited by:
Microcomputer Tool Development Department
Renesas Solutions Corp.
© 2004. Renesas Technology Corp. and Renesas Solutions Corp., All rights reserved. Printed in Japan.
M3T-KD38
User's Manual