1
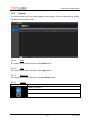
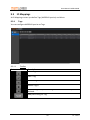
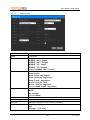
r User Manual LadderLOGIX Industrial Data-Logger cum Cloud Gateway Revision List Revision 1.3.0.0 1.4.1.0 1.6.0.0 Date 27 April 2014 16 June 2014 1 July 2014 Description Match firmware release 1.3.0.0 Match firmware release 1.4.1.0 Match firmware release 1.6.0.0 Preface The data and illustrations found in this document are not binding. We reserve the right to modify our products in line with our policy of continuous product development. The information in this document is subject to change without notice and should not be considered a commitment by M2MLogger. M2MLogger assumes no responsibility for any errors that may appear in this document. The document uses following pictures to get the reader’s attention: Symbol Description Note! Important information to avoid configuration that can cause problems and therefore should be read carefully. Additional information about how to get the most out of LadderLOGIX Contents 1 Warranty ....................................................................................................................... 6 2 Support.......................................................................................................................... 6 3 Terminology................................................................................................................... 7 4 How to use LadderLOGIX................................................................................................ 8 5 Quick Setup Instructions ................................................................................................ 9 5.1 As Cloud (WebFRONT) Data-logger .................................................................................. 9 5.2 As FTP Data-Logger ........................................................................................................... 9 5.3 As USB Data-Logger ........................................................................................................ 10 5.4 As Local Web based Data-Logger .................................................................................... 11 6 About LadderLOGIX...................................................................................................... 12 6.1 Features .......................................................................................................................... 12 6.2 Mounting on DIN rail ...................................................................................................... 12 6.3 Technical Specification ................................................................................................... 13 6.4 Mechanical ..................................................................................................................... 14 6.5 Connections .................................................................................................................... 14 6.5.1 RS232 GSM/GPRS ........................................................................................................... 15 6.5.2 MODBUS RS-485 ............................................................................................................. 15 6.5.3 Power 24VDC .................................................................................................................. 15 6.5.4 LED Indication ................................................................................................................. 16 7 Getting Started ............................................................................................................ 17 7.1 Auto Discovery utility...................................................................................................... 17 7.1.1 Installation ...................................................................................................................... 17 7.1.2 Scanning devices connected over network ..................................................................... 17 7.1.3 Scanning devices connected directly .............................................................................. 17 8 Web UI overview ......................................................................................................... 19 8.1 Browser Requirement ..................................................................................................... 19 8.2 Log in .............................................................................................................................. 19 9 User interface .............................................................................................................. 20 9.1 Control Panel .................................................................................................................. 20 9.2 Device Settings ............................................................................................................... 21 9.2.1 General ........................................................................................................................... 21 9.2.2 System ............................................................................................................................ 22 9.2.3 Explorer .......................................................................................................................... 28 9.3 IO Mappings ................................................................................................................... 29 9.3.1 Tags ................................................................................................................................ 29 9.3.2 Alerts .............................................................................................................................. 33 9.4 Workflow ........................................................................................................................ 38 9.4.1 Toolbar ........................................................................................................................... 38 9.4.2 Manage........................................................................................................................... 39 9.4.3 Tasks ............................................................................................................................... 39 9.5 9.5.1 9.5.2 9.6 9.6.1 9.6.2 9.7 9.8 9.8.1 9.9 9.9.1 9.9.2 9.10 9.10.1 9.11 9.11.1 Monitor Settings ............................................................................................................. 42 Widgets........................................................................................................................... 43 Widget Properties ........................................................................................................... 43 Trend Settings ................................................................................................................. 45 Trend .............................................................................................................................. 45 Trend Properties ............................................................................................................. 45 Account........................................................................................................................... 47 Monitors ......................................................................................................................... 48 Toolbar ........................................................................................................................... 48 Trends ............................................................................................................................. 49 Toolbar ........................................................................................................................... 49 Zoom............................................................................................................................... 49 Tag Stream ...................................................................................................................... 50 Toolbar ........................................................................................................................... 50 Alerts .............................................................................................................................. 51 Toolbar ........................................................................................................................... 51 10 Appendix ..................................................................................................................... 52 10.1 File name wildcards ........................................................................................................ 52 10.1.1 [*] - Asterisk .................................................................................................................... 52 10.2 FTP Commands ............................................................................................................... 52 10.2.1 STOR ............................................................................................................................... 52 11 Troubleshoot ............................................................................................................... 53 11.1 Power LED not ON .......................................................................................................... 53 11.2 Both Run and Error LEDs blinking ................................................................................... 53 11.3 Run LED ON and Error LED blinking ................................................................................ 53 11.4 Run LED OFF and Error LED ON ....................................................................................... 53 11.5 Connecting internet with Static IP Address..................................................................... 53 User Manual LadderLOGIX 1 Warranty M2MLogger warrants that, for a period of 365 days from date of shipment of product, the product shall be free from defects under normal use. Under this warranty it is obligation of M2MLogger to replace any device found defective (within the warranty period) and has been returned to M2MLogger by buyer at buyer's expense. All shipping and insurance costs both ways are the responsibility of buyer. The warranties do not include damage due to negligence, improper installation or operation, accident, tampering with warranty seal or other conditions other than normal use which might cause the Products to fail. THE WARRANTIES AND THE REMEDIES SET FORTH IN THIS SECTION ARE EXCLUSIVE AND IN LIEU OF ALL OTHER WARRANTIES, ORAL OR WRITTEN, EXPRESS OR IMPLIED, EXCEPT AS SET FORTH IN THIS SECTION. M2MLOGGER MAKES NO WARRANTIES, EITHER EXPRESS OR IMPLIED, REGARDING ANY OF THE PRODUCTS, INCLUDING, BUT NOT LIMITED TO, THE IMPLIED WARRANTIES OF MERCHANTABILITY FOR A PARTICULAR PURPOSE. THE ENTIRE RISK AS TO THE QUALITY AND PERFORMANCE OF THE PRODUCT IS WITH BUYER. IN NO EVENT WILL M2MLOGGER BE LIABLE TO BUYER OR ANY OTHER PERSON OR ORGANIZATION FOR ANY DAMAGES, INCLUDING ANY LOST PROFITS, LOST SAVINGS OR INCIDENTAL OR CONSEQUENTIAL DAMAGES, ARISING OUT OF THE USE OR INABILITY TO USE ANY OF THE PRODUCTS, EVEN IF M2MLOGGER HAS BEEN ADVISED OF THE POSSIBILITY OF SUCH DAMAGES, OR FOR ANY CLAIM BY ANY OTHER PARTY. 2 Support To obtain fast and simple support for your LadderLOGIX, please use our website http://www.m2mlogger.com. Here you will find the latest documentation, configuration utilities, drivers etc. You can also contact our support at [email protected]. 6 ver. 1.6.0.0 User Manual LadderLOGIX 3 Terminology Term TCP/IP Extract Transmission Control Protocol/Internet Protocol HTTP Hyper Text Transfer Protocol DHCP Dynamic Host Configuration Protocol Gateway Device Tag Description TCP (Transmission Control Protocol) is a set of rules used along with the Internet Protocol (IP) to send data in the form of message units between computers over the Internet. HTTP is a set of rules for exchanging files (text, graphic images, sound, video and other multimedia files) on the Web. DHCP is a standard protocol that automates the process of configuring network hosts by allowing hosts to obtain IP addresses and configuration parameters. A device that makes it possible to transfer data between networks of different kind, e.g. MODBUS and Internet A MODBUS slave unit that is connected to LadderLOGIX MODBUS register configured in LadderLOGIX. 7 ver. 1.6.0.0 User Manual LadderLOGIX 4 How to use LadderLOGIX Figure 1 How it works 8 ver. 1.6.0.0 User Manual LadderLOGIX 5 Quick Setup Instructions 5.1 Make field connections to device. (See Section 6.5) Discover the device using AutoDiscovery ustility. (See Section 7.1) Log on to Web UI. (See Section 8.2) Go to Control Panel > IO Mapping screen and Configure and Save Tags and Alerts. (See Section 9.3) Go to Control Panel > Settings > System Settings As Cloud (WebFRONT) Data-logger 5.2 Configure and Save Mode Setting. (See Section 9.2.2.1) o Cloud Connector: On o Gateway Mode: Send o Loop: Continuous o Loop Interval: 10 sec o Workflow: Disabled. Configure and Save Server Settings. (See Section 9.2.2.1 ) Power Off and Power On the device. As FTP Data-Logger Configure and Save Mode Setting. (See Section 9.2.2.1) o Cloud Connector: Off o Gateway Mode: Log o Loop: Continuous o Loop Interval: 10 sec o Workflow: Enabled. Configure and Save Logger Settings. (See Section 9.2.2.8) Go to Control Panel > Workflow. (See Section 9.4) o Add Move File Task. Trigger: Any Source Folder: Data Source Filename: tag[*].fdb Destination Folder: Workflow o Add Custom Task. Trigger: Any Executable: Fdb2Csv.exe Arguments: tag[*].fdb Timeout sec(s): 2 o Add FTP Task. 9 ver. 1.6.0.0 User Manual LadderLOGIX 5.3 Trigger: Success Command: STOR “tag[*].csv” o Add Delete File Task. Trigger: Any Folder: Workflow Filename: tag[*].fdb.ftp o Add Delete File Task. Trigger: Any Folder: Workflow Filename: tag[*].fdb.done Save Workflow Power Off and Power On the device. As USB Data-Logger Configure and Save Mode Setting. (See Section 9.2.2.1) o Cloud Connector: Off o Gateway Mode: Log o Loop: Continuous o Loop Interval: 10 sec o Workflow: Enabled. Configure and Save Logger Settings. (See Section 9.2.2.8) Go to Control Panel > Workflow. (See Section 9.4) o Add Move File Task. Trigger: Any Source Folder: Data Source Filename: tag[*].fdb Destination Folder: Workflow o Add Custom Task. Trigger: Any Executable: Fdb2Csv.exe Arguments: tag[*].fdb Timeout sec(s): 2 o Add Move File Task. Trigger: Any Source Folder: Workflow Source Filename: tag[*].csv Destination Folder: USB o Add Delete File Task. Trigger: Any 10 ver. 1.6.0.0 User Manual LadderLOGIX 5.4 Folder: Workflow Filename: tag[*].fdb.done Save Workflow Power Off and Power On the device. As Local Web based Data-Logger Configure and Save Mode Setting. (See Section 9.2.2.1) o Cloud Connector: Off o Gateway Mode: Log o Loop: Continuous o Loop Interval: 10 sec o Workflow: Enabled. Configure and Save Logger Settings. (See Section 9.2.2.8) Go to Control Panel > Monitor Settings and create a Monitor screen. (See Section 9.5) Go to Control Panel > Trend Settings and create a Trend screen. (See Section 9.6) Power Off and Power On the device. Go to Control Panel > Monitors or Control Panel > Trends to view real-time data visualization. 11 ver. 1.6.0.0 User Manual LadderLOGIX 6 About LadderLOGIX LadderLOGIX series comprises of advanced Industrial Cloud gateways that can extend any Industrial network to Cloud. They enhance your capability monitor, analyze and control the performance of your process remotely, from any place in world. These gateway devices can be easily interfaced with: 6.1 Existing PLC, DCS or SCADA system with an MODBUS interface. MINT Intelligent IOs. Features Remote monitoring. WebFRONT Web SCADA Cloud gateway. Web User Interface (Web UI). MODBUS RTU RS-485 & MODBUS Ethernet/IP. File Transfer Protocol (FTP). USB Pen drive data logger. Alerts: SMS, Email. Signal Scaling. Rugged design for rough Industrial conditions. Compact DIN rail mounting. Plug-n-play. Fail-safe for power failures. Over-The-Air (OTA) upgrades. 1KV isolation. LadderLOGIX supports an RS-232 connection through a 9-pin DSUB, MODBUS RS-485 through screw terminals, USB pen drive through USB type A connector and 10/100 Mbps Ethernet through a standard Ethernet connector (RJ-45). It can be configured via a user-friendly Web interface (Web UI). 6.2 Mounting on DIN rail Snap On Snap Off 12 ver. 1.6.0.0 User Manual LadderLOGIX 6.3 Technical Specification Communication Interface Protocol Available Ports Baud Rate Status Indication LEDs 2 Wire, EIA RS485 MODBUS – RTU 1 x RS485 Multi-drop Serial Communication 1 x MODBUS Ethernet/IP 9600, 19200, 38400, 57600, 115200 Power, Module Status, Internet, Cloud, Communication Status Additional Processor Ethernet USB Host Real Time Clock SNTP Email (SMTP) FTP Web Server GSM GPRS Internal Storage MXPXA300 208 MHz 10/100Mbits 1 (USB 2.0) 3000 records MXPXA1000 1Ghz Dual Core 10/100Mbits 1 (USB 2.0) 5000 records Power Voltage Current Power Usage MXPXA300 24VDC ±10% <1A 4 Watts (max) MXPXA1000 24VDC ±10% <1A 5 Watts (max) Isolation Supply to Communication Port 1000 VAC RMS Environmental Operating Temperature 0 to 55 °C 13 ver. 1.6.0.0 User Manual LadderLOGIX Storage Temperature Humidity -10 to 70 °C 30 to 95% RH non-condensing Physical Dimensions Mounting Weight Enclosure Material 35(W) x 101(H) x 120(D) mm DIN Rail 250 gms approx. Molded ABS 6.4 Mechanical Figure 2 Physical Dimensions (mm) 6.5 Connections Figure 3 Field Connections 14 ver. 1.6.0.0 User Manual LadderLOGIX 6.5.1 RS232 GSM/GPRS The 9 pin DSUB – Male connector on the LadderLOGIX contains and RS232 interface. This port can be used to connect GSM/GPRS modem. Pin 1 2 3 4 5 6 7 8 9 6.5.2 Function CD (Carrier Detect) RX (Receive) TX (Transmit) DTR (Data Terminal Ready) GND (Ground) DSR (Data Set Ready) RTS (Request To Send) CTS (Clear To Send) RI (Ring Indicator) MODBUS RS-485 Pin A B Function RS-485 Line A RS-485 Line B A A MODBUS slave LadderLOGIX B B Figure 4 Normal wiring diagram for MODBUS terminal A and B 6.5.3 Pin + - Power 24VDC Function + 24 VDC Ground 15 ver. 1.6.0.0 User Manual LadderLOGIX Power Supply LadderLOGIX AC + 24VDC Line Voltage + GND - DC Figure 5 How to connect AC power 6.5.4 LED Indication Name Power Device Run Internet WebFRONT Error Data Transmission Data Reception Color Off Orange Off Orange Flashing Orange Off Orange Off Orange Off Red Flashing Red Off Flashing Orange Off Flashing Orange 16 Function No Power Power Not running Boot-up or Error Module running No Internet Internet Connected WebFRONT disconnected WebFRONT Connected No Error Unrecoverable Error Error No Transmission MODBUS Transmitting No Reception MODBUS Receiving ver. 1.6.0.0 User Manual LadderLOGIX 7 Getting Started 7.1 Auto Discovery utility The Auto Discovery is a PC-based configuration utility to scan the Ethernet network for connected LadderLOGIX devices so that further configurations can be made to selected device. 7.1.1 Installation Download and run AutoDiscovery.exe utility from: http://www.m2mlogger.com/downloads.htm 7.1.2 Scanning devices connected over network If your LadderLOGIX device(s) are connected over a network, then you should consider following steps: 1. 2. 3. 4. 7.1.3 Power up LadderLOGIX device and connect LadderLOGIX with network. Start AutoDiscovery.exe utility. Select the relevant Network Adapter and select Discover. To configuration a LadderLOGIX device click the Configure button to open up Web UI for the device in Web Browser. Scanning devices connected directly If your device is directly connected to Laptop via straight/cross Ethernet cable, then you should consider following steps: 1. Power up LadderLOGIX device. Do NOT connect Ethernet cable to laptop yet. 17 ver. 1.6.0.0 User Manual LadderLOGIX 2. 3. 4. Start AutoDiscovery.exe utility. Click Connect Directly. On Direct Connect Setup dialogue, select the Network Adapter you will be connecting the LadderLOGIX and click Configure. 5. 6. 7. 8. Click Finish upon successful configuration. Now connect LadderLOGIX with Laptop, make sure data-logger is running. Select the relevant Network Adapter and select Discover. To configuration a LadderLOGIX device click the Configure button to open up Web UI for the device in Web Browser. It your device is connected on LAN and you are having trouble discovering device using AutoDiscovery.exe, try disabling your Antivirus and/or Firewall. AutoDiscovery.exe runs on Dot Net Framework 3.5. Please download and install Dot Net Framework 3.5 from http://www.microsoft.com. 18 ver. 1.6.0.0 User Manual LadderLOGIX 8 8.1 Web UI overview Browser Requirement The web-pages are optimized for Internet Explorer version 9 or later and Google Chrome. Other browsers can work as well, but the web pages might appear differently and some functionality can be limited. The browser must be HTML 5 (with Canvas support) enabled, to use pages like the Monitors and Trends. If it is not, please upgrade to a HTML 5 enabled browser (visit: http://www.html5test.com). 8.2 Log in Open a web browser and enter the IP address of your device (if you know) or click on Configure button in Auto Discovery to launch Web Browser with appropriate IP address of device. For example, if IP Address of device is 192.168.1.2 then you should enter the text below in the address field of the browser and press enter. http://192.168.1.2 Now you should see the login screen: Username: admin Default Password: password 19 ver. 1.6.0.0 User Manual LadderLOGIX 9 9.1 User interface Control Panel Control Panel is the default landing screen for the device. Here you can navigate to different screens for configuration and SCADA visualizations. 20 ver. 1.6.0.0 User Manual LadderLOGIX 9.2 Device Settings At device settings screens you can make configuration changes to device. 9.2.1 General This tab shows the general settings for device. 9.2.1.1 Options Option Serial MAC Address Firmware Name Internet Cloud 9.2.1.2 Button Description Device Serial Number. Unique Device MAC address. Device Firmware version. Device Name; also reflected on network. Internet connection status. WebFRONT connection status. Toolbar Description Refresh General Settings. Save changes to Device Name. Restart device. Upgrade device firmware 21 ver. 1.6.0.0 User Manual LadderLOGIX 9.2.2 System This tab shows the system settings. 9.2.2.1 Mode This setting lets the user configure mode for the device. Option Cloud Connector Gateway mode Loop Loop Interval Description Switched On/Off the Cloud connector [Default On]. Sets the gateway mode: Send – send values to Cloud Log – log values on local storage Send & Log – send values to Cloud and also log on local storage. [Default Send] Sets the loop mode for device. Continuous – loops continuously. Triggered – one iteration; when triggered. [Default Continuous] Sets device loop interval. [Default 5 sec] When the device is running, Average Loop is displayed to give an approximation of actual execution time. Workflow Enable/Disable Workflow. 22 ver. 1.6.0.0 User Manual LadderLOGIX It is advisable to always leave the device connected with Cloud. This will enable you to manage and configure the device online, without going to the field. 9.2.2.2 Server This setting lets the user configure Cloud server for the device. Option Server Region Account Keep-Alive Timeout Keep-Alive Retry Description WebFRONT Cloud server location. [Default webfront.m2mlogger.com]. WebFRONT Cloud server regions. For improved performance select a region that represents best proximity to your device. [Default in-1] WebFRONT account name. Duration to wait for WebFRONT keep-alive message. [Default 30 sec] Number of keep-alive retries to detect a closed WebFRONT connection. [Default 3 sec]. 9.2.2.3 Clock This setting lets user set the device calendar and clock. Option Timezone Description Device time zone. [Default Coordinate Universal Time]. Current Date. Current Month. Current Year. Current Hour in 24 hour format. Current Minutes. Current Seconds. Date Month Year Hour Minutes Seconds 9.2.2.3.1 Button Toolbar Description Manually Sync clock with NTP server. 23 ver. 1.6.0.0 User Manual LadderLOGIX 9.2.2.4 Ethernet This is device Ethernet settings. Option DHCP enabled IP Address Subnet Mask Default Gateway Hour Minutes Seconds Description Ethernet Dynamic Host Configuration Protocol is enabled. Ethernet IP Address Ethernet Subnet Mask. Ethernet default gateway Current Hour in 24 hour format. Current Minutes. Current Seconds. LadderLOGIX data logger does not support Static IP Address. It can only be connected to networks with Dynamic IP Address (i.e. network with DHCP server). 9.2.2.5 Modem This setting lets user set modem options. An external modem, which is optional, can be a GSM/GPRS attached to the RS-232 9-pin DSUB interface. Option Modem Mode Baudrate Start bits Data bits Description Set Modem Modes: None Message Data [Default None]. Baudrate settings in bps: 9600 19200 38400 57600 115200 [Default 115200] Frame start bit: 1 [Default 1] Frame data bits: 5 6 7 8 [Default 8] 24 ver. 1.6.0.0 User Manual LadderLOGIX Stop Bits Handshake Parity Timeout User name Password Country Code Area Code Phone number APN Frame stop bits: 1 1.5 2 [Default 1 stop bit] None Software Hardware Both [Default Hardware] None Even Odd [Default None] Connection timeout. User name assigned by ISP. Password assigned by ISP. Country code to dial to the ISP. Area Code to dial to ISP. Phone number to dial to the ISP. Access Point Name, GPRS gateway that is given by SIM card operator. 9.2.2.6 SMTP This setting lets user configure the SMTP settings to use while sending out email. Option Account Username Password Server Port SSL Description Account name for the SMTP server. User name for the SMTP server. Password for the SMTP server. SMTP Server that is used for sending e-mail. Could be entered as IP address or domain name. SMTP server port. SMTP server SSL settings: None SSL TLS/STARTTLS [Default None] 9.2.2.7 MODBUS This sub menu item lets the user configure the MODBUS RS-485 communication interface. Make sure that the wiring is correct. Option Description 25 ver. 1.6.0.0 User Manual LadderLOGIX UART Mode Baudrate Start bits Data bits Stop Bits Handshake Parity Timeout Retry Set MODBUS transmission mode: RTU. [Default RTU]. Baudrate settings in bps: 9600 19200 38400 57600 115200 [Default 9600] Frame start bit: 1 [Default 1] Frame data bits: 5 6 7 8 [Default 8] Frame stop bits: 1 1.5 2 [Default 1 stop bit] None Software Hardware Both [Default Hardware] None Even Odd [Default None] The time that device will wait for a response from a slave before serial timeout will occur. [Default 1000] Number of retry if an error occurs while querying data from MODBUS slave. [Default 3] 9.2.2.8 Logger This setting lets user configure the device Tag logger. 26 ver. 1.6.0.0 User Manual LadderLOGIX This setting is only used if Gateway mode is Log or Send & Log (see Section 9.2.2.1) Option Mode Column Separator Row Separator Rollover time Encoding Description Set Tag Logger mode: Continuous On Change [Default Continuous]. Column Separator to be used by logger: Comma (,) Pipe (|) [Default Comma(,)] Row Separator to be used by logger: Line Feed Carriage Return & Line Feed [Default Line Feed] Rollover time for the logger when it rolls over the current file and starts writing to a new file. [Default 5 mins] Logger text encoding. [Default ASCII] Logger always writes the file to Data directory. Logger filename format: tag[ddMMyyyyHHmmss].fdb tag.fdb is the active file on which Logger is writing. Any operation on tag.fdb may result in device malfunction 27 ver. 1.6.0.0 User Manual LadderLOGIX 9.2.3 Explorer This tab lists down the files being logged on data logger. User can download or delete the data files from this screen. 9.2.3.1 Data This selection lists down the files under Data folder. 9.2.3.2 Logs This selection lists down the files under Logs folder. 9.2.3.3 Workflow This selection lists down the files under Workflow folder. 9.2.3.4 Toolbar Button Folder Description Folder to explore. Refresh Data files. Delete a data file 28 ver. 1.6.0.0 User Manual LadderLOGIX 9.3 IO Mappings At IO Mappings screen you define Tags (MODBUS queries) and Alerts. 9.3.1 Tags You can configure MODBUS queries as Tags. 9.3.1.1 Button Toolbar Description Add a Tag. Edit a Tag. Clone a Tag Delete Tag(s). Delete a Tag Group – all the Tags within the same Group will be deleted. Add/Edit Scaling for Tag. 29 ver. 1.6.0.0 User Manual LadderLOGIX 9.3.1.2 Option Name Type Function Trigger Units Precision Slave Id Data Type Defining Tag Description Tag Name Tag Type: MODBUS UART Input MODBUS UART Output MODBUS TCP Input MODBUS TCP Output [Default MODBUS UART Input] MODBUS Functions: Read Coils Read Discrete Inputs Read Holding Registers Read Input Registers Write Single Coil Write Single Register [Default Read Input Register] Trigger for Tag to get recorded: None On Change [Default None] Tag units Tag precision digits [0 to 6] MODBUS Slave Id of slave device [1 to 247] Data Type of Tag: Bit Integer (16 bit) 30 ver. 1.6.0.0 User Manual LadderLOGIX Integer (32 bit) Integer (64 bit) Float Swap Float [Default Integer (16 bit)] Swap Float uses word swap floating notation. Address Data Points IP Address Port Timeout Retry Hysteresis MODBUS Address of registers to read/write [0 to 65536] Data points to read/write (read-only) MODBUS slave IP Address. Applicable to MODBUS TCP Input and MODBUS TCP Outputs MODBUS slave Port. Applicable to MODBUS TCP Input and MODBUS TCP Outputs Time for which device will wait for MODBUS slave to reply. [Default 100 ms] Number of retries after which MODBUS query errors out. Hysteresis for Tag values. Tag value only gets recorded if Hysteresis is satisfied. None Absolute Percentage [Default None] Valid for Trigger is On Change Value Hysteresis Value to use for computing Tag Hysteresis. Valid for Trigger is On Change Group Notify Server Specify Group name to group Tags to execute MODBUS Bulk Query. Check to send Tag value to server. 31 ver. 1.6.0.0 User Manual LadderLOGIX 9.3.1.3 MODBUS Bulk Query LadderLOGIX device can execute bulk query over MODBUS. Tags with Group are eligible for MODBUS Bulk Query 9.3.1.3.1 MODBUS UART For MODBUS UART, Bulk Query is grouped by Tag Group, Slave Id and Function. 9.3.1.3.2 For MODBUS TCP For MODBUS TCP, Bulk Query is grouped by Tag Group, IP Address, Host Port, Slave Id and Function. 9.3.1.3.3 Timeout Bulk Query obtains Timeout value from Device Settings > System > MODBUS > Timeout. (See Section 9.2.2.7) 9.3.1.3.4 Retry Bulk Query obtains Retry value from Device Settings > System > MODBUS > Retry. (See Section 9.2.2.7) 9.3.1.4 Scale Tag Scaling is used to convert measured values to engineering values. LadderLOGIX supports Linear Scaling. Only Input Tags can be scaled. Enter minimum 4 values for best result. 32 ver. 1.6.0.0 User Manual LadderLOGIX Option Reg Engineering Description Register Value Engineering Value Reg Value has precision of 6 decimal places Engineering Value has same precision as that of Tag. A maximum of 10 data points can be entered. 9.3.2 Alerts An Alert is an exception that has to be raised and notified when a Tag breaches its threshold. 9.3.2.1 Button Toolbar Description Add an Alert. Edit an Alert. Delete an Alert. Add/Edit Success actions. Add/Edit Failure actions. 33 ver. 1.6.0.0 User Manual LadderLOGIX 9.3.2.2 Option Name Severity LHS Operation Value Precision Hysteresis Defining Alert Description Alert Name Alert Severity: Low Medium High Critical [Default Low] Left Hand Side for Alert Comparison sys.reset – System Reset Alert sys.storage – System Storage Alert <Tags> – Input Tags Alert Operation Equal Not Equal Greater Than Greater Than Equal Less Than Less Than Equal On Change – Raises alert if underlying Tag has changed [Default Equal] Right Hand Side Value to compare with. Alert precision digits Hysteresis for Alert values. Alert get raised only if Hysteresis is satisfied. 34 ver. 1.6.0.0 User Manual LadderLOGIX None Absolute Percentage [Default None] Valid for sys.reset, sys.storag and Tags Value Hysteresis Value to use for computing Hysteresis. Valid for sys.reset, sys.storag and Tags Delay Sec(s) Delay period to wait before raising the Alert. Alert condition should hold True through the delay period. Otherwise Alert is reset. 9.3.2.3 Alert Actions Various actions such as: Notify Server, SMS, Email, Update Tags etc. can be performed based on Success/Failure of an Alert. To configure select an Alert and click a relevant action button. 9.3.2.3.1 Notify To send notification to WebFRONT server, check Notify checkbox in the Alert Action handler. 9.3.2.3.2 SMS User can choose to send SMS notification for an Alert. 35 ver. 1.6.0.0 User Manual LadderLOGIX Option To Body Include Snapshot Description Recipients’ mobile numbers separated by Semi Colon (;) Custom message to be included in SMS Include Alert Values snapshot. Configure Modem to Messaging mode. See Section 0 SMS will only be sent if a GPRS modem is detected by device. 9.3.2.3.3 Email User can choose to send Email notification for an Alert. Option To Description Recipients’ emails separated by Semi Colon (;) 36 ver. 1.6.0.0 User Manual LadderLOGIX Cc Bcc Subject Body Include Snapshot Carbon Copy Recipients’ emails separated by Semi Colon (;) Blank Carbon Copy Recipients’ emails separated by Semi Colon (;) Custom Alert Email Subject Custom message to be included in SMS Include Alert Values snapshot. Internet Connection required for sending email. See Section 0 Valid SMTP settings required. See Section 9.2.2.6 9.3.2.3.4 Tag User can choose to update Output Tags as an alert action. Updates to Tag are immediately sent to MODBUS slaves. Helpful when preventive actions have to be taken in response to an alert. Option Tag Value Description Select a Tag you wish to update. Provide a value to update to the Tag. 37 ver. 1.6.0.0 User Manual LadderLOGIX 9.4 Workflow Workflow is collection to Tasks that execute in user-defined sequential order. User can configure custom workflow from this screen. Enable Workflow from option Workflow in Section 9.2.2.1 9.4.1 Toolbar Button Description Refresh Workflow Add a Workflow Task. Edit a Workflow Task. Delete a Workflow Task. Save Workflow. Frequency Frequency, in seconds, to run Workflow. 38 ver. 1.6.0.0 User Manual LadderLOGIX 9.4.2 Manage Option Type Description Type of Workflow Tasks Move File FTP Delete File Custom Network Move [Default Move File] Trigger condition to start the task based on result of previous task result. Any – Starts a task irrespective of previous task being success/failure Success – Starts a task only if previous task was success. Failure – Starts a task only if previous task was failure. [Default Any] Trigger 9.4.3 Tasks 9.4.3.1 Move File Move a file from source folder to a destination folder. Option Source Folder Source Filename Description Source folder to copy file from. Data Workflow [Default Data] File name of source filename. Filename can contain wildcards. 39 ver. 1.6.0.0 User Manual LadderLOGIX Destination Folder See Section 10.1 Source folder to copy file from. Workflow USB [Default Workflow] 9.4.3.2 FTP This task transfers a file over to FTP server. Option FTP Server Port Username Password Command Description File Transfer Server name File Transfer Server Port Username for logging on to FTP server Password for logging on to FTP server. FTP command to run. See Section 10.2 Only simple FTP supported. SSL is NOT supported. FTP files will be picked from Workflow folder only. After successful FTP, file is renamed to <original-filename>.ftp 9.4.3.3 Delete File This task deletes a file from source location. 40 ver. 1.6.0.0 User Manual LadderLOGIX Option Folder Filename Description Source folder to copy file from. Data Workflow USB [Default Data] File name of source filename. Filename can contain wildcards. See Section 10.1 9.4.3.4 Custom This is a custom task and should only be configured after consultation from M2MLogger. Option Executable Arguments Timeout sec(s) Description Name of Custom Executable to run. Arguments to Custom Executable file. Filename can contain wildcards. See Section 10.1 Time to wait for Custom Executable to return. The Custom Executable will be terminated if does not returns within timeout duration. 41 ver. 1.6.0.0 User Manual LadderLOGIX 9.4.3.5 Network Move This task moves the file from source folder to a network folder. Option Source Folder Source Filename Host name Destination Folder Description Source folder to copy file from. Data Workflow [Default Data] File name of source filename. Filename can contain wildcards. See Section 10.1 Hostname of network computer. Shared folder on network compute where files have to be copied. Make sure network computer is reachable by data-logger. Shared folder should have exclusive Read/Write/Delete rights for Everyone on network. 9.5 Monitor Settings Monitor Settings is a WYSIWYG (What You See Is What You Get) designer, where you can design visualization screen with gauges. 42 ver. 1.6.0.0 User Manual LadderLOGIX Option Refresh Rate Size 9.5.1 Option Type Tag 9.5.2 Option Description Rate at which data is refreshed from server. Canvas Size in Width x Height for Monitor View. Widgets Description Visualization Widget Types: Radial Analog Gauge Rectangular Analog Gauge VU Meter Thermometer Liner Meter Digital Meter Led Tank Power Switch – Use this to toggle Output [Default Radial Analog Gauge] Tag name to bind with Widget. Widget Properties Description 43 ver. 1.6.0.0 User Manual LadderLOGIX General Type Tag Color # Scale 1:X Values Min Max Steps Major Minor Range Green Yellow Red Size & Position Height Width Left Top Title Text Dock Visible Type of Widget Tag associated with Widget Hexadecimal RGB color for the Widget. Scales up/down Widget values by 1:X Minimum value for Widget Maximum value for Widget Major Ruler Steps for Widget. Minor Ruler Steps for Widget. Maximum Rule Value for Green range marker. Maximum Rule Value for Yellow range marker. Maximum Rule Value for Red range marker. Height of Widget in pixels. Width of Widget in pixels. Left position of Widget in pixels. Top position of Widget in pixels. Title text Docking position for Title text: top center – show title on Top-Center of Widget bottom center – show Title on Bottom-Center of Widget Show/hide Title on Widget 44 ver. 1.6.0.0 User Manual LadderLOGIX 9.6 Trend Settings Trend Settings is a WYSIWYG (What You See Is What You Get) designer, where you can design visualization screen with Trending charts. Option Refresh Rate Size 9.6.1 Description Rate at which data is refreshed from server. Canvas Size in Width x Height for Monitor View. Trend A Trend is a graphical representation of Time series data. One Trend can contain multiple Traces. Each Trace represents one Tag. Option Name Type 9.6.2 Option Description Name of Trend. Visualization Trend Types: Line [Default Line] Trend Properties Description 45 ver. 1.6.0.0 User Manual LadderLOGIX General Type Name Data Points Show Steps Show Points Show Legends Show Filled Show Title Scale 1:X Axis Y Axis Min Y Axis Max Size & Position Height Width Left Top Traces Legend Tag Color # Type of Trend Name of Trend. Maximum number of Data points to display in Trend chart. Connect line chart values as Steps. Show/Hide Point marker for data Points. Show/Hide Legends for Traces Show/Hide filled area under chart. Show/Hide Title for chart. Scales up/down Widget values by 1:X Minimum value for Y Axis Maximum value for Y Axis Height of Widget in pixels. Width of Widget in pixels. Left position of Widget in pixels. Top position of Widget in pixels. Legend for Trace Tag to bind with Trace. Hexadecimal RGB color for the Trace. 46 ver. 1.6.0.0 User Manual LadderLOGIX 9.7 Account You change your account password from this screen. Type New Password and Confirm Password and Click Change Password. 47 ver. 1.6.0.0 User Manual LadderLOGIX 9.8 Monitors Monitor screen lets you visualize logged Tag values as Gauges on a real-time basis. Double clicking a Power Switch will toggle the output. 9.8.1 Toolbar Button Refresh Rate Description Refresh Rate for Monitor screen. Start polling data from server. Stop polling data from server. Last Refreshed Timestamp of last refresh. 48 ver. 1.6.0.0 User Manual LadderLOGIX 9.9 Trends Trend screen lets you visualize logged Tag values as Trending chart on a real-time basis. 9.9.1 Toolbar Button Refresh Rate Description Refresh Rate for Trends screen. Start polling data from server. Stop polling data from server. Last Refreshed 9.9.2 Timestamp of last refresh. Zoom To zoom the Trend chart, select the desired area in the Zoom panel at the bottom of Trend chart 49 ver. 1.6.0.0 User Manual LadderLOGIX 9.10 Tag Stream Tag Stream screen tabulates the latest Tag values. To refresh values click on Refresh button. 9.10.1 Button Toolbar Description Refresh Tag Stream data. 50 ver. 1.6.0.0 User Manual LadderLOGIX 9.11 Alerts Alert screen tabulates all the Alerts raised by device. 9.11.1 Button Toolbar Description Refresh Alerts data. 51 ver. 1.6.0.0 User Manual LadderLOGIX 10 Appendix 10.1 File name wildcards Filename can contain wildcards: 10.1.1 [*] - Asterisk Substitute for zero or more characters. Example tag[*].fdb Successful Match: tag0123.fdb Failed Match: tag.fdb 10.2 FTP Commands 10.2.1 STOR Accept the data and to store the data as a file at the server site Syntax STOR “filename” filename is the source file name. See Section 10.1 FTP files will be picked from Workflow folder only. The destination filename will always be same as source file name. Example STOR “tag_[*].fdb” 52 ver. 1.6.0.0 User Manual LadderLOGIX 11 Troubleshoot 11.1 Power LED not ON If power is connected to device and Power LED does not glow, this means: Either, rated power is not connected. (See Section 6.3) Or, reverse polarity connection. (See Section 6.5.3.) 11.2 Both Run and Error LEDs blinking If both Run and Error LEDs are blinking, this means device is running out of memory. Please consult M2MLogger Support for further assistance. 11.3 Run LED ON and Error LED blinking If Run LED is ON and Error LED is blinking, this means the device Clock is reset. Under such a condition device does not executes the Loop. Please connect the device with Internet and Synchronize the Clock as per Section 9.2.2.3. 11.4 Run LED OFF and Error LED ON If Run LED is OFF and Error LED is ON, this means the device has encountered an unrecoverable error. Generally LadderLOGIX device will restart under such a condition. But if the problem persists on three consecutive restarts then device shows the status until remedial action is taken. Please consult M2MLogger Support for further assistance. 11.5 Connecting internet with Static IP Address LadderLOGIX Data-logger only supports Dynamic IP Address, i.e. it needs a DHCP server to allocate IP Address. If you wish to install data-logger in a network where DHCP server is not available, consider installing a commercially available multi-port router (with DHCP capability) between data-logger and network. You should configure the router with appropriate Static IP Address. Please consult M2MLogger Support for further assistance. 53 ver. 1.6.0.0 Head Office: Techno Instrumentation (India) Pvt. Ltd. Telefax : +91-11-22112232 An ISO 9001:2008 Certified Company Mobile : +91 98105 54547 Plot# 67, Street# 1-B , E-mail : [email protected] Friends Colony Industrial Area, Web : www.m2mlogger.com G.T Road, Shahdara, Delhi – 110095, India M2MLogger is a division of Techno Instrumentation (India) Pvt. Ltd.