1
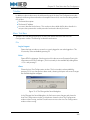
ENTERPRISE SOFTWARE SUITE
USER MANUAL
VERSION 1.03
Copyright © 2013 Innovative Electronic Designs, LLC. All Rights Reserved
If this document is distributed with software that includes an end user agreement, this document, as well as the software described in it, is
furnished under license and may be used or copied only in accordance with the terms of such license. Except as permitted by any such
license, no part of this document may be reproduced or transmitted in any form or by any means, electronic or mechanical, including
photocopying, recording, storage in an information retrieval system, or otherwise, without the prior written permission of Innovative
Electronic Designs, LLC. Please note that the content in this guide is protected under copyright law even if it is not distributed with software
that includes an end user license agreement.
The content of this document is furnished for informational use only and is subject to change without notice. It should not be construed as
a commitment by Innovative Electronic Designs, LLC. Innovative Electronic Designs, LLC assumes no responsibility or liability for any errors or
inaccuracies that may appear in the informational content contained in this document.
Any reference to company names in examples are for demonstration purposes only and are not intended to refer to any actual organization
or an endorsement of any kind.
Innovative Electronic Designs, IED, GLOBALCOM, vACS, 500ACS, 500ACS Announcement Control System, CAS, Courtesy
Announcement System, T- CAS, FAS, Flight Announcement System, IED On Call, IED On Call & Design, and LANcom are all registered
trademarks or trademarks of Innovative Electronic Designs, LLC in the United States and/or other countries.
CobraNet is a registered trade mark of Cirrus Logic in the United States and/or other countries.
Microsoft, Windows, Windows Vista, Windows 7, Windows Server, SQL Server, and Internet Explorer are all registered trademarks or
trademarks of Microsoft Corporation in the United States and/or other countries.
Innovative Electronic Designs, LLC
9701 Taylorsville Road
Louisville, KY 40299
United States of America
www.iedaudio.com
Document Number: 901C
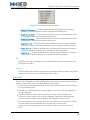
Publication History:
Revision
Publication Date
Comments
1.00
January 12, 2011
Initial Release
1.01
July 20, 2012
Added System Supervision Chapter
1.02
January 31, 2013
Added VisDID config chapter
1.03
December 9, 2013
Updated document number
Table of Contents
General Tab
Permission & User Settings Tab
Groups/Companies & Gates Tab
Key & Button Assignments Tab
Sidekick Properties Tab
Additional Properties Tab
65
67
68
69
72
73
End User License Agreement
7
Overview
1
Launching Enterprise
2
Enterprise Navigator Window
3
Login/Logout
4
Mic Station Security
6
User Groups
76
Companies
80
Mic Station Users
84
Menu Bar
Application Menu
Edit
Tools
Help
6
6
8
10
Toolbar
11
528 Interface Designer
Tree View
12
Launching the 528 Interface Designer
Tasks and Details
13
Templates
Status Bar
Titan Channel Configuration
15
17
Titan Channel Settings
18
Inputs and Zone Manager
22
EQ
24
Ambient Analysis
27
Assign Sensors
Calibration
30
32
Delay
34
Channel Settings Storage
35
Channel Settings Menu Reference
37
File Menu
Edit Menu
Monitor Menu
Help Menu
EQ Options
37
38
39
41
42
Opening, Adding, Renaming, and Deleting
Importing and Exporting Templates
Editing Templates
Toolbar
Buttons
The Button Bar
Button Properties
Scroll Boxes
Scroll Box Properties
Transfer Templates
Bulk Updating of Mic Stations
Announcement Controller Template Storage
IPAU Config Tool Interface
Menus
Toolbar Buttons and Controls
47
48
48
49
89
90
91
91
92
95
95
98
98
99
101
101
104
105
106
Default Text Table Data
107
Zone Group Setup
109
Zone Groups
110
Zone Groups Viewer
111
Zone Group Editor
Titan IPAU Config Tool
75
General Tab
Destination Tab
Zone Setup
116
116
117
119
General Tab
51
Zones
120
Network Tab
53
Zones Viewer
121
Zone, Attn & Backup Tab
55
Zone Editor
Mute & Bypass Tab
57
BGM Tab
59
Microphone Station Setup
61
General Tab
Zone Type Specific Tab
Additional Properties Tab
PDRP Messages
126
126
127
128
129
Mic Stations
62
PDRP Messages
130
Mic Station Viewer
63
PDRP Messages Viewer
132
Mic Station Editor
65
3
Table of Contents
PDRP Editor
General Tab
Language User Groups Tab
Play Schedule Tab
Schedules
Assemble Take Tab
Assemble Takes Editor
Destination Tab
Takes
149
Takes
150
Viewer
151
Take Editor
System-wide Take Tab
Record / Play Take Tab
VIS Tab
DRP Editor
DRP Recording
Audio File Formats
Recommended Recording Practices
156
156
158
159
161
162
162
162
Launching the DRP Editor
163
Main Window Overview
165
Menus
File Menu
Edit Menu
View Menu
Tools Menu
Help Menu
Toolbar
Time Talker
Launching Time Talker
Time Talker Configuration Window
File Menu
Edit Menu
Help Menu
Time Talker Setup
Frame Options
Zone Map Setup
User Options
Time Events
Define Events
Password Management
166
166
171
174
176
180
181
185
186
187
187
188
188
189
189
190
191
193
193
195
Accessing Password Configuration Options
196
Login / Logoff
198
Application Management
199
Configure Server
200
Options Tab
Language Tab
Verify
4
136
137
138
139
140
142
143
146
200
201
202
Change Password
Edit Accounts
Menus
User Accounts
Application Areas
596 Series Test Configuration
203
204
204
205
209
213
Gateway Monitor/Test Setup
214
Configure Monitor Points
215
Test Results
ACS Output Test Results Tab
External Test Results
Mic Test Results
218
218
219
220
Monitor Zone
222
Monitor Mics
224
Gateway Configuration
226
Monitor Test
General Tab
Audible Zones Tab
Mic Test Zone Tab
Set Tab
Test Tab
227
227
228
229
229
230
Titan Series Auto Test Configuration 233
Auto Tests Window
Title Bar
Menu and Tool Bars
Run Tests
Test Results Grid
Status Bar
Point Selection Window
Auto Test Configuration Window
Title Bar
Menu Tool Bars
Point Selection Grid
Status Bar
Edit Test Signals Window
Title Bar
Edit Test Schedules Window
Title Bar
Test Sequences
Schedules for selected Sequences
Edit Test Points Window
Title Bar
Points list box, Add Point button and Del Point
button
Circuit Data
Collector Unit
Reset Points, OK and Cancel Buttons
About Window
System Supervision
Accessing System Supervision Features
234
236
236
237
238
240
242
244
245
245
246
249
251
251
255
255
256
257
259
259
259
260
260
261
262
263
264
Table of Contents
Configure
265
View Faults
267
Device Monitoring
269
Fault Descriptions
270
Relay Setup
271
IED Network Fault Numbering
274
VisDID Setup
VisDID.xml
Sample File
Tag List
MessageList.xml
Sample File
Tag List
279
280
280
281
285
285
285
5
Table of Contents
This page has been intentionally left blank.
6
End User License Agreement
End User License Agreement
SOFTWARE LICENSE AGREEMENT AND LIMITED WARRANTY
THIS IS A LEGAL AGREEMENT BETWEEN THE USER (“YOU”) AND INNOVATIVE ELECTRONIC DESIGNS (“IED”) RELATING TO SOFTWARE AND
DOCUMENTATION (COLLECTIVELY “SOFTWARE”) PROVIDED WITH IED AUDIO COMPONENTS (“PRODUCTS”) OBTAINED FROM IED OR ITS
AUTHORIZED CONTRACTORS. BY INSTALLING OR USING THE SOFTWARE, YOU ACKNOWLEDGE THAT YOU HAVE READ AND UNDERSTAND
THIS LICENSE AND AGREE TO BE BOUND BY ITS TERMS
License. In return for payment of the license fee, which is part of the price for the Products, and Your agreement to abide by the terms of this License, IED
grants to You a non-exclusive, non-transferable right to use the Software solely in connection with use of the Products. You may not copy the Software except
for archival or backup purposes. You acknowledge that IED is the sole owner of all rights in the Software (including copyrights, patents, trademarks and other
intellectual property rights), all copies, modifications, enhancements, and derivative works created therefrom, subject only to the license expressly granted
herein. This License does not provide You with ownership of the Software or a copy of it, but only a right of limited use.
Restrictions. You may not reverse engineer or assemble, decompile, decode or otherwise translate the Software. You shall not remove any copyright notice or
other proprietary or restrictive notice or legend contained or included in or on any Software or other material provided by IED, and You shall reproduce, copy
and include all such information on all copies made, including such copies for archival or backup purposes. You shall use Your best efforts to assist IED in
identifying any use, copying or disclosure of any portion of the Software by any of Your present or former personnel contrary to the terms of this License.
Termination. You may terminate this License at any time by returning the Software and all copies and extracts thereof to IED. You are not entitled to a refund
upon Your termination. In addition to other available remedies, IED may, at its option, terminate this License if You fail to pay any fees due or fail to carry out
any other obligation under this License. Upon IED's termination of this License, You are required to return or destroy and certify destruction, as requested by
IED, all copies of the Software in Your possession (whether modified or unmodified). Upon termination, all accrued fees shall he immediately due and
payable.
Law; Scope of Agreement. This License shall be governed by the laws of the Commonwealth of Kentucky as it applies to contract made and performed in such
state without giving effect to conflict of law rules. You consent to jurisdiction and venue in the Commonwealth of Kentucky, the courts in Jefferson County,
Kentucky, and the U.S. District Court for the Western District of Kentucky in any proceeding arising out of, or relating to, this License or Your use of the
Software. If any term of this License is declared void or unenforceable by any court, such declaration shall have no effect on the remaining terms hereof. No
modification of this License shall be binding on IED unless expressly accepted in writing by IED, This License is the entire agreement concerning the Software
between You and IED, and it supersedes any prior representation or understanding.
7
End User License Agreement
This page has been intentionally left blank.
8
1
Overview
The following sections provide an introduction to the Enterprise Software Suite and the application user
interface. More details on specific system operation can be found in other sections of this manual.
Launching Enterprise
2
Enterprise Navigator Window
3
Login/Logout
4
6
Menu Bar
Application Menu
Edit
Tools
Help
Toolbar
6
6
8
10
11
Tree View
12
Tasks and Details
13
Status Bar
15
1
Chapter 1: Overview
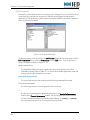
Launching Enterprise
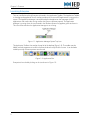
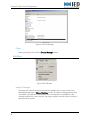
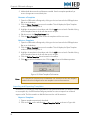
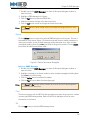
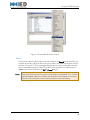
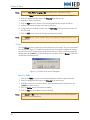
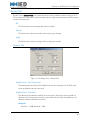
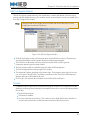
The icon used for launching Enterprise is located in the Application Toolbar. The Application Toolbar
is a background application that is used to provide quick access to IED applications running on the
system. The Application Manager is another background application that manages the IED
applications that need to be running to allow the system to operate properly. The Application
Manager is running when the icon located in the Windows system tray appears green as shown in .
This icon will be red when the Application Manager is not running.
Figure 1-1: Application Manager System Tray Icon
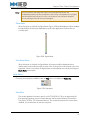
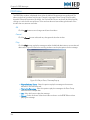
The Application Toolbar is located at the top left of the desktop (Figure 1-2). The toolbar may be
hidden and only appear as a small thin horizontal tab at the top left of the screen. It can be made
visible by moving the mouse pointer over the tab.
Figure 1-2: Application Bar
Enterprise is launched by clicking on the icon shown in Figure 1-2.
2
Chapter 1: Overview
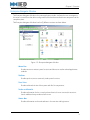
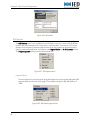
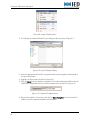
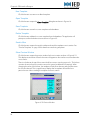
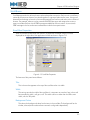
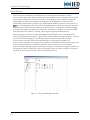
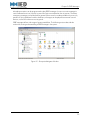
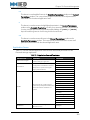
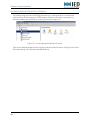
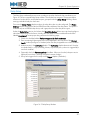
Enterprise Navigator Window
The Enterprise Navigator Window is the main application window. It allows the user to navigate to
the various control forms that allow configuration of the hardware and software components of the
complete system.
The Enterprise Navigator Windows has five (5) different sections as shown below.
Figure 1-3: Enterprise Navigator Window
Menu Bar
Provides access to various system functions and shortcuts to other related application
modules.
Toolbar
Provides quick access to commonly-used system functions.
Tree View
Provides a hierarchal view of the system and all of its components.
Tasks and Details
Provides information for the currently selected item in the tree view and/or access to
launch additional setup windows for the item.
Status Bar
Provides information on the selected item in the tree view and login status.
3
Chapter 1: Overview
Login/Logout
The software is password protected and users are required to log into the application in order to
make any changes to the system. Adding new users, deleting users, or managing permissions are
performed using the Password Manager Config utility that can be accessed from the Tools menu.
A shortcut key for this feature is available by using the F2 key. Pressing this key will immediately
logout the current user. If no one is logged in, pressing the key will open the Login window.
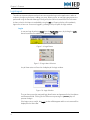
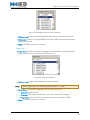
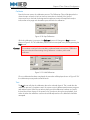
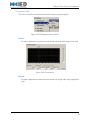
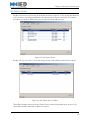
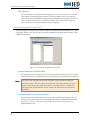
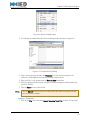
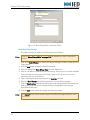
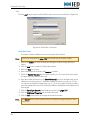
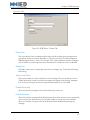
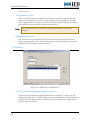
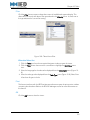
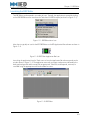
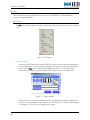
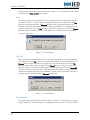
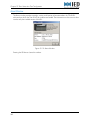
Login
A user can login by selecting Login from the Application menu, by clicking the Login
button located on the toolbar, or by pressing the F2 key.
Figure 1-4: Login Button
Figure 1-5: Login Menu Selection
Any of these actions will result in the display of the Login window.
Figure 1-6: Login Window
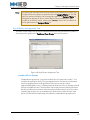
The user then enters their assigned login identification and password in the User Name
and Password fields. Clicking on the OK button or pressing the [ENTER] key will
process the login.
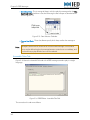
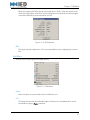
If the login was successful, the Login window will disappear and the user's name will be
displayed in the Status Bar.
4
Chapter 1: Overview
Figure 1-7: Status Bar User Information
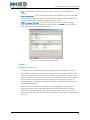
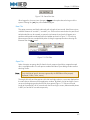
If the login information entered was incorrect, the user will be shown the following
window.
Figure 1-8: Incorrect Password
Click the OK button to remove this window.
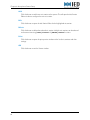
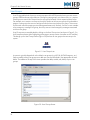
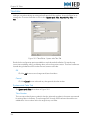
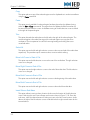
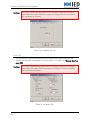
Logout
To log out of the application, the user can select Logout from the Application menu,
click the Logout button on the toolbar, or press the F2 key.
Figure 1-9: Logout Button
Figure 1-10: Logout Menu
5
Chapter 1: Overview
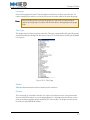
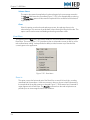
Menu Bar
Application Menu
Figure 1-11: Application Menu
Login/Logout
The text on this button will change to reflect the available command. If the user is currently
logged into the system, this button will become a Logout button. If currently logged out, it
will change to a Login button. Selecting this button is the same as selecting Login/Logout
from the Application menu. Selecting Login will prompt the user to enter their user name and
password.
Reload Data
This option will instruct the application to reload the data from the database. It is useful if
other users may be logged into the system at other client workstations. Selecting this will
ensure that the data displayed is current.
A shortcut key for this feature is available by using the [F5] key.
Close
This option will exit the Enterprise software application.
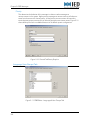
Edit
Add New
This menu allows new system components to be added to the software application so they
can be configured for proper integration in the system.
Figure 1-12: Edit Menu
6
Chapter 1: Overview
Group
Components can be organized into Groups to provide a more user-friendly
presentation of the overall system architecture. All systems should have at least one (1)
group. This will make it easier to expand the system in the future. Additional groups can
be added within a main group to further sub-divide the system.
Typically, a group is created for each announcement controller in an installation and
corresponds with the physical location or areas served by that system. For example, if a
facility consists of two buildings, each with its own dedicated announcement controller,
then a group will be created for each building.
Device
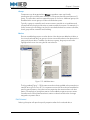
Devices are added to groups or to other devices. New devices are added as children to
the currently selected device or group in the tree view and that device then becomes the
parent to that new device. To add a new device to a group, the group must first be
highlighted in the tree view using the left mouse button.
Figure 1-13: Add New Menu
The figure above (Figure 1-13) illustrates a new device being added to the parent device
named Training Room Titan ACS. It is important to note that when devices are added to
specific types of parents, they inherit various properties that associate them with their
parent. For example, a microphone station can be added to a parent announcement
controller and it will only be allowed a mic station number that falls within the range
assigned to its parent device.
Edit Selected
Selecting this option will open the specific properties editor for the selected device.
7
Chapter 1: Overview
Delete Selected
Selecting this option will delete the selected object and all child objects associated with this
object. The system will prompt for confirmation to delete the item to avoid accidental
deletion.
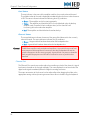
Caution!
This action is permanent and will delete all configuration settings for all devices
within the selected tree branch and cannot be undone.
Tools
This menu provides quick access shortcuts to other application modules used to control and
configure the system.
Figure 1-14: Tools Menu
While the specific tools available may vary based on the specific installation, the four (4) most
common tools provided are listed below: The usage of each is described in their respective
sections of this manual.
IED DRP Editor
This application is used for editing audio takes used as messages in the system. It is used to
record new audio takes or edit existing takes. It is capable of importing and exporting system
formatted takes to other file formats. It provides basic audio editing functions and is used to
match audio levels of takes so messages sound consistent.
Figure 1-15: DRP Editor
8
Chapter 1: Overview
IED Enterprise Dashboard
The Enterprise Dashboard is a real-time system activity monitor. It will show current status of
microphone stations and zones and is used to monitor the current announcement activity in
the system.
Figure 1-16: Enterprise Dashboard
IED Print Manager
This application is used to print from a selection of 22 pre-defined reports. These are useful
for archiving system settings. They also provide an aid in system configuration by allowing
certain parameters to be printed out and used as a reference while configuring other system
options.
Figure 1-17: Print Manager
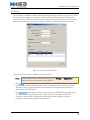
PasswordManagerConfig.exe
This application is used to add and remove users in the system. The system provides very
detailed control of user permissions. Individual user accounts can be granted access to
areas of the application that directly pertain to their specific system usage needs. A log is
kept that includes who logged in, when, and specifically what they changed.
9
Chapter 1: Overview
Figure 1-18: Password Manager Config
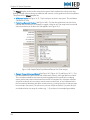
Help
Currently, the only option available from the Help menu is the About information window as
shown in Figure 1-20. This window provides the version number and release date of the
Enterprise software application.
Figure 1-19: Help Menu
Figure 1-20: About Window
Note:
10
It is important to remember that the Enterprise suite of software represents a
collection of many different small applications that are accessed from the overall
IED Enterprise shell application. This version information displays the major
installation release and it is possible that other files on the system have been
updated and the core IED Enterprise shell application will remain at the same
revision level.
Chapter 1: Overview
Toolbar
The toolbar provides quick access to several menu commands that are commonly accessed.
Figure 1-21: Enterprise Navigator Window Toolbar
Login/Logout
The text on this button will change to reflect the available command. If the user is
currently logged into the system, this button will become a Logout button. If currently
logged out, it will change to a Login button. Selecting this button is the same as selecting
Login/Logout from the Application menu. Selecting Login will prompt the user to enter
their user name and password.
Note:
The actions associated with the next three buttons will be applied to the currently
selected item in the Tree View.
Add New
This button allows the user to add a new group or a new item under the currently
selected tree branch.
Edit Selected
This button will open the specific properties editor for the selected device.
Delete Selected
This button will delete the selected object and all child objects associated with this object.
The system will prompt for confirmation to delete the item to avoid accidental deletion.
Caution!
This action is permanent and will delete all configuration settings for all devices
within the selected tree branch and cannot be undone.
Reload Data
This button will instruct the application to reload the data from the database. It is useful
if other users may be logged into the system at other client workstations. Selecting this
will ensure that the data displayed is current.
11
Chapter 1: Overview
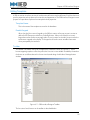
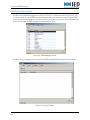
Tree View
The Tree View provides a hierarchal view of the components that make up the overall system
controlled by the application. The Tree View is very similar to a file folder structure as seen in
Microsoft Windows Explorer and is navigated in a similar fashion.
Figure 1-22: Tree View
Figure 1-22 illustrates a typical system configuration and the different elements of the Tree View. The
hierarchal structure allows individual system components to be grouped together based on how
they relate to one another in the overall system architecture. Some objects function as child objects
that are grouped under a higher-level parent object. Parent objects are typically higher-level objects
such as an ACS CPU card that has direct control of other devices. Microphone stations and T9160
Amplifier Mainframes are examples of devices that are child objects because they must be
associated to a parent announcement controller device.
Individual branches can be expanded or collapsed by clicking on the + or - icons to the left of the
object. Groups and parent objects represent branches that can be expanded to reveal their
associated child objects.
12
Chapter 1: Overview
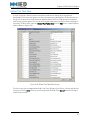
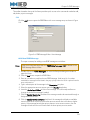
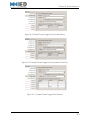
Tasks and Details
The Tasks and Details section of the Navigator window is used to display information and
configuration options for the item currently selected in the Tree View. The view will change based on
the item selected. Three examples are shown and described below.
Figure 1-23: Tasks and Details for 510CPU
Figure 1-23 shows the window when a 510CPU object is selected in the Tree View. For this item,
there are icons that represent specific tasks that can be performed for this component of the system.
Each icon will open the respective editor window associated with that task. For example, doubleclicking on the Mics icon will open the mic station editor window to allow individual microphone
stations associated with this system to be configured.
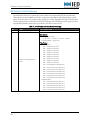
Figure 1-24: Tasks and Details for Mic Stations
Figure 1-24 shows the Tasks and Details window that will appear when the Mic Stations icon is
selected in the Tree View. This is a different type of display than the previous example in that it does
not contain icons that access different configuration windows. In this case, it is a table of the
microphone stations that are currently programmed in the system. Double-clicking on any of the
items in the list will open the mic station editor window for the selected mic station.
13
Chapter 1: Overview
Figure 1-25: Tasks and Details for Titan Frame
Figure 1-25 is a hybrid of the first two examples in that it contains both icons and a table. The three
icons can be selected to open up specific editors for the currently selected frame. The table provides
a list of the output channels associated with this frame. Double-clicking on the specific channel will
open the editor for that channel.
14
Chapter 1: Overview
Status Bar
The Status Bar is located along the bottom border of the Navigator window and is divided into two
sections. The left section of the status bar displays specific information about the currently selected
device in the tree view. Specifically, for items that have them, it will display the Device ID and Device
Type of the device. The right section displays the user that is currently logged into the system. If no
user is logged in, it will display “Not Logged In” in place of the username.
Figure 1-26: Status Bar
15
Overview
This page has been intentionally left blank.
16
2
Titan Channel Configuration
The following sections provide detail on the configuration of each different object available in the signal
path of each channel.
Titan Channel Settings
18
Inputs and Zone Manager
22
EQ
24
27
Ambient Analysis
Assign Sensors
Calibration
Delay
30
32
34
35
Channel Settings Storage
37
Channel Settings Menu Reference
File Menu
Edit Menu
Monitor Menu
Help Menu
EQ Options
37
38
39
41
42
17
Chapter 2: Titan Channel Configuration
Titan Channel Settings
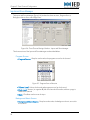
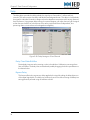
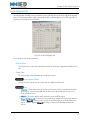
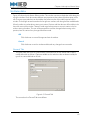
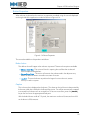
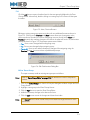
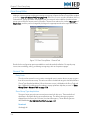
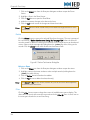
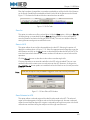
Titan outputs are configured by accessing the Titan Channel Settings window. This can be
accessed in one of two ways. First, the Titan frame must be selected in the Tree View. Then, doubleclicking on the Channel Settings icon will open the window without an individual channel selected.
Double-clicking on a specific channel will result in the window being opened with that channel
already selected.
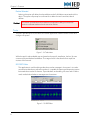
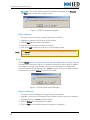
Figure 2-1: Accessing Titan Channel Settings
Settings Mismatch
There are times when the window shown in will appear. This indicates that the settings in the
frame are different than those in the database. Three options are available in this case.
• Copy database to frame - This option will send all settings from the database to the
frame. This is useful when a frame has been replaced or has received a firmware
update.
• Copy frame to database - This option will retrieve the settings from the frame and
upload them to the database.
• Cancel - This option will cancel the action and close the Channel Settings window.
Figure 2-2: Settings Mismatch Dialog Window
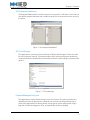
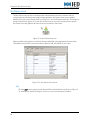
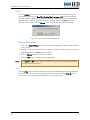
The Channel Settings window is shown in Figure 2-3.
18
Chapter 2: Titan Channel Configuration
Figure 2-3: Titan Channel Settings Window
The available channels and zone assignments are listed in the list box on the left side of the window.
Channels are selected by clicking on the channel name in the list. Once a channel is selected, it can
be edited by selecting the appropriate object in the signal flow along the top or from the menus.
Objects that are not available for the selected channel will appear in a gray color. The center
section of the window will change to display the controls available for the object selected.
The top status bar has the name of the currently selected Titan frame and its IP address. The bottom
status bar shows the current user name, database connection status, frame connection status, and
the activity status of the channel.
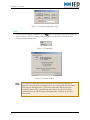
Amp Status
The Amp Status section contains two indicators to display information related to the health
of that channel.
Figure 2-4: Titan Channel Settings - Amplifier Status
19
Chapter 2: Titan Channel Configuration
Card Status
The top indicator is the status of the amplifier card for the currently selected channel.
The model number of the card is displayed immediately below the status when the status
is OK. The status indicator indicates the following three (3) conditions:
• Green - The amplifier card is functioning properly.
• Yellow - The amplifier card has failed, but is currently backed up by the backup
amplifier card, if installed. A fault condition exists, but the channel is still
functioning due to the redundant amplifier.
• Red - The amplifier card has failed and is not backed up.
Channel Status
The second indicator indicates the status of the ground fault detector for the currently
selected channel. The status indicator indicates two (2) conditions:
• Green - No ground fault has been detected on the loudspeaker line.
• Red - A ground fault has been detected on the loudspeaker line.
Caution!
T6400 Series amplifier cards are balanced amplifiers. It is possible for a ground fault
to be present and the amplifier will continue to drive the loudspeaker line and the
system will appear to be functioning properly. A ground fault can present a hazard to
both people and equipment and should be corrected as soon as possible when
detected.
Channel Out
The Channel Out controls are used to adjust the overall output level of the channel. A signal
level meter is located on the far right to display. This meter displays the real-time level of the
digital audio signal immediately before the digital-to-analog conversion.
The output attenuation of the channel can be adjusted by either dragging the slider to the
appropriate setting or directly entering an attenuation value in the box using the keyboard.
20
Chapter 2: Titan Channel Configuration
Figure 2-5: Titan Channel Settings - Channel Out
Status Bar
The Status Bar on the Channel Settings window has six sections, three text sections and three
graphic sections. These sections are described in the following list:
• The left most text section displays information on background processes which
prevent editing, such as make permanent.
• The center text section displays the following list of calibration status messages:
• Starting Calibration - The system has begun the automatic calibration process.
• Stopped - Valid Calibration - The calibration was completed successfully.
• Stopped by User - The Stop button was clicked before calibration was
completed.
• The right text section displays the currently logged in user, or the words ‘Not Logged
In’ if no user is logged in.
• The left graphic section indicates if the Channel Settings window is correctly
communicating with the database. Green indicates good communications and red
indicates a problem with database communications.
• The center graphic section indicates if the Channel Settings window is
communicating with the amplifier frame. Green indicates good communications
and red indicates that the window is not communicating with the frame.
The right most graphic section becomes animated to show when the software becomes
‘busy’ with background processing.
21
Chapter 2: Titan Channel Configuration
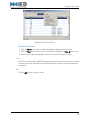
Inputs and Zone Manager
The Inputs and Zone Manager (Figure 2-6) window has three sections, Program Source,
Background Music Source and Page Zone.
Figure 2-6: Titan Channel Settings Window - Inputs and Zone Manager
The three sections of the Input and Zone Manager are described below.
Program Source
• Program Source - Drop list used to select the program source for the channel
Figure 2-7: Program Source Selection
• Volume Level - Volume for the selected program source for the channel
• Duck Level - Amount (in negative dB) that this channel will be reduced when a page is
made to the channel
• Mute - Checkbox used to mute the input
Background Music Source
• Background Music Source - Drop list used to select the background music source for
the channel
22
Chapter 2: Titan Channel Configuration
Figure 2-8: Background Music Source Selection
• Volume Level - Volume for the selected background music source for the channel
• Duck level - Amount (in negative dB) that this channel will be reduced when a page is
made to the channel
• Mute - Checkbox used to mute the input
Page Zone
• Page Zone - Drop list used to select the page zone assigned to the channel (All page
zones assigned to this frame will be available in this list)
Figure 2-9: Page Zone Selection
• Volume Level - Volume for the page source for the channel
Note:
For most applications, this level setting should be set at +12.5dB.
• Zone Status - Information regarding the current state of the zone
• Zone State - Idle or Active
• Page Bus - Bus number used for the current announcement or message
• Page Priority - Priority of the current announcement or message (1 to 254)
• Mute - Checkbox used to mute the input
23
Chapter 2: Titan Channel Configuration
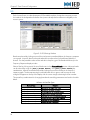
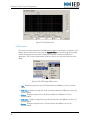
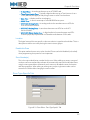
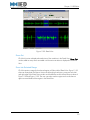
EQ
Each channel has a nine-band parametric EQ available to adjust the signal as necessary to meet
the needs of the loudspeakers and allow the system to be adjusted to maximize intelligibility in the
acoustic space.
Figure 2-10: EQ Settings Window
Bands are selected by clicking on one of the nine buttons immediately below the frequency response
curve graph. A specific band can be selected and then adjusted using the edit boxes below the
buttons. It is also possible to select a filter and edit its frequency, gain and bandwidth directly in the
Frequency Response display window.
Select a filter by clicking one of the nine filter buttons in the Selected Bands section. Adjacent bands
can be selected by using the [ALT]+[RIGHT ARROW] and [ALT]+[LEFT ARROW] key
combinations. A band can also be selected by clicking on one of the red dots in the frequency
response graph. The dot representing the selected band will turn green, and from one to three
triangles will appear at the top of the display with the center triangle containing the filter number.
The special key combinations for changing bands and controlling parameters are listed in the table
below.
Hi Pass or Lo Pass Filter Types
Shortcut Keys
[ALT] + [RIGHT ARROW]
[ALT] + [LEFT ARROW]
[ALT] + [UP ARROW]
[ALT] + [DOWN ARROW]
[SHIFT] + [LEFT ARROW]
[SHIFT] + [RIGHT ARROW]
[CTRL] + [LEFT ARROW]
[CTRL] + [RIGHT ARROW]
24
Function
Move to the next higher filter band
Move to the next lower filter band
Raise the gain of the filter band (boost)
Lower to gain of the filter band (cut)
Decrease the filter’s center/knee frequency
Increase the filter’s center/knee frequency
Decrease the filter’s bandwidth
Increase the filter’s bandwidth
Chapter 2: Titan Channel Configuration
Type Droplist box
Select a filter type in the Type droplist box. The available options are:
• Peaking – bandpass type filter
• Notch – Sharp bandpass cut type filter
• Hi Pass – Filter for rolling off frequencies lower than the cutoff frequency
• Lo Pass – Filter for rolling off frequencies higher than the cutoff frequency
• Disabled – Turn this filter off
Note:
The options for the filter parameters will change slightly depending on the filter type
selected.
Center Freq (Hz) Edit Box
The center frequency (or cutoff frequency) of the filter is set by entering a numeric value in
the edit box. The frequency parameter can also be changed with the [SHIFT]+[LEFT
ARROW] and [SHIFT]+[RIGHT ARROW] key combinations, or dragging the center
triangle above the graph laterally left or right.
Gain (dB) Edit Box
This is only available for Peaking and Notch filter types.
The filter gain is set by entering a numeric value (using + or - values for relative dB) in the edit
box. The gain can also be changed with the [ALT]+[UP ARROW] and [ALT]+[DOWN
ARROW] key combinations. A quick, but less precise method of editing, is performed by
clicking and dragging the green dot for the filter up or down in the frequency response
graph.
Bandwidth (Oct.) Edit/Droplist Box
This is only available for Peaking and Notch filter types.
The filter bandwidth is set by entering a numeric value in the edit box or selecting a predefined value from the list. The value used is measured in Octaves. For example, if a 1/3
octave filter is required then a value of 0.333 would be used. Several common bandwidths
are available for selection in the list that can be accessed by slicking on the down arrow on
the droplist box. The bandwidth can also be altered using [CTRL]+[LEFT ARROW] and
[CTRL]+[RIGHT ARROW] key combinations. The two exterior triangles located at the
top of the frequency response graph also change the bandwidth by clicking and dragging
either one laterally.
Class Droplist Box
This is only available for Hi Pass and Lo Pass filter types.
The mathematical function used to calculate the filter is selected by picking an available type
from the droplist box. There are three available class types listed below.
• Butterworth
25
Chapter 2: Titan Channel Configuration
• Bessel
• Linkwitz-Riley
Slope (dB/Oct.) Droplist Box
This is only available for Hi Pass and Lo Pass filter types.
This value determines the frequency roll-off rate for the filter in decibels per octave. Available
values range from a shallow 6 dB/Octave to a very steep 48 dB/Octave.
Bypass EQ Button
When activated, button removes the effects of all filter bands from the signal path without
resetting the filters to a flat response curve. When the EQ is bypassed, the signal will pass
through the object without any modifications to the frequency characteristics.
Gain Slider/Edit Box
The EQ provides a small range of gain adjustment in order to compensate for the overall
effect of the EQ curve and allow signal-to-noise ration and dynamic range to be maximized.
This gain is set by adjusting the slider or entering a value (in + or - relative dB) in the edit box.
The control can be adjusted to provide a range from 6dB of attenuation to 6dB of gain.
Set Flat button
This button resets all filters to a gain setting of 0dB (flat response) and sorts the filters
numerically from left to right on the Frequency Response Display.
26
Chapter 2: Titan Channel Configuration
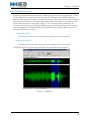
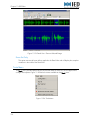
Ambient Analysis
Titan series amplifier frames are equipped with ambient noise compensation (Ambient Analysis),
capabilities when paired with a noise sensor collector, such as a T9032NS. Ambient Analysis adjusts
the output attenuation of a channel in response to ambient noise level measured in the area served
by the channel. Anywhere from one (1) to four (4) ambient noise sensors can be assigned to each
channel. Channels can also be slaved to other channels. This functionality is configured from the
Ambient Analysis view on the Channel Settings window as shown in Figure 2-11.
Figure 2-11: Ambient Analysis
Attenuation Mode
Each channel can be set to one of three different possible attenuation modes as described
below.
Fixed
This mode deactivates the ambient noise compensation for this channel. The channel
output level will remain at the level set by the Channel Out attenuator.
Figure 2-12: Fixed Attenuation Mode
Automatic
This mode will allow the level of the channel to automatically adjust based on the
ambient noise level as detected by the ambient sensor input. The level will increase
above the Channel Out attenuator setting as higher ambient noise levels are detected
by the ambient noise sensor. The level will increase by an amount proportional to the
detected level as determined by the Scaling Constant. The maximum level increase is
determined by the Gain Range slider.
27
Chapter 2: Titan Channel Configuration
Figure 2-13: Automatic Attenuation Mode
Slave
This mode will cause the selected channel to follow the ambient noise compensation
settings of another channel. Using this setting allows multiple outputs on the same
T9160 frame to be adjusted by a single sensor or a gang of sensors. This setting is useful
in very large spaces where multiple amplifier channels are required due to the power
load requirements of the loudspeaker lines.
Figure 2-14: Slave Attenuation Mode
Note:
A channel can only be slaved to a channel that is located in the same T9160
mainframe.
Program
This level meter displays the real-time audio signal level at the input of the Ambient Analysis
object as shown on the digital signal flow. This signal is post-EQ and post-delay but does
not have the test signal.
Sensors
Level
This level meter displays the real-time sound pressure level (SPL) from the ambient noise
sensor.
Note:
28
This level is the sum of both the ambient noise in the space and the program audio
from the system. The Ambient Analysis algorithm filters out the audio system’s
contribution to the overall level and provides a real value of ambient noise level to
the system for processing.
Chapter 2: Titan Channel Configuration
Threshold
The threshold determines the level at which the ambient noise compensation is
suspended because the level at the sensor is too low. When the detected level from the
ambient noise sensor rises above the threshold setting, then the system will actively
operate. It will filter the system program audio component from the detected level to
accurately adjust the output attenuation based on the calculated noise level. When the
level is below the threshold, the system will stop actively adjusting the output attenuation
and return to the maximum attenuation setting which is the base level setting as defined
by the Channel Out level control.
The threshold is set by adjusting the slider with the mouse or by manually typing a value
in the edit box below the slider using a positive numerical value.
Gain Calc.
Scaling Constant
The Scaling Constant determines the amount of ambient noise level that will result in the
output level to increase by 1dB. A scaling constant of 1 will result in the output level
increasing by 1dB for each 1dB increase in ambient sensor level. Figure 2-11 shows a
scaling constant of 1.4. With this setting, a 1.4dB increase in ambient sensor level will
result in a 1dB increase in output level up to the point where the Limit has been reached.
Calibration Constant
This value is calculated and automatically entered during the channel calibration
process. It can be manually adjusted by typing in a new value in the edit box or by
clicking the up/down arrow buttons on the right of the box.
Caution!
This value should only be manually adjusted after an automatic calibration has not
been completely successful. Adjustments should be made in very small increments of
2 or 3 dB at a time.
Use the following guidelines when adjusting the calibration constant if the system is not
properly responding after an automatic calibration.
• If the system turns down as soon as an announcement is active, then the
calibration constant is too high. It should be reduced in small increments until
the system remains stable while an announcement is active.
• If the system gets louder as while an announcement is active, then the calibration
constant is too low. It should be increased in small increments until the system
remains stable while an announcement is active.
Filter
Attack
This value determines the rate at which the output level will increase when an increase in
the ambient sensor level has been received. The value is in the number of seconds and
can be directly entered in the box using the keyboard or adjusted using the arrow
29
Chapter 2: Titan Channel Configuration
buttons on the right of the box.
Release
This value determines the rate at which the output level will decrease when a decrease in
the ambient sensor level has been received. The value is in the number of seconds and
can be directly entered in the box using the keyboard or adjusted using the arrow
buttons on the right of the box.
Presets
• Fast - Preset where the attack time is 1 second and the release time is 2 seconds.
• Medium - Preset where the attack time is 3 seconds and the release time is 4
seconds.
• Slow - Preset where the attack time is 7 seconds and the release time is 10 seconds.
Limit
The limit sets the maximum amount of gain that can be applied through the ambient
analysis compensation process. The amount of gain available is determined by the
attenuator setting of the Channel Out slider. For example, if the channel out slider is set to 20dB as shown in Figure 2-11, then the maximum available setting for the Limit slider will be
+20dB. Setting the Limit to +12dB will cause the output level to be increased by a maximum
of 12dB above the setting of the Channel Out slider. Thus, with very loud ambient noise
levels the output level will be effectively set to -8dB and reduced to -20dB when the ambient
noise level is very low or has dropped below the threshold. The ambient noise compensation
will be continually adjusted within this range as long as the noise level remains above the
threshold but below the amount required to drive the system to maximum level.
Note:
The Ambient Analysis algorithm differentiates between program audio and ambient
noise level detected by the ambient noise sensor. It is possible for the sensor level to
be above the threshold with no ambient noise compensation applied when the level
detected is program audio from the system.
The limit is set by adjusting the slider with the mouse or by manually typing a value in the edit
box below the slider using a positive numerical value.
Ambient Out
This level displays the current setting of the Channel Out attenuator as it is being controlled.
Assign Sensors
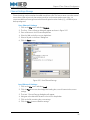
Clicking on the Assign Sensors button will launch the Ambient Sensor Assignment window as
shown in Figure 2-15. This is where one or more ambient sensors are directly assigned to control
the currently selected channel. Each channel can have one (1) to four (4) ambient noise sensors
assigned. When multiple sensors are use, the system averages the signal levels from all assigned
sensors to obtain an ambient noise level reading. There are three very critical rules related to
using multiple ambient noise sensors in a single zone that are described below.
30
Chapter 2: Titan Channel Configuration
Rules for using multiple sensors for a single zone:
• All sensors must be connected to the same sensor collection unit.
• All sensors must be connected to the same input group on the collection unit.
• All sensors must be located in the same loudspeaker zone.
Figure 2-15: Ambient Sensor Assignment
Ambient Sensor Assignment
1. Click on the Assign Sensors button from the Ambient Analysis Window. The Ambient
Sensor Assignment window will be displayed as shown in Figure 2-15.
2. Select the appropriate ambient sensor collection unit from the droplist box located at the
top right portion of the window.
3. Select the checkbox for the sensor(s) that will control this channel.
Note:
Sensor inputs on collector units are sub-divided into groups of eight (8). All sensors
for a single channel must reside on the same collector unit group. If a sensor is
currently selected for a channel, then all other groups will be grayed out and not
available for selection. To change to a sensor that is not located in the currently
selected group, first un-check all sensor assignments, then any sensor group will be
available for selection.
4. Click the OK button to apply the changes. Clicking the Cancel button will close the
window without applying any changes.
31
Chapter 2: Titan Channel Configuration
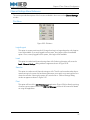
Ambient Sensor Description
Each ambient sensor channel can have a logical description assigned to it that allows it
to be easily associated with its physical location in the facility. The description can be
edited simply by right-clicking on the sensor name in the Ambient Sensor Assignment
and typing in a new name in the description box as shown in Figure 2-16.
Figure 2-16: Ambient Sensor Description
Click the OK button to apply the description change, or select Cancel to close the
window and discard any edits.
Note:
Sensor descriptions can also be assigned by left-clicking on any collector unit
(T9032NS) in the tree view and selecting Sensor Meters to bring up the sensor
meter display. The description can then be edited by right-clicking on a meter to
bring up the edit window as shown in Figure 2-16. This allows the sensor to be
identified prior to entering a description.
Calibration
In order for the ambient analysis function to operate properly, it must be calibrated. A detailed
tutorial is provided later in this manual describing the calibration process.
Figure 2-17: Calibration
Calibration Take
This is the take (message) number that will be played to the zone during the calibration
process. The take number can be manually typed in the box or adjusted using the up/down
arrow buttons on the right side of the entry box.
Use Live Announcement
Check this box if a live announcement from a microphone station will be used for calibration
instead of a numbered take.
32
Chapter 2: Titan Channel Configuration
Calibrate
Press this button to start the calibration process. The Calibration Take will be played to the
channel output unless the Use Live Announcement box is checked. If the Use Live
Announcement is checked, the designated microphone station will beep/flash ready to
indicate that a live page must be made to proceed with the calibration.
Figure 2-18: Stop Calibration
While the calibration is in process, the Calibrate button will change to a Stop button as
shown in Figure 2-18. The calibration process can be interrupted at any time by pressing the
Stop button.
Caution!
The ambient noise level in the area being calibrated needs to be at least 15dB below
the sensor threshold level setting during calibration in order to yield a valid
calibration.
Figure 2-19: Valid Calibration
Once a calibration has been completed, the status bar will display as shown in Figure 2-19 if
the calibration process produced valid results.
Test
The Test button will play the calibration take to the selected channel. This is used after the
calibration process is complete to see if the system correctly differentiates between program
and ambient noise. When the test take is playing and the calibration has been successful,
the level should not change. If the system turns up or down during the test playback, then
either the either the calibration constant should be adjusted or a re-calibration should be
attempted.
33
Chapter 2: Titan Channel Configuration
Delay
The delay object provides the ability to delay the signal up to 2 seconds in 1 millisecond (ms)
intervals. This area consists of a slider, and edit box and a bypass button. This object is used to delay
the signal for individual channels in designs where loudspeakers are positioned at varying distances
from the listener. Using proper delay settings, the system designer can adjust the timing of the signal
so that the sound will arrive at the listener at the same time from different loudspeakers, thus
preventing destructive interference that degrades intelligibility.
Figure 2-20: Delay Setting on a Titan Channel
Delay Time Slider/Edit Box
Precise delay times are set by entering a value in the edit box. Valid entries can range from
0ms to 2000ms. The delay time can also be adjusted by dragging the slider up and down to
the desired value.
Bypass Delay
This button effectively removes any delay applied to the signal by taking the delay object out
of the digital signal path. The delay time is effectively set to 0ms without losing the delay time
setting previously entered using the edit box or slider.
34
Chapter 2: Titan Channel Configuration
Channel Settings Storage
Channel settings may be saved and recalled to and from a file. This feature saves time when several
zones share similar acoustical characteristics and/or use the same speaker types. Also, it is
recommended that all settings be saved to files and copied to other media (e.g., a USB drive) as a
backup safeguard.
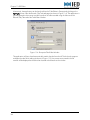
Save Channel Settings
1. Click on the File menu and select Save as.
2. The Save - Channel Settings dialog will appear as shown in Figure 2-21.
3. Enter a file name in the File name droplist box.
4. Select the XML as the Save as type droplist box.
5. Select a file path in the Save in dialog box.
6. Click the Save button.
Figure 2-21: Save Channel Settings
Load Channel Settings
1. Click on the File menu and select Load.
2. Click the Yes button to acknowledge that loading the curve will overwrite the current
settings.
3. The Load - Channel Settings dialog box will appear.
4. Navigate to the desired file location in the Look In droplist box.
5. Click on the file containing the curve settings.
6. Click the Open button to load the settings.
35
Chapter 2: Titan Channel Configuration
Figure 2-22: Load Channel Settings
36
Chapter 2: Titan Channel Configuration
Channel Settings Menu Reference
This section provides descriptions of the functions available in the menus on the Channel Settings
window.
File Menu
Figure 2-23: File Menu
Login/Logout
This option is context sensitive and will change from Login to Logout based on which option
is actually available. If currently logged into the system, then Logout will be the available
option. If not currently logged into the system, then Login will be available.
Load
This option is used to load channel settings from a file. Selecting this option will cause the
Load - Channel Settings dialog window to appear as shown in Figure 2-22.
Save As
This option is used to save all channel settings to a file. That file can be used as a backup to
restore settings in the event of a hardware replacement or to easily re-use settings from one
channel to another. Selecting this option will cause the Save - Channel Settings dialog
window to appear as shown in Figure 2-21.
Print
This option will launch the IED Print Manager application (Figure 2-24) to allow the printing
of various system reports. Refer to the IED Print Manager section of this manual for details
on using this application.
37
Chapter 2: Titan Channel Configuration
Figure 2-24: Print Manager
Close
Selecting this option will close the Channel Settings window.
Edit Menu
Figure 2-25: Edit Menu
Undo All Changes
This option will undo all changes that have been made since the current channel was
selected after opening the Channel Settings window. This option will be grayed out when
unavailable. It is important to remember that this command is only available to undo
changes made for the current channel. Switching to another channel while the window is
open will reset this option.
38
Chapter 2: Titan Channel Configuration
Copy All
This command will copy all the current channel settings to the clipboard. It allows channel
settings to be easily copied to one or more other channels.
Paste All
This command is only available if channel setting data has been placed on the clipboard
using the Copy All command. This will cause the channel settings stored in the clipboard to
be applied to the currently selected channel.
Inputs and Zone Manager
This command will change the window to display the Inputs and Zone Manager
configuration options.
Parametric Equalizer
This command will change the window to display the Parametric Equalizer (EQ) controls.
Delay
This command will change the window to display the Delay settings.
Ambient Analysis
This command will change the window to display the Ambient Analysis configuration
options.
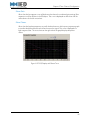
Monitor Menu
Figure 2-26 shows a close-up view of the signal flow map located at the top of the Channel
Settings window. The full signal flow can be seen in Figure 2-3 as the input router and zone
manager are not shown in this image. The M icon represents a virtual monitor point that is
available in the digital signal flow. Each point can be monitored by left-clicking on the icon or by
selecting the point in the Monitor Menu. When selected, the audio can be both monitored
visually and aurally through a local powered speaker properly connected to the appropriate
hardware.
Figure 2-26: Titan Frame Signal Flow
The Monitor Menu provides the same access to the various virtual monitor points as clicking on
the icon in the signal flow.
39
Chapter 2: Titan Channel Configuration
Figure 2-27: Monitor Menu
Direct Input
This switches to the monitor point to allow monitoring of the direct input of the selected
channel. This is the analog audio input located on the back of the T9160 mainframe.
EQ Output
This selects the monitor point located immediately after the EQ object in the digital signal
flow. This signal will include the audio mix with any filters that have been applied using EQ.
This signal will not include any ambient noise analysis level compensation or the test tone
used for system supervision.
Ambient Output
This selects the last monitor point in the digital signal flow and includes the audio mix with
filters applied using EQ, delay, level adjustments made using ambient analysis
compensation, and the test tone used for system supervision.
Amplifier Input
This selects the monitor point after the digital-to-analog conversion immediately before the
analog audio signal is sent to the input of the amplifier. This is the true analog signal that is
sent to the amplifier that has been converted back to digital audio to allow remote
monitoring.
Amplifier Output
This selects the monitor point that directly monitors the analog audio signal at the output of
the amplifier card at the integrated load sensor. Each amplifier output channel on a T9160
mainframe includes a speaker line load supervision module that directly monitors the
current in the loudspeaker circuit. This monitor point is the analog audio from this currentto-voltage supervision device and provides the best representation of the audio signal that is
sent to the loudspeakers.
40
Chapter 2: Titan Channel Configuration
Note:
The actual level of the signal at this point will vary proportionally with the
loudspeaker load since it directly represents the current in the speaker line. A higher
power amplifier load will result in more current drawn from the power amplifier,
thus increasing the level of the converted signal.
Show Meter
When this option is checked, the Signal Meter (Figure 2-28) will be displayed. When enabled,
the Signal Meter will always be displayed on top of other application windows that are
currently open.
Figure 2-28: Signal Meter
Auto Show Meter
When this option is checked, the Signal Meter will automatically be displayed when a
monitor point is selected from either the menu or by clicking on the monitor point icon in the
signal flow. When not checked, the Signal Meter must be opened manually by checking the
Show Meter menu option.
Help Menu
Currently, the only option available under the Help menu is to display the About Box.
Figure 2-29: Help Menu
About Box
This window displays information specific to the T9160.DLL file. This is the application file
that specifically governs communications between the Enterprise Software Suite and the
Titan Series T9160 or T9116 hardware devices. This window provides the file version, date
modified, size, and location on the host computer.
41
Chapter 2: Titan Channel Configuration
Figure 2-30: About Box
EQ Options
The EQ Options menu is only available when the EQ form is active. It contains five (5) different
controls that alter the display of the information in the EQ window. There are ten (10) vertical
divisions on the frequency response graph and the range of the graph can be altered to best
meet the needs of the application by configuring the Legend Scale and 0 dB Location settings.
The Frequency Scale setting controls the horizontal axis.
.
Figure 2-31: EQ Options Menu
Legend Scale
This setting alters the vertical range of the graph by determining the number of decibels (dB)
represented by each division of the graph. The available settings are 3dB, 6dB, 9dB, and
12dB.
Figure 2-32: EQ Display Legend Scale
42
Chapter 2: Titan Channel Configuration
Frequency Scale
This menu controls the horizontal divisions of the frequency response graph.
Figure 2-33: EQ Display Frequency Scale
Octave
This option displays the horizontal axis with divisions of equal width using a linear scale.
Figure 2-34: Octave Scale
Decade
This option displays the horizontal axis with divisions of varying width using a logarithmic
scale.
43
Chapter 2: Titan Channel Configuration
Figure 2-35: Decade Scale
0 dB Location
This menu controls the position of the 0dB reference point on the frequency response curve
display. When used in conjunction with the Legend Scale, the vertical range of the graph
can be tailored to give the necessary resolution necessary to meet the needs of the
application. The current reference point location is shown with a check mark next to the
option.
Figure 2-36: EQ Display 0 dB Location
• Top - Display a range from nine (9) divisions below the 0dB point to one (1) division
above.
• Mid Upper - Display a range from seven (7) divisions below the 0dB point to three (3)
divisions above.
• Center - Display a range from five (5) divisions below the 0dB point to five (5)
divisions above.
• Mid Lower - Display a range from three (3) divisions below the 0dB point to seven (7)
divisions above.
• Bottom - Display a range from one (1) division below the 0dB point to nine (9)
divisions above.
44
Chapter 2: Titan Channel Configuration
Show Gain
When checked, a response curve will be shown that shows the combined gain settings (filter
response curve) for all filters in the EQ object. This curve is displayed as a blue line with the
values shown on the left vertical axis.
Show Phase
When checked, a phase response curve will also be shown on the frequency response graph
to visualize the phase effects that the filters have on the signal. This curve is displayed in a
light magenta color. The vertical axis on the right side of the graph displays the phase
values.
Figure 2-37: EQ Display with Phase Curve
45
Titan Channel Configuration
This page has been intentionally left blank.
46
3
Titan IPAU Config Tool
The Titan T9160, T9116, and T90xxDSP devices are complex units with built in processors that provide a
variety of control and audio Digital Signal Processing. Each resides on the network and is able to send
and receive digital audio over the network. Each device must be configured properly before it will
function as a component of the system and communicate with the Enterprise software and any
announcement controllers. The Titan IPAU Config Tool is the software application used to configure the
device and is covered in the following sections.
48
IPAU Config Tool Interface
Menus
Toolbar Buttons and Controls
General Tab
48
49
51
Network Tab
53
Zone, Attn & Backup Tab
55
Mute & Bypass Tab
57
BGM Tab
59
The Titan IPAU Config Tool provides low-level setup of an individual component of a system. This utility
provides direct access to many parameters of the IPAU. Some of these parameters must be configured
from the IPAU Config Tool while others must be modified from Enterprise to ensure proper system
operation. Several parameters in this section are tagged with one of the three icons below to identify
their place in the setup process.
Parameters with this tag must be configured from the IPAU Config Tool before
the unit can be used in a system.
Parameters with this tag should not be modified in the IPAU Config Tool and
should be adjusted only from the appropriate Enterprise screen.
Parameters with this tag can be adjusted from the IPAU Config Tool if needed,
but the setting may be overridden by Enterprise during the course of normal operation.
47
Chapter 3: Titan IPAU Config Tool
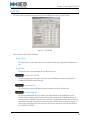
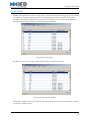
IPAU Config Tool Interface
Each Titan frame used in a system, must be configured at a basic level outside of IED Enterprise
before it can be used in a system. This configuration is accomplished using the IPAUConfigTool.exe
located in C:\IED\Tools\Titan folder on the system server computer.
The interface consists of a menu bar, buttons, and other controls located at the top of the window.
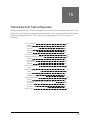
There are five (5) tabs that can be selected to configure different groups of parameters within the
frame. Each tab has a small LED-style indicator to indicate the status of the information on the tab.
Examples of all three can be seen in Figure 3-1.
• Yellow - The data on the tab has been modified, but the changes have not been sent to
the frame.
• Bright Green - The data displayed on the tab has been retrieved from the frame and
matches the current frame settings.
• Dark Green - The data has not been loaded from the frame to the tab.
Once the application has been started, an IP address must be entered first to point the application
to a frame. The application will open with the IP address last used. The default address from the
factory is 10.2.150.173 or 10.2.133.14. If the utility prompts to reload data, click on the Yes button.
Figure 3-1: IPAU Config Tool Detail
Menus
Application
This menu has the following options:
Set General Tab
Select this option to send all data on the General Tab to the frame at the address in the
IP Address entry box. This is equivalent to the Send Data button located on the General
tab. The [F4] key can be used as a shortcut to perform this function.
Get General Tab
Select this option to retrieve the information on the General Tab from the frame at the
address in the IP Address entry box. This is equivalent to the Get Data button on
General tab. The [F5] key can be used as a shortcut to perform this function.
Close
Select this option to exit the IPAU Config Tool application.
48
Chapter 3: Titan IPAU Config Tool
Actions
This menu provides access to the same functions available from the toolbar buttons.
Each function is described in the next section.
Help
Select About to bring up a dialog box with the application version number. The [F1]
key can be used as a shortcut to perform this function.
Toolbar Buttons and Controls
Figure 3-2: Toolbar Buttons and Controls
Set Date
Click this button to set the date and time in the Titan frame to match the computer's clock.
M. Perm (Make Permanent)
Click this button to save the settings in the frame. Changes are not permanently stored in the
frame until this button is pressed. Once stored permanently, these will be the new default
settings for the frame when it is powered up or reset. The [F6] key can be used as a
shortcut to perform this function.
Reset Flt (Reset Fault)
Click this button to reset the fault/warning flag in the frame. This will turn off the fault
indicator light on the front of the frame until a new fault has been detected. The [F7] key
can be used as a shortcut to perform this function.
Sft Reset (Soft Reset)
Click this button to send a reset command to the frame over the network. The [F8] key can
be used as a shortcut to perform this function.
Fctry Dflt (Factory Default)
Click this button to return the frame to factory default settings.
IP Address
This is the IP address of the frame to be configured by the Titan IPAU Config Tool. If the IP
address is changed on the Network Tab, it will need to be changed in this edit box in order to
communicate with it again.
49
Chapter 3: Titan IPAU Config Tool
Reload Data after Set/Reset
When checked, the tab shown will be reloaded from the frame after a change has been
made and data is sent. When not checked, data will be sent to the frame without validation.
It is recommended that this option remain checked to provide verification that the changes
were sent and accepted by the frame. It will result in slightly longer communication times.
50
Chapter 3: Titan IPAU Config Tool
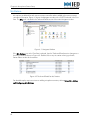
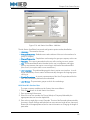
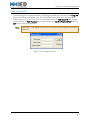
General Tab
Figure 3-3: General Tab
The controls on this tab are as follows:
IPAU Name
This is the name of the device and is usually the model number of the unit. It can be changed
if necessary, but it is recommended that the IPAU Location field be used to describe the unit.
IPAU Location
This field is used to store additional information about the frame. It can be used to indicate
the frame number in a system with multiple frames, or it can be used to describe the physical
location where it is installed.
Get Data
Click this button to retrieve the data from the frame necessary to populate all fields on this
tab. The [F5] key is also used to execute this command.
Send Data
Click this button to send the data on the tab to the frame. The [F4] key is also used to
execute this command.
Keep Current Device Handle/Bundle Numbers
Select this option to keep the current CobraNet device handle, transmitter, and receiver
information when sending data to the frame.
51
Chapter 3: Titan IPAU Config Tool
Use 32 Group (16 Frame) Handles
Check this box when 16 or more Titan IPAU frames are used in a system. This will ensure
that the correct device handles are used.
Calculate New Device Handle/Bundle Numbers
Select this option to use new CobraNet device handle, transmitter, and receiver information
to the frame the next time data is sent. This information is calculated and based off of the
information entered in the Group# and Frame# fields. These should be set to match the
data in the Enterprise treeview when setting up new frame.
Minimum Test Set Threshold
This is used for the automatic audio testing of the IPAU frame. When a system set is
performed to calibrate the supervision system, the values read during the calibration
process must be above this threshold to be used as valid set data.
Current Date Time in Frame
This field displays the date and time as it is currently set in the frame. It is used to see if there
is a discrepancy between the actual date/time and the date/time set in the frame.
Set Date and Time w/ Data
When checked, a date and time update will be performed when data is sent to the frame
using the Send Data button.
Caution!
It is critical that the date and time be set correctly in the frame. The date and time in
the frame is used to run scheduled tests and as a stamp when reporting system
faults.
PROM and FLASH versions
These fields display the version and date information PROM and Flash firmware that resides
in the frame.
52
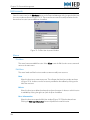
Chapter 3: Titan IPAU Config Tool
Network Tab
This tab is used to configure the network address properties for all three network ports on the IPAU
frame. Generally, only the Primary Audio Network Port is used for both audio and control.
Figure 3-4: Network Tab
The controls on this tab are as follows:
Single Ethernet Firmware checkbox
This box should remain uncheck for all Titan T9160 and T9032DSP frames.
Reload All
Click this button to load the data from the frame necessary to update the fields on this tab.
Control Network Port
When used, this port only provides control data to and from the frame. All audio is
transmitted and received over the Primary and/or Secondary network ports.
• IP Address - This is the IP address information for the Control Network Port.
• Net Mask - This is the Subnet Mask information for the Control Network Port.
• Default Router - This is the default router information used for the Control Network
Port. This setting is usually set to 0.0.0.0 as the frame is not connected via a router.
• Set - Click this button to send the data for the Control Network Port to the frame.
Primary Network Port
This is the main CobraNet port used by the frame to transmit and receive both control and
audio over the network.
• IP Address - This is the IP address information for the Primary Network Port.
• Net Mask - This is the Subnet Mask information for the Primary Network Port.
53
Chapter 3: Titan IPAU Config Tool
• Default Router - This is the default router information used for the Primary Network
Port. This setting is usually set to 0.0.0.0 as the frame is not connected via a router.
• Set - Click this button to send the data for the Primary Network Port to the frame.
Secondary Network Port
This is used to control the optional second CobraNet interface module in the frame. This
should not be confused with what is often referred to as the backup CobraNet port available
on the module. This redundant port is not brought to the backplane of the unit. The settings
for the Secondary Network Port should only be configured when the second interface
module is installed.
• IP Address - This is the IP address information for the Secondary Network Port.
• Net Mask - This is the Subnet Mask information for the Secondary Network Port.
• Default Router - This is the default router information used for the Secondary
Network Port. This setting is usually set to 0.0.0.0 as the frame is not connected via a
router.
• Set - Click this button to send the data for the Secondary Network Port to the frame.
54
Chapter 3: Titan IPAU Config Tool
Zone, Attn & Backup Tab
This tab is used to configure three sets of parameters. A T9160 amplifier frame has a dedicated slot
for a backup amplifier card. This tab configures the backup amplifier switching functions. This is
also where the zone numbers are assigned to each output channel. These are critical and must
match the zone settings in the Channel Settings of Enterprise. This tab also provides quick access to
the output attenuator for each channel and provides a quick method for setting all channels to the
same level.
Figure 3-5: Zone, Atten & Backup Tab
The controls on this tab are as follows:
Reload Data
Click this button to retrieve the data from the frame necessary to populate all fields on this
tab.
Send Data
Click this button to send the data on the tab to the frame.
Bk Amp Enable (Backup Amplifier Enable)
This setting is made for each amplifier card in the system. When checked, the system will
switch this amplifier card to the backup amplifier in the event that the card fails. When left
unchecked, that card will be excluded from the backup amplifier switching process.
Chan Attenuation
This is the setting of the output attenuator in the DSP that controls the signal level at the input
of the amplifier channel. The value entered must be in negative dB values that represent the
55
Chapter 3: Titan IPAU Config Tool
amount of attenuation required (e.g. -15 to apply 15dB of attenuation to the output signal).
The maximum value is 0dB which represents unity gain from the output of the DSP to the
input of the amplifier.
Disable All / Enable All
The function of this button toggles with each press. When it displays Disable All, clicking it
will uncheck all checkboxes in the Backup Amp Enable section. When it displays Enable All,
clicking it will check all checkboxes in this section.
Zones
This assigns the paging zone number to each channel.
+8
Click this button to increase the zone number assigned to each zone by 8.
-8
Click this button to decrease the zone number assigned to each zone by 8.
Set All
Click this button to set the channel attenuation value for all channels to the value typed into
the entry box immediately to the right of the button.
Backup Amp Mode
This setting controls the behavior of the backup amplifier.
• Off (No Backup) - This setting indicates that a backup amplifier card is not present in
the frame.
• Auto - Backup Amp Normally Off (Default) - This mode will turn the power on to the
backup amplifier card only when it is used. The front panel power switch must
remain in the on position at all times and the frame will control power to the card.
• Auto - Backup Normally On - This mode will allow the backup amplifier card to
always remain on when the front panel power switch is on.
• Manual - When this mode is set, the backup amplifier will only be switched in when a
command is sent from control software external to the frame.
56
Chapter 3: Titan IPAU Config Tool
Mute & Bypass Tab
This tab provides the ability to mute the direct inputs or BGM channel for each individual amplifier
channel. This also provides the ability to bypass the EQ and Delay objects in the DSP signal flow if
they are not required for the installation.
Figure 3-6: Mute & Bypass Tab
The controls on this tab are as follows:
Reload Data
Click this button to retrieve the data from the frame necessary to populate all fields on this
tab.
Send Data
Click this button to send the data on the tab to the frame.
Clear Hidden Mutes
Click this button to clear any mutes that are not visible from IPAU tool.
Mute
• Direct In - Check this box for each channel to mute the direct in located on the back
of the frame. It is recommended that all direct inputs be muted when not in use to
reduce residual noise.
• BGM In - Check this box for each channel to mute the BGM signal.
• Clear All / Mute All - The function of these buttons toggles with each press. When it
displays Clear All, clicking it will uncheck all checkboxes for all channels above the
button. When it displays Mute All, clicking it will check all checkboxes above the
button.
57
Chapter 3: Titan IPAU Config Tool
Normal Bypass
• EQ - Check this box to bypass the EQ object in the DSP for each channel.
• Delay - Check this box to bypass the Delay object in the DSP for each channel.
• Clear All / Bypass All - The function of these buttons toggles with each press. When
it displays Clear All, clicking it will uncheck all checkboxes for all channels above the
button. When it displays Bypass All, clicking it will check all checkboxes above the
button.
Hard Bypass
This function applies to legacy systems and is not applicable to newer Titan frames. When
checked, this will completely remove the Delay object in the DSP from the signal path instead
of placing the object in bypass using the Normal Bypass function. This was used for frames
that did not have internal memory installed to use the delay function. New frames ship with
the memory pre-installed and have eliminated the need to adjust this setting.
• Clear All / Bypass All - The function of these buttons toggles with each press. When
it displays Clear All, clicking it will uncheck all checkboxes for all channels above the
button. When it displays Bypass All, clicking it will check all checkboxes above the
button.
58
Chapter 3: Titan IPAU Config Tool
BGM Tab
This tab is used to configure the background music (BGM) routing for the Titan frame.
Figure 3-7: BGM Tab
The controls on this tab are as follows:
Reload Data
Click this button to retrieve the data from the frame necessary to populate all fields on this
tab.
Send Data
Click this button to send the data on the tab to the frame.
Standard ACS BGM
Click this button to quickly set the routing to receive the BGM channel from the default
standard ACS BGM network channel.
Frame Defaults
Click this button to set the BGM routing to the defaults stored in the firmware.
Cobranet Settings
For non-standard BGM routing schemes, the CobraNet Receiver should be set to the
receiver whose bundle number matches the bundle number of the CobraNet transmitter
used to transmit the BGM channel over the network. The CobraNet Channel should be set
to match the settings of the device used to transmit the BGM channel over the network. In
most cases, this will be the 510N card in the ACS and is configured in the BGM.INI file on
the 510CPU or 520CPU.
59
Chapter 3: Titan IPAU Config Tool
Route BGM audio To Bus:
This selects the internal audio bus that will receive the BGM audio signal from CobraNet.
The bus selected here can then be selected for each channel as the BGM source or as the
source for the Local BGM bus.
Local BGM
Select the input channel or internal audio bus to use for the Local BGM source in the frame.
This is what will be used for all channels set to 20-Local BGM as the BGM source.
The Gain parameter is used to adjust the overall level of the Local BGM. This property has a
range from -60dB of attenuation to 27.5dB of gain. It is normally set to 0dB.
Channel BGM inputs
Select the BGM channel to use for each individual channel.
Set All To Local BGM
Click this button to set all channels to 20-Local BGM as the BGM source.
60
4
Microphone Station Setup
The following sections provide information on configuring microphone stations. Additional information
related to the configuration of mic stations can be found in Tutorial C - Adding and Configuring Mic
Stations and the section on Mic Station Security located in this manual
Mic Stations
62
Mic Station Viewer
63
65
Mic Station Editor
General Tab
Permission & User Settings Tab
Groups/Companies & Gates Tab
Key & Button Assignments Tab
Sidekick Properties Tab
Additional Properties Tab
65
67
68
69
72
73
61
Chapter 4: Microphone Station Setup
Mic Stations
Mic stations are defined for each announcement controller and are added to the announcement
controller in Enterprise. Figure 4-1 shows the Navigator window with a 510CPU selected in the Tree
View. The Mics icon is located in the Tasks and Detail section of the main Navigator window.
Figure 4-1: Navigator Window
If the Mic Stations icon in the Tree View is selected, then the Tasks and Details section changes to a
list of mic stations as shown in Figure 4-2. Double-click on any mic station to bring up the Mic
Station Editor window for that station.
Figure 4-2: Tasks and Details for Mic Stations
For detailed step-by-step instructions on adding microphone stations, refer to Tutorial B - Adding
and Configuring Mic Stations.
62
Chapter 4: Microphone Station Setup
Mic Station Viewer
Double-click the Mics icon to bring up the Viewer as shown in Figure 4-3. This window provides a list
of all mic stations currently programmed in the selected announcement controller. This window
provides access to edit or delete existing mic stations as well as add new ones.
Figure 4-3: Mic Station Viewer
Double-click any mic station in the viewer to open the Mic Station Editor window for that station.
Figure 4-4: Mic Station Viewer Toolbar
The toolbar located at the top of the Mic Station Viewer window and provides quick access to the
commands needed to add, edit, or delete mic stations.
63
Chapter 4: Microphone Station Setup
Add
Click this button to add a new mic station to the system. This will open the Mic Station
Editor window to configure the new mic station.
Edit
Click this button to open the Mic Station Editor for the highlighted mic station.
Delete
Click this button to delete the selected mic station. Multiple mic stations can be selected
at the same time using [CTRL]+CLICK and [SHIFT]+CLICK functions.
Print
Click this button to open the print preview window with a list of mic stations and their
settings.
OK
Click this button to exit the Viewer window.
64
Chapter 4: Microphone Station Setup
Mic Station Editor
Figure 4-5 shows the Mic Station Editor window. This window contains multiple tabs visible along the
top of the window. Each tab contains different setup options as they relate to the description of the
tab. There are more tabs than can be visible at the same time due to the width limitations of the
window. The left/right arrows located to the far right are used to scroll through all the available tabs.
When the editor is used to edit an existing mic station, Previous and Next buttons will be visible in the
lower left corner of the window. These are used to go to the previous or next mic station in the list
without existing the editor. The user will be prompted to save the changes before moving to the
previous/next mic station if any changes have been made.
OK
Click this button to save all changes and exit the window.
Cancel
Click this button to exit the window and discard any changes that were made.
General Tab
The general tab (see Figure 4-5) has the basic information for the mic station and is used to
initially define the mic station. Options available on this and other tabs are determined by the
type of mic station defined on this tab.
Figure 4-5: General Tab
The controls on the General Tab are as follows:
65
Chapter 4: Microphone Station Setup
Mic Number
This is the microphone station ID number used to associate a mic station in the software
with the physical piece of hardware. For 528 Series mic stations, each must be
configured locally by accessing the setup features of the mic station. Each station is
associated to an announcement controller by a Group number and by the Mic Number.
Both must be set correctly in order for a mic station to function properly.
For analog mic stations (500 and 508 Series), the mic number is determined by where
the station is terminated on the 500C interface card.
Note:
This mic station number must be unique for a specific announcement controller
Group and must fall within the ranges defined in the system properties for the
announcement controller.
Location
This is descriptive text to describe the location and/or function of the mic station (i.e.,
Gate 1A or AA Ticket Counter).
Mic Type
This is the specific type (model) of the mic station. The correct type must match the
model number of mic station used for this station.
Activate Mic Station
This indicates that this mic station is active when the box is checked. This option allows a
microphone station to be completely disabled without being deleted from the system.
When the box is not checked, the physical mic station will not function. This is useful to
temporarily disable a microphone without losing any of its setup information. It is also
useful to reserve a slot for future mic stations that will be installed at a later point.
Lock Mic Station
This option enables or disables the lock feature of the mic station. When the box is
checked, users are required to log into the mic station and will have access based on the
mic station user permissions. When the box is not checked, the mic station is available
for use by anyone.
Note:
This feature is only available for specific types of mic stations and will be disabled
when a Mic Type is selected that does not support this feature.
EPROM Version
This feature is enabled only for certain 508 mic station types. It is important that this
EPROM version number matches the EPROM version number installed in the mic station
to ensure proper operation.
66
Chapter 4: Microphone Station Setup
Permission & User Settings Tab
Enterprise provides a great deal of control over the functions available at each mic station.
When a mic station is configured with the Lock Mic Station box unchecked, users are not
required to log into the station in order to use it. When a station not password protected, its
permissions are determined by the Permissions & User Settings tab. When station is locked,
then the permissions are determined by the configuration of the user in the Mic Station Users
setup section. When functioning in an unlocked state, a mic station is assigned to belong to one
or more User Groups. This setting determines the announcement functions available at this mic
station.
Figure 4-6: Permission & User Settings Tab
User Language
This setting determines the language used for the mic station user interface. This setting
is overridden when the lock feature is turned on. However, the language used for the
Login screen will still be set based on this setting.
Graphic Permission
This is a hexadecimal code that determines the button permissions of the mic station.
The value in this field is managed by the 528 Interface Designer when creating custom
buttons and scroll boxes that differ from the standard configuration. When the mic
station is locked, permissions are based on user login and this field is grayed out and
cannot be edited.
Caution!
This setting should not be modified manually unless directed to do so by an IED
Technical Support representative.
67
Chapter 4: Microphone Station Setup
User Groups
This setting allows user groups to be assigned to the mic station when it is not locked.
User groups are assigned to the station by checking the box next to the user group
name. Zone groups and PDRP messages are also assigned to user groups. When a mic
station is associated with one or more User Groups, then it will have access to any
announcements that are also assigned to that user group.
Groups/Companies & Gates Tab
This tab assigns ownership of a mic station to a specific company and also assigns it to one or
more gates. When active, only the annoucements available to the designated company will be
available at the station.
Figure 4-7: Groups/Companies & Gates Tab
Groups/Companies Droplist Box
This assigns a group or company to the mic station when the lock features is not used.
When the lock feature is enabled, then the user's login account determines this property.
Note:
For systems with the Flight Announcement System (FAS) installed, the group is
normally an airline. The mic station will only have access to that airline’s arrival or
departure announcements when the station is not locked. When it is locked, the
group/company associated with the mic station user determines announcement
availability.
Available Gates and Assigned Gates
These lists are used to associate the mic station with a specific gate or gates. The [>]
and [<] buttons are used to move selected gates between the available and assigned
lists. The [>>] and [<<] buttons move all items from one list to the other in the
appropriate direction.
68
Chapter 4: Microphone Station Setup
Note:
For systems with the Flight Announcement System (FAS) installed, a mic station can
only play FAS announcements to gates that are in the Assigned Gates list. For 528
series mic stations only flights that are assigned to gates in the Assigned Gates list
will appear for selection on the mic station display. When prompted for a gate
number on the 528 mic station, pressing the [ENTER] button will use a default of
the first gate listed in the Assigned Gates list.
Key & Button Assignments Tab
This tab is used to assign zone groups to individual buttons 500 and 520 series mic stations. It
also assigns zone groups to the Combined Zone Groups feature of the system.
Figure 4-8: Key & Button Assignments Tab
Combined Zone Groups
Combined zone groups is a unique feature allows the mic station entry codes 1 - 5 to
combine zone groups on the fly. The typical application for this feature is to provide a
consistent paging scheme for large facilities with many mic stations. When
programmed properly, entry 1 will always page the local zone. Entry 2 will page the local
zone plus the adjacent zone. This provides a user-friendly system by allowing the same
buttons to make announcements to the same physical space relative to the mic station
instead of requiring the user to remember the individual zone number for each area.
Figure 4-9 illustrates the relationship of the different combined zone group buttons.
69
Chapter 4: Microphone Station Setup
Figure 4-9: Combined Zone Groups
Figure 4-10 shows the assignment of a zone group entry code to a combined zone
group number. Click in the Combined Zone Group column of the table to open a
droplist box with the available zone group codes. Select the appropriate zone group to
correspond with the selected key. This Key number corresponds to the number entered
on the mic station.
Figure 4-10: Combined Zone Group Droplist Box
Mic Switch Code
This assigns the zone group or combined zone group entry code to the push-to-talk
(PTT) switch on the mic station or the [0/ANNC] button on mic stations with a
gooseneck microphone.
Mic Button Assignments
This feature is available for 500 and 520 series mic stations that have fixed button
assignments instead of a keypad. The 500 series mic stations have four (4) buttons and
the 520 series stations have eight (8) buttons in addition to the mic switch or [ANNC]
button. Zone group entry codes are assigned to each button in the Mic Button
Assignments table as shown in Figure 4-11.
70
Chapter 4: Microphone Station Setup
• Key - This represents the button number on the mic station. This field cannot be
edited.
• Button Assignment - This is the zone group entry code, PDRP entry code or combined
zone group entry code that will be activated when the button is pressed. Double-click
to open a droplist box and select the appropriate entry code.
• PDRP Zonemap Override - This is the zone group to use for the PDRP message
when triggered from the mic station. If the value is set to 0:NONE, then it will use the
default zones defined for that PDRP message.
Figure 4-11: Mic Button Assignments Tab
Combine
520 series mic stations only
The 520 series mic stations have eight (8) assignable buttons in addition to the mic
switch and have added functionality that allows buttons to be combined. Figure 4-12
shows the button assignments for a 520 mic station. In this example, buttons 1-5 are
designated as Combined. Those buttons now function differently and will not initiate an
announcement when pressed. Instead, the station will wait until the mic switch or
announce button is pressed and a page will be made to a combination of all zones in
the zone groups selected.
When buttons are configured in this mode, they will toggle when pressed. In the
example, if button 1 was pressed and then button 2 was pressed, both would be
selected as indicated by a green LED indicator. When the mic switch or announce
button is pressed, the announcement will be made to all zones in both zone groups 101
and 102.
71
Chapter 4: Microphone Station Setup
Figure 4-12: 520 Series Button Combination
Combined Zone Group Entry Code
520 series mic stations only
This is the entry code sent to the announcement controller when the mic switch or
announce button is pressed while combined buttons are active.
Sidekick Properties Tab
Sidekicks are available as an expansion option for the 528 mic stations. Each 528 mic station
supports up to three expansion stations that are available in two types.
• 528SK - This is a 4-button expansion station that can be programmed to page different
areas.
• 520FME - This is a simple expansion station that only has the mic switch (PTT) button.
Note:
72
This feature requires the optional 528E expansion board to be installed on the 528
mic station.
Chapter 4: Microphone Station Setup
Figure 4-13: Sidekick Properties Tab
Expansion Ports
This specifies the type of expansion station (0: none, 1: FME, or 2: Sidekick) for each
port. Click the text in the Device column to open a droplist box and select the
appropriate type. Double-clicking the device field allows the device number to be typed
in.
Sidekick Button Assignments
This table assigns the entry codes to the buttons and functions identically to the Mic
Buttons Assignments table on the Key & Button Assignments tab. The mic switch (PTT) on
the expansion stations will always use the same zone group assignment as that assigned
to the owner 528 series station.
Note:
The same button assignments are applied to all Sidekicks attached to the 528 mic
station.
Additional Properties Tab
This tab is used for custom mis station configuration and is rarely used. This tab should not be
edited unless directed to do so by IED Technical Support. When using the 528 Interface
Designer, the IP Address and Mic Template ID will appear in the window once the mic station
has been discovered.
73
Chapter 4: Microphone Station Setup
Figure 4-14: Additional Properties Tab
74
5
Mic Station Security
Enterprise has various mechanisms for restricting user access to microphone stations and features of
the announcement controller. Access to features is managed via User Groups, which are then assigned
to microphone stations, users and to specific system features, such as specific pre-recorded messages
and zone groups. A microphone station can only access those features that it is allowed. Permissions
can be fixed for the mic station or vary based on the user that is currently logged into the station. Groups
are always Airlines and used for the Flight Announcement System (FAS). Companies are other users,
such as a contractor, consultant, fire department, security, etc. This section covers three areas related to
mic station security.
User Groups
76
Companies
80
Mic Station Users
84
75
Chapter 5: Mic Station Security
User Groups
User Groups add a level of security to various aspects of the IED System by limiting access to zone
groups, PDRPs and many other features. Configuring zone groups, mic station users, etc. requires
selecting one or more User Groups from the user group list boxes in their respective editor forms.
For example, a mic station user setup with only the American Airlines user group will not be able to
page to a zone group that was not configured with the American Airlines user group. This ensures
that the end users have paging access to designated areas only. Similarly, if a user is not a member
of an emergency message user group, then they cannot initiate emergency messages associated
with that user group.
User Groups are accessed by double-clicking on the User Groups icon (as shown in Figure 5-1) in
the Enterprise software (after highlighting/selecting an announcement controller on the TreeView).
This brings up the User Groups Viewer (Figure 5-2) that lists all user groups that are setup in the
system.
Figure 5-1: User Groups Icon
A system is typically shipped with a few default user groups (e.g. All Call, All Call Emergency, etc.).
Steps to modify existing user groups or to add new ones are described in the appropriate sections
below. The toolbar at the top of the viewer provides the ability to add, edit, delete, or print user
groups.
Figure 5-2: User Groups Viewer
76
Chapter 5: Mic Station Security
Add
Click the Add button to open the User Group Editor with a blank form as shown in Figure 53. Enter a descriptive name for the user group here.
Figure 5-3: User Group Editor - New User Group
Add New User Group
The steps necessary to add a new User Group are as follows:
1. Click the Add button in the User Group Viewer.
2. Enter a meaningful description or name of the new user group.
3. Click on the OK button to save and return to the User Group Viewer. The new user
group will appear at the end of the list in the viewer.
Note:
The Cancel button can be clicked at any time to discard changes and return to the
viewer form.
Show Advanced Options
This button provides access to configure the microphone station graphic permissions.
This feature is provided for legacy support only and should not be used unless directed
by IED Technical Support. The 528 Interface Designer should be used to control the
graphic permissions for the mic stations.
Figure 5-4: User Group Editor - Advanced Options
77
Chapter 5: Mic Station Security
Edit
Click the Edit button to bring up the editor form for the user group selected in the User
Group Viewer. Alternatively, double clicking on a user group in the viewer will also open the
editor.
Figure 5-5: User Group Editor
Editing an existing user group opens a window with two additional buttons. Clicking on the
Previous and Next buttons allows quick navigation to the previous and next records in the
viewer. Navigating to a new record (via the Next and Previous buttons) after making
changes to the data in the editor will result in a confirmation prompt as shown in Figure 5-6.
The prompt options are as follows:
• Yes - Save current changes before navigating away.
• No - Do not save changes before navigating away.
• Yes to All - Save current and all subsequent changes while navigating using the
Previous and Next buttons without any additional prompts.
Figure 5-6: Edit Confirmation Dialog Box
Edit a User Group
1.
2.
3.
4.
Note:
78
The steps necessary to edit an existing User Group are as follows:
Highlight a user group in the User Group Viewer window.
Click the Edit button located on the toolbar.
Make necessary changes to the data on the form.
Click on the OK button to save and return to the User Group Viewer.
The Cancel button can be clicked at any time to discard changes and return to the
viewer form.
Chapter 5: Mic Station Security
Delete
Click the Delete button to remove the currently selected user group from the system. The
user is prompted for confirmation (Figure 5-7) before the selected record is erased. In
addition to erasing one record at a time, multiple records can be selected at once. Simply
select multiple user groups (by holding down the [CTRL] key and clicking on multiple
records) in the viewer and click on the Delete button from the toolbar.
Figure 5-7: Delete Confirmation Dialog Box
Delete a User Group
The steps necessary to delete an existing User Group are as follows:
1. Highlight a user group in the User Group Viewer window or select multiple user groups
by holding down the [CTRL] key while clicking.
2. Click the Delete button located on the toolbar.
3. Click the Yes button to delete the selected group(s).
Note:
The Cancel or No button can be clicked at any time to cancel the delete operation
and return to the viewer form.
Print
This button interfaces with the IED Print Manager software to open the print preview window
containing the user group data. Refer to the IED Print Manager section for more information
on this feature.
79
Chapter 5: Mic Station Security
Companies
Companies are used in conjunction with mic station users, that are assigned membership to
Companies. Companies are accessed by double-clicking on the Companies icon (as shown in
Figure 5-8) in the Enterprise software (after highlighting/selecting an announcement controller on
the TreeView). This brings up a viewer (Figure 5-9) that lists all companies that are currently setup in
the system.
Figure 5-8: Companies Icon
A system is typically shipped with a few default companies (e.g. IED, Fire Department, etc). Steps to
modify existing Companies or to add new ones are described in the appropriate sections below. The
toolbar at the top of the viewer provides the ability to add, edit, delete, or print companies.
Figure 5-9: Companies Viewer
Add
Click the Add button to open the Company editor with a blank form as shown in Figure 510. Enter a descriptive name for the company here.
80
Chapter 5: Mic Station Security
Figure 5-10: Company Editor - Add New
Add New Company
The steps necessary to add a new Company are as follows:
1. Click the Add button in the Company Viewer.
2. Enter a meaningful description or name of the new Company. Only the first 16
characters of the description will be displayed on the 508 or 528 mic stations. It is
recommended that the description be kept to 16 characters or less.
3. Click on the OK button to save and return to the Company Viewer. The new Company
will appear at the end of the list in the viewer.
Note:
The Cancel button can be clicked at any time to discard changes and return to the
viewer form.
Edit
Click the Edit button to bring up the editor form for the company selected in the Company
Viewer. Alternatively, double-clicking on a company in the viewer will also open the editor.
Figure 5-11: Company Editor
Editing an existing company opens a window with two additional buttons. Clicking on the
Previous and Next buttons allows quick navigation to the previous and next records in the
viewer. Navigating to a new record (via the Previous and Next buttons) after making
changes to the data in the editor will result in a confirmation prompt as shown in Figure 512. The prompt options are as follows:
• Yes - Save current changes before navigating away.
• No - Do not save changes before navigating away.
81
Chapter 5: Mic Station Security
• Yes to All - Save current and all subsequent changes while navigating the Previous
and Next buttons and do not prompt any more.
Figure 5-12: Edit Confirmation Dialog Box
Edit a Company
1.
2.
3.
4.
Note:
The steps necessary to edit an existing Company are as follows:
Highlight a company in the Company Viewer window.
Click the Edit button located on the toolbar.
Make necessary changes to the data on the form.
Click on the OK button to save and return to the Company Viewer.
The Cancel button can be clicked at any time to discard changes and return to the
viewer form.
Delete
Click the Delete button to remove the currently selected company from the system. The user
is prompted for confirmation (Figure 5-13) before the selected record is erased. In addition
to erasing one record at a time, multiple records can be selected at once. Simply select
multiple Companies (by holding down the [CTRL] key and clicking on multiple records) in
the viewer and click on the Delete button from the toolbar.
Figure 5-13: Delete Confirmation Dialog Box
Delete a Company
The steps necessary to delete an existing Company are as follows:
1. Highlight a company in the Company Viewer window or select multiple user companies
by holding down the [CTRL] key while clicking.
2. Click the Delete button located on the toolbar.
3. Click the Yes button to delete the selected company or companies.
82
Chapter 5: Mic Station Security
Note:
The Cancel or No button can be clicked at any time to cancel the delete operation
and return to the viewer form.
Print
This option interfaces with the IED Print Manager software to open up the print preview
window containing all the Company data. Refer to the IED Print Manager section for more
information on this feature.
83
Chapter 5: Mic Station Security
Mic Station Users
The Mic Station Users section is used to prevent unauthorized access to mic stations that are
configured to be locked and require login before operation. Mic Station Users are accessed by
double-clicking on the Mic Station Users icon (Figure 5-14) in the Enterprise software. This brings up
the Mic Station Viewer (Figure 5-15) that lists all users that are currently configured in the system.
Mic Station Users are global to all announcement controllers in the system.
Figure 5-14: Mic Station Users Icon
Steps to modify existing data or to add new ones are described in the appropriate sections below.
The toolbar at the top of the viewer provides the ability to add, edit, delete, or print users.
Figure 5-15: Mic Station Users Viewer
Add
Click the Add button to open the Mic Station Editor with a blank form as shown in Figure 516. Alternatively, double-clicking on a user in the viewer will also open the editor.
84
Chapter 5: Mic Station Security
Figure 5-16: Mic Station User Editor - Add New
The Mic Station User Editor has several configuration options as described below.
• Username - The name for this user.
• Groups/Companies - Radio buttons used to indicate if this user is the member of a
group or company.
• Groups/Companies - Droplist box used to assign the group or company to this user.
• Passcode - The numeric passcode that this user will use to log into a mic station.
• PIN - The Personal Identification Number for this user in installations with higher
security requirements that require a user to log in with both a Passcode and PIN.
(Not shown, but may be visible in some installations)
• User Language - The preferred language for the mic station user interface. In multilingual installations, the mic station will automatically change to this language upon
user log-in.
• Graphic Permission - A numeric representation of the User Groups selected for this
user. This is a read-only field and cannot be edited.
• User Groups - The permission groups to which this user belongs.
Add New Mic Station User
1.
1.
2.
3.
The steps necessary to add a new Mic Station User are as follows:
Click the Add button in the Mic Station User Viewer.
Enter a meaningful Username.
Select if the user is a member of a Group (Airline) or Company followed by the
appropriate selection from the droplist box.
Enter a four or eight digit numeric Passcode. The size of the Passcode is determined by
the setup in System Settings and by default set to a maximum length of four characters.
Please refer to the appropriate section for more information on changing the length of
passcodes.
85
Chapter 5: Mic Station Security
4. (optional) Enter a four or eight character long numeric PIN if the field is visible. The size
and visibility of the PIN is determined by the setup in System Settings. By default, the PIN
is not visible and not required. Please refer to the appropriate section for more
information on PIN.
5. Select the language for this user from the droplist box.
6. Select the appropriate entries from the User Groups listbox by clicking on the box next to
the group name.
7. Click on the OK button to save and return to the Mic Station Users viewer. The newly
added Mic Station User will appear at the end of the list in the viewer.
Note:
The Cancel button can be clicked at any time to discard changes and return to the
viewer form.
Edit
Click the Edit button to bring up the editor form for the user selected in the Mic Station User
viewer. Alternatively, double-clicking on a user in the viewer will also open the editor.
Figure 5-17: Mic Station User Editor
Editing an existing user opens a window with two additional buttons. Clicking on the
Previous and Next buttons allows quick navigation to the previous and next records in the
viewer. Navigating to a new record (via the Next and Previous buttons) after making
changes to the data in the editor will result in a confirmation prompt as shown in Figure 518. The prompt options are as follows:
• Yes - Save current changes before navigating away.
• No - Do not save changes before navigating away.
• Yes to All - Save current and all subsequent changes while navigating using the
Previous and Next buttons without any additional prompts.
86
Chapter 5: Mic Station Security
Figure 5-18: Edit Confirmation Dialog Box
Edit a Mic Station User
1.
2.
3.
4.
Note:
The steps necessary to edit an existing Mic Station User are as follows:
Highlight a user in the Mic Station User viewer window.
Click the Edit button located on the toolbar.
Make necessary changes to the data on the form.
Click on the OK button to save and return to the Mic Station Users viewer.
The Cancel button can be clicked at any time to discard changes and return to the
viewer form.
Delete
This option allows deleting the currently selected Mic Station User from the system. The user
is prompted for confirmation (as shown in Figure 5-19) before the selected record is erased.
In addition to erasing one record at a time, the user can choose to delete multiple records at
a time as well. Simply select multiple Mic Station Users (by holding down the [CTRL] key
and clicking on multiple records) in the viewer and click on the Delete button from the
toolbar.
Figure 5-19: Delete Confirmation Dialog Box
Delete a Mic Station User
The steps necessary to delete an existing user are as follows:
1. Highlight a user group in the Mic Station User Viewer window or select multiple users by
holding down the [CTRL] key while clicking.
2. Click the Delete button located on the toolbar.
3. Click the Yes button to delete the selected user(s).
Note:
The Cancel or No button can be clicked at any time to cancel the delete operation
and return to the viewer form.
87
Chapter 5: Mic Station Security
Print
This option interfaces with the IED Print Manager software to open up the print preview
window containing all the Mic Station User data. Refer to the IED Print Manager section for
more information on this feature.
88
6
528 Interface Designer
The 528 series of digital microphone stations has a default user interface that provides access to the
most common features needed in an airport facility. The 528 Interface Designer allows this default
configuration to be altered to meet the needs of the installation. This opens the use of the 528 series
microphone stations in other types of facilities. The following sections describe the usage of the 528
Interface Designer.
Note:
Launching the 528 Interface Designer
90
Templates
91
Opening, Adding, Renaming, and Deleting
Importing and Exporting Templates
Editing Templates
91
92
Toolbar
Buttons
95
The Button Bar
Button Properties
Scroll Boxes
98
99
101
95
98
Scroll Box Properties
Transfer Templates
101
104
Bulk Updating of Mic Stations
Announcement Controller Template Storage
Default Text Table Data
105
106
107
This section applies to version 1.0.4.0 of the 528 Interface Designer.
89
Chapter 6: 528 Interface Designer
Launching the 528 Interface Designer
The 528 Interface Designer is a separate application from the main Enterprise application.
Therefore, it is not launched from an icon or menu located within the Enterprise Navigator window.
The icon for launching the 528 Interface Designer is typically located on the IED Application Bar as
shown in Figure 6-2. On some legacy systems, it may have been installed at a later time and is
available as a shortcut icon on the desktop.
Figure 6-1: 528 Interface Designer Icon
Figure 6-2: Application Bar
From the application bar, click the 528 Interface Designer icon to launch the application. To launch
from the desktop, double-click on the desktop icon. The main application window will appear as
shown in Figure 6-3. From here, existing templates can be modified or new templates created and
subsequently downloaded to one or more 528 series mic stations in the system.
Figure 6-3: 528 Interface Designer
Security
While the 528 Interface Designer is not part of the main Enterprise application, it is still
governed by the overall IED System Security service. Therefore, a user must have permissions
assigned for the 528 Interface Designer in the Password Manager configuration. The
Login/Logout process is the same as described in the Overview section of this manual.
90
Chapter 6: 528 Interface Designer
Templates
Each button layout for a mic station is determined by a template. A single template can be used for
as many mic stations as needed. However, each mic station can only have one template loaded at a
time. Therefore, if a mic station must support multiple types of users (e.g., gate agent and
emergency personnel), then one template must have functions for all users. Access to each button is
determined by login permissions.
Opening, Adding, Renaming, and Deleting
By default, the last template edited will be loaded when the application is started. Once started,
existing templates can be opened for editing or download to mic stations or new templates can
be created.
Open a Template
1. Open the 528 Interface Designer by clicking on the icon located in the IED Application
Bar or on the desktop.
2. Click the Open Template button on the toolbar. This will display the Open Template
dialog box as shown in Figure 6-4.
3. Highlight the template in the window and click the OK button to load it. Double-clicking
on the template name in the list will also cause it to open.
Figure 6-4: Open Template
Add a New Template
1. Open the 528 Interface Designer by clicking on the icon located in the IED Application
Bar or on the desktop.
2. Click the New Template button located on the toolbar.
3. Enter a name for the template in the Template Name: field.
4. Click the Save Template button to save the new template.
91
Chapter 6: 528 Interface Designer
5. Add and edit buttons and scroll boxes as needed. Save the template periodically to
ensure changes are not accidently lost.
Rename a Template
1. Open the 528 Interface Designer by clicking on the icon located in the IED Application
Bar or on the desktop.
2. Click the Open Template button on the toolbar. This will display the Open Template
window as shown in Figure 6-4.
3. Highlight the template in the window and click the OK button to load it. Double-clicking
on the template name in the list will also cause it to open.
4. Edit the name in the Template Name field.
5. Click the Save Template button to save the template with the new name.
Delete a Template
1. Open the 528 Interface Designer by clicking on the icon located in the IED Application
Bar or on the desktop.
2. Click the Open Template button on the toolbar. This will display the Open Template
window as shown in Figure 6-4.
3. Highlight the template in the window and click the OK button to load it. Double-clicking
on the template name in the list will also cause it to open.
4. Click the Delete Template button located in the toolbar.
5. Click Yes to confirm the delete action. Clicking No will cancel the delete operation.
Figure 6-5: Delete Template Confirmation
Note:
This will delete the template from the database. Mic stations that have this template
loaded will not be changed until a new template is sent to those stations.
Importing and Exporting Templates
Sometimes it is necessary to create a template for one system and transfer it to another. In order
to accomplish this, the 528 Interface Designer provides functions to import from a file and
export to a file. The file is saved in an XML file format with a .xml file extension.
Export a Template
1. Open a template as previously described.
2. Click on the File menu and select Export Template To File as shown in Figure 6-6.
92
Chapter 6: 528 Interface Designer
Figure 6-6: Export Template Menu
3. This will open a standard Windows Save As dialog window as shown in Figure 6-7.
Figure 6-7: Template Save As Dialog
4. Type in a new name for the file in the Filename box. The .xml file extension is not
required. It will be added to the filename automatically if omitted.
5. Select xml files (*.xml) as selected in the Save as type droplist box.
6. Select the appropriate file location using the file system navigation tools located at the
top of the window.
7. Click the Save button to save the file.
Note:
Click the Cancel button at any time to close the window without saving the file and
return to the editor window.
Import a Template
1. Click on the File menu and select Import Template From File as shown in Figure 6-8.
93
Chapter 6: 528 Interface Designer
Figure 6-8: Import Template Menu
2. This will open a standard Windows Open dialog window as shown in Figure 6-9
Figure 6-9: Import Template Dialog
3. Select the appropriate file location using the and file system navigation tools located at
the top of the window.
4. Highlight the file to import as shown in Figure 6-9.
5. Click the Open button to load the template file. The imported template will have the text
“IMPORTED” appended to the front of the template name as shown in Figure 6-10.
Figure 6-10: Imported Template Name
6. Rename the template, if necessary, and click the Save Template button located in the
toolbar to save the imported template to the database.
94
Chapter 6: 528 Interface Designer
Editing Templates
A 528 mic station interface consists of combinations of buttons and scroll boxes. Each has their own
specific properties as they relate to functionality and appearance. The 528 Interface Designer's main
purpose is to provide a simple tool to manipulate these properties.
Template Name
This is the name of the template as stored in the database.
Enable Keypad
When checked, the numeric keypad on the 528 mic station will accept numeric entries as
defined in IED Enterprise under Entry Code Definitions. When unchecked, the numeric
keypad cannot be used to enter page codes. The mic station functionality is restricted to the
soft buttons mapped to the display. The keypad is still used to enter variable information
when prompted by the interface.
Toolbar
The toolbar is located at the top of the application window as shown in Figure 6-11. Some
buttons appear grayed out when that particular function is not available. Availability is based on
the button or scroll box selected in the tree view located along the left side of the application
window.
Figure 6-11: 528 Interface Designer Toolbar
The function of each button on the toolbar is described below.
95
Chapter 6: 528 Interface Designer
New Template
Click this button to create a new blank template.
Open Template
Click this button to open the Open Template dialog box as shown in Figure 6-4.
Save Template
Click this button to save the current template to the database.
Delete Template
Click this button to delete the current template from the database. The application will
prompt to confirm the delete action as shown in Figure 6-5.
Send to Mics
Click this button to open the transfer window and send the template to a mic station. See
"Transfer Templates" on page 104 for details on transferring templates.
Show Preview Window
Click this button to open the preview window for the mic station as shown in Figure 6-12.
This displays a simulation of how the buttons will appear on the interface once transferred to
a mic station.
There is a list box at the top of the screen titled User name to view the preview for:. This list box
contains the entire list of mic station users on the system (as defined in Enterprise). When
changing the value of this list box, the template will only show buttons and scroll box items
for the user selected. This is a good way to display what a template will look like for a
particular user without sending the template to the mic station.
Figure 6-12: Preview Window
96
Chapter 6: 528 Interface Designer
Add Button
Click this button to add a new button to the template. A new button is always added to the
bottom of the treeview. Once added, the position is changed using the Move Button Up /
Move Button Down buttons. Enter a name for the button in the caption field.
Delete Button
Click this button to delete the button currently selected in the treeview. This action is
immediate and does not result in any further prompting.
Move Button Up
Click this button to move the currently selected button up one level in the tree view. Click as
many times as needed to place the button in the desired place.
Move Button Down
Click this button to move the currently selected button down one level in the tree view. Click
as many times as needed to place the button in the desired place.
Add Scroll Box
Click this button to add a new scroll box to the template. Enter a name for the scroll box in
the title field.
Delete Scroll Box
Click this button to delete the currently selected scroll box from the template.
97
Chapter 6: 528 Interface Designer
Buttons
The Button Bar
Each 528 mic station has a line of buttons on the right of the display, referred to as the button
bar. The 528 Interface Designer is the tool used to program these buttons. When adding the first
button, it will appear under the Button Bar in the tree view on the left side of the screen. Clicking
on the Button Bar in the tree view will show settings that apply to all buttons in the template as
shown below in Figure 6-13.
Figure 6-13: Button Bar Screen
Button Width
This is the width (in pixels) of all buttons on the mic station screen. The default value is 110
pixels.
Button Default Background Color
This is the background color used for all buttons that have the Use Default Colors checkbox
checked next to the individual button color settings. This is useful as it provides an easy way
to control the color of many buttons in the template.
Button Default Text Color
This is the text color used for all buttons that have the Use Default Colors checkbox checked
next to the individual button color settings. This is useful as it provides an easy way to control
the color of the text in the template.
98
Chapter 6: 528 Interface Designer
Button Properties
When a button is selected on the treeview, its properties are edited using the controls displayed
on the right side of the application window as shown in Figure 6-14.
Figure 6-14: Button Properties
The controls available on this panel are as follows:
Button Action
This defines what will happen when a button is pressed. There are three options available.
• Show a Scroll Box - This action will result in opening the scroll box that is selected
from the adjacent droplist box.
• Key an Entry Code - This action will transmit the code entered in the adjacent entry
box to the announcement controller to activate a function.
• Log Out - This sets the button to perform the logout function when mic station
security is used in a system.
Caption
This is the text that is displayed on the button. The character limit of the text is determined by
the button width that is defined in the Button Bar section. Text will be automatically wrapped
to a second line if it does not fit on a single line. To force a second line, press the [ENTER]
key on the first line at the appropriate break point.
With the default button width of 110 pixels, the maximum number of characters that will fit
on the button is 22 characters.
99
Chapter 6: 528 Interface Designer
Background Color/Text Color
When the Use Default Colors checkbox is unchecked, the background color and text (font)
color can be changed for this button by clicking on the appropriate icon. If Use Default
Colors is checked, this button will use the default colors selected in the button bar panel.
Permissions
For systems that use mic station security or mic stations that are not locked, buttons are
shown or hidden based on permissions assigned to each user or mic station. Each button
has three options:
• Allow All User Permissions - Select this option to grant access to this button for all
users.
• Allow Same User Permissions As... - Select this option to slave the permissions for a
button to those of another button. The other button or scroll box to use as the master
is selected from the adjacent droplist box.
• Allow Specific User Permissions - Select this option to restrict access to this button
only to the users selected in the window. Check the box next to each user that should
be allowed access. Two shortcut buttons are to the right of the window (Check
All/Clear All) to allow quick selection or de-selection of all items in the list.
Note:
Because of hardware limitations, there is a limited number (31) of different Allow
Specific User Permissions available, so it's recommended to use the Allow Same User
Permissions As… option as frequently as possible.
Preview
This is a preview of the button as it will appear on the mic station. It is useful to see the text
layout of the button using the colors selected.
100
Chapter 6: 528 Interface Designer
Scroll Boxes
Scroll boxes provide a list of items that are selected to perform an action. Each item in a scroll box is
essentially the same as a button, but placed together in a group of other similar items. Using scroll
boxes allows the design of a more intuitive and organized user interface and reduces the number of
buttons. For example, a button can be created titled PDRP Messages and assigned an action to
open a scroll box that has a list of PDRP messages available for that mic station. Access to each
PDRP message in the list can be restricted based on individual user permissions.
Scroll Box Properties
When a scroll box is selected on the treeview, its properties are edited using the controls
displayed on the right side of the application window as shown in Figure 6-15.
Figure 6-15: Scroll Box Properties
The features of this panel are as follows:
Title
This is the text that appears at the top of the scroll box when it is visible.
Width
This setting controls the width of the scroll box. It is important to note that if text in the scroll
box exceeds this width, it will get cut off. This width can be no wider than the 528 screen
width, which is 320 pixels.
Background Colors
This selects the background colors for the items in the scroll box. The background for the
title bar, selected, and unselected items are each configured independently.
101
Chapter 6: 528 Interface Designer
Text Colors
This selects the text (font) colors for the items in the scroll box. The text colors for the title bar,
selected, and unselected items are each configured independently.
Items
Scroll box items are added to, edited, moved, or deleted from this item list. To move the
position of the item in the scroll box, drag the first column with the grey box to a new location
in the list.
Add Item
Click this button to add a new item to the bottom of the list. The position of the new item
can then be arranged appropriately in the list by clicking and dragging the row.
Delete Item
Click this button to immediately remove the highlighted item from the list.
Text
This is the text that will display in the scroll box for the selected item.
Action Type
This setting determines the type of action assigned to the item. Currently, the only type
available is Entry Code.
Action Data
This is the data associated with the item that is used when the item is selected. Currently,
the entry code (as defined in Enterprise) is the only option available. This is the code that
will be sent to the announcement controller when this item is selected to initiate an
announcement (e.g. PDRP Message Number, Zone Group Number, etc.).
Permissions
Each item in the scroll box is shown or hidden based on permissions assigned to each
user or mic station. Click the button in this column to bring up the permissions editor for
the item as shown in Figure 6-16.
102
Chapter 6: 528 Interface Designer
Figure 6-16: Scroll Box Item Permissions
Each item has three options:
• Allow All User Permissions - Select this option to give access to this item for all
users.
• Allow Same User Permissions As... - Select this option to slave the permissions
for an item to those of another button or item. The other button or item to use as
the master is selected from the adjacent droplist box.
• Allow Specific User Permissions - Select this option to restrict access to this item
only to the users selected in the window. Check the box next to each user that
should be allowed access. Two shortcut buttons are to the right of the window
(Check All/Clear All) to allow quick selection or de-selection of all items in the
list.
Note:
Because of hardware limitations, there is a limited number (31) of different Allow
Specific User Permissions available, so it's recommended to use the Allow Same User
Permissions As… option as frequently as possible.
Preview
The preview shows all items available for a scroll box as it will look on a 528 mic station. This
is handy to use to test text length and font colors. Clicking the Scroll Up and Scroll Down
buttons allow viewing of all items in the list.
103
Chapter 6: 528 Interface Designer
Transfer Templates
When a template is open, it can be sent to one or more mic stations at any time.
Transfer a Template to a Mic Station
1. Open the template as described previously.
2. Click the Send to Mics button in the toolbar to open the transfer selection window as
shown in Figure 6-17. This window will display all announcement controllers and the
mic stations available in a tree view. Each announcement controller can be expanded or
closed by clicking the + or - next to the checkbox.
Figure 6-17: Transfer Window
3. Select the mic stations in the system that will receive the template by checking the box
next to that mic station. Selecting the check box next to an announcement controller will
select all of its mic stations.
4. Click the Send button to begin the transfer process.
Note:
104
An IP address must be assigned to the mic station in Enterprise for this process to
work. If an IP address is not present or a broadcast address is not associated with
the announcement controller, then a prompt will appear for a broadcast address as
shown in Figure 6-18. If prompted, enter the broadcast address for the
announcement controller to begin the transfer.
Chapter 6: 528 Interface Designer
Figure 6-18: Enter Broadcast Address Window
Bulk Updating of Mic Stations
A special feature exists for transferring multiple templates to different mic stations in a single
bulk transfer process. This provides a faster transfer method when multiple templates have
already been created for mic stations in a system.
Execute a Bulk Update
1. Open the Actions menu and select the Update Database and Devices item. This will
open the bulk update window as shown in Figure 6-19. The upper window lists all mic
stations available in the system.
Figure 6-19: Update Database and Devices Window
2. Assign a template to a mic station by clicking on the template name for the mic station in
the Template column. This will open a droplist box of available templates in the system.
3. Repeat step 2 to assign a template to each mic station as needed.
4. Check the box next to each mic station to update.
5. Click the Update Mics button to transfer the templates to the selected mic stations.
105
Chapter 6: 528 Interface Designer
Announcement Controller Template Storage
Each announcement controller retains the template files for mic stations so that the correct
template is loaded whenever the mic station reboots with factory default objects. This also
applies to replacing a damaged mic station with a new one when it is configured with the same
IP address, group number, and mic number. To ensure that this will function correctly, the
templates must be transferred to the announcement controller.
Transfer Templates to Announcement Controller
1. Open the Actions menu and select the Update Database and Devices item. This will
open the bulk update window as shown in Figure 6-19. The lower window lists the
announcement controllers available in the system.
2. Check the box next to the announcement controller to receive the templates.
3. Click the Update ACS button to begin the transfer.
106
Chapter 6: 528 Interface Designer
Default Text Table Data
In each mic station, there are certain text elements that do not change when a template is
downloaded. This consists of generic text that is the same across all templates. These elements are
things such as the previous and next button labels and the Enter Zone Code prompt that appears
when entering a zone group. This text can be changed to alternative wording or other languages if
necessary. To edit this text, select the Default Text Table Data from the Edit menu to open the data
table as shown in Figure 6-20.
Figure 6-20: Default Text Table Data Screen
On this screen, select the appropriate field in the Text to Display on Mic Station column and edit it as
necessary. Click the Save button to save changes when finished. Click Cancel to discard changes
and close the window.
107
528 Interface Designer
This page has been intentionally left blank.
108
7
Zone Group Setup
Zone Groups are a key element in the Enterprise software. This is the terminology and method used to
define and program functions for system outputs known as page zones. Zone Groups consist of one or
more zones and are used as elements when configuring microphone stations, live announcements,
recorded announcements, PDRP messages, and visual paging. The following sections provide a
description of Zone Group configuration.
Zone Groups
110
Zone Groups Viewer
111
Zone Group Editor
General Tab
Destination Tab
116
116
117
109
Chapter 7: Zone Group Setup
Zone Groups
Zone Groups are a collections of individual zones in a system that are treated as a single
announcement destination. When individual zones are programmed into zone group, they can be
accessed with a single entry code. For example, a very large open area in a facility may have 50
loudspeakers but each power amplifier can only power 10 loudspeakers. Therefore, the 50
loudspeakers will be broken up into five (5) individual power amplifier channels, each of which is a
zone with 10 loudspeakers. Physically, all of these loudspeakers are located in the same room and
any page to that room will always need to go to all five (5) zones. A zone group would be made for
this room that is made up of all five (5) zone outputs. Therefore, to configure a mic station or PDRP
message to play to this room (all 5 zones), only a single zone group need be selected.
Zone groups can contain any number of analog audio (500D Card) zones, Titan digital audio
zones, visual display and relay zones. Typically there are three different zone group types in a system:
Local, Terminal and Emergency. Local zone groups are confined to zones within a single
announcement controller while terminal and emergency zone groups are global to all
announcement controllers in the system. These types are user-defined to each behave a certain way.
Announcement properties such as priority and if an announcement is live or recorded are
determined by the zone group type. For example, emergency zone groups are programmed to have
a higher priority than the other types. When an emergency announcement is made, it will override
any other announcements that are active in any of the same zones.
Figure 7-1: Enterprise Navigator Window
110
Chapter 7: Zone Group Setup
Zone Groups Viewer
Double-click the Zone Groups icon as shown in "Enterprise Navigator Window" on page 110 to
open the Zone Groups Viewer (See "{h1.SectionTitle}" on page 111). This window provides a list
of all zone groups currently programmed in the selected announcement controller. This window
provides access to edit or delete existing zone groups as well as add new ones.
Figure 7-2: Zone Groups Viewer
Double-click any zone group to open the Zone Group Editor window for that zone group.
Figure 7-3: Zone Groups Viewer Toolbar
The toolbar located at the top of the Zone Groups Viewer provides quick access to the commands
needed to add, edit, or delete zone groups.
Add
Click the Add button to open the Zone Group Editor with a new zone group entry as shown
in See "{h1.SectionTitle}" on page 112.
111
Chapter 7: Zone Group Setup
Figure 7-4: Zone Group Editor - New Zone Group
Add New Zone Group
The steps necessary for adding a new zone group are as follows:
Note:
Refer to "Zone Group Editor" on page 116 for details on the Zone Group Editor
window.
1. Click on the Zone Groups icon from the Enterprise Navigator window to open the Zone
Group Viewer.
2. Click the Add button to open the Zone Group Editor.
3. Select the appropriate Zone Group Type from the droplist box.
4. Enter an unused entry code for the new zone group. Valid range(s) of numbers available
for the selected zone group type will be listed in the pop-up help when the cursor is
placed over the entry code text box.
5. Type in a description of the zone group in the Location entry box.
6. Select the User Groups that will have permission to access this zone group.
7. Click the Destinations tab and select all system zones to be assigned to this zone group.
Holding the cursor over a zone will open the flyover help balloon containing the
description of each zone.
8. Click the OK button to save the changes and close the window.
Note:
112
The Cancel button can be clicked at any time to discard changes and return to the
viewer form.
Chapter 7: Zone Group Setup
Edit
Click the Edit button to open the editor form for the zone group highlighted in the Zone
Groups Viewer. Alternatively, double-clicking on a zone group in the viewer will also open
the editor.
Figure 7-5: Next / Previous Buttons
Editing an existing zone group opens a window with two additional buttons as shown in
Figure 7-5. Clicking on the Previous and Next buttons allows quick navigation to the
previous and next records in the viewer. Navigating to a new record (via the Next and
Previous buttons) after making changes to the data in the editor will result in a confirmation
prompt as shown in Figure 7-6. The prompt options are as follows:
• Yes - Save current changes before navigating away.
• No - Do not save changes before navigating away.
• Yes to All - Save current and all subsequent changes while navigating using the
Previous and Next buttons without any additional prompts.
Figure 7-6: Edit Confirmation Dialog Box
Edit a Zone Group
The steps necessary to edit an existing zone group are as follows:
Note:
Refer to "Zone Group Editor" on page 116 for details on the Zone Group Editor
window.
1. Click on the Zone Groups icon from the Enterprise Navigator window to open the Zone
Group Viewer.
2. Highlight a zone group in the Zone Groups Viewer.
3. Click the Edit button to open the Zone Group Editor.
4. Make the necessary changes to the data on the form.
5. Click the OK button to save the changes and close the window.
Note:
The Cancel button can be clicked at any time to discard changes and return to the
viewer form.
113
Chapter 7: Zone Group Setup
Delete
Click the Delete button to remove the selected zone group from the system. The user is
prompted for confirmation (See "{h1.SectionTitle}" on page 114) before the selected
record is erased. In addition to erasing one record at a time, multiple zone groups can be
selected at once. Select multiple zone groups by holding down the [CTRL] key while
clicking on the records. Click the Delete button after all selections have been made.
Figure 7-7: Delete Confirmation Dialog Box
Delete a Zone Group
1. Click on the Zone Groups icon from the Enterprise Navigator window to open the Zone
Group Viewer.
2. Highlight a zone group in the Zone Group Viewer window or select multiple zone groups
by holding down the [CTRL] key while clicking.
3. Click the Delete button located on the toolbar.
4. Click the Yes button to delete the selected group(s).
Note:
The Cancel or No buttons can be clicked at any time to cancel the delete operation
and return to the viewer form.
Filter
Click the Filter button to open a drop-down menu of available zone group types to display.
This allows the user to only view zone groups of the types selected in the Filter By menu. A
check next to the zone group type indicates the current filter setting.
114
Chapter 7: Zone Group Setup
Figure 7-8: Zone Group Viewer Filter
Filter the Zone Groups list
1. Click on the Zone Groups icon from the Enterprise Navigator window to open the Zone
Group Viewer.
2. Click the Filter button then move the cursor down to highlight the Filter By menu item.
3. Select the zone group type to be displayed. Select Show All to show all zone groups in the
list.
Print
This button interfaces with the IED Print Manager software to open the print preview window
containing the zone groups data. Refer to the IED Print Manager section for more
information on this feature.
OK
Click the OK button to close the Zone Groups Viewer.
115
Chapter 7: Zone Group Setup
Zone Group Editor
Adding a new zone group or editing an existing zone group will open the Zone Group Editor window
as shown in See "{h1.SectionTitle}" on page 116. When the cursor is moved to be above the Entry
Code edit box, a pop-up balloon help appears with the range of values valid for the selected zone
group type and for this announcement controller. There are two tabs on this window, General and
Destination, and they can be changed by clicking on the appropriate tab at the top of the window.
Figure 7-9: Zone Group Editor - General Tab
Details for the configuration options available on each tab are defined below. For step-by-step
instructions on adding, editing, or deleting zone groups, refer to the previous pages.
General Tab
Entry Code
The value to be entered in a mic station or assigned to a mic station button or pop-up menu
that will access this zone map. This value must be in the defined range for the selected Zone
Group Type (droplist box below). When the mouse cursor is held above the Entry Code edit
box, it displays the valid range of numbers in a pop-up balloon help box, as seen in "Zone
Group Editor - General Tab" on page 116.
Zone Group Type droplist box
The type of zone group (announcement) associated with this entry. These are defined
elsewhere in Enterprise by the system administrator. The default zone group types as
shipped from the factory are Terminal, Local and Emergency. These default types are
described below.See "{h1.SectionTitle}" on page 116
Terminal
10 through 99
116
Chapter 7: Zone Group Setup
Typically used for a large area in an airport such as a concourse or all of ticketing. These
announcements are recorded and played back as the zones become available. This type
of announcement is a lower priority and is typically used for courtesy announcements or
general information. Terminal zone groups are global and use zones in all
announcement controllers.
Local
3-digit code based on ACS number
Typically used for a gate holding area in an airport. This type of announcement is
recorded and played back as the zones become available unless modified in the
Announcement Definitions setup. Local announcements will override terminal
announcements that are playing in the same zone. Local zone groups are confined to
the announcement controller in which they are defined.
Emergency
901-950
By default these are the highest priority announcement and therefore will override any
other announcement in the system. These are used for emergency announcements
such as fire/evacuation or weather alerts. Unless used as a PDRP message, emergency
zone groups are always live and are global to all announcement controllers in the
system.
Location
A description of the zone group that is typically the physical location of the area. (e.g. Gate
1A, Concourse B, or Ticketing)
User Groups
A list of checkboxes used to define which user permission groups may access (use) this zone
group. If a user is not assigned to a user group that is associated with a zone group here
and attempts to page to this zone group, the mic station will indicate an error.
Destination Tab
The Destination tab (See "{h1.SectionTitle}" on page 118) is where zones are assigned to the
zone group.
117
Chapter 7: Zone Group Setup
Figure 7-10: Zone Group Editor - Destination Tab
Entry Code
The value to be entered in a mic station or assigned to a mic station button or pop-up menu
that will access this zone map. This value must be in the defined range for the selected Zone
Group Type (droplist box located on the General tab). When the mouse cursor is held above
the Entry Code edit box, it displays the valid range of numbers in a pop-up balloon help box.
This is the same as on the General Tab, shown here also for convenience.
Announcement Controller Tabs
These tabs are for selecting each announcement controller, in order to view and select
zones on that device. For some types of announcements, only the tab for the selected device
will be visible and the remaining tabs will be hidden. Local announcements will only show the
local announcement controller tab. Terminal and Emergency announcements will show all
tabs.
Zone Array
On each tab, there is an array of zones available on that device. Toggle the selection of each
zone on or off by clicking on it to determine membership to this zone group. Multiple
sequential zones may be selected by clicking the first zone, holding the [SHIFT] key then
selecting the last zone in the sequence.
Previous/Next buttons
These allow quick navigation to the previous or next zone group without exiting the window.
If any changes have been made to the zone group, a prompt will appear as shown in Figure
7-6.
118
8
Zone Setup
Zones are the actual outputs on a system. Typically, zones are the outputs from the system that deliver
announcements, program material, and/or background material to the physical space in a facility.
Zones are also used to define other types of system outputs as well, such as visual displays, relays, multiACS channels, data channels, etc. The following sections describe adding zones to an announcement
controller.
Zones
120
Zones Viewer
121
Zone Editor
General Tab
Zone Type Specific Tab
Additional Properties Tab
126
126
127
128
119
Chapter 8: Zone Setup
Zones
Zones are defined for each announcement controller in the system. All zones are accessed from the
Zones icon in Enterprise as shown in Figure 8-1.
Figure 8-1: Enterprise Navigator Window
There are two windows involved for editing zones: the Zones List Viewer and the Zone Editor. Each of
these windows is described in the sections that follow.
120
Chapter 8: Zone Setup
Zones Viewer
Double-click the Zones icon shown in Figure 8-1 to open the Zones Viewer (Figure 8-2). This window
provides a list of all zones programmed in the selected announcement controller. This window
provides access to edit or delete existing zones as well as add new ones. A filter can be applied to
simplify the list and make it easier to view a specific group of data.
Figure 8-2: Zones Viewer
Double-click any zone in the list to open the Zone Editor window for that zone.
Figure 8-3: Zones Viewer Toolbar
The toolbar located at the top of the Zones Viewer provides quick access to the commands needed
to add, edit, or delete zones.
121
Chapter 8: Zone Setup
Add
Click the Add button to open the Zone Editor with a new zone entry as shown in Figure 8-4.
Figure 8-4: Zone Editor - New Zone
Add New Zone
The steps necessary to add a new zone to the system are as follows:
Note:
Refer to the Zone Editor on page 126 for details on the Zone Editor window.
1. Click on the Zones icon from the Enterprise Navigator window to open the Zones
Viewer.
2. Click the Add button to open the Zone Editor window.
3. Select the Type for the zone.
4. Enter a description of the zone in the Location entry box.
5. Check the Enable this zone box to make the zone active. This can be left unchecked if
this zone will be activated at a later time.
6. Enter the number for the zone in the Zone Number(s) entry box. Multiple zones can be
added at one time by typing a “–” between numbers to indicate a range (e.g. 5–12) or
use commas to separate multiple zones (e.g. 5, 7, 9). If the number or range includes a
zone that already exists, that zone will be excluded from the addition and its data will not
be changed.
7. Click the Zone Type Specific tab and edit as required. (See page 127)
8. Click the Additional Properties tab and edit as required.
9. Click the OK button to save the changes and close the window.
Note:
122
The Cancel button can be clicked at any time to discard changes and return to the
viewer form.
Chapter 8: Zone Setup
Edit
Click the Edit button to open the editor window for the zone highlighted in the viewer.
Alternatively, double-clicking on a zone in the viewer will also open the editor.
Figure 8-5: Next / Previous Buttons
Editing an existing zone opens the editor window with two additional buttons as shown in
Figure 8-5. From this window, the option of entering multiple zones in the Zone Number(s)
is not available. However, the zone number can be changed from this window.
Clicking on the Previous and Next buttons allows quick navigation to the previous and next
records in the viewer. Navigating to a new record (via the Next and Previous buttons) after
making changes to the data in the editor will result in a confirmation prompt as shown in
Figure 8-6. The prompt options are as follows:
• Yes - Save current changes before navigating away.
• No - Do not save changes before navigating away.
• Yes to All - Save current and all subsequent changes while navigating using the
Previous and Next buttons without any additional prompts.
Figure 8-6: Edit Confirmation Dialog Box
Edit a Zone
The steps necessary to edit an existing zone are as follows:
Note:
Refer to "Zone Editor" on page 126 for details on the Zone Editor window.
123
Chapter 8: Zone Setup
1. Click on the Zones icon from the Enterprise Navigator window to open the Zones
Viewer.
2. Highlight a Zone in the Zones Viewer.
3. Click the Edit button to open the Zone Editor.
4. Make the necessary changes to the data on the form.
5. Click the OK button to save the changes and close the window.
Note:
The Cancel button can be clicked at any time to discard changes and return to the
viewer form.
Delete
Click the Delete button to remove the selected Zone from the system. The user is prompted
for confirmation ( "Delete Confirmation Dialog Box" on page 124) before the selected
record is erased. In addition to erasing one record at a time, multiple zones can be selected
at once. Select multiple messages by holding down the [CTRL] key while clicking on the
records. Click the Delete button after all selections have been made.
Figure 8-7: Delete Confirmation Dialog Box
Delete a Zone
1. Click on the Zones icon from the Enterprise Navigator window to open the viewer.
2. Highlight a zone in the viewer window or select multiple zones by holding down the
[CTRL] key while clicking.
3. Click the Delete button located on the toolbar.
4. Click the Yes button to delete the selected zone(s).
Note:
The Cancel or No buttons can be clicked at any time to cancel the delete operation
and return to the viewer form.
Filter
Click the Filter button to open a drop-down menu of available zone types to display. This
allows the user to only view zones of the type selected in the Filter By menu. A check next to
the zone type indicates the current filter setting.
124
Chapter 8: Zone Setup
Figure 8-8: Zones Viewer Filter
Filter the Zones list
1. Click the Zones icon from the enterprise Navigator window to open the viewer.
2. Click the Filter button then move the cursor down to highlight the Filter By menu item.
3. Select the zone type to be displayed. Select Show All to show all types in the list.
Print
This button interfaces with the IED Print Manager software to open the print preview window
containing the zones data. Refer to the IED Print Manager section for more information on
this feature.
OK
Click the OK button to close the viewer.
125
Chapter 8: Zone Setup
Zone Editor
Adding a new zone or editing an existing zone will open the Zone Editor window. "Zone Editor General Tab" on page 126 shows the Zone Editor for an existing zone. There are three tabs on this
window: General, Zone Type Specific, and Additional Properties.
Figure 8-9: Zone Editor - General Tab
Details for the configuration options available on each tab are defined below. For step-by-step
instructions on adding, editing, or deleting zones, refer to the previous section. There are two
buttons located along the bottom of the window that are common to all tabs.
OK
Click the OK button to save changes and close the window.
Cancel
Click the Cancel button to discard any changes and close the window.
General Tab
The General tab is shown in "Zone Editor - General Tab" on page 126. Settings for zones
must be made on this tab first. The options available on the Zone Type Specific tab are
dependant on the Type setting on this tab.
Owned By
This field displays the parent announcement controller that controls this zone. This field is
read-only.
Type
This droplist box sets the zone type. The current choices for types are:
126
Chapter 8: Zone Setup
• D-Card Zone - An analog audio zone on an ACS 500D card.
• Titan Digital Audio Zone - Typically a digital audio zone on a Titan frame such as a
T9160, but may also apply to relay or logic zones on other Titan hardware.
• Sign Zone - A display used for visual paging.
• 8000 Zone - A zone or zonemap on a slaved 8000 Series system.
• Multi-ACS Analog Audio - An analog audio tie-line zone between two ACS's for
multi-ACS announcements.
• Multi-ACS Analog Data - A control zone between two ACS's for multi-ACS
announcements.
• Multi-ACS Digital Audio Zone - A digital audio tie-line zone between two ACS's.
These are physically implemented via CobraNet audio between 510N cards.
Location
The logical name of this zone specific to the user selection is typed into the edit box. This is a
description to aid the user when placing this zone into zone groups.
Enable this Zone
This option makes the zone active when checked. Zones can be left disabled (unchecked)
when programming the system for future expansion.
Zone Number(s)
This is the unique identification number for this zone. When adding new zones, a range of
numbers can be entered and the software will automatically create all the individual zones
using the same general data. Afterwards, each zone must be edited to enter the location
and other properties. When editing an existing zone, only a single zone number can be
entered in this field to allow changing the zone number.
Zone Type Specific Tab
Figure 8-10: Zone Editor - Zone Type Specific Tab
127
Chapter 8: Zone Setup
Duck BGM on Connect
This setting is only available on analog 500D type zones. When checked, background music
is ducked during a mute action that does not have any audio.
Output To Device
This is the device that is associated with the selected zone. For example, 500D card zones
are associated with a 510CPU and digital zones are associated with a T9160 frame. The
names of the devices available are based on the device names in the treeview.
External Zone Number
This is a number that is passed to another device associated with the zone when the box is
checked. It is often used for Sign Zone types to indicate the display number that is different
from the actual zone number. When not checked, the zone number passed to the device is
the same as the zone number.
Min/Max Transmitter Channel edit boxes
This is used for all digital audio connections (e.g. T9160, multi-ACS, T9032DSP, etc.). This
defines the minimum and maximum number of network audio channels the will be used to
pass audio between ACS devices.
Additional Properties Tab
This tab is used for custom system configurations and is rarely used. This tab should not be
edited unless directed to do so by IED Technical Support.
Figure 8-11: Additional Properties
128
9
PDRP Messages
Permanent Digital Record/Playback (PDRP) Messages are announcements consisting of pre-recorded
message segments (referred to as Takes). These takes are stored, identified, indexed and may be
assembled together into coherent messages as needed. A take can be a sound, a word, phrase, or even
a complete message. This section describes the process of taking individual takes and putting them
together to form usable messages that can be triggered from microphone stations, external sources, or
play on a schedule. The actual process of recording and editing takes is covered in the DRP Editor
section of the manual
PDRP Messages
130
PDRP Messages Viewer
132
PDRP Editor
136
General Tab
Language User Groups Tab
Play Schedule Tab
Schedules
Assemble Take Tab
Assemble Takes Editor
Destination Tab
137
138
139
140
142
143
146
129
Chapter 9: PDRP Messages
PDRP Messages
PDRP Messages offer a wide range of possibilities in providing automated message playback in a
facility. PDRP Messages are sometimes referred to as assembled messages because the are created
by cascading a series of message segments, known as takes, together to create the final message. A
single take can be the full message, or only a part of a message. For example, the message text
below is an example of a situation where a single take would encompass the entire message.
“Passengers are reminded that they may carry-on two pieces of luggage. If you have more than
two pieces of luggage, which are oversized, the agent will be happy to check your luggage for
you.”
The system stores this take as a single file and it is indexed with a unique take number. In this
example, the take number is 8210 and it can be played completely using only that take. The next
example uses multiple takes to form a complete message.
“Welcome to Abilene Municipal Airport. For the health and comfort of the traveling public, all
terminals are smoke free. Smoking is permitted at designated curbside areas only. Thank you.”
This example consists of three individual takes that have been assembled together in the PDRP Editor
to play as a single message. Here are the individual takes.
“Welcome to Abilene Municipal Airport.”
“For the health and comfort of the traveling public, all terminals are smoke free. Smoking is
permitted at designated curbside areas only.”
“Thank you.”
To prevent takes from running together, the system also has takes that are nothing but silence.
These takes are inserted in between individual takes to produce natural pauses in the message. In
addition to silence, the system also contains takes of chimes or alert tones to gain attention to the
announcement. To produce the final “Welcome...” message, the following takes will be assembled
using the PDRP Editor
Take Number Description/Text
9991 1 Second of silence *
629 Welcome to Abilene Municipal Airport.
For the health and comfort of the traveling public, all
7250 terminals are smoke free. Smoking is permitted at
designated curbside areas only.
7325 Thank you.
* 1 Second of silence is recommended at the beginning of all PDRP messages.
Once a PDRP message has been assembled, it can be played through a variety of methods.
Messages can be programmed to play on a schedule so they will play every few minutes to specific
areas of the facility. Schedules offer flexibility by allowing messages to play only during a certain date
range, certain times of the day, or only on specific days of the week.
A good application example for this feature would be a major event occurring in a city over a specific
weekend. The airport wants to play a special welcome message to people arriving to the city for the
event. The message can be programmed on a schedule that only plays it on the days where they
anticipate many arriving passengers that will be attending the event. They can even change the
message on departure day to play a different message thanking them for their patronage.
130
Chapter 9: PDRP Messages
Microphone stations can be programmed to play PDRP messages. Access to certain messages is
restricted based on a user’s level of access when logins are enabled on the mic station. Therefore,
emergency messages can be blocked for general system users but made available only to security
personnel. Using additional interface hardware, messages can be played from external control
devices, such as a fire alarm or security panel.
PDRP messages offer a wide range of system possibilities. The following sections describe the
method of creating and assembling a PDRP message in the system.
Figure 9-1: Enterprise Navigator Window
131
Chapter 9: PDRP Messages
PDRP Messages Viewer
Double-click the PDRP Messages icon as shown in Figure 9-1 to open the Viewer (Figure 9-2). This
window provides a list of all PDRP messages programmed in the announcement controllers. PDRP
messages are global and apply to all announcement controllers in the system. This window provides
access to edit or delete PDRP messages as well as add new ones.
Figure 9-2: PDRP Messages Viewer
Double-click any message in the list to open the PDRP Message Editor window for that message.
Figure 9-3: Viewer Toolbar
132
Chapter 9: PDRP Messages
The toolbar located at the top of the Viewer provides quick access to the commands needed to add,
edit, delete, or print messages.
Add
Click the Add button to open the PDRP Editor with a new message entry as shown in Figure
9-4.
Figure 9-4: PDRP Message Editor - New Message
Add New PDRP Message
The steps necessary for adding a new PDRP message are as follows:
Note:
Refer to the PDRP Message Editor on "PDRP Editor" on page 136 for details on the
PDRP Message Editor window.
1. Double-click on the PDRP Messages icon from the Enterprise Navigator window to
open the Viewer.
2. Click the Add button to open the PDRP Editor.
3. Enter an unused entry code for the new PDRP Message. Valid range(s) of numbers
available for messages will be listed in the pop-up help when the cursor is placed over the
entry code text box.
4. Type in a description of the message in the Description entry box.
5. Select the appropriate announcement type in the Priority droplist box.
6. Leave the Audio Level Offset at 0 for a new message. This can be adjusted later to
change the level of the message if needed.
7. Click the Enable Monitoring checkbox if the message needs to be monitored through a
designated monitor zone.
8. Click the Enable Partial Activation checkbox if the message should play to available
zones if some zones are active with another announcement that is the same or higher
priority. If the message has a higher priority than an active announcement, then the
message will take over the active zones from the lower priority announcement.
133
Chapter 9: PDRP Messages
9. Click the Languages & User Groups tab and check the user groups that will have
permission to access this message and select the language(s) in which the message
should play.
10.Click the Play Schedule tab and enter how the message should be played. (See "Play
Schedule Tab" on page 139)
11.Click the Assemble Take tab and load the takes for the message. (See "Assemble Take
Tab" on page 142)
12.Click the Destination tab and select the zones where the message will be played. To save
time, a Zone Group can be loaded for the message by clicking the Load Zonemap
button and selecting a zone group from the drop-down list.
13.Click the OK button to save the changes and close the window.
Note:
The Cancel button can be clicked to discard changes and return to the viewer form.
Edit
Click the Edit button to open the editor form for the PDRP message highlighted in the PDRP
Viewer. Alternatively, double-clicking on a message in the viewer will also open the editor.
Figure 9-5: Next / Previous Buttons
Editing an existing message opens the editor window with two additional buttons as shown
in Figure 9-5. Clicking on the Previous and Next buttons allows quick navigation to the
previous and next records in the viewer. Navigating to a new record (via the Next and
Previous buttons) after making changes to the data in the editor will result in a confirmation
prompt as shown in Figure 9-6. The prompt options are as follows:
• Yes - Save current changes before navigating away.
• No - Do not save changes before navigating away.
• Yes to All - Save current and all subsequent changes while navigating using the
Previous and Next buttons without any additional prompts.
Figure 9-6: Edit Confirmation Dialog Box
Edit a PDRP Message
The steps necessary to edit an existing PDRP message are as follows:
Note:
134
Refer to "PDRP Editor" on page 136 for details on the PDRP Editor window.
Chapter 9: PDRP Messages
1. Double-click on the PDRP Messages icon from the Enterprise Navigator window to
open the Viewer.
2. Highlight a PDRP Message in the Viewer.
3. Click the Edit button to open the PDRP Editor.
4. Make the necessary changes to the data on the form.
5. Click the OK button to save the changes and close the window.
Note:
The Cancel button can be clicked at any time to discard changes and return to the
viewer form.
Delete
Click the Delete button to remove the selected PDRP Message from the system. The user is
prompted for confirmation (Figure 9-7) before the selected record is erased. In addition to
erasing one record at a time, multiple messages can be selected at once. Select multiple
messages by holding down the [CTRL] key while clicking on the records. Click the Delete
button after all selections have been made.
Figure 9-7: Delete Confirmation Dialog Box
Delete a PDRP Message
1. Double-click on the PDRP Messages icon from the Enterprise Navigator window to
open the Viewer.
2. Highlight a message in the Viewer window or select multiple messages by holding down
the [CTRL] key while clicking.
3. Click the Delete button located on the toolbar.
4. Click the Yes button to delete the selected group(s).
Note:
The Cancel or No buttons can be clicked at any time to cancel the delete operation
and return to the viewer form.
Print
This button interfaces with the IED Print Manager software to open the print preview window
containing the PDRP Messages data. Refer to the IED Print Manager section for more
information on this feature.
OK
Click the OK button to close the PDRP Message Viewer.
135
Chapter 9: PDRP Messages
PDRP Editor
The PDRP Editor window is displayed when either the Add or Edit operations are performed. The
editor window has five tabs across the top: General, Languages & User Groups, Play Schedule,
Assemble Take and Destination. By default, the General tab is shown and each tab is displayed by
clicking on it with the left mouse button. There are three buttons located along the bottom of the
window that are common to all tabs.
OK
Click the OK button to save changes and close the window.
Cancel
Click the Cancel button to discard any changes and close the window.
Play
Click the Play button to play the message to either the defined destination or a user selected
destination. Figure 9-8 shows the resulting window to set the play options for the message.
Figure 9-8: Play to Zone / Zonemap Pop-up
• Play to Selected Zones - Select this option to play the message to the zones as
defined on the Destination tab.
• Play to this Zonemap - Select this option to play the message to the Zone Group
selected from the droplist box.
• OK - Select this button to play the message.
• Cancel - Select this button close the window and return to the PDRP Editor without
playing the message.
136
Chapter 9: PDRP Messages
General Tab
Figure 9-9: PDRP Editor - General Tab
Entry Code
This is the identifier for the message and the code used when playing the message from a
microphone station or external control device. This value must be in the defined range for
PDRP Messages which is usually 1701 through 1799. A pop-up balloon window will appear
with the valid entry code range when the mouse pointer is moved over the entry code field.
Description
This field is used to enter a meaningful name for this message. (e.g. Curbside, No Smoking,
No Parking)
Audio Level Offset
This is used to adjust the volume level for the entire message. This can provide as much as
15dB of attenuation to reduce the level of messages that appear to be too loud. Messages
that are not loud enough can have their gain boosted here by as much as 6dB.
Enable Monitoring
When checked, the message can be monitored through a test zone.
Partial Activation
When checked, this message will be allowed to play when other announcements are already
active in some of its defined zones. The message will play in the zones that are available.
When not checked, the system will wait for all zones to be available before playing the
message.
137
Chapter 9: PDRP Messages
Priority
This determines the behavior of this message in relation to other messages or
announcements in the system. Higher priority messages or announcements will take over
zones from those set with a lower priority. A local priority announcement will override a
terminal priority announcement only in the local priority announcement zones. Figure 9-10
shows the drop-list for the available selections in the default system configuration.
Figure 9-10: General Tab Priority Drop List
Language User Groups Tab
Figure 9-11: PDRP Editor - Languages & User Groups Tab
138
Chapter 9: PDRP Messages
User groups
This list of check boxes determines who is allowed to activate this message from a mic
station. When logins are not required at mic stations, at least one user group for the mic
station must match a user group assigned to the PDRP message to allow the mic station
access to this message. When logins are enabled, the mic station user must belong to the
same user group as the message. Check all groups that apply to this message.
Languages
This selects the languages for this message. At least one language must be selected before
proceeding to the Assemble Take tab. The languages selected here will change the
language tabs available on the Assemble Take tab. The order of playback for messages
using multiple languages is determined by the order in the list from top to bottom. The
position of each language in the list is controlled by the buttons located to the right of the list.
• Top - Move the selected language to the top of the list.
• Up - Move the selected language up one position in the list.
• Down - Move the selected language down one position in the list.
• Bottom - Move the selected language to the bottom of the list.
Play Schedule Tab
The Play Schedule tab is used to define number of plays for a message when it is triggered from a
mic station or to put it on a schedule.
Figure 9-12: PDRP Editor - Play Schedule Tab
Unlimited Plays
Select this option to repeat the message indefinitely until a stop code is entered from a mic
station. Stop codes are 100 higher than the entry code used to start the message. For
example, if the PDRP message uses an entry code of 1701 to start, then an entry code of
139
Chapter 9: PDRP Messages
1801 will stop it.
Total Number of Plays
Select this option to play the message a fixed number of times when triggered from a mic
station or external interface. Enter the number of plays for the message in the entry box.
When triggered from a mic station or external closure, the message will play the number of
times entered unless a stop code is used to terminate it early.
Note:
This number cannot be 0. A number of 15 or higher will result in continuous
playback.
Minutes Between Plays
This is the time (in minutes) between the start of one message play and the start of the
following message play. If zero, then the message plays continuously back-to-back when
initiated from a mic station or external interface.
Schedules
Figure 9-13: PDRP Editor - Schedule Entry
Use The Following Schedule(s) Originating From...
Check this box to enable time-triggered playback for this message. Turning this on will
enable all schedule entries. Uncheck the box to stop scheduled playback. The droplist box to
the right selects the announcement controller that will actually play the message, if more
than one exists in the system.
140
Chapter 9: PDRP Messages
Add
Click the Add button to create a new schedule. This will open the Add/Edit Schedule
window as shown in Figure 9-14.
Edit
Click the Edit button to open the Add/Edit Schedule window for the highlighted schedule
entry.
Delete
Click the Delete button to remove the highlighted schedule from the system.
Caution!
This delete action is immediate and will not result in any additional confirmation
prompts. If a schedule is accidentally deleted, click the Cancel button to exit the
PDRP Editor without saving changes. The schedule will not be removed from the
system.
Figure 9-14: Add/Edit Schedule Pop-up Dialog Box
Schedule Editor
• Start Time - This is the time when the message will start playing on days/dates when
it is active.
• Stop Time - This is the time when a message will stop playing on days/dates when it
is active.
Note:
The start and stop times are in 24-hour clock format.
• Minutes Between Plays - This is the time (in minutes) between the start of one
message play and the start of the following message play. If zero, then the message
plays continuously back-to-back.
• Use Restricted Dates - This will restrict message playback to days that fall within the
range defined in the Start Date and Stop Date fields
141
Chapter 9: PDRP Messages
• Start/Stop Date - This is a range of dates in which to play this message when the Use
Restricted Dates checkbox is checked. Selecting this box will open a calendar box as
shown Figure 9-15.
Figure 9-15: Date Selection Calendar
• Days of the Week - These checkboxes specify which days to allow the message to
play.
Note:
Multiple schedule entries can be set for the same PDRP message. One schedule
entry may be defined to play the message between certain hours on weekdays, and
a second entry to play different hours on the weekend.
Assemble Take Tab
Figure 9-16 shows the Assemble Take tab with a PDRP message created to play in a single
language.
Figure 9-16: PDRP Editor - Assemble Take Tab
The controls on this tab are as follows:
142
Chapter 9: PDRP Messages
Language tabs
An individual tab will be displayed for each language as selected in the Languages & User
Groups tab. Each language has its own assembly that must be defined for the message to
play back correctly in multiple languages.
Assembled PDRP Message area
This area displays the message as it has been assembled for playback for the language tab
selected. Each take is displayed with the take number in green text surrounded by “[ ]”
followed by the actual text of the take.
Assemble button
Click the Assemble button to open the Assemble Takes Editor as shown in Figure 9-17.
Assemble Takes Editor
This window is used to put together individual takes to create the final PDRP message. It opens
as a result of clicking the Assemble button on the Assemble Take tab from the PDRP Message
Editor.
Figure 9-17: Assemble Takes Edit Window
The controls on this window are as follows:
Takes List
This is a list of the takes available on the system and is where takes are selected to be added
to a message. This list can be both searched (by take number) and filtered (by take type) to
make finding specific takes easier. It also displays specific information about each take.
• Take Number - This is the take as identified by the system. Take numbers are also
used as the filename for the actual take file in the format of <TakeNumber>.DAX.
143
Chapter 9: PDRP Messages
• Description - This is the text of the take. Only the first part of the text will fit in the list
due to the width of the column. When the cursor hovers over a take, flyover help
appears to show the entire text.
• Gender - M indicates that this take uses a male voice. F indicates that it is a female
voice.
• Duration - This is the duration (in seconds) of the take.
Insert Take
Click the Insert Take button to place the highlighted take from the Takes List to the left of the
current selection in the Assembled Message window.
Append Take
Click the Append Take button to place the highlighted take from the Takes List at the end of
the message in the Assembled Message window.
Replace Take
Click the Replace Take button to replace the take that is selected in the Assembled Message
window with the take highlighted in the Takes List.
Delete Selected
Click the Delete Selected button to delete the selected take in the Assembled Message
window from the message.
Filter By
Click the Filter By and highlight the Take Types text to open the filter list. Selecting any of the
available types will limit the display in the Takes List to only takes of that type. The filter
selection in use is indicated by a check next to the type. Figure 9-18 the list of available filter
criteria.
144
Chapter 9: PDRP Messages
Figure 9-18: Assemble Takes Filter Criteria
Search
To search for a specific take number, enter the number in the Search box and click the icon
to search for the take. When the take is found, it is listed in the Takes area in place of the list
as shown in Figure 9-19. The insert/append/replace button can be used to place the take
into the Assembled Message window. To get back to the complete list of takes, press the
[ESC] key as indicated or select the OK or Cancel buttons.
Note:
The search will only search the contents of the Takes List as displayed. Thus, if a filter
has been applied, takes not included in that filtered list will not appear in the search.
Select Show All as the filter criteria in order to search the entire take library.
145
Chapter 9: PDRP Messages
Figure 9-19: Assemble Takes Search Result Shown
OK
Click the OK button to save changes and exit the Assemble Takes Editor.
Cancel
Click the Cancel button to close the Assemble Takes Editor and discard any changes made.
Destination Tab
The Destination tab is used to define the default zones for this message. Figure 9-20 shows the
Destination Tab, and is very similar to the Zone Group Editor window for Emergency and
Terminal zone groups. There are sub-tabs for each announcement controller in the system.
146
Chapter 9: PDRP Messages
Figure 9-20: Destination Tab
Announcement Controller Tabs
These tabs are for selecting each announcement controller, in order to view and select
zones that are owned by that device.
Zone Array
On each tab, there is an array of zones available on that device. Toggle the selection of each
zone on or off by clicking on it to determine if it this message will play to that zone. Multiple
sequential zones may be selected by clicking the first zone, holding the [SHIFT] key then
selecting the last zone in the sequence. A flyover window will appear that displays the
location associated with the zone number.
147
Chapter 9: PDRP Messages
Load Zonemap
Figure 9-21: Load Zonemap
Click the Load Zonemap button to use zones previously defined in the Zone Groups setup. A
new window will appear (Figure 9-21) and a zone map is selected using the droplist box.
OK
Click the OK button to load the selected zone map to this PDRP message. Any previous
zone selections are discarded and the zone selections associated with this zone map are
applied to the PDRP message.
Cancel
Click the Cancel button to exit the window without loading the zone map definitions.
148
10
Takes
Takes are the fundamental element used for creating PDRP messages and FAS announcements in the
system. All PDRP messages are made up of one or more takes. Takes must first be added to the system
and then they are available for use in the PDRP Messages section of the application. The following
sections provide detail on managing takes stored in a system. For information on editing the audio of an
individual take, refer to the DRP Editor section of the manual.
Takes
150
Viewer
151
Take Editor
System-wide Take Tab
Record / Play Take Tab
VIS Tab
156
156
158
159
149
Chapter 10: Takes
Takes
Takes are audio segments that are stored as files on the system. These can be either a whole
message or a snippet, like a word or short phrase, to be assembled into a complete message. The
current takes in the system are managed from the Takes Viewer window. Takes are added to the
system using the Editor window. Takes are accessed from the Takes icon in Enterprise as shown in
Figure 10-1.
Figure 10-1: Enterprise Navigator Window
There are two windows involved for editing takes: the Takes Viewer and the Take Editor. Each is
described in the sections that follow.
150
Chapter 10: Takes
Viewer
Double-click the Takes icon shown in Figure 10-1 to open the Viewer (Figure 10-2). This window
provides a list of all takes programmed in the selected announcement controller. This window
provides access to edit or delete existing takes as well as add new ones. A filter can be applied to
simplify the list and make it easier to view a specific group of data.
Figure 10-2: Takes Viewer
Double-click any take in the list to open the Editor window for that take.
Figure 10-3: Takes Viewer Toolbar
The toolbar located at the top of the Viewer provides quick access to the commands needed to add,
edit, or delete takes.
151
Chapter 10: Takes
Add
Click the Add button to open the Editor with a new take entry as shown in Figure 10-4.
Figure 10-4: Take Editor - New Take
Add New Take
The steps necessary to add a new take to the system are as follows:
Note:
1.
2.
3.
4.
5.
6.
7.
8.
9.
Refer to the Take Editor on "Take Editor" on page 156 for details on the Take
Editor window.
Click on the Takes icon from the Enterprise Navigator window to open the Viewer.
Click the Add button to open the Editor window.
Enter a new (unused) take number in the Take Number field.
Select the appropriate language for this take from the Language droplist box.
Select the appropriate take type from the Take Type droplist box.
Select either Male or Female gender from the Gender droplist box.
Type in the text for the message in the Take Text entry box.
Go to the Record / Play Take tab.
Select the mic station that will be used to record the take from the Use Mic Station
droplist box.
10.Click the Record button. A window with the take text will appear and the mic station will
indicate that it is ready to record.
11.Press the mic switch on the station and record the message as it appears in the take text
window.
152
Chapter 10: Takes
12.To listen to the take, select the appropriate monitor zone group from the Play to Zone
Group droplist box.
13.Click the Play button to play the take to the selected zone group.
14.Click the Edit Take button to open the DRP Editor and edit the take if needed. Refer to
the documentation on the DRP Editor for instructions on take editing.
15.Once editing is complete, make note of the length (in seconds) of the new take and
close the DRP Editor.
16.If this is a multi-ACS system, click the Send button to distribute the take file to all systems.
17.Enter the length of the message in the Duration entry box on the System-wide Take Tab.
18.If the system uses visual paging displays, go to the VIS tab and click the Create VIS
button.
19.Click the OK button to save the changes and close the window.
Note:
The Cancel button can be clicked at any time to discard changes and return to the
viewer form.
Edit
Click the Edit button to open the editor window for the take highlighted in the viewer.
Alternatively, double-clicking on a take in the viewer will also open the editor.
Figure 10-5: Next / Previous Buttons
Editing an existing take opens the editor window with two additional buttons as shown in
Figure 10-5. Clicking on the Previous and Next buttons allows quick navigation to the
previous and next records in the viewer. Navigating to a new record (via the Next and
Previous buttons) after making changes to the data in the editor will result in a confirmation
prompt as shown in Figure 10-6. The prompt options are as follows:
• Yes - Save current changes before navigating away.
• No - Do not save changes before navigating away.
• Yes to All - Save current and all subsequent changes while navigating using the
Previous and Next buttons without any additional prompts.
Figure 10-6: Edit Confirmation Dialog Box
Edit a Take
The steps necessary to edit an existing take are as follows:
153
Chapter 10: Takes
Note:
Refer to "Take Editor" on page 156 for details on the Take Editor window.
1.
2.
3.
4.
5.
6.
Click on the Takes icon from the Enterprise Navigator window to open the Viewer.
Select the appropriate filter type in the Filter By drop-down menu.
Highlight a Take in the Viewer.
Click the Edit button or double-click on the highlighted take to open the Editor.
Make the necessary changes to the data on the form.
To edit the actual audio of the take, click the Edit Take button located on the Record /
Play Take tab.
7. Click the OK button to save the changes and close the window.
Note:
The Cancel button can be clicked at any time to discard changes and return to the
viewer form.
Delete
Click the Delete button to remove the selected take from the system. The user is prompted
for confirmation (Figure 10-7) before the selected record is erased. In addition to erasing
one record at a time, multiple takes can be selected at once. Select multiple messages by
holding down the [CTRL] key while clicking on the records. Click the Delete button after
all selections have been made.
Figure 10-7: Delete Confirmation Dialog Box
Delete a Take
1. Click on the Takes icon from the Enterprise Navigator window to open the viewer.
2. Select the appropriate filter type in the Filter By drop-down menu.
3. Highlight a take in the viewer window or select multiple zones by holding down the
[CTRL] key while clicking.
4. Click the Delete button located on the toolbar.
5. Click the Yes button to delete the selected take(s).
Note:
154
The Cancel or No buttons can be clicked at any time to cancel the delete operation
and return to the viewer form.
Chapter 10: Takes
Filter
Click the Filter button to open a drop-down menu of available take types to display. This
allows the user to only view takes of the type selected in the Filter By menu. A check next to
the type indicates the current filter setting.
Figure 10-8: Takes Viewer Filter
Filter the Takes list
1. Click the Takes icon from the enterprise Navigator window to open the viewer.
2. Click the Filter button then move the cursor down to highlight the Set Filters menu
item.
3. Select the language for the takes to be displayed from the Languages menu (Figure 108).
4. Select the take type to be displayed from the Take Type menu (Figure 10-8). Select Show
All to show all types in the list.
Print
This button interfaces with the IED Print Manager software to open the print preview window
containing the takes data. Refer to the IED Print Manager section for more information on
this feature.
OK
Click the OK button to close the viewer.
155
Chapter 10: Takes
Take Editor
Adding a new take or editing an existing take will open the Editor window. shows the Editor for an
existing take. There are three tabs on this window: System-wide Take, Record / Play Take, and
VIS.
Figure 10-9: Takes Editor - System-wide Take Tab
Details for the configuration options available on each tab are defined below. For step-by-step
instructions on adding, editing, or deleting takes, refer to the previous section. There are two buttons
located along the bottom of the window that are common to all tabs.
OK
Click the OK button to save changes and close the window.
Cancel
Click the Cancel button to discard any changes and close the window.
System-wide Take Tab
The System-wide Take tab is shown in Figure 10-9.
Take Number
This is a unique identification number for the take. Most take numbers in the system are reserved
for existing takes in the library. The take range 9401 through 9500 has been reserved for useradded takes. Use a number within this range for any new takes.
156
Chapter 10: Takes
Language
Select the language for the take. This setting does not affect the audio or text of the take. It is
used to categorize the take so it can be found correctly with other takes of the same language.
Note:
When recording a take in multiple languages, the same take number should be
used for each language. The system will store the takes in the appropriate language
folder.
Take Type
This assigns a quick reference group to the take. Takes are categorized by their general purpose
and are filtered by this setting from the Viewer. Figure 10-10 shows the list of take types available
in the system.
Figure 10-10: Take Types
Gender
Takes are identified as either male or female voice for reference.
Duration
This is the length (in seconds) of the take. It is used to calculate the correct timing information
when the take will be shown on a visual paging display. It is important that this time be correct
and is manually entered by typing a value directly in the entry box. The length of a take can be
found by using the DRP Editor window.
157
Chapter 10: Takes
Take Text
Type the text of the message into this box. The text in this box will be displayed when the take is
being recorded so the user can read the message, word for word, while recording. It is also used
to generate a visual message (VIS) file that is transferred to the announcement controller to use
the take for visual messages. Text must be entered into the Take Text field before proceeding to
the next step.
Record / Play Take Tab
Figure 10-11: Takes Editor - Record / Play Take Tab
Play To ACS
• Play to Zone Group - Select the zone group from the droplist box to play take when
the Play button is pressed.
• Play - Press this button to play the Take to the selected zone group.
Record Take Audio
• Use Mic Station - Select the mic station that will be used to record the take.
• Mic Station Status - This window displays the mic station status: ready, active,
offline, or no audio detected.
• Edit Take - Click this button to open the DRP Editor to edit the audio of the take.
• Show Text - Click this button to display a window containing the take text.
• Record - Click this button to activate the selected mic station and record the take.
The mic station will beep to indicate it is ready. Press and hold the mic switch or the
Annc/0 button (for gooseneck microphone stations) to record the message. Release
the switch/button when finished.
158
Chapter 10: Takes
Text To Speech
This option is only available if the Text-To-Speech (TTS) engine and appropriate language
options were purchased and installed on the system.
• Create TTS - Click this button to create the take using the TTS engine instead of
recording the take from a mic station. The take will be generated and transferred to
the announcement controller in the appropriate file format.
Note:
Text must be entered in the Take Text field for this feature to work.
Distribute DAX File
• Send - When a take is recorded or edited, it is saved only to the announcement
controller used to perform the record/edit function. In a multi-ACS system, click this
button to transfer the take to all ACS mainframes in the system.
VIS Tab
VIS files are small files that contain the text for the take along with timing information used to
properly show the take text on a visual display when used for visual paging. When a new take is
created, a corresponding VIS file must be created to provide information to the visual paging
system.
Create VIS
Click this button to generate the VIS file and transfer it to the appropriate announcement
controller.
159
Chapter 10: Takes
Figure 10-12: VIS Tab
160
11
DRP Editor
The DRP Editor is a standalone application that is part of the IED Enterprise suite of software. It allows
the user to record new takes or modify existing takes stored on the announcement controller. The
following sections describe how to use the DRP Editor.
DRP Recording
Audio File Formats
Recommended Recording Practices
Launching the DRP Editor
Main Window Overview
Menus
File Menu
Edit Menu
View Menu
Tools Menu
Help Menu
Toolbar
162
162
162
163
165
166
166
171
174
176
180
181
161
Chapter 11: DRP Editor
DRP Recording
The DRP Editor provides users with the ability to add their own message recordings to a system. IED
has reserved the take number range of 9401 through 9500 for all user-recorded messages. This
take range must be used in order to avoid conflicts with other takes already recorded in the take
library. If take numbers outside of this range are used, then it is likely that they will be lost when
system upgrades are performed or if a hard drive is replaced.
IED recommends that all custom on-site takes be sent to IED to be archived on our network This will
ensure that takes are preserved and can be restored on the system during upgrades or hardware
replacements.
Audio File Formats
The ACS hardware uses a proprietary file format for recorded audio. This file format is referred
to as a DAX file and uses a file extension of .dax appended to filenames. A standard PC audio file
format is known as a WAV file and uses the .wav file extension. The DRP Editor supports both
types of file formats and the ability to freely convert between them. WAV files must be 16 bit,
mono with a sample rate of 16 kHz (16,000 Hz). Audio files that do not match these parameters
must first be converted by another application before they can be used by the DRP Editor.
Recommended Recording Practices
IED has always prided itself on delivering professionally recorded audio takes with levels and
sound characteristics consistent throughout the years. To help ensure your audio takes match
these characteristics and levels please use the following guidelines when recording audio for use
in an IED system.
• Use an omni-directional mic to help eliminate proximity effect.
• Use a pop filter or wind screen to reduce plosives.
• Record the vocalist with all EQ adjustments set flat.
• If a compressor is used, use sparingly and do not introduce any pumping effects.
• Record with the nominal audio level around -5dBfs as viewed with a peak program
meter.
• All audio recordings should be done in a relatively noise free environment, free of noise
from mechanical equipment or other noise sources.
• After on-site recorded takes have been installed, it is recommended that listening tests be
performed on the ACS system PA by comparing playback of the new takes against
standard IED-supplied takes and general mic station pages to ensure that new takes
match in consistency and level.
162
Chapter 11: DRP Editor
Launching the DRP Editor
The DRP Editor can be opened in a number of ways. Typically, the application is opened by clicking
on the IED DRP Editor menu item from the Tools menu in IED Enterprise (as shown in Figure 11-1).
Figure 11-1: DRP Editor Menu Icon
Also, there is typically an icon for the IED DRP Editor on the IED Application Bar software as shown in
Figure 11-2.
Figure 11-2: DRP Editor Application Bar Icon
Launching the application from the Tools menu or from the Application Bar software produces the
window shown in Figure 11-3. The application starts with an empty workspace as indicated by the
dark gray background and the empty file navigation tab. Take files can be opened, retrieved, or
recorded using the appropriate menu and toolbar functions.
Figure 11-3: DRP Editor
163
Chapter 11: DRP Editor
Alternatively, the application can be launched from the Take Editor in Enterprise by clicking on the
Edit Take button under the Record / Play Take tab page (as shown in Figure 11-4). The application is
typically opened in this manner to edit the audio in the take recorded using the features on the
Record / Play Take tab of the Take Editor Window.
Figure 11-4: Enterprise Take Editor Window
The application will launch and automatically transfer the take from the ACS to the local computer
and open the take file for editing (as shown in Figure 11-5). Any errors encountered in the file
transfer will be displayed on the status bar located at the bottom on the window.
164
Chapter 11: DRP Editor
Main Window Overview
A graphical representation of the take audio is displayed in two sections of the application. The top
window displays the complete view of the take audio. The bottom window (labeled Detail View)
displays a selected portion of the file using the zoom features. Calling the Zoom In and Out features
only changes the Detail View. Clicking on either window with the left or right mouse buttons moves
the left and right selection cursors (seen in Figure 11-5 in white vertical lines) respectively. The
cursors provide a mechanism to select or highlight regions of the take for editing. Selected regions
have a blue background (instead of black) with the graph plotted in brighter green color with the
ends marked by white vertical lines.
Left Mouse Button
Click the left mouse button to set the selection start point at the cursor position.
Right Mouse Button
Click the right mouse button to set the selection end point at the cursor position.
The DRP Editor allows the user to open and work with multiple files at the same time.
Figure 11-5: DRP Editor
165
Chapter 11: DRP Editor
Menus
The menu bar at the top provides access to functions of the DRP Editor. The available menu
functions are described below.
File Menu
The File menu provides options to open, save and other file specific activities as shown in Figure
11-6.
Figure 11-6: File Menu
Login / Logout
Access to the DRP Editor is governed by the IED Security Server and users must be logged in
to use the application. Users can login (or logout) of the system at any time by selecting this
option from the File menu or by pressing the [F2] key. Figure 11-7 shows the login
window. Enter the proper user name and password to gain access to the application.
Figure 11-7: Login Window
The status bar is located across the bottom of the main application window. It displays the
user that is currently logged into the system as shown in Figure 11-8. The status bar displays
“Not Logged In” when no user is logged into the system.
166
Chapter 11: DRP Editor
Figure 11-8: Status Bar User
When logged in, the menu item changes to Logout and may be selected to log out of the
system. Pressing the [F2] key will immediately log out.
New File
This option creates a new blank audio take with a length of one second. New files are given
a default filename of *untitled1*, *untitled2*, etc. Files must be named when they are saved.
Multiple take files can be created, or opened, simultaneously and each will appear as a
separate tab located immediately below the toolbar as shown in Figure 11-9. Switching
between open files is accomplished by either clicking the appropriate tab or selecting the
filename from the View menu.
Figure 11-9: File Tabs
Open File
Select this option to open a take file from the local computer hard drive, mapped network
drive, or portable media. This will open a standard Windows Open dialog window to allow
selecting the file.
Note:
Only WAV files of specific formats supported by the DRP Editor will be properly
displayed (16 kHz, 16-bit, mono).
The length of the file and the positions of the left and right selection cursors are displayed on
the status bar at the bottom of the application window. By default, the left and right cursors
are set to the beginning and end of the file when opened. Figure 11-10 shows the total
length of the audio file is 40.61 seconds with the left and right cursors, abbreviated by letters
L and R, at 0 and 40.61 seconds respectively.
167
Chapter 11: DRP Editor
Figure 11-10: Take Detail View
Open File From ACS
Select this option to retrieve a take from the ACS. Selecting this option produces the window
shown in Figure 11-11. Select the appropriate take language and take filename then click
Open to retrieve the file from the ACS. The status bar at the bottom of the main window will
indicate any errors that may have occurred.
Click the Cancel button to close the window without opening a take.
Figure 11-11: Open File from ACS
Click the View DAX File List button to display a window that lists available takes on the ACS.
Save
Select this option to save the changes made to the file. If the file was new, a Save as dialog
window will prompt for a file name. Files are saved as either DAX or WAV formats. The
advantage of saving a file in the DAX format is that it can be easily downloaded to the ACS
via IED file transfer software. However, DAX files cannot be opened by other audio editing
applications. Saving as WAV allows the file to be readily opened (and edited) using other
audio editing applications, but cannot be directly transferred to an ACS.
168
Chapter 11: DRP Editor
Files that have been changed but not saved are marked by a red X to the left of the filename
on the file tab. Saved files are marked by a black X to the left of the filename on the file tab.
Figure 11-12 shows the file tab with three unsaved and one saved file.
Figure 11-12: File Tabs
Save As
This option is used to save a file to a local drive. Unlike the Save option, clicking on Save As
will always bring up a standard Windows Save as dialog where the user is prompted to
enter the filename and select the file type (WAV or DAX). The user can choose to keep the
existing filename and type or enter different ones.
Save to ACS
This option allows the active file to be saved directly to the ACS. Selecting this option will
display the window shown in Figure 11-13. Select the appropriate take language, enter the
take filename and click on the Save button to download the audio take file to the ACS. The
status bar located at the bottom of the main window will indicate success or failure of this
operation.
Click the Cancel button to close the window without transferring the file.
Care must be taken to not override a take file in the ACS unless intended. The user is not
notified if a file with the same name currently exists on the ACS. However, clicking on the
View DAX File List button produces a window that lists the files that are currently stored on
the ACS.
Note:
Note that this option is only available to logged in users with sufficient permission.
Figure 11-13: Save File to ACS Window
Save Selected to ACS
This option allows a selected region of the take file to be saved to the ACS. The selected
region of the take appears in brighter color with a blue background, whereas unselected
regions have a black background. A region is selected by setting the start point with the left
mouse button and then setting the end point with the right mouse button.
169
Chapter 11: DRP Editor
Clicking on this option opens the window shown in Figure 11-13. The behavior of this option
is identical to the Save to ACS menu option.
Close
This option closes the active take file. The user is prompted with a confirmation dialog box
(as shown in Figure 11-14) if the file has changes that have not been saved. Click the Yes
button to save and close the file. A Save as dialog window will open and prompt for a
filename if the file has never been saved. If it has been saved before, it will simply be saved
using the same name. Click the No button to close the file without saving. Click the Cancel
button to close the window and return to the application. The file that was attempting to
close will remain open.
Figure 11-14: Save Prompt
Close All
Select this option to close all open files. The user will be prompted for action regarding any
unsaved files. Click the Yes button on the confirmation dialog to save and close the file. A
Save as dialog window will open for new files that have never been saved. Click the No
button to close the file without saving. Click the Cancel button to close the confirmation
dialog and return to the application leaving any remaining files open. Click the Yes to All
button to save all currently open files. Files that already have a filename will be saved and
closed automatically and those that are labelled *untitled* will be closed after a filename is
entered using the standard Windows Save as dialog boxes.
Figure 11-15: Save Prompt
File Properties
This option opens an information window as shown in Figure 11-16. Information, such as
length, sample rate, bits per sample, etc, are displayed on this window. Currently, the DRP
170
Chapter 11: DRP Editor
Editor only supports WAV files that have a sample rate of 16 kHz, 16 bits per sample, and 1
channel (mono) of data. WAV files of a format other than that specified cannot be properly
converted to DAX files that are required for the ACS.
Figure 11-16: File Properties
Exit
This option closes the application. The user is prompted for action regarding any unsaved
files.
Edit Menu
The Edit menu contains options to modify the take.
Figure 11-17: Edit Menu
Undo
Select this option to reverse the last action made by the user.
Cut
This option removes the selected audio region and stores it on the clipboard so it can be
inserted later using the Paste command.
171
Chapter 11: DRP Editor
Copy
This option places a copy of the selected region onto the clipboard so it can be inserted later
using the Paste command.
Paste
This option is only available if a selected region has been placed on the clipboard using
either the Cut or Copy commands. The region from the clipboard will be inserted at the
location of the left selection cursor. Audio data starting at the left selection cursor is shifted
to the right of the pasted region.
Trim
This option discards the audio data to the left and to the right of the selected region. The
unselected region is discarded, leaving only the selected region to occupy the entire
workspace. The trim operation is useful for removing leading and trailing silences or
unwanted audio.
Select All
This option moves the left and right selection cursors to the start and end of the audio data
respectively. This provides a quick means to select an entire take for editing.
Move Left Cursor to Start of File
This option moves the left selection cursor to the start of the audio data. The right selection
cursor is unchanged.
Move Right Cursor to End of File
This option moves the right selection cursor to the end of the audio data. The left selection
cursor is unchanged.
Move Both Cursors to Start of File
This option moves the left and right selection cursors to the beginning of the audio data.
Move Both Cursors to End of File
This option moves the left and right selection cursors to the end of the audio data.
Insert Silence Sub-Menu
This option allows inserting a short duration of silence at the location of the left selection
cursor. Selecting this menu item will open a sub-menu shown in Figure 11-18. From this
sub-menu, select the desired amount of silence to insert at the left cursor location. Audio
data to the right of the left selection cursor will be shifted to the right to make room for the
inserted silence.
172
Chapter 11: DRP Editor
Figure 11-18: Insert Silence Sub-Menu
Selected Range Sub-Menu
This option provides access to effects that can be applied to a selected region of audio data.
Clicking on this menu item displays the sub-menu shown in Figure 11-19.
Figure 11-19: Selected Range Sub-Menu
Fade In
This option will produce a fade in that begins at the left selection cursor and ends at the
right selection cursor. The selection will linearly increase in volume from silence to full
level. It is recommended that a short face in be placed at the beginning of all recorded
takes to prevent any unwanted pops.
Fade Out
This option will fade the audio out beginning at the left selection cursor and ending at
the right selection cursor. The selection will linearly decrease in volume from the full level
to silence. It is recommended a short fade out be placed at the end of all recorded takes
to prevent any unwanted pops.
Volume Up
This option increases the amplitude of the selected region by the percentage entered in
the Volume field located on the toolbar (Figure 11-20). In the example below, selecting
the Volume Up option will increase the amplitude of the selected region by 8%.
Figure 11-20: Volume
173
Chapter 11: DRP Editor
Volume Down
This option decreases the amplitude of a selected region by the percentage entered in
the Volume field located on the toolbar (Figure 11-20). In the example above, selecting
the Volume Down option will decrease the amplitude of the audio level of the selected
region by 8%.
Clear
Select this option to reduce the selected range to zero, thus placing silence in the
selected range. This removes the audio data without altering the length of the take. This
option can be used to remove all leading and trailing noise from a take.
View Menu
The options from the View menu are used to modify the way the audio data is displayed in the
Detail View. This menu (Figure 11-21) provides access to commands to zoom in and out of the
take to allow better editing. It also provides the ability to select between any of the take files
currently open in the application.
Figure 11-21: View Menu
Zoom In
This option causes the horizontal axis of the Detail View to stretch left and right, revealing
more details of the waveform. Unlike a true zoom-in feature, the vertical axis (representing
the amplitude of the audio) remains unchanged. Figure 11-22 illustrates how a zoomed-in
region appears in the Detail View. The Zoom In command can be used multiple times to
provide up to ten times magnification of the waveform.
174
Chapter 11: DRP Editor
Figure 11-22: Detail View
Zoom Out
Click this function to display a broader view of the waveform in the Detail View. Zoom Out
can be called as many times as needed until the entire waveform is displayed in the Detail
View.
Zoom Into Selected Range
Click this option to magnify the selected region to fill the width of Detail View. Figure 11-23
shows an example of this feature. Notice the left and right selection cursors are at the left
and right edge of the Detail View window and the differences of the Detail View windows of
Figure 11-22 and Figure 11-23. The user can select another region and use this feature
again to reveal details of that region in the Detail View.
175
Chapter 11: DRP Editor
Figure 11-23: Detail View - Zoom to Selected Range
Zoom Out Fully
This option removes all zoom effects applied to the Detail View and will display the complete
waveform in the width of the Detail View.
Tools Menu
The Tools menu provides options to play and record audio as well as access the application's
configuration options. Figure 11-24 shows the items available on the Tools menu.
Figure 11-24: Tools Menu
176
Chapter 11: DRP Editor
Configuration
Select this option to open the configuration window as show in Figure 11-25. This window
allows setting up of the behavior of the DRP Editor regarding retrieval and playback of takes,
the mic station to use to record, etc. The window is divided into two tabs, each described in
detail below.
Figure 11-25: Configuration Window - Take Tab
Take Tab
• Temporary Take File - The filename used to temporarily save the take on the
ACS when using the ACS for playback.
• Location of DAX Files retrieved from ACS - The temporary location of takes
retrieved from the ACS. Typically, this is either c:\ied\ or c:\temp\.
• Delete retrieved DAX files on exit - When checked, takes retrieved from the
ACS to the local computer will be deleted when the application shuts down.
Note:
This option is disabled for the current released version of the software.
• Download take to dual CPUs (where applicable) - Checking this option will
download the take from the local computer to both CPUs (if dual CPUs exist) on
the local ACS when Save to ACS option is chosen from the File menu.
• Take Plotting - The DRP Editor is capable of opening large take files. However,
graphing large files is time consuming and in most cases the need to see every
single detail of a waveform is not necessary. This option controls the detail level of
the audio waveform. Setting it to lower numbers (1 is the lowest allowed value)
will yield higher quality graphs at the expense of rendering speed. Setting it to 50
or higher will increase the speed at which waveforms are rendered, but at a
reduction in graph quality.
177
Chapter 11: DRP Editor
Figure 11-26: Configuration Window - Play / Record Tab
Play / Record Tab
• Local Audio Controllers - This list box shows the Device ID, Description, and IP
Address of the ACSs configured in Enterprise. Only one ACS can be selected
from the list to be the local ACS. This is the ACS whose mic station will be used for
recording and retrieving take files for the application.
• Play Take Out - Takes can be played through the speaker output of the
computer (if speakers are connected) or by temporarily downloading it to the
ACS. Some systems will have the output of the sound card connected to an input
on the ACS. If this is the case, the take can be played as a Line In connection on
the ACS. Only one method can be used to play take audio at any given time.
• Zone Group to Play to - The local zone group to use when playing take audio
through the ACS.
• Mic Station to user for recording - The mic station that will be used to record
takes.
Play All
This option plays the entire audio take. A red vertical line tracks the segment of the audio
that is being played and the status bar at the bottom of the main window shows the status of
the request.
Play Selected
This option plays the audio in the selected region of the take. A red vertical line tracks the
segment of the audio that is being played and the status bar at the bottom of the main
window shows the status of the request.
178
Chapter 11: DRP Editor
Stop
This option stops playing the take. It is unavailable when the audio play method is setup in
the Configuration window to play takes by downloading to the ACS.
Pause / Resume
This option pauses playback, if playing, or resumes the playback, if paused. It is unavailable
when the audio play method is setup in the Configuration window to play takes by
downloading to the ACS.
Record from ACS Mic Station
This option activates the designated mic station to record a take. Once selected, the mic
station will start beeping indicating that it is ready. Additionally, the status bar at the bottom
of the main window will show Ready To Go Active (as shown in Figure 11-27) indicating that
the user can start recording by pressing the mic switch or Annc/0 button on the mic station.
Figure 11-27: Mic Station Status
The record operation times out if the user does not activate the mic station within a few
seconds. The status bar at the bottom will inform the user with an appropriate message if no
audio was detected by the ACS. On successful recording, the software will automatically
retrieve and display the recorded Take.
Retrieve DAX List from ACS
Click this option to open the Take List window. This window is used to list all takes that are
currently on the ACS. The ACS can have several thousand individual takes spanning across
multiple languages. Because of this, retrieving and listing all takes is time consuming. The
user can narrow down the range and language of the take list by entering appropriate
values in the Start, Stop, and Language controls. Click the Retrieve List button to populate
the Available Takes on the ACS list box with take numbers that reside on the ACS. Note
that this does not retrieve the takes, but lists the numbers of the takes that are already on the
ACS. For example, Figure 11-28 shows all English takes in the range 9401 through 9999.
Once initiated, the user can stop the take listing operation by clicking on the Cancel List
button at any time. The software will stop searching for more takes and list only those
already discovered.
179
Chapter 11: DRP Editor
Figure 11-28: Take List Window - Populated
Help Menu
The help menu has only one option as shown in Figure 11-29. Selecting the About menu item
displays the window shown in Figure 11-30. This window displays the program name, version
number, release date, and copyright information.
Figure 11-29: Help Menu
Figure 11-30: About Window
180
Chapter 11: DRP Editor
Toolbar
The purpose of the toolbar is to provide quick access to commonly used application commands,
most of which are also accessible from the menus. The toolbar is shown in Figure 11-31.
Figure 11-31: Toolbar
The following options are available from the toolbar. Please refer to appropriate titles under the File
Menu for additional details on many of these features.
New File
This option creates a new blank audio take with a length of one second.
Open File
This option opens a dialog window to load take file from a local drive. Clicking on the
down arrow next to the icon opens a drop-down menu with options to Open File and
Open File From ACS.
Save
This option saves the changes made to an opened file.
Save All
This option saves changes made to all opened files. Files that already have a filename
will be saved automatically and those that are labeled *untitled* will be prompted for
filenames using a standard Windows Save as dialog box.
Note:
This option is not available from the menu bar.
Play Selected
This option plays the audio of the selected region. Clicking on the down arrow
next to the icon opens a drop-down menu with options to Play Selected and
Play All.
Pause / Resume
This option pauses playback, if playing, or resumes the playback, if paused, of the take.
Stop
This option stops playback of the take.
181
Chapter 11: DRP Editor
Record from ACS Mic Station
This option activates the mic station to record the take audio.
Zoom In
This option causes the horizontal-axis of the Detail View graph to stretch left and right,
revealing more details of the waveform.
Zoom Out
This displays a broader view of the waveform in the Detail View.
Zoom Into Selected Range
This option expands the selected range in the Details View.
Zoom Out Fully
This option removes all zoom effects from the Detail View.
Cut
This option removes a selected region and places it on the clipboard.
Copy
This option stores a copy of the selected region on the clipboard.
Paste
This option inserts at the region from the clipboard into the take at the left selection
cursor location.
Trim
This option removes the audio data to the left and right of the selected region.
Move Left Cursor to Start of File
This option moves the left selection cursor to the start of the audio data.
Move Right Cursor to End of File
This option moves the right selection cursor to the end of the audio data.
Fade In
This option will produce a fade in that begins at the left selection cursor and ends at the
right selection cursor. The selection will linearly increase in volume from silence to the full
level. It is recommended that a short face in be placed at the beginning of all recorded takes
to prevent any unwanted pops.
182
Chapter 11: DRP Editor
Fade Out
This option will fade the audio out beginning at the left selection cursor and ending at the
right selection cursor. The selection will linearly decrease in volume from the full level to
silence. It is recommended a short fade out be placed at the end of all recorded takes to
prevent any unwanted pops.
Insert Silence
This option allows inserting short durations of silence at the location of the left selection
cursor. Clicking on this option produces the sub-menu shown in Figure 11-18.
Select From / To
The values in the textboxes control the positions of
the left and right selection cursors. The spin edit
labeled Select From controls the position of the left selection cursor. The spin edit labeled To
controls the position of the right selection cursor. Changing the values in the spin edit boxes
moves the left and right cursor positions on the display. Alternatively, clicking on different
regions on the graph updates the values in the textboxes.
Volume
The value in the Volume determines the percentage of volume
to increase or decrease when the Volume Up and Volume
Down buttons, or menu items, are selected.
Toggle Reference Line
This button toggles the yellow colored horizontal line on and off. The line acts as a
reference for the audio level that all takes should be contained within so that the
volume of a recorded take is consistent with the volume of other pre-loaded takes.
Reference Line Level
This textbox displays the dB value of the yellow colored horizontal
reference line. The default value is -4.90dB. Changing this value will
move the reference line. Additionally, the reference line value can be changed by holding
down the [SHIFT] key and left-clicking on the Detail View graph.
183
DRP Editor
This page has been intentionally left blank.
184
12
Time Talker
Time Talker is a software application that provides an automated service to play audio cues of the
current time at programmed intervals. This application is capable of sending time command cues to any
combination of zone groups across multiple announcement controllers. The following sections describe
the configuration of Time Talker.
Launching Time Talker
Time Talker Configuration Window
186
187
File Menu
Edit Menu
Help Menu
Time Talker Setup
187
188
188
189
Frame Options
Zone Map Setup
User Options
Time Events
189
190
191
193
Define Events
193
185
Chapter 12: Time Talker
Launching Time Talker
Time Talker is a separate application from the main Enterprise application. Therefore, it is not
launched from an icon or menu located within the Enterprise Navigator window. The icon for
launching Time Talker is typically located on the IED Application Bar as shown in Figure 12-3. On
some legacy systems, it may have been installed at a later time and is available as a shortcut icon on
the desktop.
Figure 12-1: Time Talker Icon
Figure 12-2:
Figure 12-3: Application Bar
Double-click the Time Talker icon to launch the application. The IED Time Talker Configuration
window will appear as shown in Figure 12-4. From here, current time events can be modified or new
events created.
Figure 12-4: Time Talker
186
Chapter 12: Time Talker
Time Talker Configuration Window
The Time Talker Configuration window displays a list of time events as shown in Figure 12-4 and the
edit option buttons. Events are added, edited, or deleted using the buttons located on the toolbar as
shown in Figure 12-5.
Figure 12-5: Toolbar Buttons
Add
Click this button to add a new event to the schedule.
Edit
Click this button to edit the highlighted event. Double-clicking the event in the list will also
open the event for editing.
Delete
Click this button to delete the highlighted event.
Apply
Click this button to activate any changes without closing the application.
OK
Click this button to close the application and save any changes that have been made.
Debug Service
This is an option used for system debugging and should remain unchecked.
File Menu
The only item currently available under the File menu is the Exit option. Select this option or
select the X located in the top-right corner of the window to close the Time Talker application.
Figure 12-6: File Menu
187
Chapter 12: Time Talker
Edit Menu
The Edit menu provides functions to add, edit, or delete time events. These three menu items
correspond to the three buttons available on the toolbar. The last three options available in this
menu open the windows necessary to properly configure Time Talker. Each configuration
window is described in "Time Talker Setup" on page 189.
Figure 12-7: Edit Menu
Help Menu
Currently, the only available item in the Help menu is the option to show the application’s About
box as shown in Figure 12-8. This provides the version number and build date of the Time Talker
application.
Figure 12-8: Help Menu and About Box
188
Chapter 12: Time Talker
Time Talker Setup
Since Time Talker is a separate application and does not utilize the same database as Enterprise, it
must be configured properly before it will function. The three configuration windows are described in
detail below.
Frame Options
Announcement controllers that can play back time messages are defined in Time Talker as
Frames. Frames are configured from the Frame Options dialog that is opened from the Edit
menu. A toolbar at the top of the window provides two buttons. The button on the left is used to
Add a new frame to the system using the data in the Name and IP Address (Primary) fields. The
button on the right will Delete the frame currently highlighted in the list.
Note:
Frames cannot be edited once created. To make changes to a frame, add a new
frame with the correct information and delete the old one.
Figure 12-9: Frame Options
The features in this window are:
Frames List Box
This is a list of all announcement controllers that are currently defined in Time Talker.
Name
This is a text entry box used to define a name for this frame (e.g., Terminal A).
189
Chapter 12: Time Talker
IP Address (Primary)
This is the IP address for the announcement controller. This field must be defined to allow
Time Talker to communicate with an announcement controller.
IP Address (Backup)
This is the IP address for the backup announcement controller CPU, if installed. This field
should be left blank for systems that do not have redundant processors.
OK
Click this button to save the frame additions or deletions and close the window.
Cancel
Click this button to discard any changes and close the window.
Zone Map Setup
Zone Maps in Time Talker correspond to Zone Groups that are defined in Enterprise. The zone
groups to receive time announcements must be entered into Time Talker using the Zone Map
Setup dialog box that is accessed from the Edit menu. First, the zone group number must be
determined by looking at the Zone Groups Setup section in Enterprise. Then, the group number
is entered in the Zone Number field with a description typed into the Description field. Click the
Add Zone Map to Time Talker button to add the zone group to Time Talker.
Figure 12-10: Zone Map Setup
Zone Number
This is a Zone Group number as defined in Enterprise to use as a zone map in Time Talker.
Description
This is a text description for this zone map to aid in configuring time events.
190
Chapter 12: Time Talker
Add Zone Map to Time Talker
Click this button to add the zone number and description to Time Talker.
OK
Click this button to save the changes and close the window.
Cancel
Click this button to discard any changes and close the window.
User Options
The User Options window is accessed through the Edit menu. It provides controls to determine
when Time Talker will be active and inactive as well as how it will operate.
Figure 12-11: User Options
Configuration options for Time Talker announcements are as follows:
Time Format
Select either 12 or 24 hour time format for the audio announcements initiated by Time
Talker.
On Error Retry
When checked, Time Talker will attempt a retry if it receives an error when attempting to
initiate an announcement. When not checked, it will simply ignore the error and try again at
the next event time.
191
Chapter 12: Time Talker
Announce AM/PM
When checked, the AM/PM designations will be appended to the time in the announcement.
When left unchecked, the announcement will include the hour and minutes without the
AM/PM appended to the announcement.
Time Announcement Prefix
Two announcement lead-ins are available to precede each time announcement. Select
either “The Current Local Time is” or “The Local Time is” to precede the time announcement.
Play Chimes
Select to either enable or disable a chime tone to play before the announcement to draw
attention to the message.
Hours of Operation
The times during which time announcements are played are individually configured for each
day.
• Day checkboxes - Check a box to enable announcements on each day.
• Start/End Time - Define the time window for each day when announcements will
play.
• All Day button - Press this button to quickly set the announcements to play all day for
the selected day. (12:00AM-11:59PM)
• Next Day checkbox - If checked, then the end time is on the next day. This allows
time windows to span midnight. For example, a day could be defined to start at
6:00AM and play until 1:00AM the next morning.
192
Chapter 12: Time Talker
Time Events
The Time Talker event schedule is a repeating schedule that cycles through every hour. Events are
defined to play at a relative minute after the top of the hour. For example, if the time is to be played
only at the top of the hour, then the Time field would be :00 to indicate that the event is to play every
hour. If the time is to also play at the bottom half of the hour, then the Time field would be set at :30
to indicate that the event should play 30 minutes after the hour. Figure 12-12 shows a schedule with
time events set to play every 15 minutes.
Each event will only play once in any given hour and it can only play in one language. Multiple events
must be created, one for each language, in order to play multi-lingual time announcements.
Figure 12-12: Time Talker
Define Events
Events are programmed using the Define Events window as shown in Figure 12-13. This
window will appear when a new event is created or an existing event is selected for editing.
193
Chapter 12: Time Talker
Figure 12-13: Define Events Window
Event configuration options are as follows:
Relative Event Time
Use the up/down arrow buttons to set the minute after the hour when the message will play.
Language
Select the language to use for the time announcement.
Play on Frame(s)
Check the box for each announcement controller that should play the event.
Change Zone Map
This droplist box will display the zone maps available on the frame highlighted in the Play on
Frame(s) list. Click to open the droplist box and select the zone map to use for that frame.
OK
Click this button to save the changes and close the window.
Cancel
Click this button to discard any changes and close the window.
Note:
194
While the application is still open, an event will not begin playing on the set times
until the Apply button is pressed.
13
Password Management
The Enterprise Software Suite offers a great degree of flexibility for user access. Control is accomplished
by the use of passwords and permissions assigned to each user in the system. The system utilizes a
centralized security server that runs in the background to manage user access to various functions on all
server and client computers in the system. The following sections explain the configuration of users and
their permissions.
Accessing Password Configuration Options
196
Login / Logoff
198
Application Management
199
Configure Server
200
Options Tab
Language Tab
Verify
200
201
202
Change Password
203
Edit Accounts
204
Menus
User Accounts
Application Areas
204
205
209
195
Chapter 13: Password Management
Accessing Password Configuration Options
There are two different methods for accessing the password configuration options. Primarily, users
are configured from the IED Application Bar as shown in Figure 13-1. This provides direct access to
the four essential areas needed to manage users, passwords, and permissions.
Figure 13-1: IED Application Bar
Alternatively, the Password Manager configuration utility can be launched from the Tools menu on
the Enterprise Navigator window as shown in Figure 13-2.
Figure 13-2: Enterprise Tools Menu
The Password Manager config utility is a launcher application containing a main menu of buttons
used to launch the various configuration windows for the password server. Figure 13-3 shows the
main menu of the Password manager config utility.
Note:
196
The App Mgmt button is typically grayed out and is reserved for use by factory
service personnel.
Chapter 13: Password Management
Figure 13-3: Password Manager Main Menu
197
Chapter 13: Password Management
Login / Logoff
If a user is currently logged into the system, the first menu choice will be Logoff. Selecting this
function will immediately cause the user to be logged off the system. When this is done, the Logoff
button and menu item changes to Login.
When a user is not logged into the system, the button and menu will display Login. Selecting this will
display the Login dialog box as in Figure 13-4. Enter a valid user name and password and click the
OK button to log into the system.
The [F2] key can be used as a shortcut to access the Login/Logoff functions.
Figure 13-4: Login Dialog Box
198
Chapter 13: Password Management
Application Management
This menu item (or AppMgmt button from the Password Manager utility) is used to access the
Application Area Management configuration. This function is typically not available (or grayed out)
to most users and is for IED factory personnel use only. Examples of the configuration screens are
shown below, but the details of configuring this section are beyond the scope of this manual.
Figure 13-5: Application Area Management
Click the Add button under the Application Area Names list to create a new application area. The
window below will prompt for a name of the new application area. Clicking the Delete button will
remove the application area and all associated permissions from the system.
Figure 13-6: Add Application Area
Click the Add button under the Permissions list to create a new permission for the selected
application area. Fill in the information as needed in the Add Permission window shown below and
click the OK button to save.
Figure 13-7: Add Permission
199
Chapter 13: Password Management
Configure Server
Selecting this menu item (the Config button from the Password Manager utility) opens the IED
Security Server Parameters window. The configuration options are displayed across two tabs:
Options and Language.
Options Tab
The Options tab appears as shown in Figure 13-8. This tab is divided into three areas: Startup
Options, Login Options and Automatic Logout Options.
Figure 13-8: Security Server Parameters - Options Tab
Startup Options
• Manual Login Required for Restricted Areas - When selected, users must always
enter a user name and password each time the application is started.
• Windows User Name Automatically logged in - When selected, the user will be
logged into the system using the same login credentials used for the Windows login.
This requires the same username and password to be entered in the Password
Manager.
Note:
Manual login is recommended on operational systems.
Login Options
• Minimum Password Length - Enter the minimum length for user passwords. The
allowable range is 1 to 10 characters.
• Login Lock Enable - The purpose of this feature is to prevent rapid, repeated
attempts to log in under the conditions set by the next two entries. If the box is
checked, the feature is active.
200
Chapter 13: Password Management
• Number of Attempts - This specifies how many unsuccessful login attempts in a row
are tolerated before invoking the Lock Time. The valid range for this setting is
between 1 and 10 failed login attempts.
• Lock Time - This specifies the number of minutes to lock the system (allow no more
login attempts) after a string of unsuccessful login attempts.
Automatic Logout Options
• Enabled - When checked, the system will automatically logout the current user after
a period of inactivity as specified in Auto Logout Time (minutes) field.
• Auto Logout Time (minutes) - This specifies the amount of time the system will wait
before initiating the automatic logout.
Language Tab
When users are created, they are assigned a language that is used to determine (for some
applications) the actual language in which the application will operate when that user logs into
the system. When a new user is created, the system will default to the language selected here.
The current default language will appear highlighted in the list. To change the default language,
highlight the language in the list and click the Set as Default button. Now, new users will be
created with this language selected by default. Each user can then be adjusted to use the
language that is appropriate.
Figure 13-9: IED Security Server Parameters - Language Tab
201
Chapter 13: Password Management
Verify
The Verify function only available from the Password Manager utility and is used to test a
username/password combination without logging out the current user. To test a
username/password combination, click the Verify button (Figure 13-3) and enter the login
credentials in the login window. If the combination entered is valid, a small Verify Successful
window will appear as shown in Figure 13-10. If there is an error, a small Verify Failed window
will appear as shown in Figure 13-11. In either case, click the OK button to close the window
and continue.
Figure 13-10: Verify Successful
Figure 13-11: Verify Failed
202
Chapter 13: Password Management
Change Password
To simply change a user's password, select the Change Password menu item or click the Chng PW
button on the Password Manager utility. The Change Password window for the current user will
appear as shown in Figure 13-12. Enter the current password in the Old Password field. Enter the
new password in the New Password field and then again in the Confirm Password field. Click the
OK button to change the password.
Note:
Placeholder *’s will appear in place of actual characters when typing in any of these
edit boxes.
Figure 13-12: Change Password
203
Chapter 13: Password Management
Edit Accounts
Select this menu item (or the Edit Accts button on the Password Manager utility) to open the Edit User
Accounts window as shown in Figure 13-13. The screen has two menus located just below the title
bar and two function icons available on the toolbar.
Figure 13-13: Edit User Accounts Window
Menus
File Menu
This menu has one available function. Select Close to exit the Edit User Accounts screen and
return to the main menu.
Edit Menu
This menu leads to all the functions used to create or modify user accounts.
New
Select this function to create a new user. This will open the New User window as shown
in Figure 13-16. A shortcut to this function is provided on the toolbar by clicking on the
left of the two icons.
Delete
Select this function to delete the selected user from the system. A shortcut to this function
is available by clicking the right icon (with the X) on the toolbar.
User Information
Select this function to open the Edit User window (Figure 13-17)for the selected user.
Clicking the Edit User Information button will perform the same function.
204
Chapter 13: Password Management
Permissions
Select this function to open the User Permissions window (Figure 13-18) to modify the
permissions for the selected user. Clicking the Edit Permissions button will perform the
same function.
User Accounts
Select User
Click this droplist box to open a list of all users in the system as shown in Figure 13-14. Scroll
through this box and select a user to view or edit.
Figure 13-14: User Selection
Selected User Information
This section will display the username along with the first and last names of the selected
user. This is the user that will be edited when either the Edit User Information or Edit
Permissions buttons or menu functions are selected. This is also the user that will be deleted
when the Delete button is pressed.
Figure 13-15: User Name Selected
205
Chapter 13: Password Management
Create New User
To create a new user account, select either the New icon or the New menu item from the
Edit menu. ANew User form will appear as shown in Figure 13-16. Enter the appropriate
information as described in the next section and click the OK button to save the new user.
Figure 13-16: New User
Edit User Information
To edit information about the selected user, click the Edit User Information button, or select
User Information from the Edit menu to display the Edit User form as in Figure 13-17.
Figure 13-17: Edit User
Name
This the unique username that applies to this user and is the name that must be used at
the login prompt. This name may or may not have any relationship to the user’s legal
name, which can be entered in the First Name and Last Name fields. This is the name
206
Chapter 13: Password Management
entered from the New User window and is read-only and cannot be changed.
Password
This field is used to enter the password for the user. The password should be some
combination of letters and/or numerals, which can be remembered by the user. For
good security, it should be six or more characters in length. Obvious choices such as the
user's phone number, address, or social security number are not recommended. When
typing in this field, the characters are not visible and will be shown as “*” for security
purposes.
Confirm Password
This field is used to re-enter the password to verify it was typed correctly. The system will
compare this field with the Password field and notify the user if there are any
discrepancies.
First Name
This field is used for the user’s legal first name, which may or may not be associated with
their username.
Last Name
This field is used for the user’s legal last name, which may or may not be associated with
their username.
Language
Select a language appropriate for this user from the droplist box. For those parts of
Enterprise that have language localization, this selection will automatically change the
menus and other controls to the language for this user when they login to the system.
Max Connections
This setting specifies the number of concurrent logins that this user can have without
first logging off at another location/computer. For example, if the number in this
window is set to 1, the user can only long on at a second location/computer in the
system after logging off at the first. If the number is set at 3, the user can log on at a third
location while already logged on at two other locations.
Disabled
When checked the Max Connections feature is disabled and there are no restrictions on
the number of points in the system where this user can remain logged on.
OK
Click this button to save changes and close the window.
Cancel
Click this button to discard the changes and close the window.
207
Chapter 13: Password Management
Edit Permissions
Permissions grant individual users the authority to edit, change, set up, or control the use of
certain features, sub-features, or portions of the Enterprise program and associated
applications. Their purpose is to allow maximum program flexibility, yet provide a means to
limit it to those most qualified.
Figure 13-18: User Permissions
To edit permissions, select a user from the Select User droplist box and then either click the
Edit Permissions button or select Permissions from the Edit menu. The User Permissions
screen will appear as shown in Figure 13-18.
Application Area
This droplist box selects the specific application group of permissions that will be
available for editing. Refer to Table 13-1 for a list of the available application areas and
what permissions are available for each area.
Available Permissions
This lists the permissions that can be granted for the selected application area.
Current Permissions
This lists the permissions currently granted to the current user.
>
This button is used to add the highlighted permission in the Available Permissions
window to the Current Permissions window, thus granting the user’s access to that
function. Multiple permissions may be selected by holding the [CTRL] or [SHIFT]
keys while selecting items in the list using the left mouse button.
208
Chapter 13: Password Management
>>
This button is used to add all items in the Available Permissions window to the Current
Permissions window. This is a quick way to grant a user’s access to all permissions
associated with the selected application area.
<
This button is used to remove the highlighted permission in the Current Permissions
window to the Available Permissions window, thus removing the user’s access to that
function. Multiple permissions may be selected by holding the [CTRL] or [SHIFT]
keys while selecting items in the list using the left mouse button.
<<
This button is used to remove all items in the Current Permissions window to the
Available Permissions window. This is a quick way to remove a user’s access to all
permissions associated with the selected application area.
Application Areas
Table 13-1 lists the available application areas and their associated permissions for the
Password Manager application.
Table 13-1: Application Areas and Permissions
Application Area
Description
528 Control Designer
Grants permissions for the 528
Interface Designer application.
540 General
Grants access to the Ambient Analysis
configuration and calibration areas of
Enterprise for systems utilizing the
legacy 540M hardware.
ACSDLL
Grants access to a wide variety of
system setup and operation features for
the announcement controllers in a
system.
ACSMonitor
Grants access to configure the ACS
Monitor function.
Permissions
Advanced
Basic
Edit Schedule
Offline Edit
Online Edit
Run Calibration
Announcement Definitions
Companies
Entry Code Definitions
FAS Templates
FAS Variables
Languages
Mic Station Users
Mics
PDRP Messages
Priorities
Send Data
System Settings
Takes
User Groups
Zone Groups
Zones
Configure
209
Chapter 13: Password Management
Application Area
Description
AppBar
Grants access to the IED Application
Toolbar.
CCGUI
Grants access to application areas
specific to the Convention Center GUI
application suite.
DRP Editor
Grants access to the DRP Editor
application functions as well as restricts
the ability to save takes certain ranges.
Fault Logger
Grants access to manage the Fault
Logger application.
LVIODll
MonitorTestDLL
210
Grants access to configure the
9032LVIO hardware to operate with
the system.
Grants access to the configuration and
operation of the Monitor/Test subsystem on systems utilizing the legacy
596M hardware with Gateway
computer.
PAConsole
Grants access to specific applications
that are used as a live PA console
interface.
PrintManager
Grants access to print reports.
PRIZMCMS
Grants access to configure the Prizm
CMS application.
PRIZMContentManager
Grants access to the functions available
in the Prizm Content Manager
application.
Permissions
Administrator
GeneralUser
WindowsServiceConfiguration
audiocontrol
full
roomcontrol
All Areas
Save All Take Range
Save Take User Range
Delete Fault Records
Edit Configuration
Configure
Configure
AdHocAnnc
AnncLogView
AnncSchedule
Configuration
EditSchedule
EmergencyAnnouncement
LiveAnnc
MacroCreate
PDRPAnnc
QuickPickCreate
TTAnnc
Print
Add Devices
Delete Devices
Edit Existing Devices
cmEditBilling
cmEditChannels
cmEditCust
cmEditMedia
cmEditPlaylists
cmEditScreens
cmGenerateReports
cmViewBilling
cmViewCust
Chapter 13: Password Management
Application Area
Description
PrizmSmartClient_Admin
Grants access to the administrative
functions of the Prizm Smart Client
application.
PrizmSmartClient_General
Grants access to general areas of the
Prizm Smart Client application.
PrizmSmartClient_
UserOptions
Grants access to various configuration
options for the Prizm database.
SYSTEM
Grants access to various system-wide
parameters.
TitanDLL
Grants access to the features
specifically related to the Titan series
frames in a system.
Permissions
AdminFeatures
DataBaseUtils
GroupCodes
MasterOverwrite
SystemOptions
CAS
ConditionalOptions
DailySched
MasterSched
OfflineSchedules
TicketCounters
UserOptions
DailyFlightTypes
DailyROFields
DateFormat
EditableGroupCodes
Language
LoginTimeout
MasterFlightTypes
MasterROFields
TimeFormat
ViewableGroupCodes
Change Password
Configure Server
Edit Accounts
Exit Program
Config. Adv. Channel Settings
Config. Adv. Test Params
Config. IED24 Comms Params
Configure Ambient
Configure Channels
Configure EQ
Configure Tests
Frame Save/Load/Send Settings
Grid Edits
Run Tests
Set Levels
211
Password Management
This page has been intentionally left blank.
212
14
596 Series Test Configuration
This section describes the configuration of the Monitor/Test sub-system for installations that use the 596
series components for system supervision. This includes the 590RU Gateway computer with installed
590A audio supervision card and 590I communications card.
Gateway Monitor/Test Setup
214
Configure Monitor Points
215
Test Results
ACS Output Test Results Tab
External Test Results
Mic Test Results
Monitor Zone
218
218
219
220
222
Monitor Mics
224
Gateway Configuration
226
Monitor Test
227
General Tab
Audible Zones Tab
Mic Test Zone Tab
Set Tab
Test Tab
227
228
229
229
230
213
Chapter 14: 596 Series Test Configuration
Gateway Monitor/Test Setup
The Gateway Computer device must be added and configured to each ACS where one is used.
Figure 14-1: Gateway Icon
To configure the monitor points and operations for the Gateway, click on the Gateway Computer
icon (see Figure 14-1) on the tree view in Enterprise. This changes the right panel of Enterprise to the
Gateway configuration options as shown in Figure 14-2.
Figure 14-2: Gateway Configuration Icons
214
Chapter 14: 596 Series Test Configuration
Configure Monitor Points
This section is used to define the monitor points managed by the Gateway, and their automated test
properties. Clicking this icon displays the monitor point configuration grid as shown below in Figure
14-3. Each 596 unit used in the system will be shown on a separate tab and is selected by clicking
the corresponding tab at the top of the form.
Figure 14-3: Configure Monitor Points Grid
Monitor Point Grid
The columns in the grid are as follows:
Input
This represents the physical input on the 596 where the monitor point is wired.
ACS Zone Location
Click this field to open a drop-down of all analog zones configured for the ACS. Select
the appropriate zone to associate with this monitor point.
Device
Click this field to open a drop-down list to identify which point in the signal chain is
represented by the monitor point. The available devices are as follows:
• ACS Output
• Equalizer Output
• 540 Output
• Amplifier Circuit
• Speaker Circuit
• DC Circuit
215
Chapter 14: 596 Series Test Configuration
• Remote Monitoring
Circuit ID
Enter a logical text description of the monitor point.
Mon
Check this box to make the point available for audible monitoring through the local
rack-mount monitor speaker. Only audio points should be checked. DC voltage points
(e.g., power supply monitoring points) should not be checked.
150
Include the monitor point in the 150 Hz audible test.
500
Include the monitor point in the 500 Hz audible test.
800
Include the monitor point in the 800 Hz audible test.
4K
Include the monitor point in the 4 kHz audible test.
8K
Include the monitor point in the 8 kHz audible test.
Note:
Only one audible tone may be selected per monitor/test point.
20K
Include the monitor point in the 20k periodic inaudible test. This test is typically executed
every 60 seconds. The interval between tests is configured in the section about "Monitor
Test " on page 227.
Clear Point
Click this button to clear the settings for the selected point in the monitor point grid.
Import
Click this button to import monitor data from a version 6 ACS Toolset System.
OK
Click this button to send points to the Gateway and close the window.
216
Chapter 14: 596 Series Test Configuration
Cancel
Click this button to close the window without saving any changes.
Apply
Click this button to send data to the Gateway without closing the window.
217
Chapter 14: 596 Series Test Configuration
Test Results
Test results are divided into three different categories. These categories are represented by three tabs
as shown in Figure 14-4.
Figure 14-4: View Test Results
Display Faults Only
Check this box to filter the result and display only the points that have tested out of tolerance.
When left un-checked, test results for all points are displayed.
Close
Click the Close button to exit the window.
ACS Output Test Results Tab
This tab displays the results for all monitor points that have been designated ACS Output as a
device type. The columns in the results grids are as follows:
596
This is the 596 frame number where the monitor point is physically located.
Input
This is the physical input on the 596 frame for the monitor point. (i.e. A1-A16, B1-B16,
C1-C16 or D1-D16)
Name
This is the name of the test point and includes the location and zone number.
218
Chapter 14: 596 Series Test Configuration
(Audible Test) Set Lev
This is the level that was recorded for the audible test when a system set was performed.
This value is in dBu and is used as the reference level each time a test is executed.
(Audible Test) Dev
This is the variation in level between the set level and the actual measured level from the
last test. When the deviation is outside of the allowable window, the system will consider
the monitor point in a fault status and report the fault accordingly.
(20K Test) Set Lev
This is the level that was recorded for the periodic 20k test when a system set was
performed. This value is in dBu and is used as the reference level each time a test is
executed.
(20K Test) Dev
This is the variation in level between the set level and the actual measured level from the
last test. When the deviation is outside of the allowable window, the system will consider
the monitor point in a fault status and report the fault accordingly.
External Test Results
This tab displays the results for test points that are not configured as an ACS Output device type.
The columns for the grid (as shown in Figure 14-5) are identical in function to those on the ACS
Output Test Results tab.
Figure 14-5: External Test Results Tab
219
Chapter 14: 596 Series Test Configuration
Mic Test Results
Analog microphone stations have a built-in 500Hz oscillator that is used to validate the audio
signal path from the mic station to the 500C card. This tab displays the results for mic station
test points. The results grid is shown below in Figure 14-6.
Note:
This applies to analog 500 and 508 series microphone stations only.
Figure 14-6: Mic Test Results Tab
Mic Test Results Grid
The columns in this result grid are as follows:
Mic
This is the mic station number as defined in the mic station setup.
Model
This is the model number of the mic station as defined in the mic station setup.
Location
This is the description entered by the user in the mic station setup.
Set Lev
This is the level that was recorded for the mic station test when a system set was
performed. This value is in dBu and is used as the reference level each time a test is
executed.
220
Chapter 14: 596 Series Test Configuration
Dev
This is the variation in level between the set level and the actual measured level from the
last test. When the deviation is outside of the allowable window, the system will consider
the monitor point in a fault status and report the fault accordingly.
221
Chapter 14: 596 Series Test Configuration
Monitor Zone
Double-click the Monitor Zone icon to open the ACS - Circuit Test window. This feature is used to
monitor the point in real time and execute a test or set on an individual circuit. A zone is selected
from the drop-down list and then all points available for that zone are displayed in the monitor point
list. Selecting a point in the list will immediately switch the monitoring to that point.
Figure 14-7: ACS Circuit Test Window
Volume
Click the up or down arrows to adjust the volume of the monitor output. This is an output
physically located on the 590A card and is used to drive a powered speaker that is usually
the speaker located in the rack-mount microphone station.
Level
This meter displays the current signal level for the selected monitor zone.
Zone droplist
This is a list of zones in the system that are available for monitoring. Select a zone from this
list first and a list of available monitor points for that zone is displayed in the point selection
list located in the middle of the window.
Single Circuit radio button
This selects the function that will be performed when the Start button is pressed. Choose Set
to run an individual circuit set for the selected point. Choose Test to run an individual circuit
test for the selected point.
Monitor Point list
This list is located in the middle of the window and is populated with a list of points assigned
to the zone selected from the zone drop-down list. Click on a point to monitor the point. This
is also the point that will be tested or set when the Start button is pressed.
222
Chapter 14: 596 Series Test Configuration
Result Label
The result of the test or set is displayed below the Monitor Point list. The set level and
deviation are displayed for a point after a test or set has been executed for that point.
Start
Click this button to start a circuit set or test. The function executed is based on the selection
made in the Single Circuit radio button group.
Close
Click this button to close the window.
223
Chapter 14: 596 Series Test Configuration
Monitor Mics
Double-click the Monitor Mics icon to open the ACS - Mic Station Test window. This feature is used
to monitor a mic station in real time and execute a test or set on an individual mic station. A mic
station is selected from the drop-down list.
Figure 14-8: Monitor Mics Window
Volume
Click the up or down arrows to adjust the volume of the monitor output. This is an output
physically located on the 590A card and is used to drive a powered speaker that is usually
the speaker located in the rack-mount microphone station.
Level
This meter displays the current signal level for the selected mic station.
Mics droplist
This is a list of mic stations in the system that are available for monitoring. Select a mic
station from this list to activate monitoring.
Single Circuit radio button
This selects the function that will be performed when the Start button is pressed. Choose Set
to run an individual set for the selected mic station. Choose Test to run an individual test for
the selected mic station.
Bus droplist
This drop-down list allows an individual bus to be used for the test. Select a bus to use for the
test or select ACS choose to allow the ACS to select the appropriate bus to use for the test.
224
Chapter 14: 596 Series Test Configuration
Result Label
The result of the test or set is displayed on the lower part of the window above the buttons.
The set level, test level, and deviation are displayed for a mic station after a test or set has
been executed for that mic station.
Start
Click this button to start a mic station set or test. The function executed is based on the
selection made in the Single Circuit radio button group.
Close
Click this button to close the window.
225
Chapter 14: 596 Series Test Configuration
Gateway Configuration
Double-click the Gateway Configuration icon to open the window shown in Figure 14-9.
Figure 14-9: Gateway Configuration Window
The window displays the IP addresses that the gateway uses to communicate with other devices in
the system. It also shows the total number of zones and mics programmed in the system. This is a
read-only display as these items are configured elsewhere in Enterprise.
226
Chapter 14: 596 Series Test Configuration
Monitor Test
Double-click the Monitor Test icon to open the Monitor Testing window as shown in Figure 14-10.
This window has five tabs and is used to configure various supervision parameters as well as initiate
a system-wide set or test.
OK
Click this button to save changes and close the window.
Cancel
Click this button to close the window without saving any changes.
Apply
Click this button to save the changes without closing the window.
General Tab
Figure 14-10: Monitor Test - General Tab
Audible Tests - Test Tone Level
This level specifies the output level (in dBu) for the test tone coming out of the 590A card
when an audible set or test is executed.
Audible Tests - Deviation
This determines the deviation window for the test results. When a test result exceeds the
deviation value from the points set value, a fault will be declared. For the audible test, the
deviation is above and below the set level.
Example:
Set Value = -23dB, Deviation = 3dB
227
Chapter 14: 596 Series Test Configuration
If the test result of the point is within the range of -25.9 to -22.9, then the point will pass
the test.
If the test result of the point is -26dB or lower or -20 or higher, then a fault will be
declared.
20KHz Tests - Test Tone Level
This level specifies the output level (in dBu) for the test tone coming out of the 590A card
when a 20kHz set or test is executed.
20KHz Tests - Deviation
This determines the deviation window for the test results. When a test result exceeds the
deviation value from the points set value, a fault will be declared. For the 20kHz test, the
deviation is below the set level.
Example:
Set Value = -23dB, Deviation = 3dB
If the test result of the point is -25.9 or higher, then the point will pass the test.
If the test result of the point is -26dB or lower, then a fault will be declared.
Audio Listening Level
This sets the level of the output physically located on the 590A card that is used to drive a
powered monitor speaker. This level only affects the audible monitor level during a test and
will not impact the test results. This level can be adjusted by either typing in a value or
clicking the up or down arrow buttons.
Mic Station to use for Bus Test
The 500R card located in the 500ACS mainframe has eight (8) audio busses. In order to test
these busses, the system uses the oscillator in a mic station to test each bus. This mic station
is typically the rack-mount mic station located in the equipment room. Enter the appropriate
mic station number in the box to designate that station for the bus test.
Audible Zones Tab
This tab determines the zones that will be activated during an audible test. Zones that are
highlighted (in green) will have a test tone played to them when a test or set is executed. Click on
a zone number to add or remove it from the audible test group.
228
Chapter 14: 596 Series Test Configuration
Figure 14-11: Monitor Test - Audible Zones Tab
Mic Test Zone Tab
In order to test a microphone station, the test signal from the station must be routed to an
output zone that has been properly configured as an ACS Output device type and wired to a
596 Monitor/Test mainframe. Any zone in the system can be used for this purpose, but that zone
will always have the test tones from the mic station during a set or test. It is recommended that
the last zone in the system be designated as the Mic Test Zone and not used as a system output
zone. The currently selected zone will appear highlighted in green. Click on a zone number to
change the zone.
Figure 14-12: Monitor Test - Mic Test Zone Tab
Set Tab
Click the Start button on this tab to perform a system-wide set. This will cause audible tones to
be played through the system and the levels at each point will be recorded as the set values for
each point.
229
Chapter 14: 596 Series Test Configuration
Caution!
Executing a system-wide set will block all non-emergency operations from being
performed on the system. 900 series emergency messages or live announcements
will override the set operation.
Figure 14-13: Monitor Test - Set
Test Tab
The controls on this tab are used to manually execute the various system-wide tests and
configure the automatic testing options. To test a single circuit, refer to the "Monitor Zone" on
page 222.
Caution!
Executing a system-wide test will block all non-emergency operations from being
performed on the system. 900 series emergency messages or live announcements
will override the set operation.
Figure 14-14: Monitor Test
230
Chapter 14: 596 Series Test Configuration
Manual Tests
Select the type of system-wide test to perform when the Start button is pressed.
• Mics - Test all 500 and 508 series microphone stations in the system.
• Mics and Bus - Test all 500 and 508 series microphone stations in the system plus all
500R busses.
• Circuits - Test all audio output circuits in the system.
• Mics, Bus and Ckts - Test all three of the above items together.
• 20K Test - Execute a manual 20K test.
Start button
Click this button to execute the type of test selected in the System-Wide Tests button selection
group.
Automatic Testing
These options determine the automatic behavior of the available system tests.
Complete System Test
When the box is checked, a complete system-wide test will automatically run at the time
entered in the Time box. (24-hour clock format). Uncheck the box to disable the
automatic system test. This test should be scheduled at a time when the system use is
minimal and the facility is mostly unoccupied by the public.
20K Test
When the box is checked, a 20kHz test will be performed at the specified time interval (in
minutes). This test is inaudible and will not impact system operation.
231
596 Series Test Configuration
This page has been intentionally left blank.
232
15
Titan Series Auto Test Configuration
Titan series amplifier frames (T9160) are equipped with automatic test functionality to allow each frame
to monitor its own health as well as that of attached speaker circuits. Any suspected faults are reported
to IED's Fault Logger application. This functionality is configured from the Auto Tests window in
Enterprise.
Auto Tests Window
Title Bar
Menu and Tool Bars
Run Tests
Test Results Grid
Status Bar
Point Selection Window
Auto Test Configuration Window
234
236
236
237
238
240
242
244
Title Bar
Menu Tool Bars
Point Selection Grid
Status Bar
Edit Test Signals Window
245
245
246
249
251
Title Bar
Edit Test Schedules Window
251
255
Title Bar
Test Sequences
Schedules for selected Sequences
Edit Test Points Window
255
256
257
259
Title Bar
Points list box, Add Point button and Del Point button
Circuit Data
Collector Unit
Reset Points, OK and Cancel Buttons
About Window
259
259
260
260
261
262
233
Chapter 15: Titan Series Auto Test Configuration
Auto Tests Window
To access the Auto Test functionality, open the Auto Tests window by first selecting a frame in
Enterprise's left hand pane then double-clicking the Test icon.
Figure 15-1: Accessing the Auto Tests Window
The Auto Tests window displays information regarding the currently configured tests, along with the
most recent results, if any, for those tests. Additionally, the Auto Tests window provides the ability to
manually initiate tests, perform sets, play the test tone for a specific point, refresh the displayed test
results, open the Auto Test Configuration window and print test result information via IED Print
Manager.
Note:
234
User access to features of the Auto Tests window are controlled by permissions.
Some features of the Auto Tests window may not be available if the user does not
have that level of permission.
Chapter 15: Titan Series Auto Test Configuration
Figure 15-2: Auto Tests Window
The Auto Tests window is broken down into the following specific areas of information, each of
which is discussed in more detail below:
Title Bar
The Title Bar is the blue area at the very top of the window and contains general information
pertaining to the entire window.
Menu and Tool Bars
The Menu and Tool Bars are immediately below the Title Bar and provide access to the
various functionality of the Auto Tests window.
Test Results Grid
The Test Results Grid is the large section in the center of the window and contains
information regarding the frame's Auto Test results.
Status Bar
The Status Bar is the grey bar at the bottom of the window and provides a variety of status
information.
235
Chapter 15: Titan Series Auto Test Configuration
Title Bar
In addition to the window name, the title bar at the top of the Auto Tests window displays the
following information about the amplifier frame being controlled by this window:
• The frame's description
• The frame's IP address
• A numeric identifier for the frame - This number is often called the I24 device handle. It is
unique to the system and is used by some low level tools to identify the frame.
Menu and Tool Bars
The Menu and Tool bars provide quick access to the various functions of the Auto Tests window.
The following list details this functionality.
File
Login/Logout
Opens the login window or causes the currently logged in user to be logged out. This
functionality is also available by pressing F2.
Print
Opens IED Print Manager. (See the section of this document on Enterprise Printing for
information on IED Print Manager.) This functionality is also available by holding down
<Ctrl> and pressing P.
Close
Closes the Auto Tests window. This functionality is also available by pressing F10.
Edit
Auto Test Configuration
Opens the Auto Test Configuration window. This option requires the current user to
have the 'Configure Tests' permission under Titan DLL in IED's Password Manger.
View
Refresh
Refreshes the test results shown in the Test Results Grid.
Auto Refresh
When this item is checked, the Test Results Grid automatically refreshes the test results
and other data whenever a test completes, regardless of whether the test was started
automatically or manually.
236
Chapter 15: Titan Series Auto Test Configuration
Help
About
Displays the About window.
Run Tests
The Run Tests menu is only available from the tool bar or as a pop-up menu by right clicking in
the Test Results Grid. This menu provides a sub-menu for each defined test which in turn
provides menu items to initiate sets and tests. Since all of these sub-menus are identical except
for which test is run, only the default 'Periodic Test' is detailed in the list below.
Periodic Test (or other test name)
Full Test
Run a test (all frequencies) for all points in the test. This option requires the current user
to have the 'Run Tests' permission under Titan DLL in IED's Password Manger.
Single Point Test
Run a test (all frequencies) for a single test point. This option opens the Point Selection
window shown below. This option requires the current user to have the 'Run Tests'
permission under Titan DLL in IED's Password Manger.
Test Tone
Play a tone on a single test point. The tone expires after several minutes or may be
stopped with the Stop Current Test menu item. (This option opens the Point Selection
window shown below. Both the point and the frequency of the tone may be selected on
this window. This option requires the current user to have the 'Run Tests' permission
under Titan DLL in IED's Password Manger.
Full Set
Perform a set (all tones) for all points in the test. This option requires the current user to
have the 'Set Levels' permission under Titan DLL in IED's Password Manger.
Single Point Set
Perform a set (all tones) for a single test point. This option opens the Point Selection
window shown below. This option requires the current user to have the 'Set Levels'
permission under Titan DLL in IED's Password Manger.
Stop Current Test
Stops any tests which are currently running in the frame. This item is most useful to turn off
Test Tones before they expire. This option requires the current user to have the 'Run Tests'
permission under Titan DLL in IED's Password Manger.
237
Chapter 15: Titan Series Auto Test Configuration
Test Results Grid
The Test Results Grid provides detail regarding the most recent results from each of the frame's
Auto Tests. Each row of the grid provides information for a specific test point, while each column
provides information for a specific result value.
Figure 15-3: Test Results Grid
The top of the Test Results Grid's contains header rows which have white text on a blue
background that fades from dark to light. Header rows do not move when the grid is scrolled.
Before discussing the meaning of the text in the header rows, it is first necessary to understand
the non-header rows in the grid. Each of these non-header rows represents a specific location,
or test point, in a channel's signal chain where audio levels can be measured. For Titan series
amplifier frames, there are four test points per channel (additional points may be available in
some cases). These points are grouped by channel and each channel group is delineated by
alternating light blue and white backgrounds. Information about the four test points in Titan
amplifier frame is provided in the following list:
Ambient Out
The Ambient Out point allows signal measurement after all digital signal processing is
complete, but prior to the signal being converted to analog for amplification.
Amp Input
The Amp Input point allows signal measurement after the signal is converted to analog, but
before amplification.
Amp Output
The Amp Output point allows measurement of the audio signal after amplification. The
values measured on this point are affected by the load and condition of the speaker circuit.
Speaker Current
The Speaker current point is measured at the same place in the signal chain as the Amp
Output point, but is a current measurement rather than a voltage measurement. Changes
in the speaker circuit's load usually result in noticeable changes in the value measured at this
238
Chapter 15: Titan Series Auto Test Configuration
point.
The text in the header rows provides organizational descriptions of the data in the grid's
columns. The header row for the first two columns simply show one title per column, but header
rows for the remaining columns show a more complex organization where several columns
share titles in the first and second rows. The meanings of each column title and their
organizational meaning are provided in the following list:
Zone
The Zone column lists the page zone, if any, assigned to each of the channels by which the
Points are grouped. The data cells in this column span several rows, indicating that all of
those rows belong to the zone's assigned channel. In the case where the same zone is
assigned to multiple channels, the rows are grouped by channel (not zone) and therefore
the zone will be displayed more than once. As stated above, the alternating blue and white
backgrounds designate channel groupings and therefore each Zone cell completely spans
each row of blue or white background.
Points
The Points column lists each of the points available for testing in the amplifier frame. The
points are organized by channel so that all of the points on any given channel appear
together. This grouping is displayed by one Zone cell spanning several Points cells as well as
by the alternating blue and white background.
<Test Name> (top row of columns three and greater)
Each defined test has its own column header which spans one or more Frequency columns.
(By Default there are two tests defined the 'System Test' and the 'Periodic Test', each of which,
by default, spans one Frequency column.) For example, in Figure 15-9 the 'System Test'
column header spans two Frequency columns, '400Hz' and '1Khz'. Essentially, this means
that both 400Hz and 1 kHz tones are used (separately) during the 'Periodic Test'. Test
Columns headers have borders which are slightly thicker and darker. A clock symbol in this
column header indicates that the test is scheduled to run automatically. (See the Edit Test
Schedules window for more information.)
<Frequency> (second row of columns three and greater)
Each defined test signal has its own column header, labeled with the tone's frequency, which
spans three Test Results columns: Set, Test and Dev. For each Frequency column header,
the same three result columns are repeated so that the three values in these columns may be
shown for each frequency. For example, in Figure 15-9 each of the frequency columns,
'400Hz', '1KHz', and '20kHz' span three columns, 'Set', 'Test', and 'Dev.' In essence, this
means that each point may be tested for each frequency within a given test.
Set, Test and Dev. (third row of columns three and greater)
These three column headers each specify the actual result data for the frequency (and test)
under which they are grouped. All three columns are shown for each frequency, whether or
not any points are actually configured for testing under that frequency/test. The values
239
Chapter 15: Titan Series Auto Test Configuration
shown in these columns are measured at the point listed in the Points column of the row in
which the value appears. Additionally, the values shown are measured as the frequency
under which they are shown is generated through the channel. If a point is not configured
for testing under a given frequency, all three columns will show a blue dash rather than a
value. Likewise, in the case where a point is configured as part of the test, but the value is
unknown for some reason, three question marks (???) are displayed rather than a value.
The following list discusses each of these three columns in detail:
Set
The data under the Set column header represents the value, for this intersection of
frequency and point, to which all test measurements, for the same intersection of
frequency and point, are compared. In other words this value is the recorded
measurement under normal operating conditions. This value is referred to as a 'Set
Value' and is generated when a Full or Point Set is performed from the Run Tests menu
and then re-used for tests until another Set is performed. A yellow background and/or
question marks instead of a value in the Set column (as shown for the Speaker Current
points in Figure 15-9) indicates that a valid set value has not been recorded for this
point, frequency, test. This could indicate that a Set has never been performed or that
there is an issue at that point. For Current points, this usually indicates that the load on
the amplifier is not significant enough for a valid measurement.
Test
The data under the Test column shows the most recent measurement taken at that point
for the frequency under which the value appears. This measurement can be the result of
a manual Full or Point test or of an automatic (scheduled) Full test. This column will have
a red background (as with the Amp Output points in Figure 15-9) if it differs more than
the configured deviation from the value in the Set column. Question Marks in this
column can indicate that the point was not tested (usually because it has no valid set
value during an automated test run) or that the value measured was invalid (in the noise
floor).
Dev.
The data under the Dev. column shows the deviation between the Test value and the Set
value. The deviation is calculated by subtracting the Set value from the Test value, rather
than being measured. This column will have a red background (as with the Amp Output
points in Figure 15-9) if it is outside the configured allowable deviation for the point,
frequency and test under which the value is shown. Question marks in this column
occur whenever either the Set value or the Test value is not known.
Status Bar
The Auto Tests window's Status Bar has six sections, three text sections and three graphic
sections. These sections are described in the following list:
The left most text section displays information specifying the currently running test. If no tests are
currently running, this section is blank. This section also displays information on background
processes which prevent editing, such as make permanent.
240
Chapter 15: Titan Series Auto Test Configuration
When the cursor is held over one of the header rows in the Test Results Grid, the center text
section displays the date and time of the most recent results for the test specific to the column
under the mouse. If the cursor is held over a specific point, additional information regarding that
point may be displayed. The possible additional information is detailed in the following list:
• 'Not Set' - The point does not have a valid set value. Generally, the Set column for the
point in the Test Results Grid will also have a yellow background.
• 'Not tested in last test' - The point has a valid set value but does not have a valid result
from the last run of the test. (This is rare and usually indicates that 'OK results' are not
being saved for the test, only bad results. See the Edit Test Schedules window for more
information.)
• 'Not selected for test' - The point is not configured as part of the test. (In other words, it is
not checked in the Auto Test Configuration window's point selection grid.)
The right most text section displays the currently logged in user, or the words 'Not Logged In' if
no user is logged in.
The left most graphic section indicates whether or not the Auto Tests window is correctly
communicating with the database. A green 'light' indicates good communications and red
indicates a problem with database communications.
The center graphic section indicates whether or not the Auto Tests window is communicating
with the amplifier frame. A green 'light' indicates good communications and red indicates that
the window is not communicating with the frame.
The right most graphic section becomes animated whenever the software is 'busy' with some
background processing.
241
Chapter 15: Titan Series Auto Test Configuration
Point Selection Window
The Point Selection window is displayed when either Single Point Test or Test Tone is selected from the
Run Tests pop-up menu. This window (see Figure 15-4) allows selection of a specific point and
frequency to be used in the Single Point Test or for the Test Tone. (It is necessary to specify a point for
the Test Tone so that the system knows which channel should receive the selected tone.) Only points
already configured as part of the chosen test chosen are available in this window.
Figure 15-4: Point Selection Window
The top (dark blue fading to gray) portion of the Point Selection window specifies the description of
the test to be run, brief instructions to select a point (and possibly a frequency), the type of test to be
run (Single Point Test or Test Tone) and a reminder that the only points available are points already
configured as part of the test.
For tests with multiple frequencies, a list of checkboxes, one for each available frequency is shown
near the top of the window, immediately below the reminder. Only one frequency may be selected at
a time.
The main portion of the window (in white) displays a list of checkboxes, one for each available test
point. Only one point may be selected at a time. The other controls on this window are as follows:
Clear
button - Clears any point selection, resetting the form to defaults.
OK
button - This button is only available after one point, and one frequency if displayed, has
been selected. Clicking the OK button initiates the test shown at the top of the window for
the point (and frequency if shown) selected and then closes the Point Selection window.
242
Chapter 15: Titan Series Auto Test Configuration
Cancel
button - Close the window without taking any other action. The test shown at the top menu
is not run.
243
Chapter 15: Titan Series Auto Test Configuration
Auto Test Configuration Window
The Auto Test Configuration window (see Figure 15-5) opens when the Auto Test Configuration
menu item or toolbar button. This window provides the ability to add or remove points from a test's
configuration, to set the positive and negative deviation thresholds for each point and to access
configuration windows for signal settings, test schedules and point definitions.
Note:
Unlike the Auto Tests window, and most other windows used to configure Titan
frames, the changes made on this window are not live edits and do not take effect
until the changes are saved via the File ' Close menu or the OK button.
Figure 15-5: Auto Test Configuration Window
The Auto Test Configuration window is broken down into the following specific areas of information,
each of which is discussed in more detail below:
• The Title Bar is the blue area at the very top of the window which contains general
information pertaining to the whole window.
• The Menu and Tool Bars are immediately below the Title Bar and provide access to the
various functionality of the Auto Test Configuration window.
• The Point Selection Grid is the large section in the center of the window in which lists points
and their deviations.
• On the right, near the bottom of the window are the OK and Cancel buttons.
• The Status Bar is the grey bar at the bottom of the window and provides a variety of status
information.
244
Chapter 15: Titan Series Auto Test Configuration
Title Bar
In addition to the window name, the title bar at the top of the Auto Test Configuration window
displays the following information about the amplifier frame which runs the tests being edited in
this window:
• The frame's description
• The frame's IP address
• A numeric identifier for the frame - This number is often called the I24 device handle. It is
unique to the system and is used by some low level tools to identify the frame.
Menu Tool Bars
The Menu and Tool bars provide quick access to the various features of the Auto Test
Configuration window. The following list details these features.
File
Login/Logout
Opens the login window or causes the currently logged in user to be logged out. This
functionality is also available by pressing F2.
Print
Opens IED Print Manager. (See the section of this document on Enterprise Printing for
information on IED Print Manager.) This functionality is also available by holding down
<Ctrl> and pressing P.
Close
Closes the Auto Test Configuration window. This functionality is also available by
pressing F10. If any changes have been made, choosing this option will cause Changes
Not Saved dialog box to appear.
Figure 15-6: The Changes Not Saved dialog box
In the Changes Not Saved dialog box: the Yes button saves changes and closes the
Auto Test Configuration window; the No button closes the Auto Test Configuration
window without saving; and the Cancel button returns to the Auto Test Configuration
window without saving.
245
Chapter 15: Titan Series Auto Test Configuration
Edit
Edit Signal Settings
Opens the Edit Test Signals window.
Edit Test Schedules
Opens the Edit Test Schedules window.
Edit Points Definitions
Opens the Edit Test Points window. This option requires the current user to have the
'Configure Adv. Test Params' permission under Titan DLL in IED's Password Manger.
Help
About
Displays the About window.
Point Selection Grid
The Point Selection Grid (see Figure 15-7) provides the ability to edit the points which are
selected to be in each test, as well as the positive and negative deviation thresholds for each
selected point.
Figure 15-7: Point Selection Grid
The top of the Point Selection Grid contains header rows which have white text on a blue
background that fades from dark to light. Header rows do not move when the grid is scrolled.
Before discussing the meaning of the text in the header rows, it is first necessary to understand
the non-header rows in the grid. Each of these non-header rows represents a specific location,
or test point, in a channel's signal chain where audio levels can be measured. For Titan series
amplifier frames, there are four test points per channel (additional points may be available in
some cases). These points are grouped by channel and each channel group is delineated by
alternating light blue and white backgrounds. Information about the four test points in Titan
amplifier frame is provided in the following list:
246
Chapter 15: Titan Series Auto Test Configuration
Ambient Out
The Ambient Out point allows signal measurement after all digital signal processing is
complete, but prior to the signal being converted to analog for amplification.
Amp Input
The Amp Input point allows signal measurement after the signal is converted to analog, but
before amplification.
Amp Output
The Amp Output point allows measurement of the audio signal after amplification. The
values measured on this point are affected by the load and condition of the speaker circuit.
Speaker Current
The Speaker current point is measured at the same place in the signal chain as the Amp
Output point, but is a current measurement rather than a voltage measurement. Changes
in the speaker circuit's load usually result in noticeable changes in the value measured at this
point.
The text in the header rows provides organizational descriptions of the data in the grid's
columns. The header row for the first two columns simply show one title per column, but header
rows for the remaining columns show a more complex organization where several columns
share titles in the first and second rows. The meanings of each column title and their
organizational meaning are provided in the following list:
Zone
The Zone column lists the page zone, if any, assigned to each of the channels by which the
Points are grouped. The data cells in this column span several rows, indicating that all of
those rows belong to the zone's assigned channel. In the case where the same zone is
assigned to multiple channels, the rows are grouped by channel (not zone) and therefore
the zone will be displayed more than once. As stated above, the alternating blue and white
backgrounds designate channel groupings and therefore each Zone cell completely spans
each row of blue or white background.
Points
The Points column lists each of the points available for testing in the amplifier frame. The
points are organized by channel so that all of the points on any given channel appear
together. This grouping is displayed by one Zone cell spanning several Points cells as well as
by the alternating blue and white background.
<Test Name> (top row of columns three and greater)
Each defined test has its own column header which spans one or more Frequency columns.
(By Default there are two tests defined the 'System Test' and the 'Periodic Test', each of which,
by default, spans one Frequency column.) For example, in Figure 15-9 the 'System Test'
column header spans two Frequency columns, '400Hz' and '1Khz'. Essentially, this means
247
Chapter 15: Titan Series Auto Test Configuration
that both 400Hz and 1KHz tones are used (separately) during the 'Periodic Test'. Test
Columns headers have borders which are slightly thicker and darker. A clock symbol in this
column header indicates that the test is scheduled to run automatically. (See the Edit Test
Schedules window for more information.)
<Frequency> (second header row of columns three and greater)
Each defined test signal has its own column header, labeled with the tone's frequency, which
spans three Test Results columns: Set, Test and Dev. For each Frequency column header,
the same three result columns are repeated so that the three values in these columns may be
shown for each frequency. For example, in Figure 15-9 each of the frequency columns,
'400Hz', '1KHz', and '20kHz' span three columns, 'Set', 'Test', and 'Dev.' In essence, this
means that each point may be tested for each frequency within a given test.
+Dev. and -Dev. (third row of columns three and greater)
These three column headers each relate to the data in the point selection grid. The following
list discusses these columns in detail:
• The checkboxes in the first column indicate whether or not the point for the row of
each checkbox is selected to be tested at the frequency of the test for the column of
the checkbox. Checked means the point is selected for testing. For example, in Figure
15-7 the point labeled '6 - Chan 1A Amp Input' is selected to be tested for the 400Hz
frequency but not at the 1KHz frequency of the System test. To select a point, place a
check in the checkbox by either clicking on the checkbox or by pressing the spacebar
when the cell containing the checkbox is highlighted.
• +Dev. and -Dev. - The +Dev. and -Dev. columns allow modification of the deviation
thresholds for that point, frequency, test. A deviation threshold is the amount a
measurement can vary from the Set value for the same point, frequency, test before a
fault is declared. The positive deviation, or +Dev., is the amount the measured value
can vary above the set value; the negative deviation, or -Dev., is the amount the
measured value can vary below the set value.
There are a number of shortcuts available in the Point Selection Grid:
• Arrow keys can be used to navigate the grid.
• The space bar provides a shortcut method to check/uncheck checkboxes.
• The check boxes in the header row can be used to select or deselect all the checkboxes in
the column below them.
• Deviation values can be cut and pasted using standard Windows cut and paste (Ctrl-C
and Ctrl-V, respectively). If a deviation value is pasted to a point not selected for testing,
the grid automatically selects that point for testing.
• Right clicking on a deviation displays the Copy Deviation pop-up menu, which allows the
copying of the selected deviation value to other points under the frequency. Each choice
is defined below Figure 15-8.
248
Chapter 15: Titan Series Auto Test Configuration
Figure 15-8: Copy Deviation Pop-up Menu
• Copy To Checked +/- - Copies the selected value to both positive and negative
deviations of all checked points under the selected test and frequency.
• Copy To Checked + - Copies the selected value to only the positive deviations of all
checked points under the selected test and frequency.
• Copy To Checked - - Copies the selected value to only the negative deviations of all
checked points under the selected test and frequency.
• Copy To All +/- - Copies the selected value to both positive and negative deviations
of all points under the selected test and frequency, automatically selecting all points.
• Copy To All + - Copies the selected value to only the positive deviations of all points
under the selected test and frequency, automatically selecting all points.
• Copy To All - - Copies the selected value to only the negative deviations of all points
under the selected test and frequency, automatically selecting all points.
OK
The OK button saves any changes which have been made and then closes the Auto Test
Configuration window.
Cancel
The Cancel button discards any changes which have been made to the point configuration
of each test and closes the Auto Test Configuration window.
Status Bar
The Auto Test Configuration window's Status Bar has five sections, two text sections and three
graphic sections. These sections are described in the following list:
• The left text section displays information on background processes which prevent editing,
such as make permanent
• The right text section displays the currently logged in user or the words 'Not Logged In' if
no user is logged in.
• The left most graphic section indicates whether or not the Auto Test Configuration
window is correctly communicating with the database. A green 'light' indicates good
communications and red indicates a problem with database communications.
• The center graphic section indicates whether or not the Auto Test Configuration window
is communicating with the amplifier frame. A green 'light' indicates good
communications and red indicates that the window is not communicating with the
frame.
249
Chapter 15: Titan Series Auto Test Configuration
• The right most graphic section becomes animated whenever the software is 'busy' with
some background processing.
250
Chapter 15: Titan Series Auto Test Configuration
Edit Test Signals Window
The Edit Test Signals window allows for the modification, creation and deletion of the test signal
settings (tones) available for testing. This window can be accessed from the menus or toolbar of the
Auto Test Configuration Window.
Note:
Changes made on this window are not live edits and do not take effect until the
changes are saved via the OK button.
Figure 15-9: Edit Test Signals Window
• The Edit Test Signals window can be broken down into five different sections. These sections
are listed here and discussed in greater detail in the following paragraphs:
• The Title Bar is the blue area at the very top of the window which contains general
information pertaining to the whole window.
• The Test Settings list box, the Add Setting button and the Del Setting button.
• The Test Data group box at the top-right of the window.
• The Advanced Options group box at the bottom-right. These options require that the current
user to have the 'Configure Adv. Test Params' permission under Titan DLL in IED's Password
Manger and may not be visible for all users.
• On the right, at the bottom of the window are the OK and Cancel buttons.
Title Bar
In addition to the window name, the title bar at the top of the Auto Test Configuration window
displays the following information about the amplifier frame which runs the tests being edited in
this window:
• The frame's description
• The frame's IP address
• A numeric identifier for the frame - This number is often called the I24 device handle. It is
unique to the system and is used by some low level tools to identify the frame.
251
Chapter 15: Titan Series Auto Test Configuration
Test Settings list box, Add Setting button and Del Setting button
The Test Settings list box shows the currently defined signal settings, displaying both the
Frequency and the Setting Name for each signal setting. The details of the selected signal
setting are editable in the Test Data group box and, if available, the Advanced Options
group box on the right. To change which signal setting is being edited, simply select the
desired signal setting by clicking on it in this list box.
Clicking the Add Setting button to adds a new setting with default values, and automatically
select it so that it is available for immediate editing.
Clicking the Del Setting button deletes the currently selected signal setting.
Note:
Every amplifier frame leaves the factory with two default signal settings. These
settings are labelled '20KHz (1) Inaudible Settings' and '1KHz (2) Audible Settings'.
The 20KHz setting cannot be deleted and is not available for use except with the
(also factory default) 'Periodic' test, which is sometimes referred to as the 'Inaudible'
test. Because the 20KHz signal setting is used by the 'Periodic' test, modification of
the 20KHz setting is discouraged. With the exception of the 20KHz / Periodic Test, all
signal settings are available for use with all tests other than the 'Periodic Test'.
Test Data
The Test Data group box contains the commonly used edits for signal settings. Each of these
edits is discussed in the following list:
Setting Name
This edit box provides the ability to assign the signal setting a human readable name.
This name is displayed in the Test Settings list box on the left. It is not necessary to include
the frequency of the test setting in the name since the Auto Test windows automatically
display the frequency whenever a Setting Name is displayed.
Frequency
This droplist box provides the ability to set the frequency of the tone generated by this
signal setting. While several frequencies are provided in the drop list, it is also possible to
type in other frequencies in the range of zero to 20,000 Hertz. If the Waveform droplist
box is set to 'None (DC)' the Frequency droplist box changes to zero and cannot be
edited.
Test Signal Level
This spin edit allows adjustment of the signal level for the selected signal setting.
Generally, this value should be in the neighborhood of -36.0 dBfs for audible tones, to
avoid extremely loud audible tones. The valid range of values for the Test Signal Level
ranges from -50.0 dBfs to -10.0 dBfs.
252
Chapter 15: Titan Series Auto Test Configuration
Waveform
This droplist box provides the ability to change the test tone from a Sine Wave to a
constant DC voltage. Under most circumstances, the Waveform should be a Sine Wave.
External Signal Source
In rare cases, it might be necessary to use an externally sourced test signal rather than
allowing the frame to generate its own test tone. In cases where this is necessary, the
External Signal Source checkbox must be checked for all signal settings relying on the
external source(s). When this checkbox is checked, the Waveform and Frequency
cannot be edited.
Default Deviation Threshold (+/-)
These two spin edits control the default values used for the positive and negative
deviation thresholds when a point is first selected for testing on the Auto Test
Configuration Window. The spin edit labeled '(+)' changes the default positive deviation
threshold, and the spin edit labeled '(-)' changes the default negative deviation threshold.
Advanced Options
The Advanced Options group box contains parameters which should only be modified by
qualified personnel. Consequently, these edit controls are not visible unless the current user
has the 'Configure Adv. Test Params' permission under Titan DLL in IED's Password Manger.
Each of these settings is detailed in the following list:
Setup Time
This spin edit controls the amount of time the system waits at the beginning of a test to
allow for the signal generator to 'settle' into a consistent signal.
Dwell Time
This spin edit controls the amount of time the system waits after selecting a point before
measurement is made to allow any noise generated by switching points to dissipate.
Bandwidth
This spin edit controls the bandwidth of the bandstop and bandpass filters used when
measurement is made, if any.
Test Type
This drop list box allows provides the system with some additional information used to
better tune specific tests. In general the following rules should be used to determine this
setting:
• 20K Setup - Select this option for inaudible tones.
• Audible Setup - Select this option for audible tones.
• Pgm Mute + Bnd Pass - Select this option only when it is necessary to mute the
program audio during the test.
• None - This option is reserved for factory use.
253
Chapter 15: Titan Series Auto Test Configuration
OK
The OK button saves any changes which have been made and then closes the window.
Cancel
The Cancel button discards any changes which have been and closes the window.
254
Chapter 15: Titan Series Auto Test Configuration
Edit Test Schedules Window
The Edit Test Schedules Window (see Figure 15-10) allows for the creation, deletion and scheduling
of test sequences. Test sequences are usually referred to simply as tests. The two terms 'test
sequence' and 'test' are used somewhat interchangeably in this document. This window can be
accessed from the menus or toolbar of the Auto Test Configuration Window.
Note:
Changes made on this window are not live edits and do not take effect until the
changes are saved via the OK button.
Figure 15-10: Edit Test Schedules Window
The Edit Test Schedules window can be broken down into four different sections. These sections are
listed here and discussed in greater detail in the following paragraphs:
• The Title Bar is the blue area at the very top of the window which contains general
information pertaining to the whole window.
• The Test Sequences group box.
• The Schedules for selected Sequences group box.
• The OK and Cancel buttons.
Title Bar
In addition to the window name, the title bar at the top of the Auto Test Configuration window
displays the following information about the amplifier frame which runs the tests being edited in
this window:
• The frame's description
• The frame's IP address
255
Chapter 15: Titan Series Auto Test Configuration
• A numeric identifier for the frame - This number is often called the I24 device handle. It is
unique to the system and is used by some low level tools to identify the frame.
Test Sequences
The edits in the Test Sequences group box allow for creating, deleting and modifying the name
and basic options of a test. Each of these edits is discussed in detail in the following paragraphs.
The Test Sequences list box, on the left of the Test Sequences group box, allows for the selection
of existing tests so that they may be edited.
The Add button in the Test Sequences group box adds a new test, with a default schedule which
is not enabled.
The Delete button in the Test Sequences group box deletes the currently selected test.
Note:
Every amplifier frame leaves the factory with two default test sequences. These
settings are labelled 'Periodic Test' and 'System Test'. The 'Periodic' test, which is
sometimes referred to as the 'Inaudible' test, cannot be deleted and modification of
this test is discouraged.
The Test Sequence Description edit box allows for editing the name of the selected test. This
name appears in the Test Sequences list box as well as in the column headers of the Auto Tests
and the Auto Test Configuration windows.
Below the Test Sequence Description edit box are four checkboxes which affect how the frame
saves test results for the selected test:
Save OK Results
When checked, the frame saves test results for points which are set properly and which pass
the test. If not checked, these results are not saved, and therefore are not displayed in the
Auto Tests window.
Save Fault Results
When checked, the frame saves test results for points which are set properly and which fail
the test. If not checked, these results are not saved, and therefore are not displayed in the
Auto Tests window.
Save Unknown Results
When checked, the frame saves test results for points which do not test properly (this is a
rare condition). If not checked, these results are not saved, and therefore are not displayed
in the Auto Tests window.
Save Set Results
When checked, the frame saves sets as results. If not checked, sets are not saved as results.
Note that set values are always saved, but if they are not saved as results, the set run will not
appear in the Auto Tests window. However, the Auto Tests window overrides this setting so
256
Chapter 15: Titan Series Auto Test Configuration
that all sets performed are saved as results.
Schedules for selected Sequences
The edit controls in the Schedules for selected Sequence group box allow for configuring the test
sequence selected in the Test Sequences list box to be run automatically at defined times. If
necessary, the same test can be run with multiple schedules. The edit controls in this group box
are discussed in detail in the following paragraphs.
The Schedules list box, on the left of the Schedules for selected Sequences group box, allows for
the selection of an existing schedule for the test selected in the Test Sequences list box so that the
schedule may be edited.
The Add button in the Schedules for selected Sequence group box group box adds a new
schedule with default settings.
The Delete button in the Schedules for selected Sequence group box deletes the currently
selected Schedule.
Note:
Each test must have at least one schedule defined. Therefore, if only one schedule is
listed, the Delete button is disabled.
The remaining items in this group box define the parameters of the schedule (when the test will
be run). These items are not specifically labeled, but rather are organized with labels so that
reading the list gives a clear, human understandable description of the schedule. (For example,
for the values shown in Figure 15-10 the test will be run "between 12:00 am and 12:00 am (24
hours) on Monday, Tuesday, Wednesday, Thursday, Friday, Saturday and Sunday every sixty
seconds."
For clarity, this document will refer to the top two spin edits as the 'time edits', the edit next to the
label 'on' as the 'day edit' and the bottom spin edit as the 'interval edit'.
Each of the schedule parameters are discussing in the following list:
Enable Schedule
This checkbox determines whether the selected test will be run automatically according to
the remainder of the selected schedule's parameters. If checked, the selected test will be run
according to the schedule. If unchecked, the test will not be run according to the schedule,
but the selected test will still be run if other schedules are defined and enabled for this test.
When the Enable Schedule checkbox is unchecked, the remaining items in this group
cannot be edited.
Once Per Day
When checked, this check box configures the schedule to only run the test once per day, at
the time specified in the top time edit, on the days shown in the days edit. Since these values
are not used in this case, the other time edit and the interval edit are disabled when this
checkbox is checked. If unchecked, the schedule is configured to run the selected test
between the times specified in the time spin edits, on the days shown in the days edit, at the
interval defined by the interval spin edit.
257
Chapter 15: Titan Series Auto Test Configuration
Time Edits
This document refers to the top two spin edits in the Schedules group box as the time edits.
These edits specify the start and stop times of the schedule, with the top time edit as the start
time. In other words, the selected test will only be run between the time shown in the top time
edit and the time shown in the other time edit (or run once, at the time in the top time edit, if
Once Per Day is checked). If both time edits show the same time, then there is no limit on
what time a test runs automatically.
Days Edit
This document refers to the edit below the time edits as the Days edit. This edit control
specifies the days on which a test schedule runs the selected test. If no days are selected,
then the test will not be run on this schedule. To edit the selected days, click on the '…' button
in this edit and the Day Selection dialog box opens (see Figure 15-11). This dialog box
contains a checkbox for each day of the week, as well as four quick buttons which select
only the days specified on the button. The OK button saves changes to the day selection and
closes the dialogue box. The Cancel button cancels any changes and closes the dialogue
box.
Figure 15-11: Day Selection dialog
Interval Edit
This document refers to the bottom spin edit as the Interval edit. This edit control specifies, in
seconds, how often the selected test is run during the allowed times on the allowed days.
Generally this value should not be shorter than 60 seconds. This edit is meaningless and
therefore disabled, if the Once Per Day checkbox is checked.
OK
The OK button saves any changes which have been made and then closes the window.
Cancel
The Cancel button discards any changes which have been and closes the window.
258
Chapter 15: Titan Series Auto Test Configuration
Edit Test Points Window
The Edit Test Points Window allows for the creation, deletion and editing of the points available for
testing. This window can be accessed from the menus or toolbar of the Auto Test Configuration
Window if the current user has the 'Set Levels' permission under Titan DLL in IED's Password Manger.
Note:
Changes made on this window are not live edits and do not take effect until the
changes are saved via the OK button.
Figure 15-12: Edit Test Points Window
The Edit Test Schedules window can be broken down into five different sections. These sections are
listed here and discussed in greater detail in the following paragraphs:
• The Title Bar is the blue area at the very top of the window which contains general
information pertaining to the whole window.
• The Points list box, the Add Point button and the Del Point button.
• The Circuit Data group box.
• The Collector Unit group box.
• The Reset Points button, the OK button and the Cancel button.
Title Bar
In addition to the window name, the title bar at the top of the Auto Test Configuration window
displays the following information about the amplifier frame which runs the tests being edited in
this window:
• The frame's description
• The frame's IP address
• A numeric identifier for the frame - This number is often called the I24 device handle. It is
unique to the system and is used by some low level tools to identify the frame.
Points list box, Add Point button and Del Point button
The Points list box, lists the currently defined test points, with the currently selected point
highlighted in blue.
259
Chapter 15: Titan Series Auto Test Configuration
The Add Point button adds a new point with default parameters and automatically selects that
point for editing.
The Del Point button deletes the currently selected point
Circuit Data
The Circuit Data group box details the parameters of the selected test point, many of which are
dependent on the circuit to which the point is 'attached'.
The Point Description edit box allows editing of a human readable description for each point.
This description is shown in the Points list box as well as on the Auto Tests and Auto Test
Configuration windows.
The Maximum Input Level droplist box allows editing of the anticipated maximum input level for
the selected point. This value is used by the hardware to insure an accurate measurement while
maintaining electrical protection to the measurement circuits. When in doubt, choose the
highest reasonable value and lower it if the measurement at the point is too low. The available
choices are:
• "-10 dB (Low Line Level)
• "14 dB (Line Level)
• "24 dB (High Line Level)
• "30 dB (596S sensor / 8 Ohm speaker)
• "40 dB (70v Speaker Level)
The Circuit Chain droplist box contains a list of channel inputs and channel amplifiers. If the
selected point is on the input side of a channel, the appropriate channel input should be
selected; likewise if the selected point is on the output side of a channel, the appropriate channel
amplifier should be selected. For example, if the point is on the speaker circuit of channel 3B,
then "Amp 3B" should be selected. If the point is not on a channel controlled by this frame, then
"None" should be selected.
The Point Type droplist box specifies whether the point is intended to measure Audio Voltage or
Audio Current. For points external to the frame, this setting should always be Audio Voltage.
The Listen Level Adjust spin edit, specifies a value by which the audio level is adjusted when this
point is monitored. This allows the volume on the monitor speaker to be similar as one switches
between points for monitoring.
The Device Code list box should generally be set to Miscellaneous for points external to the
frame. The remaining choices only apply to points internal to the frame.
Collector Unit
The Collector Unit group box provides edits that specify where the test point is connected to
the system.
The I24 Handle droplist box lists the available point collector units for this frame. The
collector unit to which the point is physically wired should be selected in this droplist box.
260
Chapter 15: Titan Series Auto Test Configuration
Units which have names enclosed in angle brackets, '<>' are cards internal to the frame
and should not be selected for most purposes. Other (external) collector units, for example a
T9032MT, must be added to IED Enterprise before appearing in this droplist box.
The Input Number spin edit specifies the exact input of the above collector to which the point
is physically connected. For example, on a T9032MT, this number corresponds to the
physical input number of the T9032MT.
Reset Points, OK and Cancel Buttons
The Reset Points button resets all default test points back to default values and restores any
default points which were deleted. Points which have been added with the Add Point button are
not affected.
The OK button saves any changes which have been made and then closes the window.
The Cancel button discards any changes which have been and closes the window.
261
Chapter 15: Titan Series Auto Test Configuration
About Window
The About window provides copyright, version, and location information about the T9160.DLL
software from which the Titan Auto Test windows are loaded. The information on this screen is often
used to verify the installed version of this DLL.
Figure 15-13: About Window
Pressing the OK button closes this window.
262
16
System Supervision
System Supervision is a sub-system of the IED system that includes several components. The core
component of this feature is the System Supervision Service that is an application that runs in the
background of the Windows operating system on the server computer. This service receives and logs
fault reports received from devices that report various status information. It also polls network devices
for their current status and faults.
Accessing System Supervision Features
264
Configure
265
View Faults
267
Device Monitoring
269
Fault Descriptions
270
Relay Setup
271
IED Network Fault Numbering
274
263
Chapter 16: System Supervision
Accessing System Supervision Features
System Supervision is a feature of 590 Servers and as such, configuration for it can be found
associated with 590 Server devices in IED Enterprise. Options to view faults, setup relays, etc.,
become available when a 590 Server is selected, as shown in Figure 16-1.
Figure 16-1: Accessing System Supervision Controls
Each section below describes one of the System Supervision features shown: Configure, View Faults,
Device Monitoring, Fault Descriptions and Relay Setup.
264
Chapter 16: System Supervision
Configure
This icon opens a window that allows adjustment of the polling rate, response time-out, etc. of the
System Supervision background process. Usually, one does not have to tweak anything in this
window as System Supervision is automatically configured with optimal settings. And, in fact only
advanced users should access this area. Figure 16-2 shows a typical Configuration window.
Figure 16-2: Configuration Window
The Configuration window is divided into three subsections.
Note:
Unless there are serious network latency issues, the Polling and Registration
settings should not be altered from the defaults.
• The Polling section controls the rate at which devices are polled (Polling Timer Interval, which
is the overall clock for the background process), the maximum time to wait for a response
(Response Time-out), and the number of times to poll an unresponsive device before it is
declared as a fault (Poll Retries).
• The Registration section allows setting the interval at which all IED Devices are registered for
faults. IED Devices typically report faults to those clients that have registered for fault
notification. A device that is registered will report its faults immediately to the System
Supervision Service rather than wait for the next poll.
265
Chapter 16: System Supervision
• The SNMP section allows one to set up destinations to where the System Supervision Service
is to report SNMP Traps for each fault/clear condition that it encounters. These receiving
systems would be servers with third-party software such as a MIB Browser or SNMP Console.
Setting up and configuring these systems is beyond the scope of this document.
266
Chapter 16: System Supervision
View Faults
Double-click this icon to open up the Current Faults window that shows all the faults that are
currently in the system. Figure 3 shows an example window.
Figure 16-3: Current Faults Window Showing Faults In The System
At a glance, the grid shows the description of a fault, the first time it occurred, and for recurring
faults, the last time it occurred. Additional information about a fault can be viewed by selecting a
fault from the grid. This is shown in Figure 16-3 above via the light blue box below the second fault
listed. These details are typically useful for doing additional diagnosis or advanced troubleshooting
or to report to the manufacturer technical support personnel.
The Current Faults window only retrieves the current faults on startup and does not automatically
refresh the list on a timer, as it is a resource (and network) intensive operation. Clicking on the
Refresh button will update the grid with fresh data from the Service. To automatically update the grid
on a timer, simply check the Automatically refresh current fault list checkbox.
If System Supervision was installed to trigger relays on faults then the Viewer will also show the
number of relays that have been triggered due to fault conditions in the system. Hovering the mouse
over the Relays Triggered label will show the relays that are currently tripped, as shown in Figure
16-4.
267
Chapter 16: System Supervision
Figure 16-4: Relays That Are Currently Tripped Due To Fault Conditions
268
Chapter 16: System Supervision
Device Monitoring
This icon brings up the window (as shown in the example in Figure 16-5) that allows setting up how
devices are to be monitored by the Service, or if they are to be monitored at all. The grid in Figure 165 shows three columns which are quite self-explanatory. The last column determines the technology
to use to monitor the device selected in the grid. Typically, IED devices are monitored via IEDnet (an
IED proprietary technology), whereas non-IED devices are monitored (for network connectivity only)
via PING (ICMP protocol packets).
One should make selections in this grid appropriate to the types of devices and the supervision
requirements/needs of the system.
Figure 16-5: Sample Device Monitoring Setup Window
269
Chapter 16: System Supervision
Fault Descriptions
This window allows one to override the auto-generated fault descriptions produced by System
Supervision software. The droplist control can be used to select the device whose fault descriptions
are to be overridden.
Figure 16-6: Sample Fault Description Window
The grid underneath the droplist is where fault descriptions are associated with a fault type and
number pair. This is shown in Figure 16-6.
Setting up fault descriptions requires an understanding of the system as a whole and the IED fault
numbering system used. A list of fault types and fault numbers is included at the end of this
document, or one may use the details that appear in the Fault View pop-up. The actions available in
the grid on this window are:
• Add New Fault Description – Type into the blank line at the bottom of the grid.
• Edit a Fault Description – Simply click on the cell to edit (Fault Type, Fault Number or
Description) and edit the value in the grid.
• Delete a Fault Description – Click on a row and press the DEL key on the keyboard.
270
Chapter 16: System Supervision
Relay Setup
The Relay Setup window allows one to set up relays to trip when fault and clear conditions occur.
Figure 16-7 shows a typical Relay Setup window. The window has two parts. The top part allows
selection of a relay device, and the bottom part, grouped under the Relay Setup heading, allows
setting up individual relays on the frame.
One uses the Relay Frame droplist to select the relay device that is to be configured. The Frame
Address edit box allows one to edit the IED422 serial bus address of the relay frame. This option is
available only on an IED564 relay device, and is grayed out for other relay device types.
Under the Relay Setup section, the list box titled Available Relays allows one to pick and configure
individual relay outputs on the frame. Initially, all of the relays will have a red border and will be
labeled Unassigned. To setup up a relay, performs the following steps:
1. Check the checkbox labeled Relay is triggered by fault conditions.
2. Enter a meaningful description that is to be displayed in the status bar of the Current
Faults window (see Figure 16-4 above) when the relay is tripped due to a fault condition.
3. Make a section in the Activation droplist. The Activation droplist determines if the relay
is to be latched (i.e., stay activated), pulsate, or pulse only once, when it is triggered by a
new fault condition.
4. Optionally check the Reverse polarity checkbox. When not checked, relays are active
high and inactive low. Checking this option reverses the logic.
5. Set up fault triggers for this relay via the Trigger droplist. (See below.)
Figure 16-7: Relay Setup Window
271
Chapter 16: System Supervision
The Trigger droplist can be used to associate the types of fault condition that will trip each relay.
Making a droplist selection brings up additional edit controls, such as grids and a list of checkboxes.
The options for the Trigger droplist are:
• All System Faults (see Figure 16-7) – Trip the relay on any fault in the system. This would be a
“general fault” relay.
• Faults from Selected Devices (see Figure 16-8) – Trip the relay when there is any fault on a
selected device or devices. For example, to trigger a relay for any Titan amp frame, one would
select those devices in the device list that appears as in Figure 16-9.
Figure 16-8: Sample Faults From Selected Devices View (Titan Amps)
• Custom Trigger (Advanced Setup) (see Figure 16-9, Figure 16-10, and Figure 16-11) – Trip
the relay based on any permutation and combination of device, fault type and fault number.
This is an advanced option that requires some knowledge of the internal fault numbering
system, and so may require information from the IED to complete. But, this option will allow
setups like a relay for any mic station control communication fault, or any hardware failure
plus monitor/test deviations that affect certain zones (e.g., setting up one such relay per zone
or zone map in the system). The value in any column may be an asterisk (*) to mean any/all,
an individual value or a range of numbers (e.g., 1-5) as shown in the sample figures below.
272
Chapter 16: System Supervision
Figure 16-9: Sample Custom Triggers View (Any Mic Station)
Figure 16-10: Sample Custom Triggers View (Any Monitor/Test Fault)
Figure 16-11: Sample Custom Triggers View (Mixture)
273
Chapter 16: System Supervision
IED Network Fault Numbering
The table below shows the numbering system used for faults reported by IED devices/software.
These values may be needed by the system configurator when defining fault descriptions or fault
relays. The basic report is a two-byte entity consisting of a Fault Type byte and a Fault Number byte.
The only values shown are those for 510/520ACS systems and GLOBALcom vACS systems. Faults
for older 8000-based systems are not included in this table to avoid clutter.
Table 16-1: Fault Types and Fault Number Meanings
Type
2
4
Name
Mic Station Control Line Failure
Subsystem Card/Component
Failure
Fault Number Values
Mic Station Number *
Card/Component Number
ACS Systems:
Card Type (upper 3 bits)
0 – C Card, 1 – D Card, 2 – R Card, 4 – N Card
Card Slot/Number – lower 5 bits
Titan Frames
T9160 (IPAU):
224 – Amplifier Card 1 Fault
225 – Amplifier Card 2 Fault
226 – Amplifier Card 3 Fault
227 – Amplifier Card 4 Fault
228 – Amplifier Card 5 Fault
229 – Amplifier Card 6 Fault
230 – Amplifier Card 7 Fault
231 – Amplifier Card 8 Fault
232 – Amplifier Card 9 Fault
239 – Faulted Amplifier Not Backed Up
241 – Communication Fault AIO Unit 1
242 – Communication Fault AIO Unit 2
243 – Communication Fault MTC Unit 1
244 – Communication Fault MTC Unit 2
245 – Communication Fault LVIO Unit 1
246 – Communication Fault LVIO Unit 2
T90xxDSP (NDU):
241 – Communication Fault AIO Unit 1
242 – Communication Fault AIO Unit 2
243 – Communication Fault AIO Unit 3
244 – Communication Fault AIO Unit 4
245 – Communication Fault MTC Unit 1
274
Chapter 16: System Supervision
Type
Name
5
Subsystem environmental
9
Subsystem Failure
10
564 Fault
Fault Number Values
Titan T9160 (IPAU):
1 – Amplifier Card 1 Over Temperature
2 – Amplifier Card 2 Over Temperature
3 – Amplifier Card 3 Over Temperature
4 – Amplifier Card 4 Over Temperature
5 – Amplifier Card 5 Over Temperature
6 – Amplifier Card 6 Over Temperature
7 – Amplifier Card 7 Over Temperature
8 – Amplifier Card 8 Over Temperature
9 – Amplifier Card 9 Over Temperature
17 – Channel 1A Ground Fault
18 – Channel 1B Ground Fault
19 – Channel 2A Ground Fault
20 – Channel 2B Ground Fault
21 – Channel 3A Ground Fault
22 – Channel 3B Ground Fault
23 – Channel 4A Ground Fault
24 – Channel 4B Ground Fault
25 – Channel 5A Ground Fault
26 – Channel 5B Ground Fault
27 – Channel 6A Ground Fault
28 – Channel 6B Ground Fault
29 – Channel 7A Ground Fault
30 – Channel 7B Ground Fault
31 – Channel 8A Ground Fault
32 – Channel 8B Ground Fault
33 – Fan 1 Fault
34 – Fan 2 Fault
35 – Fan 3 Fault
36 – Fan 4 Fault
1 – Audio Controller (ACS)
10 – Communication Channel (Network)
14 – Backup CPU Failure*
48 – Relay Device Down (reported by fault logger)
100 – Device Off-line
110 – PING Failure
564 Frame Number
275
Chapter 16: System Supervision
Type
Name
14
Card Internal Fault
Fault Number Values
Titan
T9160 (IPAU):
240 – Fault Status on DSP Core
241 – Fault Status AIO Unit 1
242 – Fault Status AIO Unit 2
243 – Fault Status MTC Unit 1
244 – Fault Status MTC Unit 2
245 – Fault Status LVIO Unit 1
246 – Fault Status LVIO Unit 2 Titan
T90xxDSP (NDU):
240 – Fault Status on DSP Core
241 – Fault Status AIO Unit 1
242 – Fault Status AIO Unit 2
243 – Fault Status AIO Unit 3
244 – Fault Status AIO Unit 4
245 – Fault Status MTC Unit 1
Titan Frames:
0-239 – Warning Status on External Card at CAN Bus Address
give by Fault Number
240 – Warning Status on DSP Core
241-245 – Warning Status on Internal Card at CAN Bus Address
give by Fault Number
15
Card Warning
30
32
33
Wrong Mic Station Type
(Windows) 540 Fault
SNMP Trap generated faults
34
Monitored Services
60
LVIO Closure
276
Titan T9160 (IPAU):
241 – Warning Status AIO Unit 1
242 – Warning Status AIO Unit 2
243 – Warning Status MTC Unit 1
244 – Warning Status MTC Unit 2
245 – Warning Status LVIO Unit 1
246 – Warning Status LVIO Unit 2
Titan T90xxDSP (NDU):
241 – Warning Status AIO Unit 1
242 – Warning Status AIO Unit 2
243 – Warning Status AIO Unit 3
244 – Warning Status AIO Unit 4
245 – Warning Status MTC Unit 1
Mic Station Number*
540 Frame Number
SNMP Trap Number
1: Fault Log Fault Service
2: Fault Log E-mail Service
3: Fault Log Relay Service
4: Fault Log SNMP Service
5: Fault Log Service Monitoring Service
6-10: Reserved for future Fault Log Services
11-255: “Monitored“ Services
Input Number
Chapter 16: System Supervision
Type
65-80
Name
Mic Audible Fault for ACS
81-96
ACS Toolset Fault Report for ACS
System 1..16
Fault Number Values
Mic Station Number
1: Gateway Fault
2: 596 Fault
3: DOS 540 Fault (i.e., managed by Gateway)
Monitor Point Audible/20K Test
Fault (ACS Systems with Legacy
M/T, e.g., 596’s)
Combine Fault Type and Fault Number into word, then:
Bits 15: 1 (always - High Bit)
Bits 14: 0 for Audible Test, 1 for 20K Test
Bits 13-11: ACS Number (0-7 for ACS 1-8)**
Bits 10-6: 596 Frame Number (0-31 for Frames 1-32)
128-255
128-255
Monitor Point Test Fault (Titan
Systems)
Bits 5, 4: Point Letter (0-3 for A-D)
Bits 3-0: Point Number (0-15 for Points 1-16)
Combine Fault Type and Fault Number into word, then:
Bits 15: 1 (always - High Bit)
Bits 14-12: Sequence Number (0-7 for seq 1-8)
Bits 11-9: Test Setting Code (0-7 for code 1-8)
Bits 8-0: Point Number (1-511 for Points 1-511)
277
System Supervision
This page has been intentionally left blank.
278
17
VisDID Setup
There are two configuration files that reside on each DDC computer that determine how each display
attached to that computer will operate. The VisDID.xml file is used to configure the overall setup of the
attached displays. The MessageList.xml file is used to define the content that will be shown on each
display when a visual announcement is not taking place. The following sections describe the
configuration properties available in each file.
VisDID.xml
Sample File
Tag List
MessageList.xml
Sample File
Tag List
280
280
281
285
285
285
279
Chapter 17: VisDID Setup
VisDID.xml
This file is the main setup file for VisDID Immediate and VisDID Continuous applications that run on
the DDC (Display Driver Computer). It is typically located under C:\ied\vis\did\VisDID.xml. The file
can be edited with any text editor, but the structure of the file must be maintained.
Sample File
<vis_config>
<htmltimeout_msec>10000</htmltimeout_msec>
<blackouttime_msec>80000</blackouttime_msec>
<maxdhtmlwait_msec>60000</maxdhtmlwait_msec>
<screens>
<screen signid="1" zoneid="1" displayid="1">
<top>0</top>
<left>0</left>
<height>768</height>
<width>1024</width>
<images>
<image1path>c:\ied\vis\evacuateRight.gif</image1path>
<image2path>c:\ied\vis\test.gif</image2path>
<image3path/>
</images>
<continuous>
<halfscreen>false</halfscreen>
<stayontop>false</stayontop>
<hidemouse>true</hidemouse>
</continuous>
<immediate>
<halfscreen>false</halfscreen>
<stayontop>false</stayontop>
<scrollrate>2</scrollrate>
<timerinterval>3</timerinterval>
<compressratio>1.0</compressratio>
<justification>justCenter</justification>
<holdtimeperchar>0.1</holdtimeperchar>
<hidewhendone>true</hidewhendone>
<hidemouse>true</hidemouse>
<color val="$000000"/>
<defaults>
<cellholdtime>120</cellholdtime>
<linesperpage>4</linesperpage>
<backcolor val="$000000"/>
<font>
Arial Unicode MS
<color val="$FFFF00"/>
</font>
<directories>
<image>C:\IED\VIS\Images</image>
<file>C:\IED\VIS\files</file>
</directories>
</defaults>
</immediate>
</screen>
</screens>
<colors>
<color id="5" val="$FFFF00"/>
</colors>
</vis_config>
280
Chapter 17: VisDID Setup
Tag List
The following is a list of all tags present in the VisDID.xml file, with explanations and possible
values for all elements and attributes. The outline tree structure will mirror the tree structure of
the file.
All tags "<...>" need to have a matching closing tag "</...>" or be closed themselves "<.../>"
in a rigid tree structure. (i.e. <x><y>some value</y><z>some value</z></x>)
Tag
Definition
<vis_config>
Root level node for the entire document
<htmltimeout_msec>
Amount of time that the applications are to
wait before abandoning an HTML request
<blackouttime_msec>
Amount of time with continuous errors the
screen will wait before showing a black
page.
<maxdhtmlwait_msec>
Amount of time with continuous errors the
screen will wait before refreshing itself
<screens>
<screen>
List container for all screens (up to four)
Attribute ”signid”, ”zoneid”, ”displayid” :
Together, unique identifier for each VisDID
screen in the system. To get your sign or
zone id you need to find the sign zone you
are working on in the zone viewer in
Enterprise. Open the Zone Type Specific
tab make sure the Use Alternate Zone
Number checkbox is checked. The value in
the External Zone Number field is the
zoneid the DDC should use. Sign id is
used to differentiate between different
physical displays attached to the DDC.
Display id is used for serial control of the
monitor.
Value
Integer representing the number of
milliseconds. (1000milliseconds =
1second)
Integer representing the number of
milliseconds. (1000milliseconds =
1second)
Integer representing the number of
milliseconds. (1000milliseconds =
1second)
signid zoneid -
displayid -
If multiple screens are present on a DDC, there will
be multiple ”screen” nodes side by side.
<top>
The y-axis value of the top edge of the
VisDID display screen.
Integer representing the location in
pixels
The x-axis value of the left edge of the VisDID
display screen.
<left>
<height>
<width>
Note: When using multiple monitors on
one DDC, the subsequent screens will
usually have an offset value in the <left>
coordinate. For example, the <left>
value for screen 2 will be the <width> of
screen 1.
The size of the VisDID display screen
across the y-axis
The size of the VisDID display screen
across the x-axis
Integer representing the location in
pixels
Positive integer representing the
height as the number of pixels
Positive integer representing the
width as the number of pixels
281
Chapter 17: VisDID Setup
Tag
<images>
Definition
Value
A list container for ad-hoc image slots (up
to 8). These may be used for system
emergency/evacuation conditions and
directions, for example.
The fully qualified windows path for the image to be
used in this particular slot
<imageXpath>\
(where x = 1-8)
<continuous>
<halfscreen>
Allow VisDID Continuous to fill only half
of the defined screen.
true - fill half screen
<stayontop>
Control VisDID Continuous' ”on top”
status in relation to other applications.
true - stay on top
<hidemouse>
Indicate whether VisDID Continuous
should hide the mouse cursor.
true - mouse cursor will be hidden
<immediate>
Container for all VisDID Immediate
specific setup information.
<halfscreen>
Allow VisDID Immediate to fill only half of
the defined screen.
<stayontop>
<scrollrate>
<timerinterval>
<compressratio>
282
Example:.In a typical installation, each
DDC will be configured with 2 emergency
evacuation messages, one which displays
an evacuation arrow for fire, and one for
tornados (e.g., seek shelter condition). In
this case, <image1path> would be
populated with the path for the fire
evacuation image, while <image2path>
would be populated with the path for the
tornado evacuation image.
Container for all VisDID Continuous
specific setup information
Control VisDID Immediate's ”on top”
status in relation to other applications.
VisDID Immediate always resides on top
of VisDID Continuous.
integer representing the number of pixels
the screen is to scroll during each timer
interval (see below)
integer representing the number of
milliseconds to wait between each
scrolling shift operation.
Floating point representing the aspect
ratio of the screen (i.e. a stretch ratio). 1.0
means no stretching
false - fill whole screen
false - do not stay on top
false - mouse cursor will be visible
true - fill half screen
false - fill whole screen
true - stay on top
false - do not stay on top
Chapter 17: VisDID Setup
Tag
Definition
Value
justCenter - scrolling text will be
centered
<justification>
string representing the (default)
justification scheme to apply to the
scrolling text
justRight - scrolling text will be
aligned with the left border of the
screen
justLeft - scrolling text will be
aligned with the right border of the
screen
<holdtimeperchar>
<hidewhendone>
<hidemouse>
<color>
<defaults>
<cellholdtime>
<linesperpage>
<backcolor>
<font>
<color>
<directories>
<image>
<file>
<colors>
Floating point representing the default
number of seconds to hold a line on the
screen if no timer information is given.
(e.g. if the holdtimeperchar is set to 0.1
and a single line of an untimed message is
30 characters long, that particular line will
stay on screen for 3.0 seconds)
Set VisDID Immediate to return to the
background once message playback is
complete.
Indicate whether or not VisDID Immediate
should hide the mouse cursor while
playing a message.
”val” : Blue/Green/Red Hexadecimal
representation of the color to use for the
background of VisDID Immediate
Messages (e.g. ”$FF0000” represents the
color Blue {blue = 255, green = 0, red
= 0})
Container list for all default values in
VisDID Immediate
Default time to hold a block of text on
screen if no other timing information is
provided. Provided in 60ths of a second.
Number of lines to fit on the screen for
immediate messages. Text is scaled
appropriately.
Blue/Green/Red Hexadecimal color
representation for the background color.
Name of font family to use
”val”: Blue/Green/Red Hexadecimal color
representation for the font color
Container node for Prizm Content
Delivery settings
The default directory where images will be
stored locally
The default directory where Prizm Content
Manager will be stored locally.
Container node for colors list (mapping of
simple color numbers like 1, 2, 3 to RGB
values).
true - will not remain visible
false - will remain visible
true - mouse cursor will be hidden
false - mouse cursor will be visible
283
Chapter 17: VisDID Setup
Tag
<color>
284
Definition
”id”: The index in the color list of this
color
”val”: Blue/Green/Red Hexadecimal color
representation of this color.
Value
Chapter 17: VisDID Setup
MessageList.xml
This is the content specification file for VisDID Continuous. It is generally located at c:\ied\vis\did.
The file can be edited with any text editor, but the structure of the file must be maintained.
Sample File
<messagelist>
<screen signid="1" zoneid="1">
<message id="1" format="HTML" count="0" priority="6" holdtime="0" refreshrate="3"restart="false">
http://vernon/prizmcm/playcontent.asp
</message>
</screen>
</messagelist>
Tag List
The following is a list of all tags present in the MessageList.xml file, with explanations and
possible values for all elements and attributes. The outline tree structure will mirror the tree
structure of the file.
All tags "<...>" need to have a matching closing tag "</...>" or be closed themselves "<.../>"
in a rigid tree structure. (i.e. <x><y>some value</y><z>some value</z></x>)
Tag
<messagelist>
Definition
Value
Root level node for messagelist.xml
document
signid - Integer representing the
sign ID.
<screen>
Defines a single screen in the system.
If there are multiple screens, there will
be multiple tags.
zoneid - Integer representing the
zone ID.
Together, uniquely identify a screen.
Zoneid maps to the zone in the
Announcement Controller (or
external zone). Signid is useful for
differentiating physical DDC
devices.
285
Chapter 17: VisDID Setup
Tag
Definition
Value
id - Unique identifier for messages
on this DDC.
format - Defines what type of
content this message contains.
Possible values are HTML and File.
File extensions supported if File
format is selected:
Mpg, mpeg, Wmv, Avi, Mov, Mp4,
Jpg, jpeg, Gif, Bmp, png, Swf
<message>
Defines a specific message for VisDID
Continuous. Each message is a
content screen that will be displayed
for a certain amount of time before
moving to the next. If there are
multiple messages, there will be
multiple instances of this node.
count - The number of times this
message is to play before moving
on to the next.
priority - Not currently used.
holdtime - The amount of time this
particular message will stay on the
screen in VisDID Continuous.
Measured in 60ths of a second.
refreshrate - The amount of time
VisDID Continuous should wait in
between refreshes of this message.
Any differences in the new HTML
document are seamlessly merged
so no flicker is noticed. Measured
in seconds.
restart - Not currently used.
URL to content resource whether it
be an HTML page or media file.
Innovative Electronic Designs, LLC
9701 Taylorsville Road
Louisville, KY 40299
United States of America
www.iedaudio.com
286
Chapter 17: VisDID Setup
287
VisDID Setup
This page has been intentionally left blank.
288