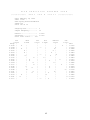
1
Larson Systems Inc. Panther Gage User Manual Version 4.1.X Table of Contents WHAT’S NEW IN VERSION 4.1 1 OVERVIEW 3 FRONT PANEL OPERATION 4 MAIN MENU 6 SPECS (SPECIFICATIONS) 7 GAGE 9 SHUTDOWN 23 SPC 26 PRINT 33 BATCH COUNTER 35 OUTPUT SEQUENCER 39 MAINTENANCE MENU 42 ENTERING NUMBERS ON THE PANTHER 47 ENTERING TEXT ON THE PANTHER 48 220VAC POWER INPUT OPTION 49 BACK PANEL CONNECTIONS 50 24 VDC OUTPUT INSTRUCTIONS 51 EXTERNAL PROGRAMMING 52 PLAIN TALK ABOUT SPC 56 ACCESSORIES 59 PRINTOUT EXAMPLES 61 INSTALLATION 65 MAINTENANCE - INSIDE THE PANTHER 73 MOUNTING THE PANTHER ON A CONTROL ARM 75 SPECIFICATIONS 76 WARRANTY 79 What’s New in Version 4.1 Lion Precision’s goal is to be responsive to our customer’s desires and needs. Version 4.1 has incorporated some of the excellent suggestions we have had from those who currently use the Panther. They know better than anyone how to make a gage that is useful and easy to use. UltraCal Probe Setup Option (4.1.5) A new probe setup option, UltraCal, provides extremely accurate measurement of springs that use to be difficult to measure. More Sort Time Options (4.1.5) The Sort Time can now be adjusted to a maximum of 9.95 seconds, and can be adjusted in steps of 0.05 seconds for more precise control. Two-Way Sort Options (4.1.5) A new two-way sorting option has been added. Springs can be sorted into good and bad bins even with a three-way sorting chute. In addition, the two-way mode can be set to sort on good or sort on bad. This enables air sorting to blow out good springs instead of blowing out bad springs. Adjustable Five-Way Sort Points (4.1.5) Five-sorting is now adjustable. The five-way points can be set as a percentage of tolerance. Previously they were fixed at 33%. More Versatile Length Display (4.1.5) The Panther will now display lengths as absolute (i.e. 1.134") or relative (i.e. –0.0034"). Lengths for SPC or printouts will still be in absolute measurements. Only the screen display has the relative option. The Panther will also measure and display lengths in excess of 10". With lengths greater than 10", the resolution is reduced to three decimal places (10.xxx") instead of the usual four decimal places (9.xxxx"). Higher CPK display (4.1.5) The Panther Gage will now display and print CPKs greater than 10. Length Display with Strip Chart (4.1.5) The strip chart display screen now includes an option listing the last length and good and bad counts. 1 Trigger Secondary Operations (4.1.5) The Panther can be programmed to trigger a relay or other external device to start secondary operations. The trigger will fire on operator specified spring counts and the duration of the output activation is programmable in tenths of a second. Batch Counter (4.1.6) The Panther can be set up to count parts up to a predetermined size into each of the attached sorting chutes. This allows for multiple batches of parts to be created at once. Bad parts can also be sorted out allowing for only good parts in a batch. Output Sequencer (4.1.6) The Panther can be set up to let parts go through the sorting chutes in any predetermined order instead of a simple Bad Hi/Good/Bad Low sort. Bad parts can also be sorted out. 2 Overview The Lion Precision Panther Precision Spring Gage combines ease of use, an easy-to-read display and state of the art length control with the proven reliability and accuracy of “Lion Gages.” Lion Precision was the original designer of non-contact spring length systems and we’ve been providing spring gages for over thirty years. The Panther Gage continues the Lion Precision tradition of innovative, powerful and flexible systems for the spring manufacturing industry. The Panther Gage System includes a computer based control unit that provides on screen SPC analysis of free length measurements. A simple menu driven approach means the operator can quickly and easily operate the gage; even a first time user. Additional features of the Panther Gage: • 2-Way, 3-Way and 5-Way sort capability • Monitor up to 70,000 springs per hour • On screen or printed SPC charts, with your company name and optional customer information on print outs • Works with all older model accessory systems: chutes, pitch controllers, etc. The Panther Gage includes a temperature stable probe that is completely interchangeable with all other Panther Gages. The advanced design of the probe virtually eliminates drift from set-up points, a concern of older model gages. You’ll find this instruction manual is easy to read and understand, with examples of the screens and equipment. The engineers and support staff at Lion Precision have always believed it is important for our customers to understand and be comfortable with Lion Precision gages. That is why we try to avoid using jargon or obscure technical terms, and present information in a manner that is easy to understand. We figure the more our customers know about gaging, the better we look. And if something isn’t clear in the manual, we hope you’ll call us immediately. 3 Front Panel Operation Operating the Panther is like operating an Automatic Teller Machine only easier; the Panther has less buttons! It's as easy as pressing the button that best describes what you want to do. Most operations are only two or three button presses away from any other screen. ‘Soft’ Keys 1-6 English German French Spanish MAIN MENU Button (7) TEST Button & Read Light (8) Adjust Motor Actuators (9, 10) Italian Sort Indicator (11) Power Switch Front Panel Controls ‘Soft’ Keys 1 - 6 The function of these keys is different on every screen. Their function is indicated on the last line or two of the display. These keys also select the display and printout language. To change languages hold down the appropriate key while turning on the power switch. The picture above shows which key corresponds to which language. 4 Main Menu (7) This button will return the display to either the MAIN MENU or MAIN MENU 2 from most any other screen. Some screens, like SHUTDOWN, must be exited before this button will function. Test Button and Read Light (8) Pressing this button will start a read cycle as if the read switch had been activated during coiling. Three things will turn on the read light: • The Test button is down • The read switch is activated • A read is triggered through the CNC connector This light is on as long as the read switch is activated. If the magnet stops over the read switch the light will stay on. This is an easy test for the read switch. If the light is on and the magnet is not over the read switch then the read switch is probably bad. This also makes it easier to set the position of the magnet and the read switch. Adjuster Motor Actuators (9, 10) Pressing either of these buttons will immediately cause the adjuster motor to turn. Each button turns the motor a different direction. The actual direction depends on the switch on the adjuster motor. These buttons will function at all times. They are never disabled. The lights indicate when the length adjust function is turning the motor. They remain on as long as the motor is in motion. Sort Indicator (11) OK The sort indicator shows sorting activity. These lights can turn red or green. The red light is activated for a bad part. A red left light indicates a short part and a red right light indicates a long part. If no lights are on then the part is good. If five way sorting is enabled the lights will light green if a good part is presorted. A green left light indicates a short good part. A green right light a long good part. When the five way sort option is selected, the lights still light red for bad parts. 5 Main Menu M SPECS GAGE M BATCH COUNTER A I N M SHUTDN A I N E N SPC M E N U PRINT U 2 OUTPUT SEQUENCE The MAIN MENU and MAIN MENU 2 are the heart of the system. From here the operator can branch out to any of the Panther functions. The MAIN MENU button (7) will return the operator to either MAIN MENU from anywhere else in the system. This can be used as a panic button in case the operator ever feels lost. The MAIN MENU gives six different selections for operation. They are listed on the following pages with explanations. 6 MORE MORE Specs (Specifications) S p e c i f i c a t i o n s Nominal Length: 1.0000 Tolerance: ±.0100 Inches MORE INCH/MM CHANGE LENGTH CHANGE TOL BACK This is where all the spring and job specifications are entered. The NOMINAL SPRING LENGTH and TOLERANCE are entered in the basic screen shown above. In the MORE screen shown below, CUSTOMER NAME, PART NUMBER, and a COMMENT can be entered. Inch/mm Pressing this button will toggle back and forth between units of inches and mm. The entered numbers will not change; only the listed units. No conversion will be performed on existing spring length data. Therefore changing the units will reset all counts to zero (after an operator warning). For numeric entry see Entering Numbers on the PANTHER, page 41. Change Length This button will activate the number entry screen. For numeric entry see Entering Numbers on the Panther, page 47. Enter the desired length for the spring being produced. Change Tolerance This button will activate the number entry screen to enter the spring length tolerance. NOTE: The SPC Histogram X- Axis is calculated when the first spring is measured. An increase in tolerance of over 20% would cause the tolerance points to be off the edge of the histogram. To recalculate the Histogram X-Axis the spring counts must be reset to 0. 7 Spring length tolerance can be changed at any time without setting up the probe again! If the tolerance change is over 20-30%, it is recommended the probe be re-setup to maintain maximum accuracy. More S p e c i f i c a t i o n s Cust: This is the customer field P/ N: Th is i s th e pa rt n um be r Comment: This is the current comment CHANGE CHANGE CUST P/N CHANGE COMM BACK Pressing the MORE button will pull up page 2 of the SPECS SCREEN. This CUSTOMER NAME, PART NUMBER, and COMMENT can be entered. This is where information is printed on reports generated by the gage. This is all optional. To keep things simple the operator need never enter this screen. Selecting any of these will activate the text entry screen. See Entering Text on the PANTHER page 48. Change Customer Press this button to enter a new CUSTOMER NAME. Change Part Number Press this button to enter a new PART NUMBER. Change Comment Press this button to enter a new COMMENT. 8 Customer Name, Part Number and Comment are printed on reports for easy identification. Gage Length: 1.00 00 ± .00 50 Good:53012 Long:1245 Recent Mean:1.0004 PROBE STRIP Last: 1.00 62 Short:1053 CPK:1.1029 SORT ADJUST Rate:17524 RESET BACK This is one of the screens most likely to be displayed by the operator while coiling. It displays the following: • Length Specifications: As entered by the operator • Length of the Last Spring Produced; absolute or relative • Good Spring Count: The number of good springs since the counts were reset • Long Spring Count: The number of long springs since the counts were reset • Short Spring Count: The number of short springs since the counts were reset • Recent Mean: Mean of the Last fifty springs produced • Recent CPK: CPK of the Last fifty springs produced • Spring Production Rate in Springs per Hour: Based on the last ten springs From here the following functions are available: • Probe Setup • Strip Chart Display • Sort Mode and Timing Selection • Adjustment Type and Amount Selection • Count Resetting 9 Probe (Probe Setup) P R O B E S E T U P Spring Length : 1.0000 ±.0100 XX XX ULTRA SHORT ZERO LONG MMA OFF DONE This screen is used to setup the probe. The entered specs for SPRING LENGTH and are displayed across the top. In the center is a box with a “needle” and an arrow marking the center. This box functions like the meter on a traditional style gage. In the center is a ZERO button for zeroing the probe. The SHORT and LONG buttons will not activate until the probe has been zeroed. If the DONE button is pressed before the probe is zeroed, there will be no changes in the current probe setup. The MMA display indicates if the Maximized Measurement Accuracy is on or off. To turn MMA on or off, go to the MAINTENANCE screen and press MMA. See Maximized Measurement Accuracy section below for an explanation of MMA. TOLERANCE Ultra is selected for a high-performance probe calibration on difficult to measure springs (small, short springs). Don’t use UltraCal until you have read the UltraCal instructions completely. Remember these important points when performing a probe setup: • The probe shipped with the Panther has a built in heater to stop temperature drift. For this reason a two minute warm up time after power up is required before probe setup. • Be sure to move the probe the same amount as the tolerance listed at the top of the screen. • The Panther will remember the probe setup. If power is turned off, the probe will automatically be setup when power is turned back on (wait for warm up). • For each of the steps in probe setup, a double beep will sound when that step is successful. If any particular step fails or is setup incorrectly, a triple beep will sound. 10 While the setup screen is displayed the read switch is disabled. To setup the probe: 1. Wind a spring to cutoff. 2. Position the probe tip 0.050" to 0.500" (1mm to 20mm) from the spring end. This distance depends on the diameter of the spring and tip, and the tolerance that will be set for sorting. Larger diameters and larger tolerances can use larger initial gaps. 3. Press the ZERO button. 4. Wait for the “needle” to move to the center under the arrow and the LONG and SHORT button indicators to turn on. Two beeps will sound when complete. 5. Now move the probe to one of the sort points. Be sure to move the probe the same amount as the tolerance listed at the top of the screen! 6. It is recommended that the needle move about half way when setting up. Try to avoid setting up with the needle under the XX indicators if possible. 7. Press the LONG or SHORT button. 8. The display will flash OVER SET or UNDER SET twice. Two beeps will sound to confirm the point is set. 9. Now move the probe to the other sort point. 10. Press the LONG or SHORT button. 11. The display will flash OVER SET or UNDER SET twice. Two beeps will sound to confirm the point is set ( if the beeper is enabled ). 12. Press the DONE button. Selection of Probe Tips The diameter of the probe tip should be equal to or slightly greater than the diameter of the spring being monitored. If the probe tip is too large, problems may arise with short springs. Adjustment of the gage may be difficult or impossible. A probe tip that is too small may have to be positioned off-center to be effective. Short springs may require the use of a guarded probe tip. Probe tips are available in diameters up to 2 inches. 11 UltraCal U L T R A C A L Spring Length : 1.0000 ±.0100 XX XX SHORT NOMINA L LONG 48% MMA OFF DONE UltraCal is an additional probe setup option that removes measurement errors created by proximity of the coiler on shorter springs. The UltraCal probe setup is optional. For most springs, the traditional probe setup can be used using the traditional procedure. Be sure to read the warnings below before using UltraCal. To use UltraCal 1. Perform a normal probe setup as described above but do not press DONE. 2. Return the probe to the zero position. 3. Press the Ultra button on the far left of the Probe Setup Screen. 4. Cutoff the setup spring and continue advancing the coiler until the cutter has returned to the same position it was in when the Zero, Long and Short points were set during probe setup. 5. Press the Nominal button. 6. Move the probe to the Long and Short sort points and press Long and Short accordingly (just like regular probe setup but without the spring present). 7. Return the probe to the zero position. 8. Press DONE The percentage shown on the screen is the amount of correction that is being applied. If the number is less than 10%, UltraCal is unnecessary. If the number is over 95%, accurate spring measurement is unlikely under any circumstances with any gage. If it is over 99%, UltraCal will automatically be disabled. 12 The Ultracal probe setup is optional. For most springs, the traditional probe setup is sufficient. UltraCal Warnings In normal setup, small length changes in short springs are lost in all the background metal of the coiler. To read these springs accurately, the signal from the probe must be amplified. As this happens, that range of the probe increases, making it sensitive to changes further away than usual. This is only a part of what UltraCal does, but it is this fact that requires that UltraCal be used carefully. As the percentage of correction displayed on the UltraCal screen increases, so do these factors: • Sensitivity to other objects around the spring • Sensitivity to the operator’s hand catching springs • Temperature Drift With a normal setup, the effective measurement area of the probe is near the tip. Other Objects It is important that any objects in the area of the spring (tooling, sorting devices etc.) be in the exact same position and location when the gage is triggered by the read switch, as they are during UltraCal setup. In normal setup, the probe only senses objects within about one or two inches of the tip. With a high-percentage UltraCal setup, this can increase as high as twelve inches. Operator’s Hand With high-precentage UltraCal, the effective measurement area of the probe can be much larger, up to twelve inches. At high-percentage UltraCal setups, the operator’s hand can be sensed as far as a foot from the tip. When catching springs for testing, keep hands far from the tip. This can be tested after setup: After UltraCal setup, wind out a spring as if you were doing a setup. Go to MAINT > TESTS > PROBE. This screen shows real-time length measurements. Move your hand toward the spring and note at which point the length measurement begins to change. You don’t have to run the coiler or press the green button. Temperature Drift The amplified probe signal will also amplify any temperature related errors. The temperature drift of the Panther probe is nearly non-existent with a normal setup. With a high-percentage UltraCal, the temperature drift of the probe, while still small, may become a factor in tight tolerance springs. Other temperature factors such as expansion of tooling, probe holder and even spring wire can also affect the final result. With high-percentage UltraCal setups, actual spring length should be monitored to adjust for any temperature related drift. 13 NIST Traceable Calibration Non-contact free-length measurements are completely dependent on the size, type, and shape of the spring being measured. For this reason the gaging system cannot be calibrated for absolute measurements. It must be calibrated for each individual setup. Calibrating according to these instructions will provide an accurate, NIST traceable calibration for each setup. Required Equipment: Mechanical gage calibrated to NIST (micrometer, caliper, etc.). Calibration process: 1. Wind a spring to cutoff. 2. Position the probe tip 0.050" to 0.500" (1mm to 20mm) from the spring end. 3. Zero the probe. Two beeps indicate successful zeroing. 4. Set the sort points on the gage. (See above setup instructions) . On the Panther, be sure to move the probe the same amount as the tolerance listed at the top of the setup screen! 5. Press the DONE button. 6. Return micrometer to zero position before starting production. 7. Cutoff the setup spring. 8. Measure the free length of the setup spring with a NIST calibrated device. 9. If the free length is different than desired (different than nominal setting on Panther gage) then adjust the gage probe micrometer equal to the amount of deviation of the setup spring. If the spring is too short, move the probe micrometer away from the coiler. If the spring is too long, move the probe micrometer toward the coiler. 10. Start spring production. 11. Catch and measure a spring that the gage indicates is of nominal length (keep hands at least 4" away while catching springs). 12. If the free length measured with the NIST traceable device is different than the gage reading, readjust the probe micrometer. 13. Repeat steps 13 & 14 until NIST traceable device and gage reading are equal. This provides a NIST traceable calibration of the spring gage setup. 14 Maximized Measurement Accuracy (MMA) Occasionally, vibration or other factors can diminish the accuracy of spring measurement. MMA provides a technique to restore this accuracy. Spring gages use an average of many measurements to calculate the length of each spring. This removes vibration and error from the reading. The more measurements that are taken, and the longer the time over which they’re taken, the more accurate the reading. The problem is, there are many disadvantages to taking lots of measurements over a long time, such as: • The gage runs the risk of continuing to measure after the spring has been cutoff. • Read switch placement becomes very critical. • The maximum production speed is reduced. The Lion Precision MMA system automatically determines the maximum amount of time and number of samples to provide the maximum measurement accuracy. MMA can be turned on or off in the MAINTENANCE screen. Disabling the Gage The read switch is disabled during probe setup. If an operator wants to disable the read switch during coiler setup there are three options: • Hold down the blue MAIN MENU button and press Soft Key 1 (the left most gray key). The gage will flash GAGING DISABLED and ignore any read switch triggers. Pressing any gray key will return the gage to normal operation. • Enter the PROBE SETUP screen. The probe setup will not be affected if the zero button is never pressed. • Turn off the gage. All job and setup information, including probe setup, is remembered while power is off and will be restored when power is turned on. 15 MMA can cause small springs that are sorted by an air blast to be missed and should not be used in this type of job. Strip Sort Points Adjust Average 24 Nominal NEXT + TYPE - OK Strip Chart with Average Adjust Display The strip chart gives the best “at a glance” picture of the coiling process. It displays one point for each spring produced. The line across the middle represents the nominal spring length. The lines at the top and bottom represent the sort points. Any points outside these lines are sorted. The strip charts show the last fifty springs. Adjust Each @0.0050 24 ← NEXT TYPE ← + - OK Strip Chart with Each Adjust Display 0.9937 Good 55241 Bad 150 OK NEXT Strip Chart with Length and Counts Display 16 1.0100 1.0000 0.9900 OK NEXT Strip Chart with Length Specifications Display OK NEXT Strip Chart with Histogram Changing Display Mode (NEXT) This button changes the strip chart display mode. Type In the adjust display mode, this button will change the type of adjustment. See the Adjustment section, page 21 for information on selecting an adjustment mode. Changing the Amount ( + - ) Pressing the + or - buttons will increase or decrease the amount of adjustment. In the EACH mode, these buttons can also change the trip point. Changing the Each Mode Trip Point ( ← ) In the EACH adjustment mode, pressing this key will move the ← indicator between the adjust amount and the trip point value. Whichever value is being pointed at will change when the + or - buttons are pressed. The trip point will be indicated by a dotted line on the strip chart. 17 Sort S o r t F u n c t i o n Mode: 3 Way CHANGE MODE CHANGE + Time: TIME - 0.6 Se co nd s 2ND OP DONE This screen displays the current SORT MODE and SORT TIME and provides an option for triggering secondary operations. There are four sort modes available on the Panther: • 2 Way Sort Bad • 2 Way Sort Good • 3 Way • 5 Way 2 Way sorting divides springs into good and bad (outside of tolerance). 2 Way Sort Bad will activate the sorter on bad springs. 2 Way Sort Good will activate the sorter on good springs. 3 Way sorting is the traditional method of sorting where the shorts and longs are separated to opposite sides and the good springs fall straight through the center. 5 Way sorting separates the reject longs and reject shorts the same way but divides the good springs into three divisions; long good, medium good, and short good. The five-way points are selectable as a percentage of the tolerance. For five way sorting the Panther must be connected to a five way sorting chute. Timed sorting is the traditional method where the chute flapper or air solenoid is activated for a set period of time when a bad spring is produced. The Panther is capable of setting a sorting flap to activate between 0.05 to 9.95 seconds. Non-Release sorting can be useful in circumstances where the same flapper is continuously activated in multiple succession. In Non-Release mode, an activated flapper stays open for up to 10 seconds until another condition activates another flap. Setting the Panther sorting time to zero activates this feature. Change Mode Pressing this button will change the current sorting mode. Each time the button is pressed it will move to the next mode. Holding the button down will automatically cycle through the different modes. The sort mode is immediately changed when a new mode is selected. 18 Change Time Pressing the + or - buttons will change the sort time by 0.1 seconds. Holding the button down will continue to change the time. The minimum is 0.1 seconds and the maximum is 2.0 seconds. Changing time has no effect in non-release mode. Change % Pressing this button allows the operator to change to five way sort points. For example, if set to 25, then the five way sorting chute would activate to segregate springs that exceed 25% of tolerance. (Only available in five way sort mode). 2ND OP SECONDARY OPERATION SETUP Status OFF ON/OFF Interval 100 CHANGE INT CHANGE DEL Delay 0.5 Duration 2.0 CHANGE DUR BACK Secondary Operation will activate a relay, motor, or other electrical device according to operator specified parameters. This can be used to fire an air solenoid to blow accumulation from the probe tip, advance and indexing station, or start another secondary operation. Use Lion Precision Secondary Operation cable (P015-2960) to connect to the gage through the five way sort connector on the rear panel. Secondary Operation and five way sorting cannot be used simultaneously. Status Status is simply whether the secondary operation is enabled or not. The secondary operation function uses the five way sort outputs so it cannot be used with five way sorting. If secondary operation is enabled, five way sorting is automatically disabled. Interval This is the number of springs between secondary operation triggers. Can be from 1 to 99,999. Delay This is the time in seconds to delay after the interval has passed before activating the secondary operation. This allows the final spring to drop into position, if necessary, for any secondary operations. It can be set from 0.00 to 9.99 seconds. 19 When the secondary operation activates, both of the green sorting indicators will light on the front panel. Duration This is the time is seconds to hold the secondary operation active. It can be from 0.01 to 9.99 seconds. Adjust L E N G T H Adjust Type: A D J U S T Centering Adjust Amount: 22 CHANGE TYPE +AMOUNT- BACK L E N G T H Adjust Type: A D J U S T Average Adjust Amount: 22 CHANGE TYPE +AMOUNT- BACK L E N G T H Adjust Type: A D J U S T Each @ .0025 Adjust Amount: 22 CHANGE TYPE +AMOUNT- TRIP POINT + - BACK This screen displays the current length adjust type and amount. The amount sets how long the motor will turn when activated. Four adjust types are available (including none). Adjust Types Each EACH mode makes an adjustment each time a spring is produced that exceeds the TRIP POINT. The TRIP POINT can be adjusted from 5% to 150% of the tolerance. The TRIP POINT buttons and value are only displayed when EACH mode is selected. The ADJUST AMOUNT sets the amount of time the motor turns. 20 Centering CENTERING makes adjustments to the coiling process based on the average length of recent springs. The amount of time the motor will turn depends on two things: • The adjust amount setting • How much error there is in the average length. The more error in the average length, the longer the motor turns. The operator sets the adjust amount so the process is corrected quickly, but without over controlling (see selecting adjust amount below). Average In version 4.0x, AVERAGE mode has been significantly modified to use a length predicting system to actually anticipate the length of the spring being produced. The amount of adjustment is based on this calculation and the adjust amount setting. None Using no control is valuable in evaluating the quality of the setup. If there is a problem in the setup that should be corrected, length adjusting can cover it up. For maximum yield the setup and wire should be as good as possible without length adjusting. Length adjustment is designed to adjust for natural variances in the process, not bad setup or bad wire. Change Type Pressing this button will change the adjust type. Holding the button down will cycle through the adjust types automatically. Amount Pressing the + or - will change the adjust amount by 1. Higher numbers turn the motor longer. 99 is the highest. A setting of 0 will turn off length control. Trip Point These buttons are only active when EACH type is selected. Pressing + or - will change the trip point. This sets the point at which the adjuster will turn. When a spring exceeds the trip point the adjuster will be activated. Selecting an Adjust Type and Amount The best adjust type and amount to use depends on the wire and setup of a particular job. The best way to find the best choice is simple experimentation. Go to the strip chart display and try different types of adjustment. Use the strip charts to see how the process is running. On some jobs, all the types may work about the same; on other jobs one type may be much better than the others. 21 Reset ! ! W A R N I N G ! ! This will reset all counts to 0! All current SPC data will be lost! Reset counts? YES NO Pressing this button will reset the good and bad spring counters to 0. Resetting the counts to 0 will set the SPC sample count to 0 and therefore all the SPC charting for the job to this point will be lost. Before it does so it will ask the operator if they’re sure they want to do this. 22 Shutdown S H U T D O W N Lot Size: 120000 Consecutive Bad: 10 Count: CHANGE CHANGE LOT BAD S E T U P CPK: 0.0062 No Cutoff:ON 2 Ex ce ss A dj us t: WA RN NO EXCESS CHANGE CUTOFF ADJUST CPK BACK The Panther has the ability to shutdown the coiler under certain conditions. To use the shutdown function the coiler must be connected to the gage with an automatic shutdown cable (P/N B013-8250). See Installing a Shutdown Cable page 68 for shutdown cable installation instructions. There are five different shutdown conditions. Entering a value of 0 can turn off each one of these, or any combination of them can work at the same time. The five types are: Lot Size LOT SIZE will shutdown the coiler when this number of good springs has been produced. Consecutive Bad (with current count display) CONSECUTIVE BAD will shutdown the coiler when this many bad springs are produced in a row. The COUNT display shows the current count of consecutive bad springs. This is helpful in determining the amount of consecutive bad springs typical for the job. No Cutoff NO CUTOFF, when ON, will shutdown the coiler the instant a non-cutoff spring contacts the probe tip. A spring contacting the tip after cutoff will not cause a shutdown. CPK If the Recent CPK ( CPK of the last 50 springs) falls below this amount, the coiler will be shutdown. This should be set somewhat lower than the Recent CPK on the GAGE SCREEN when the process is running normally. It may take some experimenting to determine the best value. This shutdown mode can be very effective since the process is stopped when something begins to go wrong, instead of waiting for bad springs to be produced. After a CPK shutdown, the CPK shutdown is disabled for the next 50 springs. This allows the springs which caused the shutdown to clear the system before re-engaging the CPK shutdown. 23 Excess Adjust To prevent possible tool damage, EXCESS ADJUST will monitor the amount of adjustment and will turn off adjustments if the motor turns for too long in one direction. Unlike other shutdown functions, EXCESS ADJUST has two active options: • ON - Coiler will be shutdown the same as other shutdown functions. • WARN - The coiler will continue to run, springs will be gaged and sorted but no more adjustments will be made. During this time, an alarm will sound and the screen will flash an excess adjust warning. This allows those without shutdown cables to prevent tool damage. When EXCESS ADJUST is triggered, it automatically turns the adjuster motor back to its original position. This way, pitch adjustment should be reasonably close to correct once the coiler is started again. 24 S H U T D O W N S H U T D O W N No Cutoff ALARM OFF RELEASE SORTER OK Shutdown Screen When shutdown occurs, an audible alarm will sound and the SHUTDOWN screen will be displayed. The screen will flash SHUTDOWN SHUTDOWN and display the reason for the shutdown. The alarm can be silenced by pressing ALARM OFF. The alarm will automatically turn off after 5 minutes. Once the problem has been corrected, pressing the OK button will return to the previous screen. Because many coilers will continue to produce springs while the motor coasts to a stop, the short side sorter will be activated for bout 20 seconds when a shutdown occurs. The sorter can be deactivated during this time by pressing RELEASE SORTER. !WARNING! When the shutdown screen is exited the shutdown relay will immediately re-close. If the shutdown cable is not wired correctly through a contactor box the coiler could start unexpectedly. 25 SPC S P C D A T A C O L L E C T I O N SubGroup Size:05 Sample Frequency:01000 Collect Data On: GOOD Control Limits: CALCULATED (Standard) SETUP DISPLAY DATA MCS DATA XFER BACK The Panther is also a complete SPC data collection/analysis system. SPC evaluation of the production process is in greater demand than ever from end customers and spring makers. The Panther provides tools for all standard SPC collection and analysis. SPC stands for Statistical Process Control. SPC is a mathematical tool to help analyze the causes for scrap and to warn the operator if the scrap rate is about to increase. For an easy to understand discussion of SPC techniques and terms see Plain talk about SPC, page 56. Basically, SPC occasionally takes samples from the length measurements of springs being produced. The average length of the samples and the range of the samples is calculated and charted. Each batch of spring lengths sampled is called a SUBGROUP. The number of measurements in each batch is called the SUBGROUP SIZE. How often the subgroups are taken is the SAMPLE FREQUENCY. Before this sampling process can begin the basic ability of the machine to make good parts is determined by a MACHINE CAPABILITY STUDY. This study samples 100 springs and calculates the values used for the SPC charts. For SPC charting to be useful it is important that spring production proceed normally during the study. If anything unusual occurs during the study, the study should be restarted. The Panther will automatically do a study on the first 100 springs measured. All SPC charting will use the values calculated during the last machine capability study. The SPC screen will display the following information: • Subgroup Size • Sample Frequency • Data Collected on Good or All • Control Limits - Calculated or Entered 26 Setup S P C D A T A C O L L E C T I O N SubGroup Size:05 Sample Frequency:01000 Collect Data On: GOOD Control Limits: CALCULATED (Standard) SET SIZE SET FREQ A L L/ GOOD CONTROL L I M I TS BACK Set Size This is where SUBGROUP SIZE is set. The smallest is 5 and the largest is 25. 5 is by far the most common. While it is possible to do so, this number should not be changed once samples have been collected. Set Freq This is where the SAMPLE FREQUENCY is set. The SAMPLE FREQUENCY is the number of springs produced between SPC samples. The smallest is 10 and the largest is 99999. All/Good Collection SPC data can be collected on all the springs produced or just the good ones. Collecting data on all the springs is a better record of machine performance. Collecting data on the good springs gives the customer SPC data only on the springs they are receiving. Which option to use will depend on the circumstances of each job. Control Limits S E T C O N T R O L L I M I T S C ontrol Limits: CALCULATED (Standa rd) Chart Control Limits Calculated by MCS CALCULATE LIMITS ENTER LIMITS BACK This is an area for advanced SPC users only. In some situations the operator may wish to enter predetermined values for the SPC charting control limits instead of using those calculated by the machine capability study. Changing between the two modes can be done at anytime and is not permanent. Once limits have been entered and the gage changes to these new limits, it can be changed back to the original limits by selecting CALCULATE LIMITS. 27 Calculate Limits This button will cause all charting to use the limits calculated in the last machine capability study. Entered Limits When this button is pressed the operator will be required to enter values for control limits for the Xbar and R charts. The Panther will ask for these values one after another. The entered values will not be accepted unless all values are entered. Pressing the MAIN MENU button will abort the entry process and return the system to using calculated limits. Display Data S P C D A T A D I S P L A Y Good: 530 Bad: 42 %Bad: 7.3% M ea n: 1. 00 1 Si gm a: .0 01 9 CP K: 0. 66 1 Subgroup Size: 5 Sa mple Frequency : 10 00 R XBAR SAMPLE HIST TOTAL HIST BACK This screen displays the current SPC data values. These are the values generated since the counts were reset to 0. These values include: • Good Count; Total good springs produced • Bad Count; Total bad springs produced • Percent Bad; Total percent bad springs • Mean; Average length of sampled springs • Sigma; Standard deviation of sampled springs • CPK; CPK of sampled springs. Calculated as follows: The lesser of: UpperToleranceLimit – Mean 3Sigma or Mean - LowerToleranceLimit 3Sigma • Subgroup Size • Sample Frequency • The following SPC charts may be selected for on screen viewing: • Xbar • R • Histogram 28 Xbar 1.0035 Ucl 1.0000 Nominal 0.9965 Lcl Xbar Chart BACK This displays the Xbar chart of the last 40 samples taken. The nominal length and the control limit values are displayed on the left side of the screen. R Ucl .0130 .0061 RBar .0000 Lcl R Chart BACK This displays the R chart of the last 40 samples taken. The average R value (Rbar) from the machine capability study is represented by the center line. The average R value and the control limits are displayed on the left of the screen. Sample/Total Histogram S A M P L E H I S T Nominal : 1.000 Tolerance : ±0.005 Mean : 1.00 13 3 Sigma : 0.00 56 CPK : 0.8874 3 T M N T 3 BACK The Sample Histogram displays the histogram of the sampled data and statistics based on the sampled data. The Total Histogram displays the histogram of all the springs produced. The statistics shown reflect the entire job and are based on the data presented in the histogram. Springs beyond the range of the histogram are not accounted for in the calculations. If a significant percentage of springs are beyond the range of the histogram then the statistics values will lose accuracy. The Mean value is marked by an ‘M’ and a vertical line. The 3 Sigma points are marked by ‘3’s and vertical lines. 29 The desired length is marked by an ‘N’ and a vertical line. The tolerance (sort) points are marked by ‘T’s. NOTE: The Histogram X- Axis is calculated when the first spring is measured. An increase in tolerance of over 20% would cause the tolerance points to be off the edge of the histogram. To recalculate the Histogram X-Axis the spring counts must be reset to 0. MCS (Machine Capability Study) M A C H I N E C A P A B I L I T Y Status: Completed St art: 27 4 Good: 96 Bad: 4 Percent Bad: 4% M ea n: 1 .0 00 6 Sig ma : .0 02 6 CPK: 0.89 28 X U cl: 1.00 35 X Lcl: 0 .9 96 5 R Ucl: 0.0 13 Rba r: 0.00 61 NEW PRINT BACK • Study Status: Completed or In Process • Start: The spring count at which the last study was started • Good: The number of good springs produced during the study • Bad: The number of bad springs produced during the study • Percent Bad: The percent of bad springs produced during the study • Mean: The average length of springs produced during the study • Sigma: The standard deviation of springs produced during the study • CPK: The CPK of springs produced during the study • X Ucl: The upper control limit for the SPC X bar charts • X Lcl: The lower control limit for the SPC X bar charts • R bar: The average range of springs produced during the study (used on R charts) • R Ucl: The upper control limit for the SPC R charts ( the R chart lower limit is always 0 ) New Study Pressing this button will begin a new machine capability study. Print Pressing this button will print out the results of the last machine capability study. 30 Data Xfer (Data Transfer) D A T A T R A N S F E R Subgroups Ready for Transfer: Transmit Baud Rate: XMIT PRINT VIEW CLEAR 6 9600 BAUD D ONE The data transfer functions of the Panther allow the operator to transfer SPC subgroup samples to external devices such as DataMyte or GageTalker data collection tools or in house SPC hand charts. The information can be transferred one of three ways. It can be transmitted through the serial port; each subgroup can be viewed individually; or a list of values in each subgroup can be printed. Up to 200 length samples can be stored. With a subgroup size of 5, 40 subgroups can be stored. With a subgroup size of 10, 20 subgroups can be stored. After successfully transferring the data, the data should be cleared to make way for new subgroups and to prevent re-transfer of old data. As each subgroup is transmitted or viewed, the number of SUBGROUPS READY FOR TRANSFER decreases. Xmit Subgroup information can be transmitted through the serial port on the rear of the Panther. The serial communications settings are: Baud: 4800 or 9600 Stop Bits: 1 Data Bits: 8 Parity: None The samples are transmitted as a length followed by a carriage return. If sent to a printer, the transmission might look like this: 0.9975 1.0026 1.0014 0.9982 0.9921 1.0142 Refer to the manual of your data collection device for information on proper setup. After transmitting the data, operators will be asked if they want to clear the stored data. If the transmission was successful the data should be cleared to make room for new subgroups. If the transmission was not successful, the operator can refuse to clear the data and retry the transfer. 31 It is important that the subgroup size setting on the gage and on the data collection equipment be the same. View D A T A T R A N S F E R Subgroups Ready for Transfer: 0.9996 1.0012 0.9993 1.0023 5 1.0037 NEXT ABORT When the operator chooses to view the data, each subgroup will displayed on the screen one at a time. After the operator has entered or written the values displayed, pressing NEXT will display the next subgroup. As each subgroup is displayed, the SUBGROUPS READY FOR TRANSFER number is decreased. This way the operator knows how many more subgroups are waiting to be viewed. After all the subgroups have been viewed the operator will be asked whether or not to clear the stored data. Data should be cleared after recording to prevent accidental re-recording of the same data and to make room for new subgroups. This screen can display up to 15 actual samples at once. For this reason, subgroup size should be 15 or less when planning to use the view function. Clear D A T A T R A N S F E R Clear Stored Data? YES NO This will clear the current stored data values. This can be done to clear data that is not correct or after data has been transferred. Once data has been transferred it should be cleared to prevent accidental re-transfer and to make room for new subgroups. Baud Pressing this button will toggle the serial transmit baud rate between 4800 and 9600. Print Pressing this button will produce a printout of the values in each subgroup. 32 Print P R I N T Printer: M E N U Standard Auto Xbar is OFF PRINTER MCS XBAR HIST AUTO XBAR BACK The Panther can print to any standard Centronics parallel interface printer; in other words, any printer that can plug into the back of an IBM compatible computer. Printer Pressing this button alternates the printer type between STANDARD and DPU-411. Standard printers include any printer as described above. The DPU-411 is a small thermal printer from Seiko. The DPU-411 is convenient for use in the limited space and somewhat hostile environment of a coiling room. The Panther can print to the DPU-411 in either mode. The DPU-411 mode allows the gage to use some special features of the DPU-411 printer to make the reports easier to read. To use a DPU-411 printer set the “dip” switches on the bottom of the printer as shown in the figure below. Be sure to use the parallel connector on the DPU-411 when using it with the Panther. Bottom View Parallel Connector MCS This will print the results of the last machine capability study including a histogram of the springs produced during the study. 33 Xbar and R This will immediately print out an Xbar and R chart of the last 40 samples taken. Hist (Histogram) This will change the bottom line of the display to allow the operator to select A SAMPLE HISTOGRAM print or a TOTAL HISTOGRAM print. The SAMPLE HISTOGRAM displays the histogram of the sampled data and statistics based on the sampled data. The TOTAL HISTOGRAM displays the histogram of all the springs produced. The statistics shown reflect the entire job and are based on the data presented in the histogram. Springs beyond the range of the histogram are not accounted for in the calculations. If a significant percentage of springs are beyond the range of the histogram then the statistics values will lose accuracy. The Mean value is marked by an ‘M’ and a vertical line. The 3 Sigma points are marked by ‘3’s and vertical lines. The desired length is marked by an ‘N’ and a vertical line. The tolerance (sort) points are marked by ‘T’s. NOTE: The Histogram X- Axis is calculated when the first spring is measured. An increase in tolerance of over 20% would cause the tolerance points to be off the edge of the histogram. To recalculate the Histogram X-Axis the spring counts must be reset to 0. Auto XBAR (Automatic Xbar and R Printing) This will activate or deactivate automatic Xbar and R printing. When activated, the gage will print an information header on the page. After that, it will print one line of Xbar and R chart every time an SPC sample is processed. At the end of each page, the form will be fed to the next page and a short header printed. Each page will show the page number in the upper right corner. This type of report enables the operator to obtain a print out of the entire job without having to remember to run a print every 40 samples. Printing any other report will turn off automatic printing. The automatic printing will have to be turned on again when the other report finishes printing. If a print error should occur, automatic Xbar and R printing is disabled and will have to be reactivated manually. See Print Out Examples, page 61 for samples of report print outs. 34 Batch Counter The Batch Counter can be used to group parts in batches. A 3 way or 5 way sort is redefined to group parts in separate batches of “good parts” with a specified quantity in each batch. Bad parts can also be removed from each batch to ensure only good parts. The display consists of the current chute parts are falling into, the number of parts that have accumulated into the batch, and the overall good and bad parts the tester has measured so far. Below are the controls the Batch Counter has available. B A T C H Chute #: 1 Batch Count: 84 C O U N T E R / S O R T E R Good Count: 567 Bad Count: 125 Status:Enabled SETUP RESET BATCH ADVANCE RESET ENABLE/ COUNTER DISABLE BACK Reset Batch This button will reset the current Batch Count to zero and the Chute number to either 1 or 2 based on the Sort Bad setup property (covered in the Setup section below). This can be used to restart the entire batch. Advance Use this button to manually advance the sorting chute to the next available chute. When the chute is advanced the Batch Count IS NOT reset, it keeps counting to the Batch Size (covered in the Setup section below). Reset Counter Use this button to reset the Batch Count to zero. This will NOT reset the chute number to 1 or 2. Use this to manually reset the batch count if the batch is ended early. 35 Enable/Disable Use this button to Enable or Disable Batch Counting. Batch Counter and Output Sequencer cannot be run at the same time. By enabling Batch Counter the Output Sequencer is automatically disabled. When both Batch Counter and Output Sequencer are disabled normal sorting occurs. Back Use this button to return to MAIN MENU 2. Setup BATCH COUNTER / SORTER SETUP GAGING DISABLED SORT/ NO BATCH SORT SIZE BATCH/ CONTINUOUS BACK The Batch Counter contains three setup properties : Sort/No Sort, Batch Size, and Batch/Continuous. Use this button to open the Setup screen. Sort / No Sort BAD/SORT SETUP GAGING DISABLED Sort Bad : No CHANGE BAD BACK BAD/SORT SETUP GAGING DISABLED Sort Bad : Yes Sort Bad into chute : 2 CHANGE BAD CHANGE CHUTE BACK 36 Within this screen gaging is disable, meaning parts are not measured and chutes are not activated. Change Bad Use this button to switch between Sort Bad : No and Sort Bad : Yes. When Sort Bad is set to No than all parts are counted towards the Batch Size, bad parts included. When Sort Bad is set to Yes then bad parts are sorted out and only good parts are counted towards the Batch Size. Once Sort Out is set to Yes then the operator can select what chute bad parts fall into. When Batch Counter is enabled then the chute selected for bad parts will open for this screen. Change Chute Use this button to select a different chute for bad parts. If Batch Counter is enabled then the selected chute will open for this screen. Batch Size The Batch Size is the number of parts to be put into each batch. When the current batch size equals the Batch Size the sorting chutes will switch to the next chute in line. When the button is pressed to enter the Batch Size the enter number screen will come up, see the section Entering Numbers on the Panther. Batch / Continuous B A T C H / C O N T I N U O U S G A G I N G D I S A B L E D One batch to each chute then stop BACK CHANGE B A T C H / C O N T I N U O U S G A G I N G D I S A B L E D Continuous batches from chute to chute BACK CHANGE 37 Within this screen gaging is disabled, meaning parts are not measured and chutes are not activated. The Batch / Continuous property determines what happens when the last sorting chute is filled with parts. When the property is set to “One batch to each chute then stop” when the last chute is filled a SHUTDOWN command is generated and the panther stops gaging. If a shutdown cable is connected the coiler will stop. When the property is set to “Continuous batches from chute to chute” then the sorter will switch back to the first chute and continue with another batch, it is up to the operator to make sure the first batch has been removed before the chute is re-used. Change Use this button to toggle the Batch/Continuous property. 38 Output Sequencer O U T P U T S E Q U E N C E R Status:Enabled SETUP BAD/SORT Current Output: 1 SETUP GOOD ADVANCE ENABLE/ DISABLE BACK The Output Sequencer allows the user to program in a specific sequence for parts to fall through the sorting chutes. This can be useful if parts are to be put onto a conveyer belt at different placements with extra space between them Setup Bad/Sort BAD/SORT SETUP GAGING DISABLED Sort Bad : No CHANGE BAD BACK BAD/SORT SETUP GAGING DISABLED Sort Bad : Yes Sort Bad into chute : 2 CHANGE BAD CHANGE CHUTE BACK Within this screen gaging is disabled, meaning parts are not measured and chutes are not activated. Change Bad Use this button to switch between Sort Bad : No and Sort Bad : Yes. When Sort Bad is set to No than all parts are counted towards the Batch Size, bad parts included. When Sort Bad is set to Yes then bad parts are sorted out and only good parts are counted towards the Batch Size. Once Sort Out is set to Yes then 39 the operator can select what chute bad parts fall into. When Output Sequencer is enabled then the chute selected for bad parts will open for this screen. Change Chute Use this button to select a different chute for bad parts. If Output Sequencer is enabled then the selected chute will open for this screen. Setup Good G O O D O U T P U T G A G I N G Chute Sequence move select <- -> + 1 3 2 1 C H U T E O R D E R D I S A B L E D 3 2 BACK - Within this screen gaging is disabled, meaning parts are not measured and chutes are not activated. The Setup Good screen controls the output sequence. The screen shows two lines. The top line is the chutes available. The second line is the sequence that the chutes open up. This second line is the line that can be changed. There is a downward pointing arrow above the chute being worked with. In the above picture chute 1 is being worked with. The current chute order is chute 2, then chute 3, and finally chute 1. The number of chutes displayed reflect the current sorter setting from the GAGE-SORT menu. Use the left and right arrows to select the chute to work with. If the Output Sequencer is enabled the physical chute that is being worked with will open. Use the + or - keys to increase or decrease the sequence number for the chute being worked with. Every number in the sequence must be unique, therefore, when a sequence number in increased or decrease a corresponding chute sequence is changed. In the above picture, if the sequence at chute 1 were to be changed from 3 to 2 then the sequence number at chute 3 would changed from 2 to 3. 40 Back Use the Back button to return to the Output Sequencer screen. Advance Use this button to manually advance to the next chute in the sequence. Enable/Disable Use this button to enable or disable the Output Sequencer. The Output Sequencer and the Batch Counter cannot be used at the same time. When the Output Sequencer is enabled the Batch Counter is automatically enabled. When both Output Sequencer and Batch Counter are disabled normal sorting is performed. 41 Maintenance Menu M A I N T E N A N C E Version: 4.01 Gage ID: TESTS OPTIONS M E N U June 28, 2001 23 MMA: OFF COMP NAME SET TIME MMA BACK This button will display the MAINTENANCE MENU. This screen displays the current software version and creation date, the gage ID number, and the MMA status. The following selections are available from the maintenance menu: MMA Pressing this button will turn MMA on or off. When on, the display will show the current MMA setting. This is set by the computer and cannot be changed manually. Refer to the MMA section under probe setup for more information on MMA. Tests T E S T S PROBE CHUTE KEY BEEP BACK The Panther has the ability to perform many self tests. If a problem should arise the operator can determine the probable cause of the problem in a few minutes. This can save much frustration and time by preventing unnecessary returns or calls to the factory. The tests include: 42 Probe P R O B E T E S T S Pro be Volta ge 1.27 9 Length 1.002 SETUP PROBE FUNCTIONAL TEST DRIFT TEST BACK This screen displays the current probe output voltage and the calculated spring length according to the last probe setup. This can be useful for a quick check of probe operation. The Panther can self test the probe and probe circuit two different ways; for long term drift, and basic functionality. Setup Probe Setting up the probe is not necessary for the probe tests although it can be useful for better analysis in the drift test. For this reason probe setup can be done from this screen if desired. See Probe Setup instructions page 10 for details of probe setup. Drift Test D R I F T Voltage: 1.602 Max: Leng th: 1.0 05 2 Ma x: Temp: 76.9F Max: RESTART T E S T 1.604 1.0060 76.9F Min: Min: Min: Elapsed Time: 00:32:27 PRINT 1.598 1.00 48 76.5F DONE The drift test provides long term monitoring of the probe output and length measurement. The display gives the current, minimum, and maximum of three different readings; the probe voltage, the calculated length, and the ambient temperature inside the gage. It also displays the elapsed time since the test was started. This test can be used to check the probe and electronics if there is any concern of temperature drift. The recommended procedure is: 1. Position the probe holder so the probe is looking at a flat spot on the face of the coiler. This area should be cleaned of grease and dirt. 2. Adjust the probe position for a reading within 1 volt of 0 or re-setup the probe. Setting up the probe is not necessary unless the operator wants accurate length numbers on the display. The spring length value for setup is not important. The tolerance is also not critical. 0.005" is a typical value. 3. Start the test. 43 Functional Test P R O B E F U N C T I O N A L T E S T TESTING CONTINUE ABORT This will test the probe and probe driving circuitry for any failures. When the button is pressed the following sequence will occur: 1. The operator will be reminded to make sure the probe tip is not touching anything. 2. Press continue. 3. A series of tests will be run. 4. If a failure is found the operator will be prompted to disconnect the probe from the gage. 5. Press continue. 6. Another series of tests are run. 7. The test results are now displayed. The three possible outcomes are: • Probe Function is OK • Probe and/or tip is not functional • Panther electronics may need repair. Chute S O R T I N G 5 WAY UNDER 5 WAY OVER C H U T E UNDER OVER T E S T S BACK Pressing this button will display the SORTING CHUTE TEST screen. Pressing the appropriate button activates each of the four possible sorting outputs. The sorter will remain activated until the button is released. Press either 5 Way buttons will also activate anything connected to the Secondary Operation cable. This test can be used to help determine if a failure is in the chute or in the electronics. 44 Options O P T I O N S Gage ID: 3 M E N U Length Display: Relative LENGTH DISPLAY ID BACK ID This activates the numeric entry screen for entering the gage ID number. This number can be used for gage identification when it is being communicated with through the serial port or with Panther-Net. That is the only time gage ID might be used. Length Display This changes the length display on running screens between a relative length and an absolute length. Absolute length displays the actual spring length, such as 1.2566". Relative length displays the spring error length around zero, such as 0.0054" or –0.0045". This only effects screen displays. Reports always print absolute length. Company Name Pressing this button allows entry of your company’s name. The name entered here will appear at the top of all printed reports. Set Time (and Date) S E T T I M E Current Time 13:23:48 HOURS MIN DONE Pressing this button will display the current time on a 24 hour clock. The hours and minutes can be incremented by pressing the appropriate buttons. Holding the buttons down will automatically increment the values. Pressing done will bring up the change date screen. 45 S E T D A T E Current Date February 28, 1995 MONTH DAY YEAR BACK The month, day, and year can be incremented by pressing the appropriate buttons. Holding the buttons down will automatically increment the values. The years range from 1994 to 2020. 46 Entering Numbers on the PANTHER When a number must be entered into the Panther the following screen will be displayed: Instructions appear on this line ↓ 001200 move selector ← → + - DONE Across the top is a comment on what type of number is being requested. The next line shows the current value of the number being entered. The arrow over this line indicates which digit in the number is to be changed. The MOVE SELECTOR buttons move the arrow to another position over the number being entered. The + and - buttons will increase or decrease the digit pointed to by the arrow. The basic entry process is this: 1. Press the MOVE SELECTOR buttons until the arrow is over the digit to be changed 2. Press the + or - buttons until the digit is the correct value 3. Repeat these steps until the number is correct 4. Press the DONE button 47 Entering Text on the PANTHER Instructions appear on this line ↓ >TEXT BEING ENTERED < move selector ← → + - X DONE Across the top is a comment on what type of text entry is being requested. This is followed by a line of text starting with >. This is the current value of the TEXT BEING ENTERED. The < symbol indicates the maximum number of characters that can be entered. The arrow over the TEXT BEING ENTERED indicates which letter is to be changed. The MOVE SELECTOR buttons move the arrow. The + and - keys will change the letter to the next letter. At the end of the alphabet are some special characters like slashes and hyphens. The X key deletes the currently selected letter and advances the arrow to the next letter. Holding the button down will quickly erase the entire line of text. The basic entry process is this: 1. Use the MOVE SELECTOR buttons to move the arrow over the desired location 2. Press the + or - button to change the letter 3. Repeat until complete 4. Press Done 48 220VAC Power Input Option The Panther is available with a 220VAC Power Input Option. When this option is installed the power input to the gage is 220 VAC. There are no switches or jumpers to change. The 220VAC Power Input Option also sets the sort and control outputs to be 24VAC @ 2 Amps maximum. With the 220VAC Power Input Option the total power available to the sort and control outputs is 50 watts continuous or 75 watts with a 30% duty cycle. ! W AR NI N G ! Operating sorting chutes or controller motors at the wrong voltage may damage the external device and/or the spring gage! 49 With the 220VAC Power Input Option the total power available to the sort and control outputs is 50 watts continuous or 75 watts with a 30% duty cycle @24VAC. Back Panel Connections Probe The Panther can be used with any Lion Precision spring gage probe. It is designed to take advantage of the PX595G Temperature Stable Probe. Connect the probe to this connector. Read Any standard Lion Precision magnetic read switch can be connected here. See Installing a Read Switch page 65 in the appendices for detailed instructions. Printer This is the same as a parallel printer connector on an IBM compatible computer (LPT). Connect any standard printer cable to this connector and to any parallel printer. This type of printer and cable is sometimes referred to as a Centronics interface or connector. CNC This connector is for any CNC coiler that supports the Lion Precision CNC Connector . Consult the coiler manufacturer for details of connection and operation with a CNC coiler. Serial The Panther can communicate through its RS232C connector. Using this connector the gage can be programmed, operated, and questioned from a remote location. Some CNC coilers may use this connector as well as the CNC connector. See the External Programming section page 52 for details. Sort and Control Outputs These will connect to any Lion Precision sorting chute, air solenoid, or controller motor. If the Universal Power Input Option is installed the total power available at any one time is 24 watts continuous or 50 watts at a 30% duty cycle. Otherwise the outputs are 115 VAC and are fused at 2 amps. Shutdown This connector is for a Lion Precision automatic shutdown cable (P/N B0138250). It provides a set of normally closed relay contacts and a set of normally open relay contacts that switch when a shutdown condition occurs. See Installing a Shutdown Cable, page 68 for specific connection details. 50 24 VDC Output Instructions DC Output spring gages provide 24VDC outputs to activate adjusting motors and sorting devices. The total power output of the DC system is 24 Watts. Sorting system: Pin C of the sort connector is ground. Pin A outputs 24VDC relative to ground when an over sort is active. Pin B outputs 24VDC relative to ground when an under sort is active. Sort Connector Pin Under Sort Over Sort A 0V 24V 0V B 0V 0V 24V No Ground Ground Ground C Sorter connection: Sort B A UNDER Solenoid OVER Solenoid C Adjust/Control System: Pin C of the Adjust/Control connector is ground. Pins A and B output 24VDC between them during an adjustment. The direction of adjustment determines the polarity. Adjust/Control Connector Pin Adjust Over Adjust Adjust A 0V 0V 24V B 0V 24V 0V No Under Ground Ground Ground C C A A DC B DC Motor Connection 51 B Connector Pin Reference External Programming Many of the Panther functions and parameters can be set and read through the serial interface connector on the rear panel. The serial port communication is set as follows • Baud - 9600 • Data Bits - 8 • Stop bits - 1 • Parity - None Three types of instructions can be used through the serial port; • Commands: These instructions tell the Panther to perform a specific task. • Parameter Queries: These instructions prompt the gage to transmit the value associated with the parameter that is queried. These instructions always end with a ‘?’. • Parameter Setting: These instructions will set the value of the parameter to the next value transmitted to the gage. These instructions must always be followed by the new value at which to set the parameter. All transmitted codes must be upper case! Only the first four letters of any code is used. There is limited error checking when setting parameter values. Be sure the correct values are entered. If one of the Parameter Setting commands is errantly sent to the Panther, setting of the associated value can be avoided by sending an INITialize command. Commands DUMP Gage transmits the length samples stored for data transfer. The number of subgroups ready for transfer can be queried with STACk? This is equivalent to pressing SPC-DATA XFER-XMIT button. See SPC section of manual for more information. MCSDump Gage transmits the length values from the machine capability study. The transmitted format is the same as the DUMP command. CLEAr Clears the stored data samples and sets the STACk number to 0. Equivalent to pressing SPC-DATA XFER-CLEAR button TEST Initiates a read cycle INITialize Resets the serial input handler from expecting a value for a previously transmitted parameter type HISTogram Gage transmits the Sample Histogram report print out over the serial 52 line THIStogram Gage transmits the Total Histogram report print out over the serial line MCS Gage transmits the MCS report print out over the serial line XBAR Gage transmits the Xbar and R chart print out over the serial line KEYStroke Prepares the serial input handler to receive a key press instruction. The next transmission will cause the gage to respond as if the operator had pressed the indicated key. MAIN After KEYStroke, will operate the Main Menu button ONE After KEYStroke, will operate soft key 1 TWO After KEYStroke, will operate soft key 2 THREe After KEYStroke, will operate soft key 3 FOUR After KEYStroke, will operate soft key 4 FIVE After KEYStroke, will operate soft key 5 SIX After KEYStroke, will operate soft key 6 Queries ADJUst? Gage transmits the last turn time of the adjustment motor in milliseconds. A negative number indicates an adjustment to make the spring longer. A positive number indicates an adjustment to make the spring shorter TYPE? Gage responds with ‘PANTHER’ COUNt? Gage transmits the current total production count SIGMa? Gage transmits the current standard deviation of the sampled data VERSion? Gage transmits the current software version and date of creation CONSecutive ? Gage transmits the Consecutive Bad Shutdown setting CPKS? Gage Transmits the CPK Shutdown setting LOTSize? Gage transmits the Lot Size Shutdown setting CUTOff? Gage transmits the No Cutoff shutdown setting (ON, OFF) STACk? Gage transmits the number of subgroups stored for data transfer. RATE? Gage transmits the last calculated production rate SCPK? Gage transmits the CPK of sampled data 53 CPK? Gage transmits the recent CPK as displayed on the gage screen MEAN? Gage transmits the recent mean as displayed on the gage screen SMEAn? Gage transmits the mean of the sampled data LONG? Gage transmits the count of long springs SHORt? Gage transmits the count of short springs GOOD? Gage transmits the count of good springs BAD? Gage transmits the count of bad springs LENGth? Gage transmits length of the last measured spring 54 Settable and Queried parameters The following commands are queries if ended with a ‘?’. The query will be responded to with the current value of the parameter. If not a query the next transmission must be the new value for the parameter. LIMIts(?) Control Limit source: CALCULATED, ENTERED RUCL(?) R chart UCL value RBAR(?) R chart Rbar value XUCL(?) Xbar chart UCL value XLCL(?) Xbar chart LCL value NOMInal(?) Nominal spring length TOLErance(?) Spring length tolerance CUSTomer(?) Customer name (40 characters max) PART number(?) Part Number (40 characters max) COMMent(?) Comment (40 characters max) FREQuency(?) SPC sample frequency (10-10000) SIZE(?) SPC subgroup size (5-25) COLLection(?) SPC data collection mode: ALL, GOOD ID(?) Gage ID number COMPany(?) Company name MMAQ(?) MMA setting; ON, OFF CONTrol(?) Length Adjust TYPE: SMART, CENTERING, EACH, NONE AMOUnt(?) Length Adjust Amount: 0-99 SORT(?) Sort Type: 3 Way Timed (3T), 5 Way Timed (5T), 3 Way NonRelease (3N), 5 Way Non-release (5N), NONE TIME(?) Sort time (in milliseconds): 0-2000 55 Plain talk about SPC The SPC Concept (See sample Xbar chart below for reference) When a spring coiler produces springs it is impossible for the coiler to make all springs the same. Anyone who has ever operated a spring coiler is well aware of this fact. There are certain things that cause consecutive springs to differ. The wire may change a little, there’s a little slop in the tooling, even changes in line voltage can affect spring quality. These are a part of the process of making a spring that we can’t do much about. In SPC language, things that affect the process that we can't do much about are called common causes. Sometimes other things affect spring quality. The dereeler binds up, the wire tangles, or the tooling starts to come loose, etc. In SPC language, things that go wrong with the process that we can fix are called assignable causes. Common causes are things we have to live with. Assignable causes are things we might be able to fix. One of the main purposes of SPC, especially Xbar and R charts, is to separate assignable causes from common causes. Using SPC techniques we can tell if the current scrap rate is just the nature of the job or if something has begun to go wrong with the process. In order to separate assignable causes from common causes we have to test the coiler setup to see how well it can make springs. This is called a machine capability study. This test is done on a batch of springs. The LION PRECISION Panther gage uses a batch of 100. The measured lengths of these 100 springs are used to calculate control limits for the Xbar and R charts. Control limit values are calculated so that over 99% of the springs made should fall between the control limits. Xbar and R Charts To make Xbar and R charts, the gage takes samples every so often and plots them on the chart. How often a sample is taken is called the sample frequency. How many springs are measured in a sample is called the subgroup size (usually 5). The average length of the springs in the sample are plotted on the Xbar chart. The range, the difference between the longest and the shortest spring in the sample, is plotted on the R chart. The Xbar and R charts have lines that mark the control limits (upper and lower). The idea is this; if the points on the Xbar and R charts are between the control limits then the process is proceeding normally, the variation in spring length is due to common causes. If they are outside the control limits then there is something wrong; there may be an assignable cause for reduced quality that can be fixed. When the points are outside the control limits, SPC language says the process is out of control. This doesn’t mean the job has gone wild, just that a point was outside the control limits and may have an assignable cause. When a point is outside the control 56 limits it does not necessarily indicate a bad part. Xbar and R charts do not indicate good or bad parts. They only indicate if the process is operating normally. All the Xbar and R charting is based on the machine capability study. For the Xbar and R charts to mean anything, the springs produced during the capability study must be typical for the setup. If anything out of the ordinary happens during the machine capability study, the study should be restarted. Ucl 1.000 Lcl Point out of control ; possible assignable cause Xbar Chart 57 Histogram A histogram is a chart showing the distribution of spring lengths. Each bar in the graph covers a range of lengths. One bar might include all springs between 1.0009" and 1.0011". Every time a spring length is sampled, the appropriate bar in the graph is made longer. Each bar is like a bucket, each spring that is sampled is put in the appropriate bucket. The more springs made of a particular length, the fuller the bucket. The most basic use of this chart is to see if the process is centered. The coiling process is centered when the average length of the springs being produced is the same as the desired length. If you want 1.000" springs and the average length of springs is 1.000" then your coiling process is centered. Keeping the coiling process centered is what length control gages are for. Nominal Average Histogram showing a centered process Normal Distribution (Gaussian) The shape of the histogram is very important to SPC calculations. When the shape looks something like a bell and meets certain mathematical criteria the distribution (the shape of the histogram) is called normal. This is also called gaussian. All SPC calculations, no matter who's doing them, assume that the histogram shape is normal. If it is not, the SPC calculations lose their accuracy. If the shape of the histogram is far enough from being normal, the SPC numbers become meaningless. If the shape is not perfectly normal, Xbar and R charting can still be useful for monitoring the coiling process. 58 Accessories Panther Accessories Description Panther Gage - 120 VAC In / 120 VAC Out Panther Gage - 240 VAC In / 24 VAC Out Panther Gage - 240 VAC In / 24 VDC Out Temperature-Stable Heated Probe - PX595G (English) Temperature-Stable Heated Probe - PX595G (Metric) Micrometer for English Probe Micrometer for Metric Probe Digital Readout Micrometer Inch/Metric for Probe Extended Probe Tip Kit (1 Base & 5 Tips) Guarded Probe Tip - 5/8” DIA (16 mm) Guarded Probe Tip - 1” DIA (25 mm) Guarded Probe Tip - 1.5” DIA (38 mm) Guarded Probe Tip - 2.0” DIA (52 mm) PB309B - Fixed Probe Holder RP2 - Retractable Probe Holder RS-2E - Read Switch Assembly Magnet and Holder Assembly for RS-2E Magnet for RS-2E Read Switch - HS2E Proximity Sensor for RS-2E Magless - Read Switch Assembly Read Switch - Magless Proximity Sensor only Shutdown Cable Shutdown Bypass Connector Panther Secondary Operation Cable AC335 Driver Assembly AC336 Gear Box, 20:1 AC336 Adapter 10-32, W100A 59 Part Number 025-0000-0642-00 025-0000-0642-01 025-0000-0642-02 025-0000-0658-02 025-0000-0658-03 013-5000-0162-00 013-5000-0163-00 3301-0020 025-0000-0655-00 025-0000-0597-03 025-0000-0597-00 025-0000-0597-01 025-0000-0597-02 025-0000-0640-00 025-0000-0573-00 025-0000-0648-00 025-0000-0613-00 013-5000-0165-00 025-0000-0650-00 025-0000-0648-01 025-0000-0572-00 025-1000-0426-00 025-0000-0652-00 025-1000-0423-00 025-0000-0589-00 025-0000-0590-00 018-0000-2548-00 AC336 Adapter 1/4-28, W10A AC336 Adapter 3/8-24, W11A AC336 Adapter Kit, 1/2-20, W115A AC336 Adapter Blank (up to 3/8” thread) AC336 Adapter Kit, Blank 1/4-Thru Hole (up to 1/2” thread) AC336 Flex Shaft, 8” AC337 Heavy Duty Driver Assembly AC337 Gear Box, 50:1 AC337 Adapter Kit, 3/8-24 AC337 Adapter Kit, 1/2-20 AC337 Adapter Kit, 5/8-18 AC337 Adapter Kit, 3/4-16 AC337 Adapter Kit, Blank 1/4-Thru Hole AC337 Flex Shaft 12” AC337 Anti-Rotation Bracket MC34-2 - 2 Way Air Powered Sorter, 120 VAC MC34-2 - 2 Way Air Powered Sorter, 24 VAC MC34-2 - 2 Way Air Powered Sorter, 24 VDC MC34 Flapper MC34 Funnel MC46-3 - 3 Way Air Powered Sorter, 120 VAC MC46-3 - 3 Way Air Powered Sorter, 24 VAC MC46-3 - 3 Way Air Powered Sorter, 24 VDC MC46-5 - 5 Way Air Powered Sorter, 120 VAC MC46-5 - 5 Way Air Powered Sorter, 24 VAC MC46-5 - 5 Way Air Powered Sorter, 24 VDC MC46 Flapper, Perforated MC46 Flapper, Solid MC46 Funnel Valve, 120 VAC Solenoid Valve, 24 VAC Solenoid Valve, 24 VDC (5.4w) Solenoid SC48-3 - 3 Way Electric Powered Sorter with Stand, 120 VAC SC48-5 - 6 Way Electric Powered Sorter with Stand, 120 VAC SC48 Solenoid SC48-3AP - 3 Way Air Powered Sorter with Stand, 120 VAC SC48-3AP - 3 Way Air Powered Sorter with Stand, 24 VAC SC48-3AP - 3 Way Air Powered Sorter with Stand, 24 VDC SC48-5AP - 5 Way Air Powered Sorter with Stand, 120 VAC SC48-5AP - 5 Way Air Powered Sorter with Stand, 24 VAC ASR1 - 2 Way Air Jet, 120 VAC ASR1 - 2 Way Air Jet, 24 VAC 60 018-0000-2549-00 018-0000-2550-00 018-0000-2515-01 018-0000-2551-00 018-0000-2515-00 013-5000-0151-00 025-0000-0596-00 025-0000-0595-00 025-0000-0593-01 025-0000-0593-03 025-0000-0593-02 025-0000-0593-00 025-0000-0593-04 013-5000-0155-00 018-0000-2578-00 025-0000-0566-00 025-0000-0566-02 025-0000-0566-01 018-0000-2560-00 018-0000-2497-00 025-0000-0538-00 025-0000-0538-02 025-0000-0538-01 025-0000-0537-00 025-0000-0537-02 025-0000-0537-01 018-0000-2498-00 018-0000-2499-00 018-0000-2502-00 019-0000-0146-00 019-0000-0148-00 019-0000-0149-00 025-0000-0576-00 025-0000-0578-00 025-0000-0574-00 025-0000-0582-00 025-0000-0582-02 025-0000-0582-01 025-0000-0580-00 025-0000-0580-02 025-0000-0600-00 025-0000-0601-00 Print Out Examples L I O N |-|-|-|-| P R E C I S I O N M a c h i n e P A N T H E R C a p a b i l i t y G A G E S t u d y |-|-|-|-| Date: February 18, 1995 Time: 11:47 Acme Spring Based Assemblies TY683-JJ8 First run on 12 -------------- Machine Capability Study Results ------------ Adjust Type: Smart Control Adjust Amount: 20 Study Started at Spring Count: 0 Nominal................... 1.0000 Tolerance................. 0.0100 Good...................... 98 Bad....................... 2 Percent Bad............... 2% Mean...................... 0.9989 Standard Deviation........ 0.0028 Cpk....................... 1.0673 Xbar Values: R Values: Ucl... 1.0037 Ucl... 0.0137 Nominal... 1.0000 Rbar...... 0.0065 Lcl... 0.9963 Lcl... 0.0 |-|-|-|-|-|-|-|-|-|-| H i s t o g r a m |-|-|-|-|-|-|-|-|-|-| T N T |3 M | 3 | || | X | | || | X | | || | X | | || X X | | || X X | | || X X X X | | || X X X X | | || X X X X X X | | || X X X X X X X | | || X X X X X X X X | | ____________________________________________________________________ Each 'X' = 2.4 Springs 61 L I O N |-|-|-|-|-|-|-|-| P R E C I S I O N X b a r a n d P A N T H E R R C h a r t G A G E |-|-|-|-|-|-|-|-| Date: February 18, 1995 Time: 11:48 Acme Spring Based Assemblies TY683-JJ8 First run on 12 Subgroup Size............. Sample Frequency.......... 5 10 Nominal................... Tolerance................. Chart Start Count.... 479 1.0000 0.0100 LCL 0.0000 Range | 0.0036 | R 0.0189 | 0.0034 | R 0.0050 | 0.0053 | 0.0222 | 0.0056 | 0.0112 | 0.0087 | 0.0086 | 0.0109 | 0.0117 | 0.0062 | 0.0106 | 0.0068 | 0.0111 | 0.0105 | 0.0033 | R 0.0021 | R 0.0177 | Rbar 0.0065 | | | R | R | | R| | | | | | R | |R | | | | | R R UCL LCL Nominal UCL 0.0137 0.9963 1.0000 1.0037 | | | | | | | X | | -> | X | | | X| | | | X | | | | X | | | -> | |X | | | X | | R | <-| | | | | | X | | | X | | R | | X | | R | | | X | | | X | | R | | X | | | | | X| R | | X| | R | | X | | | |X | | | | | |-> | -> | X | | 62 Xbar 1.0025 1.0000 0.9996 0.9990 0.9983 1.0002 0.9980 0.9918 1.0015 0.9978 0.9995 1.0021 0.9978 0.9979 1.0036 0.9997 0.9976 0.9965 1.0050 0.9976 L I O N P R E C I S I O N S P C F r e e L e n g t h Date: February 18, 1995 Time: 11:47 Acme Spring Based Assemblies TY683-JJ8 First run on 12 |-|-| P A N T H E R G A G E H i s t o g r a m |-|-|-|-| Subgroup Size............. 5 Sample Frequency.......... 10 Subgroups Taken........... 20 Samples Taken............. 100 ----- Current Statistics: ----Nominal................... 1.0000 Tolerance................. 0.0100 Total Production Count.... 479 Good................. 464 Bad.................. 15 Percent Bad............... 3.1% -- SPC Sample Values -Mean...................... 0.9993 Standard Deviation........ 0.0039 3 Sigma................... 0.0118 Cpk....................... 0.7864 |-|-|-|-|-| H i s t o g r a m o f S a m p l e s |-|-|-|-|-| T N T 3 | M| | 3 25%------------|----|-----------------||------------------|--|---------| | || | | | | || | | | | || | | | | || | | 20%------------|----|-----------------||------------------|--|---------| | || | | | | || | | | | || | | | | || | | 15%------------|----|------------X----|X------------------|--|---------| | X |X X | | | | X |X X | | | | X |X X | | | | X X |X X | | 10%------------|----|---------X--X--X-|X-----X------------|--|---------| | X X X |X X X | | | | X X X |X X X | | | | X X X |X X X | | | | X X X X |X X X | | 5%------------|----|------X--X--X--X-|X--X--X--X--X------|--|---------| |X X X X X |X X X X X | | | |X X X X X |X X X X X X | | | |X X X X X |X X X X X X | | X X |X X X X X |X X X X X X | X| ____________________________________________________________________ Each 'X' = 1.0 Springs 63 L I O N T o t a l |-|-| P R E C I S I O N P A N T H E R G A G E F r e e L e n g t h H i s t o g r a m |-|-| Date: February 18, 1995 Time: 11:48 Acme Spring Based Assemblies TY683-JJ8 First run on 12 ----- Current Statistics: ----Nominal................... 1.0000 Tolerance................. 0.0100 Total Production Count.... 479 Good................. 464 Bad.................. 15 Total parts in Histogram.. 479 Percent Bad............... 3.1% Mean...................... 0.9998 Standard Deviation........ 0.0045 3 Sigma................... 0.0134 Cpk....................... 0.7308 |-|-|-|-|-|-| T o t a l H i s t o g r a m |-|-|-|-|-|-|-| T N T 3 | M | 3 18%----------|------|------------------X------------------|------|-----| | X | | | | X | | | | X | | | | X X | | 14%----------|------|------------X--X--X------------------|------|-----| | X X X | | | | X X X | | | | X X X | | | | X X X X | | 11%----------|------|------------X--X--X--X---------------|------|-----| | X X X X X | | | | X X X X X | | | | X X X X X | | | | X X X X X X | | 7%----------|------|---------X--X--X--X--X--X------------|------|-----| | X X X X X X | | | | X X X X X X | | | | X X X X X X X | | | | X X X X X X X X | | 4%----------|------|------X--X--X--X--X--X--X--X---------|------|-----| | X X X X X X X X X X | | | | X X X X X X X X X X | | | | X X X X X X X X X X X | | | |X X X X X X X X X X X X X| | ____________________________________________________________________ Each 'X' = 3.4 Springs 64 Installing the Read Switch The Read Switch triggers the gage to measure the spring length, sort the spring, and adjust e pitch rod if necessary. The system consists of two basic parts: the read switch, and the magnet that triggers it. System accuracy can be effected by improper positioning of the read switch. Please confirm proper position before operating. Install as follows: 1. Install magnet assembly on the cam shaft of the coiler. Alternatively, it can be installed on any rotating part that turns once per cycle. 2. Mount the read switch so the magnet will pass within 0.1" of it every time around. 3. Position the magnet on the shaft so it triggers the read switch after the wire stops feeding and before the cutoff tool touches the spring. The read switch should be triggered as soon as possible after the wire feed stops. This allows maximum time for the reading to be taken before the cutoff tool touches the spring. Magnet Assembly Bracket Read Switch Rotating Shaft 65 Installing a Length Adjuster The following instructions describe the installation of a standard length adjuster. Actual components may look slightly different. A length adjuster system consists of four basic parts: 1. Adjuster Motor 2. Flex Shaft; Connects the motor to the gear box 3. Gear Box; This provides a gear reduction for more precise adjustments 4. Threaded Adapter; Connects the gear box to the pitch rod. The adapter is selected to match the size and thread of the pitch rod on the coiler. See the Accessories list on page 59 for a selection of adapters. Blank adapters are available for custom drilling and tapping. 66 Installation Sequence 1. Mount the appropriate threaded adapter (specified when ordered) to the Gear Box using the set screw. See figure below: 2. Thread the Gear Box onto the pitch rod with the label up. This position will prevent oil from leaking from the gear box. 3. The controller motor is mounted on the coiler such that the flex shaft is as straight as possible. Severe bends in the flex shaft will shorten the life of the flex shaft. 67 Installing a Shutdown Cable The Panther provides automatic shutdown of the coiler under 4 different conditions: • Lot Completed • Consecutive Bad Springs • No Cutoff • CPK Too Low To use the shutdown feature a contactor device must be installed on the coiler. The relay inside the Panther is not capable of handling the coiler power lines directly! The gage provides one set of normally closed contacts and one set of normally open contacts. The normally closed contacts can be wired in series with the contactor deactivation circuit. When a shutdown condition occurs the contacts will open, causing the contactor to remove power from the coiler. The normally open contacts can be used to activate an alarm or beacon if desired. The current rating for each set of contacts is 5A @ 125/250 VAC. Once the coiler has been wired for a shutdown cable, a normally closed set of contacts is required to run the coiler. The Lion Precision Shutdown Cable Bypass (P/N A014-6180) can be used to run the coiler without a gage. The shutdown cable contains four wires and has a connector that mates to the SHUTDOWN connector on the rear of the gage. The wiring diagram and schematic are shown below. The letters indicate the pins of the connector. The next page includes a schematic of a typical contactor box with shutdown installed. Normally Closed Contact A C Red White Green Black B Normally Open Contact 68 D A typical contactor circuit schematic with shutdown cable installed is as follows: 115 VAC In 3 Phase to Motor START CONTACTOR STOP 3 Phase In Red White Shutdown Cable Typical Installation Procedure: 1. Cut the wire in line with the stop switch. 2. Connect the one of the cut ends of the wire to the Red shutdown wire 3. Connect the other cut end to the White Shutdown Wire !!WARNING!! Confirm coiler and contactor manufacturers instructions before proceeding. Installing the Shutdown Cable should only be done by a qualified electrician. Improper installation can result in injury and or damage to the coiler and gage! 69 Installing a Sorting Chute A typical Sorting chute consists of three parts • The Main Body which includes the flappers and solenoids • The Stand Base • The Stand Shaft 1. Place base on floor and insert shaft. 2. Turn hex socket set screws in base to prevent shaft from moving. 3. Slide main body on top of shaft and tighten two hex head bolts. 4. Position the chute in front of the coiler. 5. Loosen hex socket set screws in the center of the shaft and raise chute body to catch springs. 6. Tighten set screws. 7. The chute should be as high as possible without interfering with the coiling process. This provides a shorter travel time for the springs after cutoff which assures more accurate sorting. 70 Installing an Air Solenoid for Sorting Lion Precision manufactures air solenoids for spring sorting. The ASR1-A (P/N B0140520) which blows out all bad springs, short or long, in the same direction. This is the most common method of sorting by air. Air solenoids can be configured to blow only on reject or to blow continuously and stop only on reject. To Blow on Reject Only 1. Input air supply to inlet ‘1’. 2. Place plug in inlet ‘3’. 3. Position a line from outlet ‘2’ to blow out bad springs. 3 1 2 PLUGGED To Blow Continuously Except on Reject 1. Input air supply to inlet ‘3’. 2. Place plug in inlet ‘1’. 3. Position a line from outlet ‘2’ to blow out good springs. 3 2 1 PLUGGED The air solenoid can be mounted to blow right at the tooling or at another location where the spring will be passing as it falls after cutoff. Blowing right at the tooling usually provides a more reliable sort. It saves the operator from creating a “spring guide” of cardboard to direct the spring in front of the solenoid. Caution must be used when blowing at the tooling. If the air continues to blow into the coiling process some springs can be deformed. Blowing on the spring when the gage is reading the length can give an inaccurate reading if the spring end is pushed away from the probe tip. These considerations depend on the air pressure in the solenoids and wire type of the job. This type of sorting should not be used with MMA active. The slight delay from MMA may cause springs to be missed by the sorter. 71 Using the Secondary Operation Cable The Secondary Operation cable connects to the 5-Way sort connector. The 5-Way sort outputs are used to trigger the secondary operations; therefore, 5-Way sort and Secondary Operations cannot be used together. When a Secondary Operation is triggered (see Secondary Operation section), both the Over Good and Under Good sort signals are activated. Either or both can be used as required. The output is the standard output voltage listed in the specifications sections ([email protected] Total, Standard). Wiring Table: Connection Wire Switched Output Voltage (115VAC Standard) White Switched Output Voltage (115VAC Standard) Black Common Red 72 Maintenance - Inside the Panther Should the gage ever require service, much can be done in the field by the operator or maintenance department. Such as: • Replacing sorter and motor drive relays • Replacing shutdown relay • Replacing memory backup battery • Replacing Fuses Replacing Fuses Two 2A, 250V, 5x20mm fuses are located in the IEC connector where the power cord plugs into the gage. A small screwdriver may be required to remove the fuse block. Removing the Cover To remove the cover: 1. Unscrew and remove the four feet. 2. Remove the five torx screws (T10) on the bottom of the gage. 3. Slide the cover toward the rear of the gage. 4. When the handle makes contact with the rear panel, tilt the rear of the cover up and pull the cover off at an angle. 5. To reinstall, reverse the procedure. Replacing the Battery The battery maintains the date and time and all the job data when power is off. Should any of these functions fail the battery probably needs replacement. A new battery can last up to 10 years. The battery can be ordered directly from Lion Precision or from a local distributor. The battery is as follows: Type: Lithium Voltage: 3V Size: 2/3A When the battery has been replaced a “Memory Corrupt” warning will display the first time the gage is turned on. This is normal, simply press a key and the warning will clear. Placing the battery in backwards can damage the gage!! Follow the diagram next to the battery holder!! Be sure to reset the time and date after replacing the battery!! 73 Replacing the H-Bridge and Relays Should the motor or sorter stop operating or begin to operate continuously, the most likely cause is a bad relay. The map below shows the location of the relays responsible for different functions. The list of accessories in this manual lists the Lion Precision part number of the relays or they can be purchased from an electrical/electronic supplier. The relays for sorting and adjusting are model OAC-5. Shutdown Relay - 007-4000-0021-00 AC Solid State Relay (Black) - 007-4000-0018-00 DC Solid State Relay (Red) - 007-4000-0024-00 H-Bridge - 025-0000-0547-00 74 Mounting the Panther on a Control Arm Three holes are provided on the bottom of the Panther chassis to provide mounting to an instrument mounting arm. The holes are threaded 1/4 20. Maximum penetration into the gage chassis is 1/2". 7.32 (185.9) Front 3.73 (94.7) 0.00 (0.00) Bottom View inches (mm) 7.03 (178.6) 3.90 (99.1) 0.00 (0.00) 1.20 (30.5) 75 Panther Specifications Power In Standard With 220VAC Power Option Sort & Control Power Output (Output voltage for Sort and Control must be the same) 115 VAC 50/60HZ @ 250 Watts 220 VAC 50/60HZ @ 250 Watts 115VAC Output (Standard on 115VAC Input models) 115VAC 1.5A Continuous 24VAC Output Option (Standard on 220VAC Input models) 24VAC 2.0A Total Continuous 24VAC 3.0A Total 30% Duty Cycle Max 24VDC 1.1A Total 24VDC Output Option Continuous Shutdown Relay Contacts Maximum Gaging Rate Sort Active Time Control Active Time RS232C Serial Communications Baud Data Bits Stop Bits Parity Length Measurements Resolution Recommended Operating Temperature Range Display 125/250VAC 5A 70,000/hour 0.05 – 9.95 Seconds .015 - 3.0 Seconds 9600 8 1 None (Actual values depend on setup) better than 0.0001 inches 50°F - 100°F (10°C - 37°C ) Vacuum Fluorescent 76 Connector Pinouts Probe 3 Way Sort 5Way Sort (2nd Operation) Control Read Shutdown CNC 2-7, 9 are digital inputs and outputs and are low active TTL. A separate document, Using the Panther with CNC Coilers, is available. A B C D A B C A B C D E F A B C A B A B C D 1. 2. 3. 4. 5. 6. 7. 8. 9. Probe Drive (1 MHz) Probe Return +15VDC Ground Over Under Common Over Under Under Good (2nd op.) Over Good (2nd op.) No Connection Common Over Under Common Read Signal +15VDC Norm Closed Contact 1 Norm Closed Contact 2 Norm Open Contact 1 Norm Open contact 2 Probe Voltage (~±3VDC) Over Sort Active (Out) Under Sort Active (Out) Shutdown (Out) Ground Under Control Active (Out) Over Control Active (Out) Good Pulse (NPN Open Collector output, 100mA max) Read In Serial Printer 77 1 n/c 2 Transmit 3 Receive 4 n/c 5 Ground 6 n/c 7 CTS 8 RTS 9 n/c 1 Strobe 2 Data 0 3 Data 1 4 Data 2 5 Data 3 6 Data 4 7 Data 5 8 Data 6 9 Data 7 10 n/c 11 Busy 19-24 Ground Dimensions Weight: 11 lbs / 5 kg 78 Gaging System TWO YEAR WARRANTY The Larson Systems Inc. Gaging System parts and labor are warranted against defects in material and workmanship to the consumer for a period of twenty four months from the date of purchase. The foregoing warranty is exclusive and in lieu of all other warranties whether written, oral, or implied (including any warranty of fitness for purpose). This warranty covers all parts, except consumable items. It applies only to gages and accessories which have been installed and operated in accordance with instructions in our reference manuals, have not been tampered with in any way, misused, suffered damage through accident, neglect or conditions beyond our control and have been serviced only by authorized personnel. Larson Systems Incorporated is not responsible for loss in operating performance due to environmental conditions, such as humidity, dust, corrosive chemicals, deposition of oil or other foreign matter, spillage or other conditions beyond our control. There are no other warranties expressed or implied, and Larson Systems Incorporated shall not be liable under any circumstances for incidental or consequential damage. If it appears within two years from the date of shipment by Larson Systems Inc. that the equipment as delivered does not meet the warranties specified above and the Purchaser so notifies the Larson Systems Inc. promptly, Larson Systems Inc. at its Mpls MN facility, shall correct any defect, including non-conformance with the specifications, at it’s option, either by repairing any defective part(s), or by making available a replacement or required part. Warranty service is conducted at LSI’s facilities in Minneapolis, MN. Return the tester freight prepaid during the warranty period, and Larson Systems Incorporated will make a warranty determination, repair and return the tester freight collect. Shipments sent collect will be rejected. The foregoing shall constitute the sole remedy of the Purchaser and the sole liability of Larson Systems Inc. 79 Larson Systems Inc. 10073 Baltimore Street NE Minneapolis, MN 55449-4425 www.larsonsystems.com 80 763-780-2131 1-877-780-2131 Fax: 763-780-2182 [email protected] 060-1000-0051-00B