1
Chapter 14
Statistical Procedures
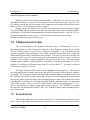
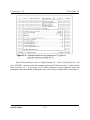
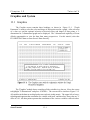
multinormality is not of concern, the Q-Q plot can be replaced by a simpler index plot with
the sample index number running along the horizontal axis and the Mds plotted along the
vertical axis.
•
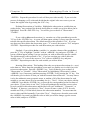
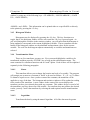
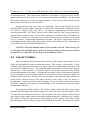
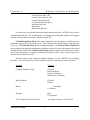
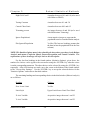
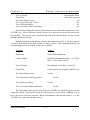
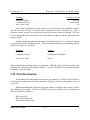
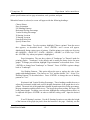
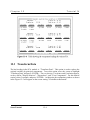
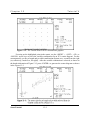
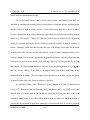
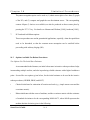
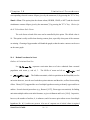
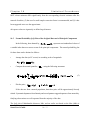
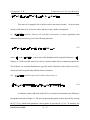
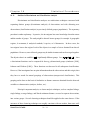
Draw a horizontal line at the
critical value,
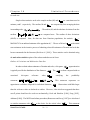
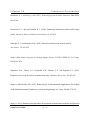
,of Max(Mds), which is given
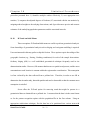
by the following simultaneous confidence ellipsoid:
or
(7)
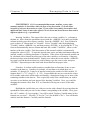
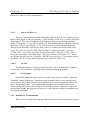
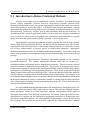
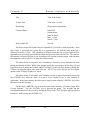
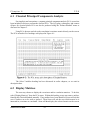
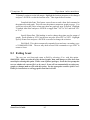
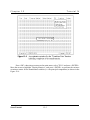
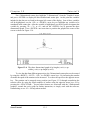
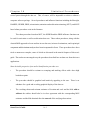
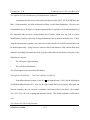
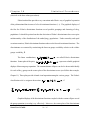
equivalently, using the Bonferroni inequality is given by the statement
.
(8)
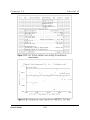
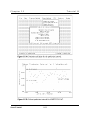
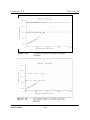
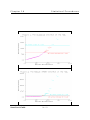
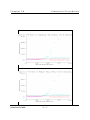
This horizontal line is labelled as "Maximum (Largest Md)" on the Q-Q (or index) plot.
•
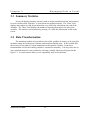
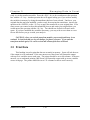
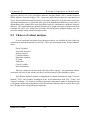
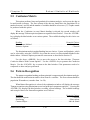
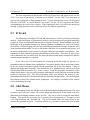
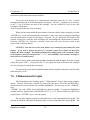
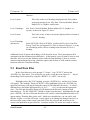
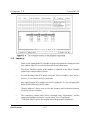
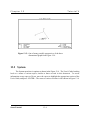
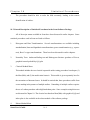
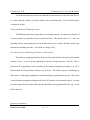
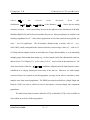
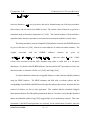
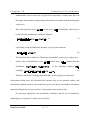
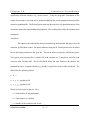
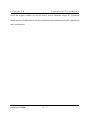
Finally, draw a horizontal line at the
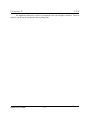
critical value,
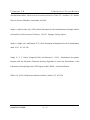
,obtained from the
distribution,
, of the individual distances,
satisfying
(9)
This line is labelled as "Warning (Individual Md)" on the Q-Q plot (or index plot).
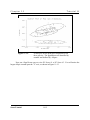
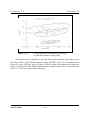
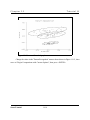
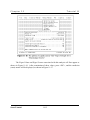
Observations falling above the horizontal line obtained using (8) are potential outliers, and
observations lying between the two horizontal lines given by (8) and (9) need further examination,
and points falling below the line given by (9) represent the main stream of data.
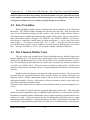
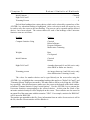
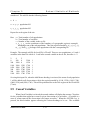
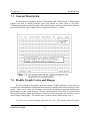
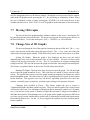
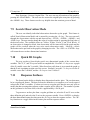
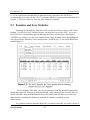
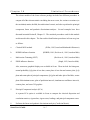
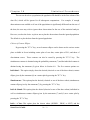
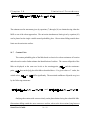
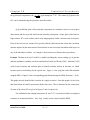
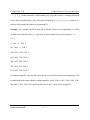
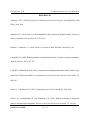
For univariate populations, the simultaneous confidence interval can be obtained by
substituting p=1 in equation (7) and is given as follows.
Scout User's Guide
14-19