1
Chapter 11
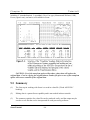
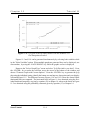
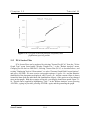
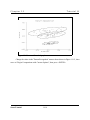
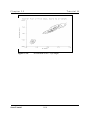
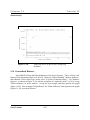
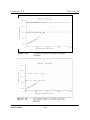
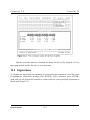
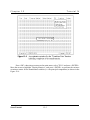
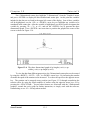
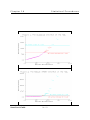
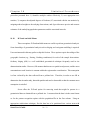
Figure 11-27:
Tutorial III
Index plot for STACKLSS.DAT using Huber
influence.
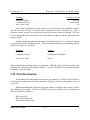
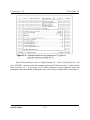
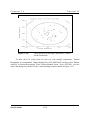
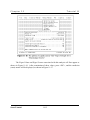
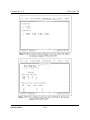
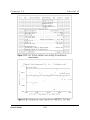
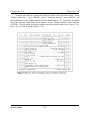
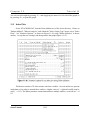
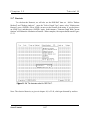
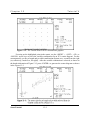
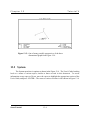
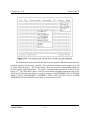
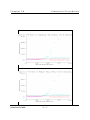
The second Index plot is generated by exchanging "Prop Influence" for "Huber Influence"
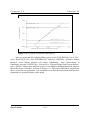
in "Statistics Options". Using "Prop Influence" we increase our ability to unmask multiple
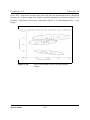
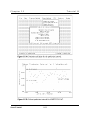
outliers. Accept the new settings, and then generate the graph (Figure 11-28). All of the outliers
(1, 2, 3, 4, and 21) present in this data set are well separated from the rest of the data.
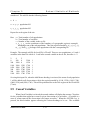
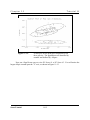
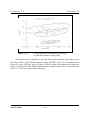
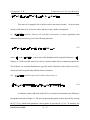
Note: Typically small values of ", such as 0.001 or 0.005, correspond to classical estimates.
It is recommended to try a few different values of " on the same data set. Larger values of "
(0.15, 0.2, etc.) may be needed to unmask multiple outliers, especially in small data sets of large
Scout Toturial
11-24