1
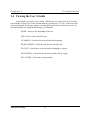
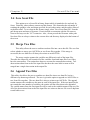
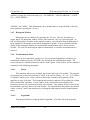
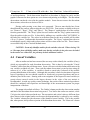
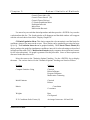
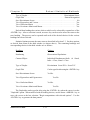
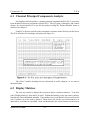
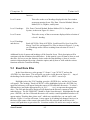
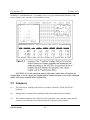
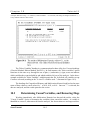
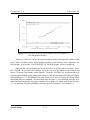
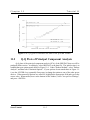
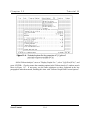
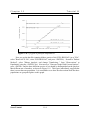
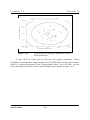
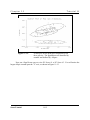
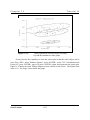
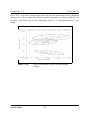
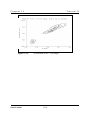
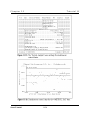
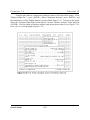
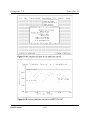
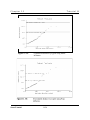
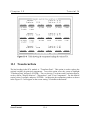
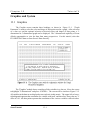
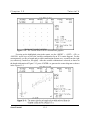
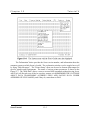
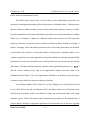
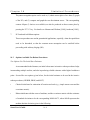
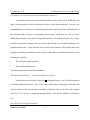
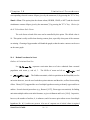
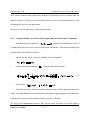
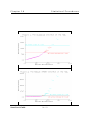
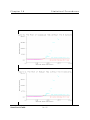
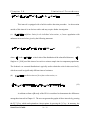
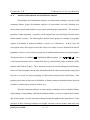
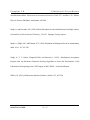
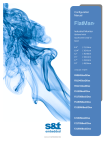
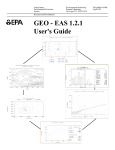
Chapter 11
Tutorial III
Figure 11-8: Q-Q plot of principal component #1.
Next, we use the data file (containg all three species of iris) FULLIRIS.DAT (go to "File",
select "Read ASCII File", select FULLIRIS.DAT, and press <ENTER>). Return to "Robust
Method", select "Robust Analysis, and change "Numbering..." from "Observations" to
Populations" using the <ENTER> key. Next move to "Generate Graph With Current Options",
press <ENTER> and the three different species of iris should be distinguished on the garph as
three different sets of numbers, as shown in Figure 11-9. This figure immediately suggests that
there is more than one population. It is remarkable to see how the observations from the three
populations are grouped togeher on this graph.
Scout Toturial
11-8