1
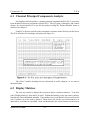
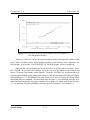
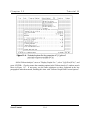
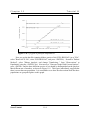
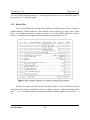
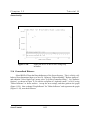
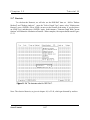
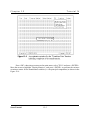
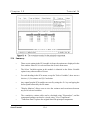
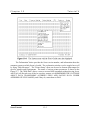
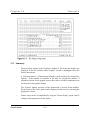
Chapter 10
Tutorial II
The "Remove Outlier Flags" choice is merely a means of unmarking the data that has been
identified as outliers. Once Generalized Distance or Multivariate Kurtosis has identified outliers,
these outliers are colored red in the data file. The "Remove Outlier Flags" choice turns the red
data back to white, the original color of the data. After identifying the outliers with Multivariate
Kurtosis, move the cursor (highlighted rectangle) to the "Data" heading, and select "Edit Data"
(we will NOT be editing the data, merely examining it). Once the data is on the screen, use the
up and down arrow keys to examine the data and identify the red outliers. Now exit "Edit Data",
return to "Classical Method - Remove Outlier Flags", and press <ENTER>. Return to "Edit
Data", re-examine the data, and note that the previously identified outliers are now white.
10.3
Summary
•
Outlier detection on any data set can be accomplished by using one of the two
options in the Classical Method menu of Scout.
•
Each of the two outlier detection headings has three predetermined choices for ";
however, using the "Robust Method", any " between 0.001 and 0.8 can be
selected in the Generalized Distance test.
•
In addition to outlier detection, Scout can be used to identify the variable that
caused the outlier.
•
The outlier flags can be removed by using the "Remove Outlier Flags" option.
Scout Tutorial
10-4