1
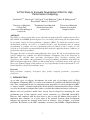
A Pilot Study to Evaluate Development Effort for High
Performance Computing
Victor Basili1,2,3, Sima Asgari1, Jeff Carver1, Lorin Hochstein1, Jeffrey K. Hollingsworth1,3,
Forrest Shull2, Marvin V. Zelkowitz1,2,3
1
University of Maryland,
College Park
{sima,carver,lorin,hollings}@
cs.umd.edu
2
Fraunhofer Center Maryland
{basili,fshull,mvz}@fcmd.umd.edu
3
University of Maryland
Institute for Advanced
Computer Studies
ABSTRACT
The ability to write programs that execute efficiently on modern parallel computers has not been
fully studied. In a DARPA-sponsored project, we are looking at measuring the development time
for programs written for high performance computers (HPC). To attack this relatively novel
measurement problem, our goal is to initially measure such development time in student
programming to evaluate our own experimental protocols. Based on these results, we will
generate a set of feasible experimental methods that can then be applied with more confidence to
professional expert programmers.
This paper describes a first pilot study addressing those goals. We ran an observational study
with 15 students in a graduate level High Performance Computing class at the University of
Maryland. We collected data concerning development effort, developer activities and
chronology, and resulting code performance, for two programming assignments using different
HPC development approaches. While we did not find strong correlations between the expected
factors, the primary outputs of this study are a set of experimental lessons learned and 12 wellformed hypotheses that will guard future study.
Keywords
High performance computing, development effort, parallel computing performance, programmer
productivity
1. INTRODUCTION
As in other types of software development, the usual goal of developing codes in High
Performance Computing (HPC) is to arrive at the solution of a problem with minimal effort and
time. Thus, an important metric for evaluating various approaches to code development in HPC
is “time to solution,” encompassing both the effort required to understand and develop a solution
as well as the amount of computer time it takes to execute that solution and arrive at an answer.
Metrics and even predictive models have already been developed for measuring the code
performance part of that equation, under various constraints (e.g. [Hoisie00, Snavely02]).
However, little empirical work has been done to date to study the human effort required to
implement those solutions. As a result, many of the practical decisions about development
language and approach are currently made based on anecdote, “rules of thumb,” or personal
preference. Researchers in the HPC community associated with DARPA’s High Productivity
1
Computing System (HPCS) project1 have decided that it is important to begin to understand
empirically whether or not the general assumptions that are guiding decision-making are true.
Specifically, HPCS will study:
-
Differences among development approaches, languages, etc. in terms of how they affect
the time to solution of various problems.
-
Differences between novice and expert developers, especially in regard to the level of
expertise necessary in order to effectively create HPC codes of various types. A current
assumption, which should be verified, is that the solutions produced by novices will not
execute as fast as solutions produced by experts and may take slightly longer to build.
However, there is also the issue of whether different combinations of development
approaches and languages make it more difficult for developers to reach the “expert”
level. If only a few experts can effectively develop HPC codes, then the number of
problems that can be solved is greatly limited.
-
The workflows (i.e. series of distinct activities) used to effectively produce HPC codes.
Understanding different types of workflows allows us to give better guidance to novice
developers as well as identify the significant bottlenecks in the process.
As a first step in this direction the members of HPCS are executing a series of empirical studies.
The overall goal is to study the human effort required to develop solutions to various problems
using different HPC approaches and languages. As data is collected about the implementation of
various solutions, the amount of effort necessary for various applications and various approaches
can be characterized. This data will allow heuristics to be developed to decide which
approach(es) should be used in a given environment. These heuristics will provide a more
rigorous basis for making the decisions that are currently being made without empirical
evidence.
This type of empirical research is novel for the HPC community, so we will begin by conducting
some pilot studies to debug the experimental methods and techniques. The eventual goal is to run
a large study in multiple HPC classes at universities across the country. The study described in
this paper is a pre-pilot study aimed at understanding the issues involved and debugging our
methods. The results of this pre-pilot study will allow us to better design the pilot studies so that
the results of the pilots can be used to develop well formed hypotheses to be tested in the full
study. The setting for the pre-pilot study is a graduate level High Performance Computing class
at the University of Maryland. The students in this class for the most part have no previous
experience developing HPC codes but are being taught the basic concepts of HPC code
development, so it is an ideal place to begin evaluating the performance of novice HPC
developers.
2. BACKGROUND
2.1 Time to Solution
In developing HPC software, time to solution is an important metric. For many applications, the
value of a result goes down considerably if it cannot be obtained by a deadline. Two main
components make up the time to solution metric. The first component is the human
1
[http://www.darpa.mil/ipto/programs/hpcs/index.htm]
2
effort/calendar time required to develop and tune the software. The second component is the
amount of machine time required to execute the software to produce the desired result.
Currently in the HPC community, human effort is often not empirically measured as rigorously
as execution time. Both development time and execution time play crucial roles in the overall
time to solution, so we believe that empirically measuring development time is important. This
study was an initial attempt at understanding the effort required to develop HPC software.
2.2 Tradeoff between execution time and development time
An important goal in HPC research is to reduce the time to solution, by reducing either the
development time or the execution time or both. One of the major differences between HPC
software development and traditional software development is the amount of effort devoted to
tuning HPC code for performance. It is widely believed that more time spent tuning the code will
result in shorter execution times. Therefore, understanding the tradeoff between time spent in
development and execution time is crucial. For large-scale systems, the extra development time
can lead to orders of magnitude reduction in execution time.
The overall idea is to determine the optimal values for development time and execution time,
such that time to solution is minimized. These values will differ based on the circumstances of
use for the software. If the code will be executed many times, then the cost of increased
development time can be amortized across multiple runs of the software and balanced against the
cumulative reduced execution time. Conversely, if the code will only be used once, the benefit of
increased effort tuning the code may not be as large.
3. GOALS AND DESIGN OF EXPERIMENT
3.1 Goals
As a pre-pilot study, the goal of this study was to debug the experimental protocols and data
collection mechanisms for later studies.
G1 – Analyze the experimental protocols and data collection mechanisms with respect
to usability from the point of view of the researcher.
G2 – Characterize the code development workflows of the subjects from the point of
view of the researcher.
G3 – Characterize the performance of the code from the point of view of the developer.
3.2 Objects of Study
The goals stated above are related to two very different types of object of study: G1 aims at
improving future studies by focusing on the experimental protocols themselves, while G2 and G3
focuses on the results of using specific HPC development approaches.
3.2.1
Empirical Research Object of Study
When we talk about studying “experimental protocols,” we specifically mean:
- The set of information measured about subjects and the HPC codes they produce (e.g.
subjects’ amount of background in HPC development, amount of speedup achieved by
the code compared to the serial version);
3
3.2.2
The metrics used to quantify that information (e.g. number of HPC-related courses taken
by a subject or number of years with development experience, number of seconds taken
by the program to return with a correct solution to the given problem);
The mechanisms used to collect that information (e.g. a form with open-ended questions,
interviews with subjects, automatically-generated compiler logs).
HPC Research Object of Study
In this study, two different programming approaches were compared, MPI and OpenMP. For
MPI the subjects used the C programming language. For OpenMP the subjects used Fortran. This
arrangement means that effects due to differences in programming language will be confounded
with the differences between programming approaches.
Message Passing Interface (MPI)
MPI [MPIForum] is a portable, scalable programming approach that can be used on both
distributed-memory multicomputers and shared-memory multiprocessors. The MPI standard
specifies various aspects of the communication patterns among a set of processes operating
together as a unit. MPI specifies the format of the messages passed between processes as well as
defining process groups to allow for more powerful functionality [Dongarra96].
The subjects used MPI for the first assignment. This approach involves understanding the
problem, developing a serial (one processor) solution to the problem, modifying that solution to
work on multiple processors in parallel, and tuning the solution to improve its performance
(execution time).
OpenMP
OpenMP is a shared-memory programming model. OpenMP takes advantage of the ability to
directly access shared memory throughout the system along with fast shared-memory locks
improve on the complexity of the MI approach. OpenMP is useful for quickly parallelizing
existing code and for developing a broad set of new applications. OpenMP uses compiler
directives and callable runtime libraries to implement the necessary control structure, data
environment and synchronization [Dagum98].
3.3 Research Questions
We refined the experimental goals in Section 3.1 into more specific research questions as
follows:
For G1 (analyzing experimental protocols):
- Q1: Are the tasks given to subjects in the experiment adequate for providing the
necessary information about the development approaches used?
- Q2: Is the data accurate?
- Q3: Is all of the necessary data collected?
For G2 (characterizing development workflows):
- Q4: What is the order of the activities performed by the subjects?
- Q5: How much effort was expended in performing each activity?
- Q6: Is there a relationship between a subject’s background and his/her workflow?
4
For G3 (characterizing code performance):
- Q7: What is the performance of the code?
- Q8: Is there a relationship between a subject’s background and the performance of his/her
code?
- Q9: Is there a relationship between the workflow used and the performance of the code?
3.4 Metrics
In order to help answer the questions above, metrics were collected concerning the background
of subjects, the effort expended by the subjects, the work processes used, and the execution time
of the resulting codes. Metrics are described here according to the means by which they were
collected, since the data collection mechanisms used are expected to affect the feasibility of the
experimental protocols (studied in G1).
3.4.1
Manually collected metrics
We developed a series of forms that subjects can use to report their effort and background
information. Some key variables we asked for include:
o Educational background (related to HPC development);
o Native language;
o Prior development experience (overall software experience as well as parallel-specific
experience);
o Problem domain experience.
A copy of the full background questionnaire can be found in Appendix A.
Perhaps most importantly, we created a log form that subjects are asked to use to keep track of
the effort spent on the project over time and the various tasks they performed with that effort:
o Thinking/planning
o Coding a serial implementation/Reading and understanding the serial code
o Parallelizing the serial implementation
o Tuning the parallel code
o Testing the code
o Other
In one of the treatments, the subjects started from an existing serial implementation rather than
developing their own. Thus option 2 varied slightly between the two treatments. The form the
subjects were asked to complete can be found in Appendix B.
3.4.2
Automatically collected metrics
To have a more objective way to collect data about effort and activities, we created a wrapper for
the compiler (two versions were necessary with slight tailoring, to take into account different
programming languages and different file structures) and for the job submission program. When
either the compiler or the job submission program is invoked, the wrapper logs a timestamp, the
user’s name, and any flags sent, before passing execution to the intended program. Additionally,
when the compiler is invoked the wrapper logs the entire source file, and the user must choose
the reason for compilation from a short menu consisting of:
1. Adding functionality (serial code)
5
2. Parallelizing code
3. Improving performance (tuning)
4. Debugging: Compile-time error on previous compile
5. Debugging: Crashed on previous run (segmentation fault)
6. Debugging: Hung on previous run (deadlock, infinite loop, etc.)
7. Debugging: Incorrect behavior on previous run (logic error)
8. Restructuring/cleanup (no change in behavior or performance)
9. Other
The reason chosen is stored along with the other information captured for that compile. Post-hoc
questionnaires and interviews with subjects confirmed most subjects did not perceive the
instrumentation as notably onerous.
Aside from being asked to choose the reason for compilation, the behavior of the wrapped
programs is indistinguishable to the user from their normal operation.
We are currently experimenting with ways to incorporate the automatic collection tools into a
package that will be available for other researchers to use with minimal tailoring required.
3.4.3
Execution Time
At the conclusion of the assignments, the subjects were required to execute their final code on
clusters of size 1, 4 and 8 and report the execution time for each configuration. In addition to
these numbers, because we captured the intermediate source code versions, execution time
numbers could be computed for any intermediate versions.
3.4.4
Post-study Follow-up
An important source of data is the qualitative feedback that subjects can provide upon
completion of the study. This data was collected through two methods, questionnaires and
interviews. The questionnaire was distributed to every subject at the completion of the study.
Some subjects volunteered to participate in an interview with the researchers where their answers
could be explored in more depth.
A copy of the post-experiment questionnaire can be found in Appendix C.
4. THE EXPERIMENT
4.1 Experimenters
This experiment was a collaboration between researchers who were experienced in empirical
studies in software engineering, from the University of Maryland and the Fraunhofer Center
Maryland, and researchers in the area of High Performance Computing, also from the University
of Maryland.
4.2 Subjects
The 15 subjects were students in a graduate level High Performance Computing class (CMSC
714) in the Fall semester of 2003 at the University of Maryland.
As there were important pedagogical goals to be met in this environment, one of our constraints
in designing this study was to cause as little interruption as possible to the normal classroom
activities and material.
6
4.3 Materials
In this study, two approaches to developing HPC software were used, MPI and OpenMP
(described in Section 2.3). Two development problems were selected for the application of those
approaches. All subjects used MPI on the Game of Life problem and OpenMP on the SWIM
benchmark.
The actual assignment descriptions given to the students (including problem description, grading
criteria, etc.) are included in Appendix D.
4.3.1 The Game of Life
The game of life is a simulation of cellular automata. The game is played on a rectangular board
containing cells. At the beginning of the game, some cells are occupied and the rest are empty.
The game consists of constructing successive generations of the game board. The rules for
constructing the next generation from the previous generation are:
1. Death: cells with 0,1,4,5,6,7, or 8 neighbors die (0,1 of loneliness and 4-8 of
overpopulation)
2. Survival: cells with 2 or 3 neighbors survive to the next generation
3. Birth: an unoccupied cell with 3 neighbors becomes occupied in the next generation.
The game board has a fixed size, and the subjects were given the layout of the first generation
and instructed on how many generations to iterate through. The subjects were given the
specification for this problem and required to develop a parallel solution from scratch.
4.3.2. SWIM Benchmark
This is a benchmark weather prediction program for comparing the performance of current
supercomputers. The model is based on a paper by Sadourny [Sadourny75]. The subjects were
given a sequential version of the program and instructed to parallelize it.
4.4 Procedure
4.4.1
Collection of Background Information
At the beginning of the study, the subjects were given a survey to collect their background and
prior experiences in relevant HPC fields. This data was used during the data analysis process.
The questionnaire can be found in Appendix B.
4.4.2
First assignment
The subjects were next trained in the first method for developing HPC software, MPI. This study
was conducted as part of an existing HPC class, so the training was done at the normal lecture
time by the course instructor, Dr. Jeffrey K. Hollingsworth. The training lectures were similar to
those given in previous semesters of this class. In addition to this training in the HPC approach,
another member of the research team trained the subjects on how to fill out the forms for the
study and the types of information that must be provided.
After the training, the subjects were given the Game of Life problem to implement as a
homework assignment. As part of the homework assignment, the subjects were required to keep
track of their effort on the form described in Section 3.3.1. In addition, some information was
recorded each time the subjects submitted their program to the compiler, as noted in Section
4.4.2. Subjects were given approximately two weeks to develop the solution. As part of the
7
assignment, the subjects were required to run their solution on machines with varying numbers
of processors (1, 2, 4 and 8) and record execution time metrics for submission with their code.
4.4.3
Second assignment
After completion of the first homework assignment, the subjects were trained in the second HPC
technique, OpenMP. This training was very similar to the training for the first method and took
one class period. The subjects were then given a second homework assignment containing a
description of the SWIM problem. The subjects were given a serial solution to the problem and
required to add OpenMP directives to the code to parallelize it and improve the performance. As
in the first assignment, the subjects completed a form to track their activities and had information
collected automatically at compile time. Subjects were also given approximately two weeks to
develop the solution. Also similar to assignment 1, the subjects were required to submit
execution metrics for various numbers of processors.
4.4.4
Post-hoc analysis
After the completion of the two homework assignments, the subjects were given a questionnaire
to discuss their experiences with the assignments and with the study in general. The goal of this
questionnaire was to allow the researchers to collect some qualitative data from the subjects. The
subjects were asked about their experiences using the techniques and given a chance to provide
feedback to the researchers. A sample of the questionnaire can be found in Appendix C. Finally,
some of the subjects agreed to be interviewed by the researchers. These interviews allowed us to
better understand some of the responses to the questionnaire and explore the issues in more
depth.
5. Results
5.1 Results about experimental protocols
Recall that our first experimental goal G1 was decomposed into three specific research
questions:
- Q1: Are the tasks given to subjects in the experiment adequate for providing the
necessary information about the development approaches used?
- Q2: Is the data accurate?
- Q3: Is all of the necessary data collected?
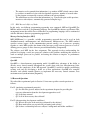
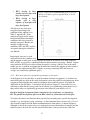
To validate the accuracy of the data (Q2), we tried to correlate the results from the manual and
automatic collection methods. Unfortunately, in doing so we found wide discrepancies. The
correlation was done initially by making estimates about the total effort spent by subjects based
upon the timestamps recorded in the automatically-generated logs. For each subject, the time
between any two events (either compiles or runs) in the log was calculated. If the time interval
was less than a specific threshold (in this analysis we used 45 minutes), that interval was added
to the subject’s effort total. As shown in Figure 1, no correlation between this estimate and the
manually-reported data is detectable.
Furthermore, no such correlation was detected even after we accounted for the fact that
significant amounts of work might have been done off of the instrumented cluster. To make the
estimate more accurate, emails were sent to students after the experiment asking them to estimate
what percentage of their development effort had been spent on the instrumented machine. Based
8
Figure 1: Manually reported total effort vs. automatically-collected total effort
on these percentages, the instrumented effort was adjusted, but there was still no correlation
detected with the manually-reported effort.
Puzzled by this discrepancy, we investigated whether the days on which effort was spent,
reported in the manual data, matched the days recorded in the timestamp logs. We found several
discrepancies, which were not consistently associated with particular subjects and which did not
have a consistent duration. Also, there were no obvious “holes” in the timestamp logs when no
data was recorded for any subject. The only remaining explanation seems to be that subjects
were simply inconsistent in their effort reporting.
This lack of accuracy and our inability to provide a clearer picture of subject activities seems to
indicate that a different method of subject interaction and a different set of data to be collected
may be necessary (Q1 and Q3). This answer has led us to hypothesize some improvements to
experimental protocols necessary in future studies:
o One possibility will be to investigate whether we can develop mechanisms for better
process conformance to the data collection procedures (for example, by not letting
subjects submit their program until all previous data has been submitted).
o Another possible solution is to analyze the activity data in greater detail, incorporating
assumptions about chronological order in order to make better estimates about the task
being undertaken. For example, a lot of compiles in rapid succession would suggest
debugging, while alternating between compile and execution or multiple executions in
quick succession might suggest testing of the code. More ambitiously, if we can pinpoint
the differences between successive versions of the code, we can develop heuristics about
the activity that was ongoing in that time period. For example, if the delta contains no
9
editing on statements involving parallel operations, then we can infer that the subject was
doing serial coding.
o It may also be the case that we simply need to collect more or different data. Philip
Johnson’s tool HackyStat [Johnson] is one possible answer we are exploring. It can be
tailored to work with a number of different editors, and reports the amount of time an
editor is “live,” providing a better baseline of overall effort. However, we haven’t found a
way to cross-index this with specific tasks yet (e.g. to know when a subject is
parallelizing vs. tuning code). We are also considering the use of an extensible IDE, like
Eclipse [Eclipse], that would allow us to collect more accurate data.
A second major issue that we discovered regarding the completeness of data collection (Q3) is
the need to distinguish between the final serial version and the beginning of parallelization. In
this study, the students were only asked to submit the final (parallel) version of their code. While
we did capture intermediate versions via the compiler instrumentation, we could not definitively
determine which version was the final serial version. There were two types of desirable data
analyses that could not be accurately performed because of the lack of this separation of serial
activities and parallel activities.
First, the execution time (performance) of a subject’s serial code needed to be compared to the
execution time of his or her parallel code run on various numbers of processors. This analysis is
used to determine the amount of speedup achieved by the subject. Because we did not have a
serial version of the code, we had to approximate this metric by using the performance number
of the parallel code run on only 1 node.
Second, in our analysis, we often wished to separate out the effort expended during serial coding
from the effort expended during parallel coding. The manually reported effort data, which did
separate the serial and parallel activities, was not very reliable. So, in order to have an accurate
separation, we needed to be able to separate the effort captured via the compiler instrumentation
into serial effort and parallel effort. Because the serial code was not submitted, giving us a
definitive end date for serial coding, we had to develop an algorithm to approximate the point at
which serial coding stopped and parallel coding began.
Based on the above observations from this study, we formulated our provisional results as a
series of lessons learned to increase the ease with which we can plan future studies:
Lesson 1 – Separate the serial coding and parallel coding into two assignments.
For future studies, we suggest splitting the coding assignments into parts. In the first part, the
subjects are instructed to solve the problem by writing a serial program. Once the serial program
is completed and submitted, then the subjects can begin working on parallelizing the serial code
already created.
Lesson 2 – Account for uncollected data when subjects work on uninstrumented machines.
As we began to analyze the automatically collected data, it became obvious that many of the
subjects did some of their work on machines that were not instrumented to collect data
automatically. In hindsight this occurrence is not surprising but it is something that was not
accounted for during the planning and design of the study. The automatically collected data
indicated that many of the subjects did not begin working on the instrumented machines until
10
they needed either the MPI compiler or the use of multiple processors to test their parallel code.
To make matters more complex, an MPI version of the C compiler is standard on most Linux
implementations, so a student with access to a Linux machine could effectively finish the project
before submitting a final run on the instrumented HPC system. This observation means that the
automatically collected data was not collected for much of the serial development step and
potentially for the parallel tuning effort.
There are two possible solutions to this problem for future studies. First we can ask the subjects
to work only on the instrumented machines, thereby allowing us to automatically collect data for
all of their development work. Secondly, we can develop a small script that subjects can install
on any other machine on which they work that will collect the same data as the script on the
main machine. Neither of these solutions is ideal, so we are continuing to pursue other solutions
to this problem.
Lesson 3 – Manually reported data is suspect.
Because we were unable to correlate the manual and automatic data collection in a meaningful
way, we treat the automatically collected data as more accurate, since this data was objective
(not reliant upon subjective reporting by humans), unobtrusive (not interfering with normal work
processes) and automatable (not dependent upon active reporting by human). Subjects were
aware they were being monitored, but not aware of what was being observed or why. This
included not only the log of compilation and execution activities, but also a database that was
created containing captured source code and test data used throughout the development process.
Following from Lesson 3,
Lesson 4 – Data collection and analysis should be as automated as possible.
Of course, a central weakness of automated collection is that while the data can tell us what was
done on the computer, it doesn’t provide information about how those activities contribute to the
decision making process in code development. A key research goal is to increase the usefulness
of the data collected from automated mechanisms without making it more obtrusive to the
developer.
5.2 Results about development workflows
For G2 (characterizing development workflows) we can address each of the research questions
separately.
5.2.1
What is the order of the activities performed by the subjects?
To analyze the order of the activities performed by the subjects (Q4) we looked first at the
automatically-collected data. The timestamp data allowed us to understand the chronological
series of events and look for various workflow patterns in how subjects attacked the problem.
Specifically, we wanted to see the relation between the effort spent on serial versus parallel
coding, and on functional development versus performance tuning. To do this, we mapped the
data recorded in the log (especially focusing on the “reason for compilation,” whose possible
values were described in Section 3.4.2) to a smaller set of activity types: If the user explicitly
gave "serial", "parallel", "tuning", restructuring", or "other" as the reason for compiling, then that
was simply used as the activity category. Runs were classified as "testing". If the user was
11
Figure 2: Chronological sequence of development activities (serial development, parallel
development, testing, tuning, restructuring, other) over time. WF1 shows a pattern of
developing and testing in small increments; WF2 shows development in small increments
followed by a long sequence of testing; WF3 shows development in large increments followed
by testing of each; WF4 shows development in large increments followed by a long sequence
of testing after each.
WF1)
WF2)
WF3)
WF4)
debugging, then the event was classified based on the previous event (e.g. if the previous event
had been serial, then the debugging was classified as serial work, if the previous event had been
parallel, then the debugging was classified as parallel work, etc.).
The data does show some high-level patterns. For example, Figure 2 illustrates each of four
different styles of iteration through the key tasks of adding serial functionality, adding parallel
code, testing, and performance tuning.
By categorizing similar workflows based on data from the study, we formulate the hypothesis:
H1: There are four workflows for parallel programming:
o WF1: develop and test in small increments,
o WF2: develop in small increments with a long sequence of tests after that,
12
o WF3: develop in large
chunks and test after each
large development,
Figure 3: Box plot of ADDITIONAL effort (in personhours) each subject spent on parallel than on serial
development.
o WF4: develop in large
chunks with a long
sequence of tests after each
large development
All subjects in the study were
categorized according to the
workflow he/she exhibited (see
Table 2, Appendix E). Some
subjects who appeared to switch
back and forth between multiple
workflows had to be grouped in
multiple categories. Because the
majority of subjects used
workflows WF1 and WF2, analysis
of contrasts among the workflows
was difficult.
Interestingly, there was a weak
relation between the workflow used
and the amount of effort used overall. Because the majority of subjects used either workflow
WF1 or WF2, we tested for a significant difference between those two groups. “Hybrid” subjects
using workflow WF1/2 were removed from the analysis, leaving 9 subjects. Due to the small
sample size we set α=0.10, and found that the difference between the amount of effort required
for parallel development using WF1 (15 hours on average) and using WF2 (6.6 hours on
average) was statistically significant (p=0.1).
5.2.2
How much effort was expended in performing each activity?
At the highest level of generality, we used the manual data from assignment 1 to describe how
much effort subjects spent on the serial development versus the parallel development parts of the
assignment. Expecting that the parallel development effort would be greater, we plotted the
differential of (parallel effort – serial effort) for all subjects (Figure 3). A one-tailed test was
sufficient to show that the average value for all subjects was significantly greater than zero (i.e.,
that parallel effort was significantly greater than serial effort for each subject; z=3.18).
Based on data from assignment 1 and a statistical test for significance, we hypothesize:
H6: The parallel development effort on an HPC solution is greater than the serial effort.
To analyze the relative and absolute effort expended in performing more specific development
activities (e.g. developing, testing, executing), we first summarized the automatically collected
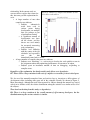
data from the compiler and job submit instrumentation for each subject, as shown in Figure 4.
Although we had at first expected to see a rough parity between the number of compiles and the
number of times the code was run, the data show that there is not necessarily any such clear
13
relationship. In the current study we
Figure 4: Number of compiles and number of runs
were not able to explore the reasons for
logged for each subject.
this, but some possible explanations do
exist:
o A larger number of runs than
compiles may indicate:
o Subjects
exhaustively
tested their code at
various points during
development, on multiple
data sets, perhaps as part
of performance tuning.
o A significant amount of
development was done
off the cluster, and the
cluster was used mainly
for accurately measuring
code performance.
o Subjects had difficulty
with the syntax of the job
scheduler and repeatedly
sent
jobs
that
immediately came back as errors.
o A larger number of compiles than runs may indicate:
o Subjects were “thrashing,” i.e. were trying to develop the code quickly to turn in
the assignment rather than optimizing performance or correctness of output.
o Subjects spent an inordinate amount of time on debugging, responding to
compiler errors.
Regardless of the explanation, the data from this study allows us to hypothesize:
H7: There will be a large variation in the ratio of compiles to executions for novice developers.
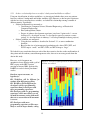
We also used the manually-completed time and activity logs to investigate a fuller picture of
development effort, including time spent off of the computer. Results are shown in Figure 5.
Most interestingly, although the total effort reported by subjects through the manual logs varied
widely in its absolute value, the relative distribution among the activities was similar across all of
the subjects.
Thus based on the data from this study, we hypothesize:
H8: There is a large variation in the overall amount of effort among developers, but the
distribution among the various activities is similar.
14
5.2.3
Is there a relationship between a subject’s background and his/her workflow?
Using our classification of subject workflows, we investigated whether there were any patterns
between a subject’s background and his/her workflow (Q6). Because we had no prior experience
with the best way to measure these variables, we looked for relationships among a number of
different metrics. Specifically,
o Subject background was measured as:
o Current major (Computer Science, Electrical Engineering, or Electrical &
Computer Engineering)
o Prior (undergraduate) major
o Degree of software development experience (rated on a 5-point scale: 1 = never
developed; 2 = developed on own; 3 = developed as part of a team on a course
project; 4 = developed once in industry; 5 = developed multiple industry projects)
o Subject workflow was measured:
o Using the four workflows described in Section 5.2.1, or some combination
therefore.
o Based on the size of an increment of production code, where WF1, WF2, and
WF1/2 map to “small,” and WF3, WF4, and WF3/4 map to “large.”
We looked for any correlation between each of the above metrics, but due to the small number of
data points and the tendency toward homogeneous value, there were no strong results from the
data in this study.
However, we did augment our
quantitative data collection with a poll of
HPC experts at the HPCS project
meeting in January 2004, sponsored by
DARPA, in order to better plan future
studies.
Figure 5: Percent of effort spent on each development
activity, per subject.
Based on expert consensus, we
hypothesize:
H2: Workflows will be different for
students from different programs.
H3: Workflows will be different for
developers with less programming
experience than for developers with
more programming experience.
H4: Developers with less programming
experience will be more likely to work
in small increments, testing with small
data sets to ensure that each increment
is correct.
H5: Developers with more
programming experience will be more
likely to work in larger chunks, coding
15
more functionality before testing.
Formal testing of these hypotheses awaits further study.
5.3 Results about code performance
Our experimental protocols did allow us to accurately measure the performance of the code (Q7),
using a number of different metrics including both the absolute time to solution, speedup
achieved by the parallel version.
Figure 6 does show that there were characteristic differences in the amount of speedup
achievable using OpenMP and MPI in this study. However, it is necessary to recall that the use
of each of these HPC approaches is entirely confounded with factors such as the programming
assignment given and the programming language used – each of which is at least an equally
plausible explanation for any observed differences. Therefore we draw no conclusions from this
analysis, but include it as an example of the type of analysis that is feasible and desirable from
future studies.
Based on the expert opinion poll of HPC researchers (described in Section 5.2.3), we
formulate the following hypotheses to help focus such future studies:
H9: For a specific problem, the mean performance of MPI programs will be higher than the
mean performance of OpenMP programs
H10: For a specific problem, the median MPI performance will be lower than the median
OpenMP performance
Figure 6: Degree of speedup achieved for MPI and
H11: For a specific problem, the max
OpenMP development assignments.
MPI performance will be higher than the
max OpenMP performance
H12: For a specific problem, the amount
of effort required to parallelize the MPI
code will be greater than the amount of
effort required to parallelize the OpenMP
code, but the speedup of the MPI code
will be greater than the speedup of the
OpenMP code
Next, using the data from assignment 1
only, we segmented the subjects based on
experience levels, and then analyzed the
mean level of performance for each subgroup to investigate whether there was a
relationship between subjects’
backgrounds and performance they were
able to achieve (Q9). We examined several
ways of measuring each of those variables,
including:
o For subject experience:
16
o Experience in C development (industrial experience, no industry experience)
o Experience with general software development (industrial experience, no industry
experience)
o Experience with parallel programming (some, none)
o Experience with MPI (some, none)
o Experience with the problem domain, the Game of Life (some, none)
o Whether the subject had taken a class in operating systems (yes, no)
o For performance:
o Time for serial program to produce a solution
o Speedup on 2 processors
o Speedup on 8 processors
In no case did we find a clear and compelling pattern of different results for the two groups.
Therefore, we recognize the identification of useful ways of measuring experience as an open
question for future work, possibly requiring more data points and a more heterogeneous
population.
We also looked for correlations between the workflow used and the performance of the resulting
code (Q9). As in Section 5.2.3, workflow was measured alternately as WF1-WF4, or as “small”
or “large” increments. As above, performance was measured as serial time, speedup achieved on
2 processors, and speedup on 8 processors. No correlation was found between any measure of
workflow and any measure of performance.
6. Threats to Validity
As has been discussed earlier, the overriding threat to the validity of our results concerning the
HPC development approaches lies in the design of the experiment itself: Because we did not
systematically vary the various factors in the experiment, we cannot determine whether any
difference in performance on the two treatments was do to the development approach, the
programming language, or the order of treatments. For this reason, our analysis of results has
been careful to avoid drawing conclusions about any of these factors, focusing instead on our
analysis of the experimental protocols. We do hope, however, that the data collected in this study
can be the beginning of a larger baseline built up about HPC approaches, and can provide points
of comparison against future data collection.
Even within these constraints, however, we identified various threats to internal validity that we
made an effort to control:
o Learning effects – Especially as they were novices, there is a danger that subjects may
behave differently on treatment 2 than on treatment 1 due to learning more about HPC
development and hence changing their approaches. We did our best to minimize this
danger by not giving subjects their grades or other feedback on treatment 1 before they
had completed treatment 2.
-
Instrumentation – There is the additional danger that, if the development environment
differed from one subject to the next, results concerning code performance and
development effort may have also been impacted by this. Some of the potential sources
of variation we could control – for example, because the final submitted code had to be
run by the course instructor, all codes (at least in their final versions) called the same
HPC libraries and used the same development language. On the other hand, as we
17
discussed in Section 5.1, it became apparent that it was quite easy to recreate the same
development environment on hardware outside our control, a potentially more
threatening problem especially with respect to completeness of data collection.
Mitigation strategies for this problem are considered in Section 5.1.
7. CONCLUSIONS
The specific output of this pilot study consisted of 4 lessons learned for HPC study design and 12
well-formulated hypotheses (based on a mix of data collected from this study and expert
opinion), both of which will be used to guide future experimentation in this program.
Incorporating these results, we have already begun running a set of new studies in classroom
environments, the expected result of which will be data well suited to exploring the effects of
different HPC development approaches on different problem types. Some data will come from
the same subjects performing different types of tasks; others will reflect the same task addressed
by subjects in different environments and with different backgrounds and skill levels. These data
sets will form the basis of future data needed to explore the relationships among our phenomena
of interest.
The ultimate goal of this work is to run full fractional factorial experiments with HPC code
development professionals, to investigate specific hypotheses resulting from our earlier pilot
studies with the most rigor. In such an experiment, we envision that subjects will use two or
more parallel programming approaches to implement different benchmark applications. The
order of the approaches and benchmarks can be varied to combat the effects of subjects learning
from one assignment to the next. Such an experiment will help us to better quantify the tradeoffs
between the different approaches for different types of benchmarks.
To do that, we will be able to reuse the refined instrumentation and our experience with
empirical study designs and HPC environment data collection mechanisms, which we have been
experimenting with in the meantime.
The end result of such studies will be well-formulated and tested heuristics concerning the
aspects of human developers, HPC architectures, and code development practices that work
together to influence the time to solution of problems being tackled using HPC approaches. That
knowledge, in turn, is necessary to be able to plan and meet the current and increasing challenges
in a number of important scientific fields.
8. ACKNOWLEDGEMENTS
This work is sponsored by the DARPA High Productivity Computing Systems program.
9. REFERENCES
[Dagum98]
L. Dagum and R. Menon, "OpenMP: An Industry-Standard API for SharedMemory Programming," IEEE Computational Science & Engineering, 5(1), 1998,
pp. 46-55.
[Dongarra96] J. J. Dongarra, S. W. Otto, M. Snir, and D. Walker, "A message passing standard
for MPP and workstations," Communications of the ACM, 39(7), 1996, pp. 84-90.
18
[Eclipse]
Eclipse.org. http://www.eclipse.org/
[Hoisie00]
A. Hoisie, O. Lubeck et al., "A General Predictive Performance Model for
Wavefront Algorithms on Clusters of SMPs," Proc. ICPP 2000, 219-229.
[Johnson]
P. M. Johnson. Hackystat system. http://csdl.ics.hawaii.edu/Research/Hackystat/.
[MPIForum] Message Passing Interface Forum, http://www-unix.mcs.anl.gov/mpi/mpistandard/mpi-report-2.0-sf/mpi2-report.htm
[Sadourny75] R. Sadourny, “The Dynamics of Finite-Difference Models of the Shallow-Water
Equesations.” Journal of Atmospheric Sciences, 32(4), 1975.
[Snavely02]
A. Snavely, L. Carrington, N. Wolter, J. Labarta, R. Badia A. Purkayastha, “A
Framework for Application Performance Modeling and Prediction,” Proceedings
of SC2002, IEEE, Nov. 2002.
19
Appendix A – Experience Questionnaire
Appendix A – Experience Questionnaire
Experience Questionnaire
CMSC 714
Name
Current Major
Undergraduate Major
General Background
Please estimate your English language background:
I am a native speaker
I am not a native speaker [Please complete the following]
TOEFL Score
Year
My English reading comprehension skills are:
Low
Medium
High
My English listening and speaking skills are:
Low
Medium
High
How many courses have you taken at Maryland?
Please indicate if you received a grade of A or B in the following classes (or equivalent) at the undergraduate
and graduate level. [This information will be used for classification purposes only].
Passed Undergraduate
Class with an A or B
(Y/N)
Passed Graduate
Class with an A or B
(Y/N)
Computer Architecture
Operating Systems
High Performance Computing
Software Engineering
What is your previous experience with software development in practice? (Check the bottom-most item that
applies)
I have never developed software
I have developed software on my own
I have developed software as part of a team, as part of a course
I have developed software as part of a team one time in industry
I have developed software as part of a team more than one time in industry
20
Appendix A – Experience Questionnaire
Please explain your answer. Include the number of projects you have worked on. Include the approximate
size and duration of each project and the type of project. (E.g. "I worked on a 100,000 line telecommunication
project for 5 years"; "I developed a 1000 line class project"; "I worked on a 5000 line parallel software project
for 1 year"; etc.)
High Performance Computing Experience
Please rate your experience in the following activities. For Experience Level use the following scale:
0 = No experience (Leave Extra Information blank)
1 = Classroom experience only
Extra Information should indicate whether you:
a) only learned the concept in class
b) used the concept on a homework
c) used the concept on a project
2 = Professional experience
Extra Information should indicate the number of projects on which you performed the activity
Experience
Level
Extra Information
Parallel Programming
Developing software in C
Developing software in C++
Developing software in Fortran
Developing software in other languages
Developing software on a Unix platform
Using MPI
Using OpenMP
Tuning code for parallel performance
Experience in Problem Domains
We will use answers in this section to understand how familiar you are with various systems we may use as
examples or for assignments during the class.
Have you ever implemented solutions to the following problem:
Y/N
The Game of Life
21
Appendix B – Effort Collection Forms
Appendix B – Effort Collection Forms
CMSC 714
Effort Report Form – Assignment 1
Each time you work on the homework assignment, please have this form with you and record the time
spent (round to nearest 15 minutes) and the activity that you were doing. Place a check or an X in the
appropriate column to describe your activites. For example, if you spent 30 minutes thinking about the
solution and then 1 hour writing serial code, you would make two entries. The first would be .5 hours of
thinking. The second would be 1 hour of Serial Coding.
Remember that the information provided on this form will in no way affect your grade and will not be
seen by Dr. Hollingsworth. The purpose of this information is to help understand what processes you
use, not to evaluate you.
Date
Effort (hours)
[ex] 8/18/03
[ex] 8/18/03
0.5
1
Thinking/ Serial Parallelizing Testing
Planning Coding
the Code
Code
X
X
22
Tuning
Parallel Code
Other
Appendix B – Effort Collection Forms
Name:
Login ID:
CMSC 714
Effort Report Form – Assignment 2
Each time you work on the homework assignment, please have this form with you and record the time
spent (round to nearest 15 minutes) and the activity that you were doing. Place a check or an X in the
appropriate column to describe your activites. For example, if you spent 30 minutes thinking about the
solution and then 1 hour coding, you would make two entries. The first would be .5 hours of thinking. The
second would be 1 hour of coding.
Remember that the information provided on this form will in no way affect your grade and will not be seen
by Dr. Hollingsworth. The purpose of this information is to help understand what processes people use, not
evaluate them.
Date
Effort (hours)
[ex] 8/18/03
[ex] 8/18/03
0.5
1
Reading
Serial Code
Thinking/
Planning
X
X
23
Parallelizing Testing
the Code
Code
Tuning
Parallel Code
Other
Appendix C – Post study questionnaire
Appendix C – Post study questionnaire
CMSC 714
Post Study Questionnaire
Name: ___________________________________
LoginID: ____________________________
Please note that your answers on this questionnaire will not affect your grade in any way. These questions will help
us correctly interpret and make the most effective use of the data from this study.
1. Assignment 1 (MPI)
1.1
What was the most difficult aspect of MPI to understand from the class discussions?
1.2
What was the most difficult aspect of using MPI on the assignment?
1.3
Which type (based on the compiler menu) of debugging was the most difficult with MPI?
1.4
What would have made this assignment easier?
2. Assignment 2 (OpenMP)
2.1
What was the most difficult aspect of OpenMP to understand during the class discussion?
2.2
What was the most difficult aspect of using OpenMP on the assignment?
2.3
Which type (based on the compiler menu) of debugging was the most difficult with OpenMP?
2.4
What would have made this assignment easier?
3. Comparing MPI to OpenMP
3.1
Which programming model was easier to use overall? Why?
3.2
Which programming model was easier to use when parallelizing the code?
3.3
Which programming model was easier to use for tuning the code to increase performance?
3.4
Compare C and FORTRAN as languages for developing parallel programs. Which is better and why?
4. General Questions
4.1
Was the effort form easy to understand and fill out? If not, please let us know what problems you found,
and how the form could be improved.
4.2
Did categories on the effort form accurately capture the different stages of your development process? If
not, what categories should be added, removed or changed?
4.3
Did it require too much effort for you to complete the forms?
4.4
What could have been done to improve the forms (both the effort form and the background form)?
4.5
Did the choices for recompilation accurately capture the reasons why you were compiling? If not, what
options should be added, removed or changed?
4.6
Did you mind being asked by the compiler why you were recompiling?
4.7
Did the question by the compiler interfere with your normal work habits? If so, how?
4.8
Can you suggest a less-intrusive method for collecting this compile time information?
4.9
Did completing the effort form interfere with your normal work habits? (E.g. Did it change the amount of
time you spent on the assignments? Did it change how early you started working? Etc…?)
4.10
Did you think there were any problems with how this experiment was carried out?
24
Appendix D – Problem Descriptions
Appendix D – Problem Descriptions
Assignment 1 – Game of Life
The purpose of this programming assignment is to gain experience in parallel programming and MPI. For
this assignment you are to write a parallel implementation of a program to simulate the game of life.
The game of life simulates simple cellular automata. The game is played on a rectangular board
containing cells. At the start, some of the cells are occupied, the rest are empty. The game consists of
constructing successive generations of the board. The rules for constructing the next generation from the
previous one are:
1. death: cells with 0,1,4,5,6,7, or 8 neighbors die (0,1 of loneliness and 4-8 of over
population)
2. survival: cells with 2 or 3 neighbors survive to the next generation.
3. birth: an unoccupied cell with 3 neighbors becomes occupied in the next generation.
For this project the game board has finite size. The x-axis starts at 0 and ends at X_limit-1 (supplied on
the command line). Likewise, the y-axis start at 0 and ends at Y_limit-1 (supplied on the command line).
INPUT
Your program should read in a file containing the coordinates of the initial cells. Sample files are
located life.data.1 and life.data.2. You can also find many other sample patterns on the web (use
your favorite search engine on "game of life" and/or "Conway").
Your program should take five command line arguments: the name of the data file, the number of
processes to invoke (including the initial one), the number of generations to iterate, X_limit, and
Y_limit.
OUTPUT
Your program should print out one line (containing the x coordinate, a space, and then the y
coordinate) for each occupied cell at the end of the last iteration.
HINTS
The goal is not to write the most efficient implementation of Life, but rather to learn parallel
programming with MPI.
Figure out how you will decompose the problem for parallel execution. Remember that MPI (at
least the mpich implementation) does not have great communication performance and so you will
want to make message passing infrequent. Also, you will need to be concerned about load
balancing.
One you have decided how to decompose the problem, write the sequential version first.
WHAT TO TURN IN
25
Appendix D – Problem Descriptions
You should submit your program and the times to run it on the input file final.data (for 1, 2, 4,
and 8 processes).
You also must submit a short report about the results (1-2 pages) that explains:
o
o
o
what decomposition was used
how was load balancing done
what are the performance results, and are they what you expected
Using MPICH
To compile MPI, run the program usr/local/stow/mpich/bin/mpicc as your C compiler
To run MPI, you need to set a few environment variables:
setenv MPI_ROOT /usr/local/stow/mpich
setenv MPI_LIB $MPI_ROOT/lib
setenv MPI_INC $MPI_ROOT/include
setenv MPI_BIN $MPI_ROOT/bin
# add MPICH commands to your path (includes mpirun and mpicc)
set path=($MPI_BIN $path)
# add MPICH man pages to your manpath
if ( $?MANPATH ) then
setenv MANPATH $MPI_ROOT/man:$MANPATH
else
setenv MANPATH $MPI_ROOT/man
endif
COMMAND LINE ARGUMENTS
The command line arguments should be:
life < input file> <# of generations> < x limit> < y limit>
The number of processes is specified as part of the mpirun command.
GRADING
The project will be graded as follows:
Item
Correctly runs on 1 processor
Correctly runs on 8 processors
Performance on 1 processor
Speedup of parallel version
Writeup
Pct
15 %
40%
15%
20%
10%
In addition, extra credit of 5% is available if you complete and turn-in the log for the study.
26
Appendix D – Problem Descriptions
ADDITIONAL RESOURCES
For additional MPI information, see http://www.mpi-forum.org/ (MPI API) and http://wwwunix.mcs.anl.gov/mpi (for MPICH)
For more information about using the Maryland cluster PBS scheduler, see
http://umiacs.umd.edu/labs/LPDC/plc/user-manual.html .
This page needs to be updated (path names are not correct for the current Linux environment), which
should happen soon.
Assignment 2 – Swim Benchmark
The purpose of this programming assignment is to gain experience in writing openMP programs. You
will start with a working serial program (swim.f) and add openMP directives to create a parallel program.
HINTS
The goal is be systematic in figuring out how to parallelize this program. You should start by
using the gprof command to figure out what parts of the program take the most time. From there
you should exam the loops in the most important subroutines and figure out how to add openMP
directives.
The programs will be run on a Sparc SMP (called tau.umiacs.umd.edu). Your account names will
be the same as on the Linux cluster.
WHAT TO TURN IN
You should submit your program and the times to run it on the input file swim.in (for 1, 4, 8 and
16 processors).
You also must submit a short report about the results (1-2 pages) that explains:
o
o
what directives were used
what are the performance results, and are they what you expected
Using openMP
To compile openMP you use the Fortran90 (/opt/SUNWhpc/bin/mpf90 ) compiler and supply
the additional command line argument -xopenmp=parallel.
The environment variable OMP_NUM_THREADS controls the number of processors that will
run the program. Set this value in the shell window you are about to run the program from.
RUNNING THE PROGRAM
Swim reads the input file swim.in from standard input that describes various aspects of how the
program should run.
GRADING
27
Appendix D – Problem Descriptions
The project will be graded as follows:
Item
Correctly runs on 1 processor
Correctly runs on 8 processors
Performance on 1 processor
Speedup of parallel version
Writeup
Pct
15 %
40%
15%
20%
10%
In addition, extra credit of 5% is available if you complete and turn-in the log for the study.
28
Appendix E – Raw Data
Appendix E – Raw Data
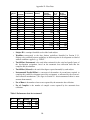
Table1: Subject background and experience data (related to treatment 1)
Exp.
with
Class Exp.
Exp. With
Subject Current
Software Dev. Experience Parallel in
With MPI Game of
ID
Major
Undergrad Major Experience
in C Dev
Prog.
OS?
Life
0
02
CS
CS
3
1
2
0
1
0
03
CS
CS
3
2
0
1
0
0
04
CS
CS
3
1
1
1
0
0
05
CS
Business/Appl.Sci.
5
2
1
1
1
0
07
CS
EE
5
1
0
1
0
0
08
CS
CS
3
1
0
0
0
0
09
CS
MATH
5
2
0
0
0
1
10
CS
4
2
0
0
0
0
11
CS
Aero&Astro
5
2
1
0
0
0
12
CS
3
0
0
1
0
0
13
EE
E&COMM.
4
2
0
1
0
1
14
EE
EE
2
1
1
1
1
0
15
CS
CS
3
1
0
1
0
0
16
ECE
EE
3
1
1
1
0
0
18
CS
Physics
5
1
0
0
0
o Subject ID is a unique identified used to label each subject.
o Current major is the subject’s major program at the time of the study; CS = Computer
Science, EE = Electrical Engineering, ECE = Electrical and Computer Engineering.
o Undergrad major is the subject’s undergraduate degree program.
o Software Dev Experience describes the subject’s level of experience with software
development, rated on a 5-point scale: 1 = never developed; 2 = developed on own; 3 =
developed as part of a team on a course project; 4 = developed once in industry; 5 =
developed multiple industry projects.
o Experience in C Dev describes whether or not the subject has experience programming
in C in industry.
o Exp with Parallel Prog indicates whether the subject has any previous experience with
parallel programming.
o Class in OS? Indicates whether the subject has had a class in operating systems.
o Exp with MPI indicates whether the subject has any previous experience with the MPI
HPC approach used in treatment 1.
o Exp with Game of Life indicates whether the subject has any previous experience with
the “Game of Life” programming assignment given in treatment 1.
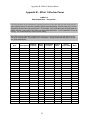
Table2: Workflow data for treatment 1
29
Appendix E – Raw Data
Subject
ID
02
03
04
05
07
08
09
10
11
12
13
14
15
16
18
Workflow
WF3/4
WF2
WF1/2
WF2
WF1/2
WF1
WF2
WF4
WF2
WF3
WF1/2
WF2
WF1
WF1
WF1/3
Total Effort Total Effort
(Instrument) (Manual)
11.96
2.32
11.78
13.44
25.68
9.09
7.90
1.09
8.14
16.47
19.16
4.63
18.47
21.91
39.47
Instrumented
Parallel
No. of
No. of
Effort(Hrs)
Runs
Compiles
59
8.33
8
157
24
2.13
26
84
25
9.92
136
132
12.5
13.16
317
20
7
20.36
266
292
11.5
3.84
138
73
11
5.95
129
32
N/A
1.09
21
5
17.75
7.28
74
38
28
0.84
11
234
10.5
15.63
294
122
21
4.28
104
12
9
17.63
227
138
17
17.63
357
203
43
20.67
90
727
o Subject ID is a unique identified used to label each subject.
o Workflow corresponds to the four distinct workflows identified in Section 5.2.1.
Subjects who switched between workflows at different points in development are labeled
with all workflows applied, e.g. “WF1/2.”
o Total Effort (Instrument) is the total effort estimated for the serial and parallel parts of
the development assignment, based on the automatic data collection built into the
compiler and job submitter.
o Total Effort (Manual) is the total effort figure reported manually by each subject.
o Instrumented Parallel Effort is a measure of the number of person-hours required to
complete the parallel development part of the assignment, as measured by the automatic
data collection mechanisms. (We argue in Section 5.1 that instrumented effort is more
accurate than manual.)
o No. of Runs is the number of run events captured by the automatic data collection.
o No. of Compiles is the number of compile events captured by the automatic data
collection.
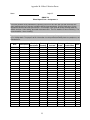
Table3: Performance data for treatment 1
Subject Serial
2 Proc.
8 Proc.
ID
Time
Speedup Speedup
02
0.00
0.00
0.00
03
173.20
1.99
6.04
04
40.76
1.00
0.00
30
Appendix E – Raw Data
05
07
08
09
10
11
12
13
14
15
16
18
114.90
62.80
94.89
77.29
15.46
17.50
185.70
59.66
59.66
120.24
80.16
175.42
2.10
1.79
3.23
1.47
2.27
1.67
1.95
1.82
2.03
1.84
2.00
1.26
5.49
4.71
5.48
1.90
8.87
1.86
4.30
4.02
7.55
4.64
7.08
3.31
o Subject ID is a unique identified used to label each subject.
o Serial time is a measure of the time required for the serial program to produce a solution
(in seconds)
o 2 Proc Speedup is the degree of speedup achieved on 2 parallel processors
o 8 Proc Speedup is the degree of speedup achieved on 8 parallel processors
31