1
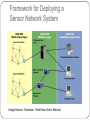
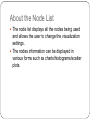
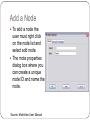
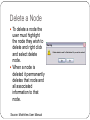
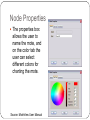
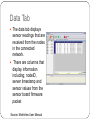
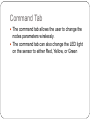
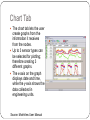
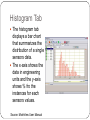
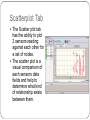
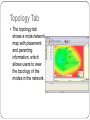
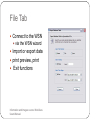
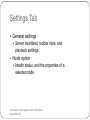
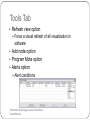
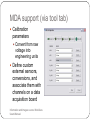
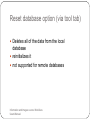
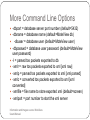
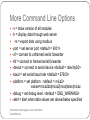
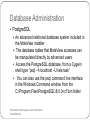
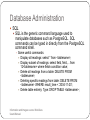
MoteView User‟s Manual Presented by Bretny Khamphavong, Nancy White, Chloe Norris, Catherine Greene Introduction to Crossbow: MoteView User‟s Manual Presented by Bretny Khamphavong, Wireless Mesh Networking Overview Generic name for a class of networked embedded systems that share several characteristics: Multi-Hop Self-Configuring Self-Healing Dynamic Routing Sensor networks become long-lived, easily deployed, and resilient to the unpredictable wireless channel Wireless Network Deployment Composed of three distinct software tiers: Client Tier Visualization software and graphical interface for managing the network Server Tier Handles translation and buffering of data from the wireless network Provides bridge between the wireless motes and internet clients Mote Tier Runs on the cloud of sensor nodes forming a mesh network Applications and Software of Components Client Tier = MoteView Free client from Crossbow Server Tier = XServe and XOtap Run on a PC or Stargate Mote Tier = XMesh Required to form a reliable communication base MoteView Overview Mote Layer Programmed with XMesh and TinyOS Server Layer Provides data logging and database services Client Layer Provides visualization, monitoring, and analysis tools to display and interpret sensor data Framework for Deploying a Sensor Network System Image Source: Crossbow: MoteView User‟s Manual Node List By Nancy White About the Node List The node list displays all the nodes being used and allows the user to change the visualization settings. The nodes information can be displayed in various forms such as charts/histograms/scatter plots. Add a Node To add a node the user must right click on the node list and select add node. The mote properties dialog box where you can create a unique node ID and name the node. Source: MoteView User Manual Delete a Node To delete a node the user must highlight the node they wish to delete and right click and select delete node. When a node is deleted it permanently deletes that node and all associated information to that node. Source: MoteView User Manual Node Properties The properties box allows the user to name the mote, and on the color tab the user can select different colors for charting the mote. Source: MoteView User Manual Visualization There are 7 different tabs for visualization including; data, command, charts, health, histogram, scatter plots, and topology which provide different ways to view the data. Data Tab The data tab displays sensor readings that are received from the nodes in the connected network. There are columns that display information including; nodeID, server timestamp and sensor values from the sensor board firmware packet Source: MoteView User Manual Command Tab The command tab allows the user to change the nodes parameters wirelessly. The command tab can also change the LED light on the sensor to either Red, Yellow, or Green Chart Tab The chart tab lets the user create graphs from the information it receives from the nodes. Up to 3 sensor types can be selected for plotting; therefore creating 3 different graphs. The x-axis on the graph displays date and time, while the y-axis shows the data collected in engineering units. Source: MoteView User Manual Health The XMesh application generate health packets on regular intervals, health packet encapsulate the state of the wireless mesh over time. The health tab displays the latest health packet reading that has been received from each node Histogram Tab The histogram tab displays a bar chart that summarizes the distribution of a single sensors data. The x-axis shows the data in engineering units and the y-axis shows % fro the instances for each sensors values. Source: MoteView User Manual Scatterplot Tab The Scatter plot tab has the ability to plot 2 sensors reading against each other for a set of nodes. The scatter plot is a visual comparison of each sensors data fields and help to determine what kind of relationship exists between them. Topology Tab The topology tab shows a mote network map with placement and parenting information, which allows users to view the topology of the modes in the network. MoteView Section 6 Chloe Norris Section 6 •Details, functions, and how to use the toolbars and menus •toolbar provides buttons for: • Connect to WSN wizard, • Program Mote • Alerts Manager • MDA configuration • Export to Spreadsheet • Print, Print Preview • Refresh View • MoteView Help • Stop XServe, Start XServe • Checkbox for displaying Live (vs. historical) sensor network data Information and Images source: MoteView Users Manual File Tab Connect to the WSN via the WSN wizard Import or export data print preview, print Exit functions Information and Images source: MoteView Users Manual Settings Tab General settings Server heartbeat, toolbar style, and playback settings Node option Health status, and the properties of a selected node Information and Images source: MoteView Users Manual Tools Tab Refresh view option Force a visual refresh of all visualization in software Add node option Program Mote option Alerts option Alert conditions Information and Images source: MoteView Users Manual MDA support (via tool tab) Calibration parameters Convert from raw voltage into engineering units Define custom external sensors, conversions, and associate them with channels on a data acquisition board Information and Images source: MoteView Users Manual Reset database option (via tool tab) Deletes all of the data from the local database reinitializes it not supported for remote databases Information and Images source: MoteView Users Manual Units Tab User can select preferred engineering units for a given class of sensor Sensors will convert to the units specified by the user Information and Images source: MoteView Users Manual Help Tab Users Manual Support option About option displays a splash screen containing MoteView version information Information and Images source: MoteView Users Manual Messages, Administration, Packets By Catherine Greene Server Messages Server Messages pane is the bottom of the MoteView window displays server side messages, error messages, and general status messages as MoteView is running Error & Status Messages The Error Messages tab displays exceptions/errors reported by MoteView software The Status bar at the bottom displays chart query status, current database and gateway settings in a plain view Left hand side: it displays the Charts query (Loading… or Done) Center: it displays the Database and table name Right hand side: it displays the gateway type and port settings Information and Images source: MoteView Users Manual Server Administration XServe is a powerful packet parsing and data logging server preinstalled by MoteView. A user may run XServe from a Cygwin shell included with the MoteWorks CD Using the command line interface for XServe you must have the Cygwin shell installed on your PC. Instructions for installing Cygwin from MoteWorks InstallShield Wizard are detailed in the MoteWorks Getting Started Guide Information and Images source: MoteView Users Manual Command Line Options -? = display help [help] -r = raw display of tos packets [raw] -a = ascii display of tos packets [ascii] -p = parsed display of tos packets [parsed] -c = converted display of tos packets [conveted] -xr = raw tos packets xported to file [export raw] -xp = parsed tos packets exported to file [export parsed] -xc = converted tos packets exported to file [export converted] -db = parsed tos packets exported to db [database parsed] -dbserver = database server name (default=localhost) Information and Images source: MoteView Users Manual More Command Line Options -dbport = database server port number (default=5432) -dbname = database name (default=MoteView db) -dbuser = database user (default=MoteView user) -dbpasswd = database user password (default=MoteView user password) -l = parsed tos packets exported to db -xmlr = raw tos packets exported to xml [xml raw] -xmlp = parsed tos packets exported to xml [xml parsed] -xmlc = converted tos packets exported to xml [xml converted] -xmlfile = file name to store exported xml (default=screen) -xmlport = port number to start the xml server Information and Images source: MoteView Users Manual More Command Line Options -v = show version of all modules -h = display data through web server -m = export data using modbus -port = set server port <default = 9001> -sf = connect to unframed serial forwarder -fsf = connect to framed serial forwarder -device = connect to serial device <default = /dev/ttyS0> -baud = set serial baud rate <default = 57600> -platform = set platform. <default = mica2> values=mica2dot|mica2|mica|telos|micaz -debug = set debug level. <default = DBG_WARNING> -alert = alert when data values are above/below specified Information and Images source: MoteView Users Manual Database Administration PostgreSQL An advanced relational database system included in the MoteView installer The database tables that MoteView accesses can be manipulated directly by advanced users Access the PostgreSQL database, from a Cygwin shell type “psql –h localhost –U tele task” You can also use the psql command line interface in the Windows Command window from the C:\Program Files\PostgreSQL\8.0.0-rc1\bin folder Information and Images source: MoteView Users Manual Database Administration SQL SQL is the generic command language used to manipulate databases such as PostgreSQL. SQL commands can be typed in directly from the PostgreSQL command shell. Some useful commands: Display all readings: select * from <tablename>; Display subset of readings: select field, field,... from 12<tablename> where fieldn condition value; Delete all readings from a table: DELETE FROM <tablename>; Deleting specific readings from table: DELETE FROM <tablename> WHERE result_time < „2004-11-20‟; Delete table entirely: Type: DROP TABLE <tablename>; Information and Images source: MoteView Users Manual Health Packets Pre-compiled XMesh applications included with MoteView generate health packets at regular intervals encapsulate the state of the wireless mesh over time The Health tab displays the latest health packet readings received for each node in the network Each Mote also transmits a neighbor health packet. The latter is logged to the postgreSQL database but is not currently displayed by MoteView. Information and Images source: MoteView Users Manual