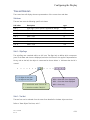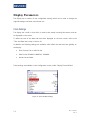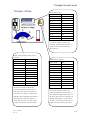
1
Clearview Display Reference Manual Document no: 177/5250x Rev. A Sevcon Limited (Head Office) Kingsway South Gateshead NE11 0QA England T: +44 (0)191 497 9000 F: +44 (0)191 482 4223 E: [email protected] Sevcon USA, Inc. 155 Northboro Road Southborough MA 01772 USA T: 508 281 5510 F: 508 281 5520 E: [email protected] Sevcon SAS Parc d'Activité du Vert Galant 95041 CERGY-PONTOISE CEDEX France T: +33 (0)1 34 30 35 00 F: +33 (0)1 34 21 77 02 E: [email protected] Sevcon Japan KK Kansai Office 51-26, Ohyabu, Hikone Shiga, Japan 522-0053 T: +81 7 4946 5766 E: [email protected] Sevcon Asia Limited Room 504 Wellbeing Plaza 75-1 Wondang-dong Seo-gulncheon City 404-320 Korea T: +82 32 215 5070 F: +82 32 215 8027 E: [email protected] www.sevcon.com Table of Contents Chapter 1: Introduction 1-1 About Clearview Display documentation.............................................. 1-2 This version of the manual .............................................................................................................. 1-2 Copyright ........................................................................................................................................ 1-2 Scope of this manual ....................................................................................................................... 1-2 Related documents .......................................................................................................................... 1-2 Drawings and units ......................................................................................................................... 1-2 Warnings, cautions and notes.......................................................................................................... 1-3 Product identification label .................................................................... 1-4 Technical support ................................................................................... 1-4 Product warranty .................................................................................... 1-4 Chapter 2: About the Display 2-1 Introduction ............................................................................................ 2-2 Standard features and capabilities ......................................................... 2-3 Mechanical package ........................................................................................................................ 2-3 Available accessories ...................................................................................................................... 2-3 Safety and protective functions ............................................................. 2-4 General ............................................................................................................................................ 2-4 Chapter 3: Connection 3-1 Connecting the Display .......................................................................... 3-2 Connector ........................................................................................................................................ 3-2 CAN bus termination ...................................................................................................................... 3-2 Signal connections ................................................................................. 3-2 Chapter 4: Specification 4-1 Electrical ................................................................................................ 4-2 Input voltage ................................................................................................................................... 4-2 Output protection ............................................................................................................................ 4-2 CAN interface ................................................................................................................................. 4-2 Control inputs ................................................................................................................................. 4-2 Isolation .......................................................................................................................................... 4-2 EMC ................................................................................................................................................ 4-2 Regulatory compliance ................................................................................................................... 4-3 Mechanical ............................................................................................. 4-4 Operating environment ................................................................................................................... 4-4 Weight............................................................................................................................................. 4-4 Dimensions ..................................................................................................................................... 4-4 Chapter 5: Display Usage 5-1 Principle of operation............................................................................. 5-2 Functional description ..................................................................................................................... 5-2 Button Interface .............................................................................................................................. 5-2 Power On ........................................................................................................................................ 5-2 Splash Screen .................................................................................................................................. 5-3 Acquisition of Displayed Data ........................................................................................................ 5-3 Menu and screen changing .............................................................................................................. 5-4 Main Screen .................................................................................................................................... 5-5 System Overview ............................................................................................................................ 5-5 Vehicle Status ................................................................................................................................. 5-7 Time to Distance ............................................................................................................................. 5-8 Personalities and Configuration ...................................................................................................... 5-9 Test ............................................................................................................................................... 5-11 Fault History ................................................................................................................................. 5-12 Debug ............................................................................................................................................ 5-13 Software Update............................................................................................................................ 5-14 Chapter 6: Configuring the Display 6-1 Display CAN bus Node ID. ................................................................... 6-2 Node ID when Connected to a System ........................................................................................... 6-2 Node ID when Standalone .............................................................................................................. 6-2 ii Doc. 177/5250x Rev A Configuring the Available Screens ........................................................ 6-3 Screen List ...................................................................................................................................... 6-3 First Screen ..................................................................................................................................... 6-4 Configuring the Main Screen................................................................. 6-5 The Screen ...................................................................................................................................... 6-5 Screen Item Object Dictionary Locations ....................................................................................... 6-6 The Arc Graph .............................................................................................................................. 6-10 The Bar Graph .............................................................................................................................. 6-14 Data Object Text item ................................................................................................................... 6-16 Bitmap item................................................................................................................................... 6-18 Time and Date item ....................................................................................................................... 6-21 Chapter 7: Local Display Settings 7-1 Display Parameters ................................................................................ 7-2 Clock Settings ................................................................................................................................. 7-2 Metric or Imperial Units ................................................................................................................. 7-3 Distance Units ................................................................................................................................. 7-3 Time to Distance Parameters .......................................................................................................... 7-3 Fault log .......................................................................................................................................... 7-4 Chapter 8: Local CANbus Settings 8-1 CANbus Parameters ............................................................................... 8-2 Manual / Auto Baud rate ................................................................................................................. 8-2 System Information ......................................................................................................................... 8-2 Chapter 9: Example Screen Layout 9-1 Example Layout ..................................................................................... 9-2 The layout – bitmaps ....................................................................................................................... 9-3 The layout – Arc Graph and Bar Graph .......................................................................................... 9-4 The layout – Text items .................................................................................................................. 9-5 The layout – Date and Time ............................................................................................................ 9-6 Doc. 177/5250x Rev. A iii Chapter 1: Introduction About Clearview Display documentation This version of the manual This version of the Clearview Display manual replaces all previous versions. Sevcon has made every effort to ensure this document is complete and accurate at the time of printing. In accordance with our policy of continuing product improvement, all data in this document is subject to change or correction without prior notice. Copyright This manual is copyrighted 2011 by Tech/Ops Sevcon. All rights are reserved. This manual may not be copied in whole or in part, nor transferred to any other media or language, without the express written permission of Tech/Ops Sevcon. Scope of this manual This manual provides information on how to use the Clearview Display, and on which Sevcon products the display is compatible with. Details of controller parameters which can be adjusted with the display are not included in this manual. Related documents The following documents are available from Sevcon: Gen4 Applications Reference Manual. The Object Dictionary providing important information about CANopen communication with the display. Device Configuration Files (DCF) and Electronic Data Sheets (EDS) for the display. Drawings and units Orthographic illustrations in this manual are drawn in Third Angle Projection. SI units are used throughout this manual. 1-2 Doc. 177/5250x Rev A Introduction Warnings, cautions and notes Special attention must be paid to the information presented in Warnings, Cautions and Notes when they appear in this manual. Examples of the style and purpose of each are shown below: A WARNING is an instruction that draws attention to the risk of injury or death and tells you how to avoid the problem. A CAUTION is an instruction that draws attention to the risk of damage to the product, process or surroundings. A NOTE indicates important information that helps you make better use of your Sevcon product. Doc. 177/5250x Rev. A 1-3 Product identification label If you have a customized product your unique identifier will appear at the end of the Type number. When discussing technical issues with Sevcon always have your product’s Type number, Part number and Serial number available Error! Reference source not found. shows a typical product identification label. Technical support For technical queries and application engineering support on this or any other Sevcon product please contact your nearest Sevcon sales office listed on the inside front cover of this manual. Alternatively you can submit enquiries and find the details of the nearest support centre through the Sevcon website, www.sevcon.com. Product warranty Please refer to the terms and conditions of sale or contract under which the Display was purchased for full details of the applicable warranty. 1-4 Doc. 177/5250x Rev A Chapter 2: About the Display Introduction The Display is a configurable CANopen display which can be set up to show a variety of data from the Sevcon motor controllers it is connected to. It can also be used to configure parameters on the controllers. It has the following features: 2-2 320x240, 256 colour display. Auto-baud rate detection. Configurable main screen. Configurable screen list. Single and multi-node support. Reads/writes a wide range of commonly used vehicle system settings. Displays I/O + motor/vehicle status information Displays any active faults and provides basic diagnostic information. Displays a historical fault log for any fault on the motor controller system. Fully flash programmable for display software updates. Doc. 177/5250x Rev A About the Display Standard features and capabilities Mechanical package UP Button SELEC T Button DOWN Button Figure 1 Mechanical package Available accessories The following accessories are available from Sevcon: External harness to connect to system Drive Wizard – PC based configuration tool Doc. 177/5250x Rev. A 2-3 Safety and protective functions General Do not adjust the value of any parameter unless you fully understand the effect of this change. You should have read and understood the User Manual for all the connected devices before connecting the display to them. Do not attempt to open the display as there are no serviceable components. Opening the display will invalidate the warranty. Electric vehicles are subject to national and international standards of construction and operation which must be observed. 2-4 Doc. 177/5250x Rev A Chapter 3: Connection Connecting the Display Connector The display is supplied as standard with an 8 way Molex connector. CAN bus termination The display is designed to be permanently connected to a single or multi node CAN bus. To assist with wiring on the vehicle the display includes a CAN termination resistor which can be used as required to achieve the correct bus termination. If the display fails to detect a standalone device then you should check that the CAN bus has correct termination Signal connections Pin Name Type What to connect Maximu m rating 1 +24V power Power Not connected 35V 2 Gnd Power +24Volt supply return -35V 3 CAN High Comms CAN High 35V 4 CAN Low Comms CAN Low 35V 5 CAN High Comms CAN High 35V 6 CAN Low Comms CAN Low 35V 7 CAN Term Comms Link to pin 6 to enable 120 termination 8 N/C Not connected Table 1 Connector pin out and wiring information Pins are protected against short-circuits to the battery positive or negative voltages. CAN High and CAN Low connections are duplicated to enable daisy chaining of CAN nodes. 3-2 Doc. 177/5250x Rev A Chapter 4: Specification Electrical Input voltage Working voltage limits: 15V to 28.8V Input protection: Input protected against reverse connection of supply Maximum current draw 100mA Output protection Short-circuit: Protected against short circuit to supply CAN interface CAN protocol: CANopen profiles DS301 Physical layer uses ISO11898-2. Baud rates supported: 1Mbits/s, 500 kbits/s, 250 kbits/s, 125 kbits/s, 100 kbits/s, 50 kbits/s Control inputs User interface 3 button keypad input Isolation Any terminal to the case: TBD (Gen4:Withstands 2 kV d.c. Meets EN1175-1:1998 and ISO3691 Complies with IEC-60664 EMC Radiated emissions: EN12895 (Industrial Trucks – Electromagnetic Compatibility) EN 55022:1998, 6, class B EN 12895:2000, 4.1 Emissions. When part of a system with a motor operating, FCC Part 15, Radiated Emissions. Meets the standards given in FCC Part 15, Section 15.109: Conducted emissions: No mains port, therefore not required Radiated RF field: EN 61000-4-3, 5.1 Test Level: user-defined test level of 12 V/m EN 12895:2000, 4.2 Immunity EN 61000-4-6, Table 1 – Test Levels Electrical fast transient: EN 61000-4-4, Table 1 – Test Levels, Level 2 4-2 Doc. 177/5250x Rev A Specification Electrostatic discharge: Electrical surge: EN 12895:2000, 4.2 Electrostatic Discharge 4 kV contact discharge 8 kV air discharge EN 61000-4-5:1995, Table A.1 – Selection of Test Levels, Class 3 Regulatory compliance Designed to meet: Doc. 177/5250x Rev. A EN1175-1:1998 (which covers EN1726 for the controller) ISO 3691 UL583 ASME/ANSI B56.1:1993 4-3 Mechanical Operating environment Operating temperature: -10°C to +50°C Non-operation temperature: -40°C to +85°C (can be stored for up to 12 months in this ambient range) Humidity: 95%(non-condensing) at 40°C and 3% at 40°C Ingress of dust and water: IP42 Weight Weight 0.3 kg Dimensions . Figure 2 Dimensions 4-4 Doc. 177/5250x Rev A Chapter 5: Display Usage Principle of operation Functional description The Clearview Display can be used to display a variety of information about the current state of the Sevcon motor controllers to which it is connected. The information to be shown can be configured, and the screens which can be selected during normal operation can be configured. Calibration functionality is provided through several screens. This section will give a brief overview of each screen which can be enabled in the display. Button Interface All features on the display are controlled using the three buttons. The function of the buttons is designed to be intuitive to use, and varies slightly depending on the operating mode. Power On The Display is designed to be easily connected to a controller network, and to operate with minimum setup or knowledge of the PDO configuration on the controllers. To achieve this, when the system is powered on, the display performs several detection steps: 1. The display listens to the CAN bus until it successfully receives a message from a node. This listen in process is performed for each baud rate in turn, enabling the display to auto detect the controller baud rate. 2. The display determines which nodes are connected to the CAN bus. This is achieved by reading product codes. For each Sevcon node discovered, the PDO mappings are interrogated, enabling the display to “find” the I/O setup, and to determine which motors are connected. 3. The baud rate and system configuration are stored in memory, to be re-used on subsequent power cycles. This enables the display to start up more quickly on subsequent power cycles. The first time the display is powered on, there is a chance that the baud rate selection will start at an incorrect rate. This can cause controllers to go into a CAN bus OFF state. Once the display has powered up, it will save the baud rate that has been detected. On future 5-2 Doc. 177/5250x Rev A Display Usage power cycles the display will start at the detected baud rate, and the system will start up normally. During the power on process, the splash screen is displayed. Power on progress is displayed on the bottom of this screen. Splash Screen The default splash image is shown below. Figure 3 Splash Screen This product is produced as a generic product. If you require a custom splash image for your application, contact your local Sevcon representative to discuss. Acquisition of Displayed Data The display can acquire the data that it displays either using the CANopen SDO protocol, or using the CANopen PDO protocol. By default, the display will generate SDO upload requests for any data item displayed but if an RPDO has been configured on the display to handle that data item, then no SDO request will be generated, and the display will only show the data that has been received in PDO messages. Please contact Sevcon for assistance with configuring RPDOs on the display. Doc. 177/5250x Rev. A 5-3 Menu and screen changing Figure 4 – The menu When the display has completed its power on initialisation, the first screen is shown. The first screen will be one of the screens shown below, and is configurable. To change between screens, the display has a simple menu. To show the menu, press and hold the enter button for at least 1 second. The menu will then be shown. Use the up and down buttons to select the screen that you would like to see, and press enter. The screen will then change to the selected screen. Only screens which have been enabled will show in the menu. Instructions on how to configure the available screen list are provided in section “Configuring the display” 5-4 Doc. 177/5250x Rev A Display Usage Main Screen Figure 5 – Customizable main screen An example of a main screen layout is shown in Figure 5. This screen can be configured to suit the vehicle or application with which the display is being used. The main screen is always visible in the display menu. Instructions on how to configure the main screen are included in section “Configuring the Display” Resetting Trip Distance As shown above, the vehicle trip distance can be displayed as a main screen item. When the item is on screen, a trip reset feature is enabled. To reset the trip distance, press the up button, which will cause the trip distance to flash. While it is flashing, press the up button again. This will reset the trip on the master controller. System Overview The system overview screen is shown in Figure 6. Doc. 177/5250x Rev. A 5-5 Figure 6 – System Overview This screen displays information about the currently connected nodes, and the state of the nodes. The primary function is to show any active faults that are present. The screen is split into two halves: Top half shows the list of nodes that are currently connected, and if any faults are active on the node. Bottom half shows detailed fault information for the node that is selected with the highlight bar. The up and down buttons move the highlight bar between nodes on the top half of the screen. Where there are multiple faults active for a node, the number of faults is given as a count in the bottom half of the screen. Each of these faults can then be viewed by pressing the enter button to cycle round the faults. The screen is updated in real time. If a fault is set or cleared on the system, the information on the screen will be updated automatically. 5-6 Doc. 177/5250x Rev A Display Usage Vehicle Status The vehicle status screen is shown in Figure 7. Figure 7 – Vehicle Status Screen This screen shows status information related to each of the motors on the vehicle, as well as the overall battery voltage and traction drive mode. The screen shown has 4 motors on the vehicle. Where fewer motors are fitted, only data for the connected motors will be shown. Not all Sevcon controllers can measure battery voltage. If the master controller on the vehicle cannot measure battery voltage then the value displayed will be a constant value read out of that unit, probably nominal voltage. An external system can write battery voltage into the master controller, and this value will then be seen on the display. Doc. 177/5250x Rev. A 5-7 Time to Distance The time to distance screen is shown in Figure 8. Figure 8 – Time to Distance Screen This screen is intended to be used as a performance evaluation screen for the vehicle. It will display the time it takes to move from stationary to each of the distance markers. To use the screen: Real vehicle speed and traction drive state must be transmitted via a PDO from the vehicle master controller to the display. This is required to ensure that the update rate of the speed is sufficient to obtain an accurate timing. Stop the vehicle. Accelerate in either direction. The times will be cleared. As each distance marker is passed, the time will be shown on the screen. Vehicle can be stopped at any time. Times will remain on the screen until the vehicle moves again. The distance markers can be adjusted to suit the vehicle or application using Display – Time to Distance in the Configuration screen. If no times are seen when driving the vehicle, then check that both vehicle speed and traction drive state are unmapped in display RPDOs correctly. Also ensure that the vehicle speed has been correctly setup with numerator and denominator scale factors. 5-8 Doc. 177/5250x Rev A Display Usage Personalities and Configuration The personalities and configuration screens allow local display parameters, motor parameters, and drivability parameters to be adjusted. Figure 9 – Configuration Screen Figure 10 – Personalities Screen Items that are visible on these screens are dependent on the following: Items will only be shown if there is an associated motor controller, motor, or drivability profile enabled. Items that are not present on a setup will be removed from the tree view. Items will only be shown if the access level of the display has been set at a level that exceeds the required login level for that parameter. The required levels are detailed in the controller object dictionary. If the display is at a lower level then items are hidden. These screens are simple tree view layouts. To navigate, use the up and down buttons to change the highlighted item. Tree nodes can be expanded (when the + symbol is present) or collapsed (when the – symbol is present) by pressing the enter button. When the lowest level nodes are visible, values are displayed for the parameters. The screen in Figure 11 shows a tree node opened into edit mode. Doc. 177/5250x Rev. A 5-9 Figure 11 – Tree item in edit mode For a highlighted item, pressing the enter key will enter or exit edit mode. When in edit mode the value is highlighted, and can be altered using the up and down buttons. To send the new value to the controller, press the enter button, which will exit edit mode and send the value to the correct controller. 5-10 Doc. 177/5250x Rev A Display Usage Test The test screen is shown in Error! Reference source not found.. This screen is a tree format, similar to the configuration and personality screens, but the contents are read only. Figure 12 Test Screen During the power on process, the configuration of the I/O on the vehicle is determined. This means that only switch inputs configured in the PDO mappings of the vehicle will be displayed. The LED indicator shows whether the switch is active or inactive. This screen is intended to be used as a debug / diagnostic tool to help find a problem with the vehicle wiring. The state of each switch item is the raw unprocessed value read by the controller. Analogue values are also shown, along with status data on the motors that are connected. Navigation is the same as for other trees. Use the up and down buttons to change the highlighted item. Tree nodes can be expanded or collapsed by pressing the enter button. Doc. 177/5250x Rev. A 5-11 Fault History The fault history screen is shown in Figure 13. Figure 13 Fault History Screen The fault history screen shows a chronological list of faults that have occurred on the vehicle. These are displayed with the most recent fault at the top of the list. The information shown is: ID – the Node ID which sent out the fault message. Code – the fault code. Description – A short description of the fault. Count – the number of times the fault has occurred since the fault history was last cleared. When on the fault history screen, a short press on the enter button will cause the fault history help screen to be shown. This screen is shown in Figure 14. This screen will show the detailed fault help text for each fault in the log. To navigate, press the up / down buttons to scroll through the fault history, and fault help will be displayed for each fault in turn. To exit the fault history help, either press the enter button to return to the fault history screen, or long press the enter button to show the menu, and navigate away from the fault screen. The fault history help screen is not accessible if the fault history is empty. 5-12 Doc. 177/5250x Rev A Display Usage The fault history can be cleared in the configuration screen. Figure 14 Fault History Help Debug The debug screen is not accessed through the menu. It is always present regardless of configuration, and enables a simple way to change the access level of the display. To access the debug menu: Bring up the menu with a long enter button press. Press and hold the down button, AND while holding the down button, press the up button. Release the buttons. This screen is intended to enable trained service personnel to increase the access level of the unit in order to carry out parameter modification, or advanced debug using the display. Doc. 177/5250x Rev. A 5-13 Figure 15 Debug Screen Software Update It is possible to update the firmware of the display, using Sevcon’s DriveWizard or DVT configuration tool. Please contact Sevcon for assistance with this process. 5-14 Doc. 177/5250x Rev A Chapter 6: Configuring the Display Display CAN bus Node ID. Node ID when Connected to a System The display is designed to be connected to a variety of different vehicle combinations, and does not have a fixed node id. The node id is set to be 10 greater than the highest node id that was discovered. For example, if connected to a 3 node system that has 3 motor controllers as nodes 1, 2 and 3, the display will have node id 13. Node ID when Standalone If the display is powered up standalone, the node id will default to 35. 6-2 Doc. 177/5250x Rev A Configuring the Display Configuring the Available Screens Screen List The display has a set of screens, as detailed in the previous section. Most of these screens can be enabled or disabled for a particular vehicle or application. The individual screens are enabled through a display object dictionary item as shown below: Object Index 0x2805 Description Value Sub 0 Number of sub indexes 11 Sub 1 System overview 1 = enable, 0 = disable Sub 2 Vehicle status 1 = enable, 0 = disable Sub 3 Personalities 1 = enable, 0 = disable Sub 4 Configuration 1 = enable, 0 = disable Sub 5 Test 1 = enable, 0 = disable Sub 6 Fault History 1 = enable, 0 = disable Sub 7 Unused Sub 8 Unused Sub 9 Unused Sub 10 Backdoor* 1 = enable, 0 = disable Sub 11 Time to Distance 1 = enable, 0 = disable *The Backdoor screen is an advanced debug screen intended for Sevcon use only. This should not normally be enabled. The new selections will take effect on the next power cycle. Doc. 177/5250x Rev. A 6-3 First Screen The first screen after power on can be selected. Once the Splash screen / power on process is complete, the display will go to the chosen screen as the first screen to show. This is configured using an object dictionary item as shown below: Object Index 0x2807 Description Sub 0 First screen Value 0 = Main 1 = System Overview 2 = Vehicle Status 3 = Time to Distance 4 = Personalities 5 = Configuration 6 = Test 7 = Fault History The first screen can also be selected through the Configuration screen, by using the Display Initial Screen parameter. The values to select are as above. The setting will take effect after the next power cycle. 6-4 Doc. 177/5250x Rev A Configuring the Display Configuring the Main Screen. The Screen The screen on the display is 320 x 240 pixels. The co-ordinate system used to specify the location of an item on the screen is shown in the diagram below. The coordinates are (x,y) where ‘x’ is the horizontal offset from the left, and ‘y’ is the vertical offset from the top. (0,0) (319,0) Increasing ‘x’ Increasing ‘y’ (0,239) Doc. 177/5250x Rev. A 6-5 Screen Item Object Dictionary Locations There are 10 OD entries which are for configuration of the items that can be displayed on the screen. These are at location 0x2900 to 0x2909. Each object fully defines one screen item. Each item has a set of sub-index items which are used to control the appearance of the item. The exact functionality varies depending on the type of item selected. The template object is shown below: Object Index 0x2900 Description Value Sub 0 Number of sub index’s 11 Sub 1 Item type Sub 2 X position Sub 3 Y position Sub 4 Associated Data Object Sub 5 Style Flags Sub 6 Data 1 – Item specific Sub 7 Data 2 – Item specific Sub 8 Data 3 – Item specific Sub 9 Data 4 – Item specific Sub 10 Data 5 – Item specific Sub 11 Data 6 – Item specific to 0x2909 6-6 Doc. 177/5250x Rev A Configuring the Display Sub 1 – Item Type The item type is selected according to the table below: Data Description Example Image 0 No Item This entry is not used 1 Ellipse graph. (Arc shaped analogue graph) 2 Bar graph. (Rectangular analogue graph) 3 Text Object (contents of a Data Object) 4 Bitmap (bitmap selected from pre-compiled list) 5 Date and time Sub 2&3 – (x,y) position These items set the position of the top left of the item. Each item is drawn on screen by setting a draw rectangle. This rectangle is a bounding rectangle sized to fully enclose the item that is being drawn. The co-ordinates specify the position of the top left of this bounding rectangle. Sub 4 – Associated Data Object Each item can have a data object associated with it. The data object defines the source of the data, the scaling of the data, and the units. Where applicable they will be shown on screen. The data objects that are available are as follows: Sub 4 Description Value Master OD Units Scaling index Local OD index (for PDO use) 0 No Data N/A N/A N/A N/A 1 Vehicle Speed (1 DP) 0x2721,0 Selectable x16 0x2721, 0 2 Vehicle Speed (0 DP) 0x2721,0 Selectable x16 0x2721, 0 3 Forward Switch 0x2121,0 N/A N/A 0x2121, 0 4 Reverse Switch 0x2122,0 N/A N/A 0x2122, 0 Doc. 177/5250x Rev. A 6-7 5 Park Brake 0x2125,0 N/A N/A 0x2125, 0 6 BDI Charge 0x2790,1 “%” x1 0x2790, 1 7 Left Motor RPM 0x606C,0 “RPM” x1 SDO only 8 Right Motor RPM 0x606C,0 “RPM” x1 SDO only 9 Steer Angle 0x2624,0 “˚” X364 0x2623, 0 10 Battery Voltage 0x5100,1 “V” x16 SDO only 11 Battery Current 0x5100,2 “A” x16 SDO only 12 Throttle 0x2620,0 “%” x3276.7 0x2620, 0 13 Left DC Motor 0x7878,0 “A” x1 SDO only 0x7878,0 “A” x1 SDO only Current 14 Right DC Motor Current 15 Left Motor Torque 0x4602,12 “Nm” x64 SDO only 16 Right Motor Torque 0x4602,12 “Nm” x64 SDO only 17 Driveability Selected 0x2720,1 N/A x1 SDO only 18 Pump Throttle 0x2640,0 “%” 19 Pump RPM 0x606C,0 “RPM” x1 SDO only 20 Left AC Motor 0x4600,12 “A” x1 0x2642,0 0x4600,12 “A” x1 0x2643,0 0x2640,0 Current 21 Right AC Motor Current 22 Highest priority fault N/A N/A N/A N/A 23 Odometer (base 0x29A0,1 km x256 SDO only value) 24 Odometer (0.1km) 0x29A0,2 km x10 SDO only 25 Odometer (0.1miles) 0x29A0,3 miles x10 SDO only 26 Trip (base value) 0x29A1,1 km x256 SDO only 27 Trip (0.1km) 0x29A1,2 km x10 SDO only 28 Trip (0.1miles) 0x29A1,3 miles x10 SDO only 29 Vehicle Key Hours 0x2781,1 “hr” x1 SDO only 30 Vehicle Traction 0x2782, 2 “hr” x1 SDO only Hours 31 Left Motor Temp 0x4600,3 “C” x1 SDO only 32 Right Motor Temp 0x4600,3 “C” x1 SDO only 33 Left AC Motor 0x7078,0 “A” x1 0x2642,0 Current 6-8 Doc. 177/5250x Rev A Configuring the Display 34 Right AC Motor 0x7078,0 “A” X1 0x2643,0 N/A – N/A X1 0x2720,6 N/A X2 0x264F Current 35 Vehicle Drive Mode composite* 36 Vehicle Current N/A – composite* *A composite item includes functionality to decode one or more sources of information into a single item that can be displayed on screen. Vehicle drive mode is composed of forwards and reverse switch data, and vehicle current is a summed total for battery current on all nodes combined. Doc. 177/5250x Rev. A 6-9 The Arc Graph The arc graph is a curved analogue graph. This is intended to show a variety of data including speed and motor RPM. The graph is constructed from the data parameters which can fully control the shape and appearance on screen. First, a brief explanation of angles and ellipses is required. The graph is intended to have tick marks around the outer edge, with values suitable to the selected data object. Ellipse shapes and the bounding rectangle. An ellipse drawn on screen is defined through the size of the bounding rectangle, e.g.: The black ellipse is contained within the blue bounding rectangle. This means that we can define the shape of the graph on screen by changing the size of this rectangle. Using the example above, our x size and y size (in pixels) could be 400 (x width) and 200 (y height). This (x,y) size will define the outer arc shape. The inner arc shape is then defined with a graph thickness. This is the number of pixels between the inner and outer ellipses, e.g.: The graph thickness (space between inner and outer arcs) is applied equally to the x and y sizes to produce 2 arcs, one centred within the other. This leaves a doughnut shaped item. To create the graph, we need to specify the start and end angle of the arc. The reference angles are as shown below: 6-10 Doc. 177/5250x Rev A Configuring the Display To finally create the arc graph shape we define the start angle and end angle. The display will then create a bounding rectangle around the remaining arc, ready to be drawn onto the screen, e.g.: In this picture the blue rectangle contains the arc that will be seen on screen. The start and end angles in this case were (approximately) start at 15, and end at 165. This would leave an on-screen arc looking something like: The x,y screen position of this item would be the top left of this blue rectangle. Sub index items The arc graph uses the following specific sub-items: Sub index Description type Sub 5 Graph flags. Control specific appearance settings. U16 Sub 6 Data 1. Outer ellipse x size U16 Sub 7 Data 2. Outer ellipse y size U16 Sub 8 Data 3. Start angle in degrees. 16 Sub 9 Data 4. End angle in degrees. 16 Doc. 177/5250x Rev. A 6-11 Sub 10 Data 5. Graph thickness. 16 Sub 11 Data 6. Maximum value displayed U32 Sub 5 – Style flags The style flags are contained within an U16 item. The flags help to define the operation of the item. The following attributes can be configured: Direction of the graph fill. Whether the graph will display negative numbers, or absolute values. How the value of the data object is shown on the graph. Standard filled bar graph, or position marker. Represented as binary, msb at the left, the object is constructed as shown below. ‘u’ indicates that the bit is unused. u u u u u u u u m m m m d d a a 0000 = filled graph 0001 = 1 pixel wide marker 001x = 3 pixel wide marker 00 = signed value graph 010x = 5 pixel wide marker 01 = absolute value graph 011x = 7 pixel wide marker 00 = clockwise fill 100x = 9 pixel wide marker 01 = anticlockwise fill Sub 6 & 7 – (x,y) Size These items define the x and y size of the outer ellipse shape used to create the arc. Sub 8 & 9 – Start and End Angles These items define the start and end points of the graph, in degrees. These will define the arc shape that will be shown on screen, and the range over which the graph will be filled. Sub 10 – Graph thickness This defines the thickness of the graph, i.e. the space between the outer and inner ellipse shapes. This is in pixels. 6-12 Doc. 177/5250x Rev A Configuring the Display Sub 11 – Maximum range This defines the maximum range of the graph. The operation of this depends on the signed / absolute setting: If graph setting absolute: o If maximum range is less than the maximum for the referenced data object, then the maximum on screen range will be according to this item. o If maximum range is greater than the maximum for the referenced data object, then the maximum on screen range will be according to the referenced data object. If graph setting signed: o The maximum (min or max) value from the referenced DO is calculated. o Maximum range is then applied as before, except both the –ve and +ve values will be clamped to the maximum range item if required. Doc. 177/5250x Rev. A 6-13 The Bar Graph The bar graph is a rectangular analogue graph. This is intended to show a variety of data including speed and motor RPM. The graph is constructed from the data parameters which can fully control the shape and appearance on screen. The graph is intended to have tick marks, with values suitable to the selected data object. Sub index items The bar graph uses the following specific sub-items: Sub index Description type Sub 5 Graph flags. Control specific appearance settings. U16 Sub 6 Data 1. Width of frame. U16 Sub 7 Data 2. Height of frame. U16 Sub 8 Data 3. Low alarm value below which the graph will U16 display red Sub 9 Data 4. High alarm value above which the graph U16 will display red Sub 10 Data 5. Not currently used U16 Sub 11 Data 6. Maximum value displayed U32 Sub 5 – Style flags The style flags are contained within an u16 item. The flags help to define the operation of the item. The following attributes can be configured: Direction of the graph fill. Tick marks on / off. How the value of the data object is shown on the graph. Standard filled bar graph, or position marker. Represented as binary, msb at the left, the object is constructed as shown below. ‘u’ indicates that the bit is unused. 6-14 Doc. 177/5250x Rev A Configuring the Display u u u u u u u u u u a a 00 = signed values 01 = absolute values t t d d 00 = no tick marks 00 = fill upwards 01 = tick marks left or top 01 = fill downwards 10 = fill to the right Sub 6 & 7 – (x,y) Size These items defines the x and y size of the outer rectangle shape used to create the frame. Sub 8 – Low Alarm This item sets an alarm value, below which the colour of the bar graph fill will change to red. Sub 9 – High Alarm This item sets an alarm value, above which the colour of the bar graph fill will change to red. Sub 11 – Maximum range This defines the maximum range of the graph. The operation of this depends on the signed / absolute setting: If graph setting absolute: o If maximum range is less than the maximum for the referenced data object, then the maximum on screen range will be according to this item. o If maximum range is greater than the maximum for the referenced data object, then the maximum on screen range will be according to this referenced data object. If graph setting signed: o The maximum (min or max) value from the referenced DO is calculated. o Maximum range is then applied as before, except both the –ve and +ve values will be clamped to the maximum range item if required. Doc. 177/5250x Rev. A 6-15 Data Object Text item The text item will display the text representation of the contents of a data object. This is intended to display a typical ‘name’ ‘value’ ‘units’ text string on screen. Sub Index items The text item uses the following specific sub-items: Sub index Description type Sub 5 Style flags. Control specific appearance settings. U16 Sub 6 Data 1. Text font. U16 Sub 7 Data 2. N/A U16 Sub 8 Data 3. N/A U16 Sub 9 Data 4. N/A U16 Sub 10 Data 5. N/A U16 Sub 11 Data 6. N/A U32 Sub 5 – Style flags The style flags are contained within an u16 item. The flags help to define the operation of the item. The component parts of a data object can be individually be enabled for display. Represented as binary, msb at the left, the object is constructed as shown below. ‘u’ indicates that the bit is unused. u u u u u u u u u u u u u n y v 0 = name hidden 1 = name displayed 0 = value hidden 1 = value displayed 0 = units hidden 1 = units displayed The text string is always in the order “[name] [value] [units]” 6-16 Doc. 177/5250x Rev A Configuring the Display Sub 6 – Text font The text font can be selected from the following options (not all text characters are available in all fonts): Sub 6 value Font 2 Arial 8pt 3 Arial 8pt bold 4 Arial 10pt 5 Arial 10pt bold 6 Arial 11pt 7 Arial 11pt bold 10 Arial 72pt 16 DS Digital 48pt 20 DS Digital 12pt 21 Comic Sans MS 10pt 22 Comic Sans MS 11pt Doc. 177/5250x Rev. A 6-17 Bitmap item This item will display bitmaps that are pre-compiled into the code. It is not possible to upload bitmaps to the display. The bitmap can be controlled with an associated DO, so that up to 3 bitmaps can be selected in the screen item, with the bitmap displayed dependent on the value in the data object. Sub Index items The bitmap uses the following specific sub-items: Sub index Description type Sub 5 Style flags. U16 Sub 6 Data 1. Bitmap reference 1. U16 Sub 7 Data 2. Data value for bitmap 1. U16 Sub 8 Data 3. Bitmap reference 2. U16 Sub 9 Data 4. Data value for bitmap 2. U16 Sub 10 Data 5. Bitmap reference 3 U16 Sub 11 Data 6. Data value for bitmap 3. U32 Sub 5 – Style Flags The style flags are contained within an u16 item. The flags define how many bitmaps are included, and when each bitmap should be displayed. Represented as binary, msb at the left, the object is constructed as shown below. a a a a b b b b c c c c n n d d Show bitmap 3 when: 0000 = data value equals reference 0001 = data value greater than reference 0010 = data value less than reference Show bitmap 2 when: 0000 = data value equals reference 0001 = data value greater than reference 0010 = data value less than reference Show bitmap 1 when: 0000 = data value equals reference 00 = invalid 01 = 1 bitmap to display 10 = 2 bitmaps to display 00 = fixed bitmap 01 = data dependent bitmap 0001 = data value greater than reference 0010 = data value less than reference 6-18 Doc. 177/5250x Rev A Configuring the Display Sub 6, 8, 10 – Bitmaps These 3 sub index values define which bitmap should be shown for: Sub 6 = Bitmap 1. Sub 8 = Bitmap 2. Sub 10 = Bitmap 3. The supported bitmaps are: Bitmap number Description Image 0 None No Bitmap 1 Sevcon Small Logo 2 Down Arrow (chevron) 3 Up Arrow (chevron) 4 Park Brake 5 Active Fault 6 Letter F 7 Letter R 8 Letter N 9 ‘D’ highlighted in DNR set 10 ‘N’ highlighted in DNR set 11 ‘R’ highlighted in DNR set 12 ‘F’ highlighted in FNR set Doc. 177/5250x Rev. A 6-19 13 ‘N’ highlighted in FNR set 14 ‘R’ highlighted in FNR set 15 Warning level fault icon 16 Inhibit level fault icon 17 Severe level fault icon If you require different bitmapsfor your application then contact your local Sevcon representative. Sub 7, 9, and 11 – Reference value When displaying multiple bitmaps, reference values are used in conjunction with the bitmap display logic. (see Sub 5 – style flags) The reference values are: Sub 7 = reference value for bitmap 1. Sub 9 = reference value for bitmap 2. Sub 11 = reference value for bitmap 3. 6-20 Doc. 177/5250x Rev A Configuring the Display Time and Date item The screen item will display the text representation of the current time and date. Sub items The text item uses the following specific sub-items: Sub index Description type Sub 5 Style flags. Control specific appearance settings. U16 Sub 6 Data 1. Text font. U16 Sub 7 Data 2. N/A U16 Sub 8 Data 3. N/A 16 Sub 9 Data 4. N/A 16 Sub 10 Data 5. N/A 16 Sub 11 Data 6. N/A U32 Sub 5 – Style flags The style flags are contained within an u16 item. The flags help to define which component parts of the data and time are displayed, and also the format to be applied. Represented as binary, msb at the left, the object is constructed as shown below. ‘u’ indicates that the bit is unused. u u u u u u u y n u u 0 = 2 digits for the year 1 = 4 digits for the year 0 = month with word “24 June 11” u u z z z z 0000 = date then time displayed 0001 = time then date displayed 0010 = time only 1 = month as number “24/6/11” Sub 6 – Text font The text font can be selected from the same fonts detailed in the data object text item. Refer to “Data Object Text Item, sub 6”. Doc. 177/5250x Rev. A 6-21 Chapter 7: Local Display Settings Display Parameters The display has a number of user configurable settings which can be used to change the regional settings, time, date, units format, etc. Clock Settings The display has a built in clock which is used to time stamp incoming fault events, and can be displayed on the screen. To affect the look of the date and time when displayed on the main screen, refer to the “Time and Date item” setup in Section 16. In addition the following settings are available, which affect the date and time globally on the display: Clock Format; 12hr or 24hr format. Date Format; DDMMYY, MMDDYY, YYMMDD. Actual time and date. These settings are available on the Configuration screen, under “Display-Time and Date” Figure 16 Time and Date Settings 7-2 Doc. 177/5250x Rev A Local Display Settings Metric or Imperial Units The display can automatically rescale some items on the screen to reflect metric or imperial units. This is selected using the “Units Format” item, located on the Configuration Screen under “Display” This will change between the following units: Speed in km/h or mph. Temperature in °C or °F In some cases, a change to the units format will not happen until the display is next powered on. Distance Units The distance units can be selected as a special case. These will affect the units and scaling that are used when showing distance items on the screen. The following units can be selected: Feet. Miles. Metres (m). Kilometres (km). Time to Distance Parameters The time to distance screen has configurable distance markers and configurable units. This enables alternative units to be displayed on this screen. For example, the main unit of distance could be km, but would be better as m on this screen. The units can be selected (miles, m, feet, km) using the Display – Time to Distance – T to D Dist Units item of the Configuration screen. The distance markers can be individually selected. The next time the Time to Distance screen is shown the new distances will be used for the markers. These are located in the “Display – Time to Distance” section of the Configuration screen. Doc. 177/5250x Rev. A 7-3 Fault log The fault log can be cleared at any time by using the “Display – Fault Log – Reset Fault Log” parameter in the Configuration screen. 7-4 Doc. 177/5250x Rev A Chapter 8: Local CANbus Settings CANbus Parameters The display will automatically set up the required CANbus parameters to enable data gathering from the controllers. These can also be adjusted manually, which can correct connection issues and improve start-up speed. Manual / Auto Baud rate The display will automatically detect the baud rate used on the system by listening into the CAN bus traffic, and waiting to receive a valid message. On some vehicle setups this can cause issues related to power on sequencing, and CAN off problems if there is a conflict, or more than 1 device attempting to auto discover baud rate. To address this, the auto detect feature can be disabled with the “CANbus-Manual/Auto Baud” parameter in the Configuration screen. Once the display is connected to the vehicle, and working correctly, this parameter can simply be set to “manual”. On future power cycles the display will skip the baud rate detection process and use the CAN baud rate shown in the “System Baud Rate” parameter. This will prevent CAN issues related to incorrect baud rates on the CAN bus. Configuring the display to manual baud rate setting will speed up the display power on process. System Information The first time the display is powered on, and detects some connected Sevcon nodes it will interrogate the nodes to determine the system configuration. This “system info” is then stored in the display so that on subsequent power cycles it can start up more quickly. If the display is moved to a new vehicle or system, then the stored information will probably not match the actual vehicle setup. 8-2 Doc. 177/5250x Rev A Local CAN Bus Settings The stored information can be cleared using the “CANbus-Clear System Info” parameter. Setting this item to ‘yes’ will cause the stored information to be erased. On the next power cycle the information will be re-acquired and stored. The System configuration is determined from the VPDO and PDO settings that have been configured on the controllers on the vehicle. If these have not been configured correctly then the display may be able to locate all motors and I/O on the system. If after clearing the system info on the display, and cycling power some items are missing, check the PDO configuration of the system. Doc. 177/5250x Rev. A 8-3 Chapter 9: Example Screen Layout Example Layout The Screen layout described in this section is intended to demonstrate the setup of each screen item that can be used on the main screen. This is the same layout as provided in the generic supplied display. 9-2 Doc. 177/5250x Rev A Example Screen Layout The layout – bitmaps Bitmap Sevcon Logo. Object 0x2906 Value Sub 1 4 Sub 2 100 Sub 3 10 Sub 4 N/A Sub 5 0x0004 Sub 6 1 Sub 7 N/A Sub 8 N/A Sub 9 N/A Sub 10 N/A Sub 11 N/A Sub 1 (4) for a btimap, located at (x,y) location of (sub2,sub3). Sub 5 (0x04) so 1 bitmap, not data dependent. Bitmap 1 is the Sevcon logo. Bitmap showing forward, neutral, reverse drive state. Object 0x2903 Value Bitmap showing fault state Sub 1 4 Object 0x2904 Value Sub 2 10 Sub 1 4 Sub 3 10 Sub 2 265 Sub 4 0x0023 Sub 3 20 Sub 5 0x000d Sub 4 0x0016 Sub 6 9 Sub 5 0x100d Sub 7 1 Sub 6 15 Sub 8 10 Sub 7 1 Sub 9 0 Sub 8 16 Sub 10 11 Sub 9 2 Sub 11 2 Sub 10 17 Sub 11 2 Sub 1 (4) for a btimap, located at (x,y) location of (sub2,sub3). Associated DO of 0x23, which is the composite vehicle drive mode item. Sub 5 (0x0d) so 3 bitmaps, data dependent, and all displayed when reference values equal the actual value. Bitmap 1 is shown when the value is 1, bitmap 2 when the value is 0, bitmap 3 when the value is 2. Doc. 177/5250x Rev. A Sub 1 (4) for a btimap, located at (x,y) location of (sub2,sub3). Associated DO of 0x16, which is the highest fault level set on the vehicle. Sub 5 (0x1d) so 3 bitmaps, and data dependent. Bitmap 1 is shown when the value is 1, bitmap 2 when the value is 2, bitmap 3 when the value is greater than 2. 9-3 The layout – Arc Graph and Bar Graph Arc graph showing vehicle speed Object 0x2900 Value Sub 1 1 Sub 2 10 Sub 3 105 Sub 4 2 Sub 5 0x0001 Sub 6 180 Sub 7 150 Sub 8 10 Sub 9 170 Sub 10 40 Sub 11 640 Sub 1 (1) for an arc graph, located at (x,y) location of (10,105). Associated DO of 2, Bar graph showing battery state. which is the vehicle speed. Object 0x2901 Value Sub 1 2 Sub 2 250 Sub 3 120 Sub 4 6 Sub 5 0x0000 Sub 6 40 Sub 7 100 Sub 8 20 Sub 9 99 Sub 10 0 Sub 11 65535 Sub 5 (0x01) graph is clockwise filled showing signed values if object is signed. Arc comprised of ellipse which is overall size 180 pixels by 150 pixels. Thickness of the graph is 40 pixels. Start angle is 10 degrees, end angle 170 degrees. Maximum value of 640, which considering the scale factor 0f x16 is 40kmh. Display has been set to imperial units, so speed is then shown as mph, and scaled accordingly. Sub 1 (2) for a bar graph, located at (x,y) location of (250,120). Associated DO of 6, which is the BDI charge remaining. Sub 5 (0x00) graph is filled upwards, with no tick marks. Graph is a rectangle, overall size 40 pixels by 100 pixels. Graph shows red, as min alarm limit is set to 20%, and BDI level is just below this. 9-4 Doc. 177/5250x Rev A Example Screen Layout The layout – Text items Text showing trip distance Object 0x2908 Value Sub 1 3 Sub 2 50 Sub 3 220 Sub 4 26 Sub 5 0x0007 Sub 6 7 Sub 7 N/A Sub 8 N/A Sub 9 N/A Sub 10 N/A Sub 11 N/A Sub 1 (3) for a text item, located at (x,y) Text showing vehicle current location of (100,60). Associated DO of 36, Object 0x2902 Value which is the composite item for vehicle Sub 1 3 current. Sub 2 100 Sub 3 60 units are shown. Sub 4 36 Font, indicated in sub 6, is Arial 11pt bold. Sub 5 0x0007 Sub 6 7 Sub 7 N/A Sub 8 N/A Sub 9 N/A Sub 10 N/A Sub 11 N/A Sub 5 (0x07) means that name value and Sub 1 (3) for a text item, located at (x,y) location of (100,60). Associated DO of 36, which is the composite item for vehicle current. Sub 5 (0x07) means that name value and units are shown. Font, indicated in sub 6, is Arial 11pt bold. Doc. 177/5250x Rev. A 9-5 The layout – Date and Time Date and Time item Object 0x2907 Value Sub 1 5 Sub 2 100 Sub 3 85 Sub 4 N/A Sub 5 0x0000 Sub 6 7 Sub 7 N/A Sub 8 N/A Sub 9 N/A Sub 10 N/A Sub 11 N/A Sub 1 (5) for a time and date item, located at (x,y) location of (100,85). Sub 5 (0x00) means that the item is displayed date then time, 2 digits for the year, and the month in words. The 12 hr format is set in the configuration screen. 9-6 Doc. 177/5250x Rev A