1
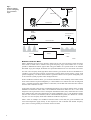
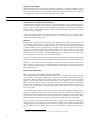
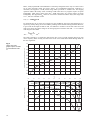
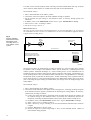
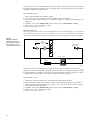
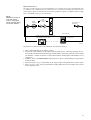
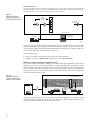
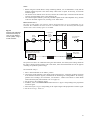
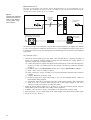
Fig. 1
Relation between
speech intelligibility
and modulation
depth
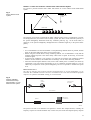
Background
Noise
Reflections
Direct Sound
Mouth
Simulator
Omni-directional
Microphone
Room under test
Intensities
m source (F)
100%
MTF (F)
m receiver (F)
< 100%
020156
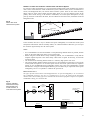
Modulation Reduction Matrix
MTF is determined for each octave frequency band involved. The octave frequency bands used range
from 125 Hz to 8 kHz and are related to the typical frequency range of the human voice. It is also
possible to differentiate between typical male and typical female voice spectra based on the standard
IEC 60268–16 [2]. For example, the female voice spectrum model does not cover the 125 Hz octave band.
For each octave frequency band, high MTF values indicate a good transfer of the level modulations in
a speaker’s voice at the source position, as perceived by a listener at the receiver position – hence, good
speech intelligibility. Low MTF values indicate a significant reduction of the speech intelligibility, due
to the acoustical system properties and/or background noise.
From a modulation reduction matrix, you can obtain information on the reliability of the results and the
cause of the reduction of speech intelligibility. A constant MTF over F indicates the cause as backgound
noise, a constantly decreasing MTF indicates reverberation, and an MTF which first decreases and then
increases with F indicates an echo.
In the matrix, the MTF values for the 14 modulation frequencies are averaged, resulting in the so-called
Modulation Transmission Index (MTI). The modulation transmission indices for the 7 octave band
frequencies can be processed to arrive at the Speech Transmission Index (STI), which takes into account
most conditions that could cause deterioration of speech intelligibility (see [1]. The parameters RASTI
(STI for room acoustics) and STITEL (STI for telecommunication systems) are obtained in a similar
way, but cover less frequency bands and/or different modulation frequencies.
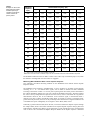
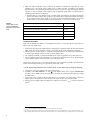
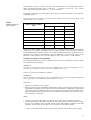
Table 1 shows an example of a modulation reduction matrix. In the table, the given modulation and
octave band frequencies apply directly to STI. Projected as well are RASTI and STITEL frequency
pairs, whose F-values generally lie in between the STI F-values
2